SILVER TECHNICAL POSITION: TRENDING HIGHERIn my previous Silver analysis, I expected price to move lower, with the downtrend line acting as resistance and generating a sell opportunity, which it did.
After that move, price reached the primary uptrend line, found support, and broke the downtrend line with an upside imbalance. It then rete

The best trades require research, then commitment.
Get started for free$0 forever, no credit card needed
Scott "Kidd" PoteetPolaris Dawn astronaut

Where the world does markets
Join 100 million traders and investors taking the future into their own hands.

USAR: When American magnets beat the Chinese monopolyUSA Rare Earth is building a plant in Oklahoma and owns rights to a deposit in Texas so the Pentagon stops buying rare earth magnets from China. The company went public on NASDAQ in 2024, and now everyone who follows the sector understands: rare earths are no longer about science, but about defense

PEPE: ready for a meme run? key levels to watch todayPEPE, ready for another meme run or just more chop? According to the market, memecoins are back in the headlines with fresh capital rotating into high beta plays, and PEPE keeps popping up in volume screens. Today price is parked right inside a big 4H demand band, while funding and sentiment cooled

SEI is in a long term buying zone (3D)From the point where we placed the red arrow on the chart, SEI appears to have entered a bearish pattern and phase, specifically a diametric pattern.
We are now at the end of wave E. This wave is bearish within this pattern, and once it is completed, we expect bullish movements. These bullish moves

Bitcoin is going downHi traders,
Last week Bitcoin made a correction up into the bearish Daily FVG.
From there it rejected to the downside. This could be an ending diagonal forming.
So now we could see more downside to break the previous swing low and finish the (orange) C-wave.
Let's see what the market does and rea

Await confirmationThe price has been moving since February between two weekly SMAs: the 200 SMA (blue line) has been acting as support, while the 10 SMA (grey line) has been pushing the price down every time it touches it for the past four weeks.
At the moment, the price is resting on the medium‑term support indicat

NEW Official TradingView AI Tool Is Now Available (FREE)Exciting! I’ve put together a quick video showing some of how the new TradingView AI tool works.
Yes it is real. No it is not a virus or a scam :)
Yes it is a beta. Yes it is very very cool.
You can read more about it and download it from here: tvremix.xyz
Currently this is a Chrome Extension t

Markets Exit Q1 on a High Note Amid War Jitters. What About Q2?S&P 500 🔻 4.6%, Nasdaq 🔻 7.1%, Dow Jones 🔻 3.6%
It's January. Economic growth is accelerating, the Federal Reserve looks ready to cut rates further, the AI boom still has runway. The mood is genuinely good.
Then, on February 28, the United States and Israel launched strikes on Iran, and the moo

Bitcoin RoadmapToday, I want to share with you a mid-term outlook on Bitcoin ( BINANCE:BTCUSDT ) by analyzing it in a higher time frame—specifically, a 6-hour time frame—which could trigger a bullish move for Bitcoin, so stay with me.
In general, financial market movements over the past month have been heavily i

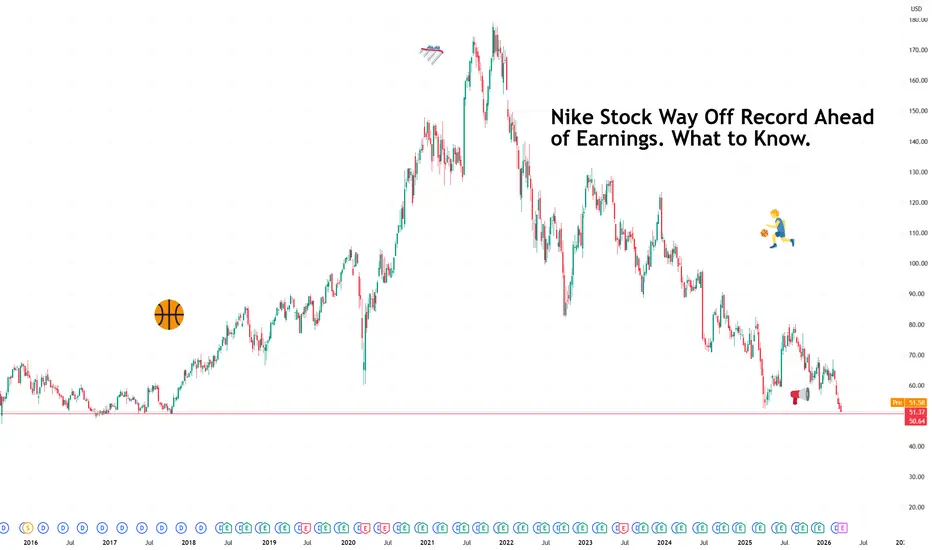
Nike Stock Way Off Record Ahead of Earnings. What to Know.There is a particular kind of corporate humbling that comes not from collapse but from irrelevance creeping in at the edges.
Nike NYSE:NKE is still the world's largest sportswear brand, still moving tens of billions in revenue, still on the feet of more athletes than any other company on earth.
See all editors' picks ideas
Volume Bubbles [QuantAlgo]🟢 Overview
The Volume Bubbles indicator is a multi-layered volume cluster detection system that identifies statistically significant volume events directly on your price chart, classifying them by magnitude (Small, Medium, Big) and direction (Buy, Sell, Mixed). By combining adaptive percentile t
Pine Script® indicator

Monte Carlo CT [SS]This is the Monte Carlo CT indicator.
CT stands for "central tendencies" and is the real distinguishing characteristic of this indicator against other Monte Carlo based indicators.
In statistics, Central Tendency is a single value that attempts to describe a set of data by identifying the central
Pine Script® indicator

HTF Volume Spike & Imbalance Projection [LuxAlgo]The HTF Volume Spike & Imbalance Projection indicator provides a comprehensive multi-timeframe analysis tool that projects higher timeframe (HTF) candle structures, volume spikes, and volume profiles directly onto the current chart. This script aims to bridge the gap between different time horizon
Pine Script® indicator

Swing Structure Forecast [BOSWaves]Swing Structure Forecast - Statistical Swing Projection System with Volatility-Adaptive Support and Resistance Detection
Overview
Swing Structure Forecast is a statistically-driven swing analysis system that maps directional price structure through confirmed pivot identification, where supp
Pine Script® indicator

TASC 2026.04 A Synthetic Oscillator█ Overview
This script implements a Synthetic Oscillator as presented by John F. Ehlers in the April 2026 TASC Traders' Tips article "Avoiding Whipsaw Trades". The indicator aims to provide a smooth, low-lag oscillator for timely trading signals by dynamically mapping a sine wave to price data
Pine Script® indicator

Volume Spread Analysis IQ [TradingIQ]Hello Traders!
🔹Volume Spread Analysis IQ
This indicator was most voted on for our indicator competition - so here it is! Hope you guys like it :D
Volume Spread Analysis IQ is a chart-reading tool built to help traders judge effort, result, and background context in a way that is visual and
Pine Script® indicator

Market Microstructure AnalyticsThe Hidden Toll on Every Trade
Every time you buy or sell a financial instrument, you pay a cost that never appears on your brokerage statement. It is not a commission. It is not a fee. It is the spread between the price at which someone is willing to sell to you and the price at which someone is
Pine Script® indicator

Fair Value Gap Profile + Rolling POC [BigBeluga]🔵 OVERVIEW
FVG Profile builds a price-level profile based on detected Fair Value Gaps (FVGs) over a fixed lookback period.
Instead of measuring traded volume alone, this tool aggregates bullish and bearish FVG occurrences into horizontal bins, allowing traders to see where price inefficienci
Pine Script® indicator

PineScript integration with Notepad++ (UDL)THIS IS NOT AN INDICATOR!
This is PineScript integration with Notepad++ text editor (NPP). It supports PineScript v6 as of January 2026. Provides autocompletion, function list and syntax highlighting for *.pine files.
Why would anyone need this?
Pine Editor doesn't provide function list yet
Pi
Pine Script® indicator

Machine Learning Pivot Points (KNN) [SS]Hey everyone,
Been working on this one for a very long time.
1. What It Is: The Geometric DNA of a Pivot
Machine Learning Pivot Points (KNN) is a predictive structural tool that moves away from traditional lag based oscillators. Instead of waiting for a moving average crossover, this system t
Pine Script® indicator

See all indicators and strategies
Community trends
Netflix held up well during last market downturn, will it again?Bought NASDAQ:NFLX a few days ago. You know I expect the broader market to move (much) lower before eventually going higher, but this setup was too strong to pass on as it had a double trend line break, a strong reversal and was bottoming at a logical support zone.
Netflix also held up very well

Cup and Handle heading into ERCup and Handle forming on NASDAQ:PLTR as it heads into earnings on 5/26. Certainly looks like it can run so long that the broader markets aren't way in the red.
- Cup and Handle forming heading into ER
- Slight hidden bullish divergence on the RSI
- Bolinger bands are squeezing
- Reclaimed the 2

USAR: When American magnets beat the Chinese monopolyUSA Rare Earth is building a plant in Oklahoma and owns rights to a deposit in Texas so the Pentagon stops buying rare earth magnets from China. The company went public on NASDAQ in 2024, and now everyone who follows the sector understands: rare earths are no longer about science, but about defense
Did this Nike chart analysis help you?Did this Nike chart analysis help you?
Was $94. Now $44.
Lesson is that chart analysis can help you avoid massive loses for ANY instrument.

NikeIt's oversold, and before I go into the lengthy technicals I will say this I believe NIke will close gap at at 52 before it breaks below 40.00...
Alright so I started on the monthly time frame and 3 things stood out to me.
1. Outside its monthly Bbands here
In the history of this stock, it h

TESLA: Bulls Will Push
The charts are full of distraction, disturbance and are a graveyard of fear and greed which shall not cloud our judgement on the current state of affairs in the TESLA pair price action which suggests a high likelihood of a coming move up.
Disclosure: I am part of Trade Nation's Influencer program

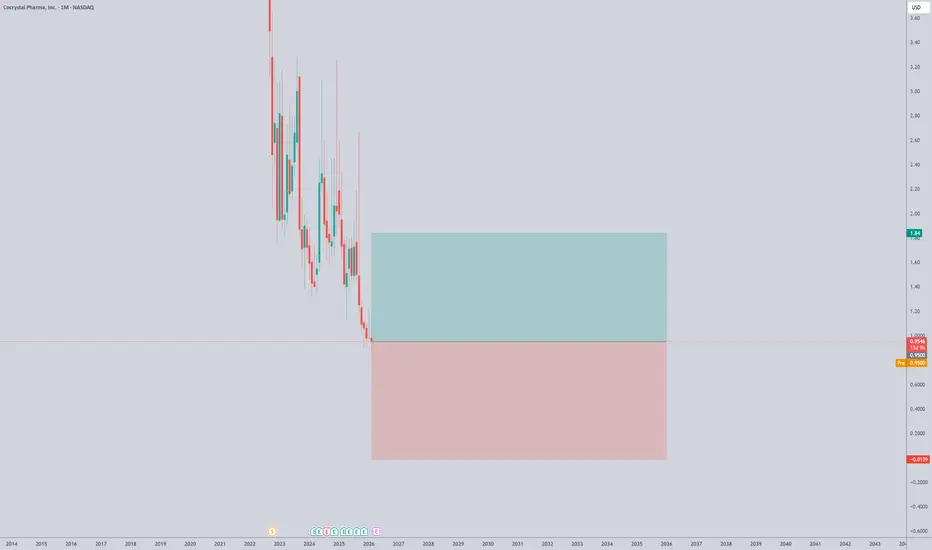
COCPHighly speculative, but posting for follow-up
The company is in the early stages of drug development and has no revenue yet.
APPLE The Target Is DOWN! SELL!
My dear friends,
APPLE looks like it will make a good move, and here are the details:
The market is trading on 255.92 pivot level.
Bias - Bearish
Technical Indicators: Supper Trend generates a clear short signal while Pivot Point HL is currently determining the overal lBearish trend of the mar

Back to 400The thought that it is bullish and completely oversold at this point is a reason to start to execute a plan, with areas of buying resulting in actual value, which sits around 400.

FLNC - Rotation HigherPrice holding key value area (12.5–14) after reclaim. If accepted, look for rotation toward ~23.5
Market context:
Energy storage is in early accumulation, lagging the broader energy move.
Rising power demand (AI + grid) is starting to drive interest in storage names like FLNC.

See all stocks ideas
Tomorrow
LGLLGL Group, Inc. (The)
Actual
—
Estimate
—
Tomorrow
GNLNGreenlane Holdings, Inc.
Actual
—
Estimate
—
Tomorrow
NNOXNANO-X IMAGING LTD
Actual
—
Estimate
−0.19
USD
Tomorrow
RDIReading International Inc
Actual
—
Estimate
−0.20
USD
Tomorrow
JAGXJaguar Health, Inc.
Actual
—
Estimate
−4.26
USD
Tomorrow
TOONKartoon Studios, Inc.
Actual
—
Estimate
—
Tomorrow
RMCORoyalty Management Holding Corporation
Actual
—
Estimate
0.03
USD
Tomorrow
OSTXOS Therapies Incorporated
Actual
—
Estimate
−0.14
USD
See more events
Community trends
Bitcoin Bear Phase Active ABC Rally to $93K Then Drop to $51K+BTC has decisively transitioned into a bearish market structure following a confirmed breakdown of the primary ascending trendline that previously sustained the macro bull rally. The loss of this dynamic support, combined with sustained price acceptance below it, signals a clear shift in order flow

BITCOIN Can this 4H Death Cross drop it to $55550?Bitcoin (BTCUSD) has been trading within a Channel Down since the March 17 local High and only a week ago it formed a 4H Death Cross. The last time this formation emerged was on January 25, during BTC's previous Channel Down that led to a sharp decline, the Bear Cycle's 2nd Bearish Leg.
As a result

BTCUSDTHello Traders! 👋
What are your thoughts on Bitcoin?
As shown on the chart, Bitcoin is currently oscillating within a major Descending Channel. Notably, the price has spent the last two months in a Trading Range reflecting market indecision at these levels.
Key Technical Insights:
Trendline Brea

BTCUSDT: Triangle Pattern on BTC - Watching 68K ResistanceHello everyone, here is my breakdown of the current BTCUSDT setup.
Market Analysis
BTC previously traded inside a downward channel, confirming bearish pressure with consistent lower highs. After a breakout from the channel, price entered a range, showing consolidation and accumulation.Following t

Bitcoin is going downHi traders,
Last week Bitcoin made a correction up into the bearish Daily FVG.
From there it rejected to the downside. This could be an ending diagonal forming.
So now we could see more downside to break the previous swing low and finish the (orange) C-wave.
Let's see what the market does and rea
How To Move The TradingView AI Panel To The Left Or Right. It was annoying me that my panel was opening on the left hand side, but I could see it on the right in some of the demo videos and screenshots.
There wasn't any obvious setting in the plugin, but a quick Google shows that the position of the side panel is actually a Chrome browser setting, not som

BITCOIN - The hunt for liquidity ahead of a drop to 65000BINANCE:BTCUSDT.P is struggling to fulfill its role as a hedge asset. Consolidation continues amid a global bearish trend. The local market is seeking liquidity ahead of a decline.
The global structure is strongly bearish. Consolidation is forming ahead of an anticipated distribution phase. Locall

Bitcoin - 58k soon, then rally 88k! (Best opportunity, must see)Bitcoin has been pretty boring in past weeks, but this should change very soon. I am still expecting a last drop to 58k, but then a huge pump to 88k! Why? First of all, I think Bitcoin has been consolidating in this bearish flag for many weeks, and bearish flags are in general negative patterns for

SIREN Explodes +500% — Can It Hit $1 Next?Today, I want to share an analysis of one of the trending AI projects these days, called Siren ( KUCOIN:SIRENUSDT ), in a 15-minute timeframe
Stay with me.
What is the Siren(SIREN) Project?
Siren is a BNB Chain token powered by SirenAIAgent — an AI trading assistant with two distinct personalit

BTCUSDT Liquidity Building Below 68K - Sell-Side Target 65.6KHello traders! Here’s my technical outlook based on the current BTCUSDT (3H) chart structure. BTC moved from an ascending channel into a range, then shifted bearish under a descending resistance. Price is capped by the 68,000 seller zone and forming lower highs. Currently, price is trading below res

See all crypto ideas
XAUUSDHello Traders! 👋
What are your thoughts on Gold?
Gold continues to trade within a well-defined descending channel, maintaining its broader bearish structure. After bouncing off the channel support, the price initiated a corrective rally toward a Key Resistance zone.
The price has reached the 4800

XAGUSD Bullish Structure Holding Above Trendline
The chart shows **silver (XAGUSD)** maintaining a bullish structure after forming a **Change of Character (CHoCH)**, indicating a shift from bearish to bullish momentum. Price is consolidating above a rising **trendline support**, with higher lows forming, which reflects steady buying pressure.
Th

XAU/USD Outlook: Can Gold Reach 4771 or Drop to 4580?📊 Looking at the chart, gold (XAU/USD) on the 15-minute timeframe shows a recent bullish breakout after a period of consolidation. Price reacted strongly from the 4,647 demand zone, indicating buyer interest and a possible shift in momentum. If buyers maintain control, the market could push higher t

Silver – Key Support & Resistance ZonesBullish recovery from strong support at 69.31. Watch key resistances at 79.93, 89.63, and 95.93 for potential pullbacks or breakout opportunities. Top target near 121.63, with strong support holding potential for a bounce

Gold Price Action Analysis – Key Resistance and Support ZonesThis chart provides a comprehensive analysis of Gold (XAU/USD), focusing on critical support and resistance levels. The Key Resistance at 5,388.821 USD is an important level where price may encounter strong rejection. Minor Resistance at 5,013.195 USD is another key point to watch for a possible pri

SILVER TECHNICAL POSITION: TRENDING HIGHERIn my previous Silver analysis, I expected price to move lower, with the downtrend line acting as resistance and generating a sell opportunity, which it did.
After that move, price reached the primary uptrend line, found support, and broke the downtrend line with an upside imbalance. It then rete
Gold Weekly Levels Fresh Liquidity at 4870/4960 Pullback Warning🔱 GOLD WEEKLY SNAPSHOT — EXECUTIVE SUMMARY
⚖️ Gold closed the week at 4675 USD, maintaining a neutral-to-bullish stance as price reacts from key support
🔄 Expect a two-sided but upward-leaning market, with focus on upside liquidity targets
🔺 Major overhead liquidity & Merged Order Blocks (OBs) at

XAUUSD Recovery Continues - 4,800 Break in SightHello traders! Here’s my technical outlook based on the current XAUUSD (2H) chart structure. Gold moved from a downtrend into consolidation, then found strong support and started forming higher lows along an ascending support line, signaling recovery momentum. Currently, price is holding above the 4

GOLD DAILY CHART MARKET ANALYSISHi everyone,
Please review our latest daily chart idea, featuring our unique Goldturn ascending channel.
We saw price test the channel floor, with a wick filling the gap down to 4128 before moving back inside the channel, with no lock outside the channel confirming the rejection. A confirmed struc

Gold Stalls Below 4800 After 4% Rally — Breakout or DistributionGold has just completed a strong weekly rally, gaining nearly 4% and closing around 4,700, yet price continues to struggle below the key 4,800 resistance zone.
Despite bullish momentum earlier in the week, recent sessions show clear hesitation — suggesting a shift from impulsive buying into a more

See all futures ideas
AUDUSD Potential Downsides!Hey Traders, in today's trading session we are monitoring AUDUSD for a selling opportunity around 0.69600 zone, AUDUSD is trading in a downtrend and currently is in a correction phase in which it is approaching the trend at 0.69600 support and resistance area.
Trade safe, Joe.

EURUSD Long: Recovery Inside Ascending Channel, Eyes On 1.1560 Hello traders! Here’s my technical outlook based on the current EURUSD (3H) chart structure. Price previously moved inside a descending channel, confirming bearish pressure, then broke down and formed a consolidation range.
Currently, price is trading inside the ascending channel, forming higher lo

EURUSD: Updated Support & Resistance Analysis 🇪🇺🇺🇸
Here is my latest structure analysis and important supports
and resistances on EURUSD for next week.
Resistance 1: 1.1613 - 1.1680 area
Resistance 2: 1.1724 - 1.1767 area
Resistance 3: 1.1814 - 1.1850 area
Resistance 4: 1.1913 - 1.1955 area
Resistance 5: 1.2040 - 1.1208 area
Support 1: 1.1441

EUR/USD Bearish Continuation from Supply ZoneThe chart shows **EUR/USD** respecting a clear bearish structure, previously moving inside a descending channel before breaking out with a temporary bullish correction. Price rallied into a key **supply/resistance zone** aligned with the **Ichimoku cloud resistance**, where selling pressure re-enter

Big drop in GBP/JPYPrice is likely to make a deep drop into the marked zones, then start a larger upward move.

EUR/USD Q2 ForcastWith the craziness going on in the middle east and POTUS showing no signs of backing off anytime soon, the risk-off trade filtering into the USD is the most prominent driver in the EUR/USD pair.
With energy being a major concern for the ECB coming into the second quarter, they have been discussing t

GBPUSD 4H ANALYSISTrend is bearish and the structure forming here also indicates the bearish sentiments.
So I am shorting GBPUSD

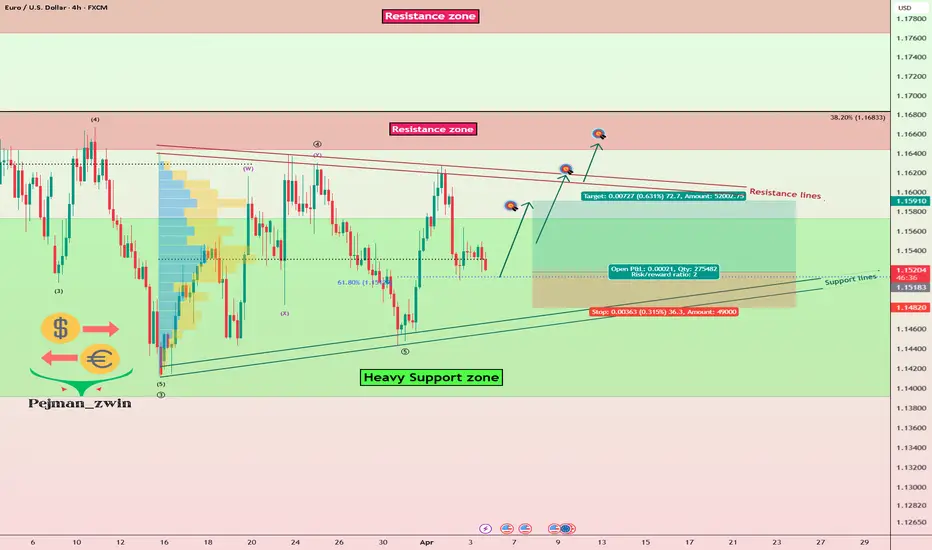
EURUSD Roadmap —Long Opportunity at Support(Risk-to-Reward:2.00)Today I want to share an analysis on EURUSD ( OANDA:EURUSD ) that includes a trade with Risk-to-Reward: 2.00 .
EURUSD is currently moving in a heavy support zone($1.158-$1.139).
It also seems that EURUSD has been moving for the past 20 days between support and resistance lines, which appear to f
USD-JPY Free Signal! Sell!
Hello,Traders!
USDJPY rejects a key supply area after sweeping buy-side liquidity, confirming bearish intent and shift in order flow. Weak consolidation below the zone suggests continuation lower toward resting liquidity.
------------------
Stop Loss: 159.98
Take Profit: 159.05
Entry: 159.60
Time

WEEKLY OUTLOOK FOR THE SECOND WEEK OF APRIL it contains the weekly outlook session for all the trades i will be taking this week

See all forex ideas
Trade directly on Supercharts through our supported, fully-verified, and user-reviewed brokers.