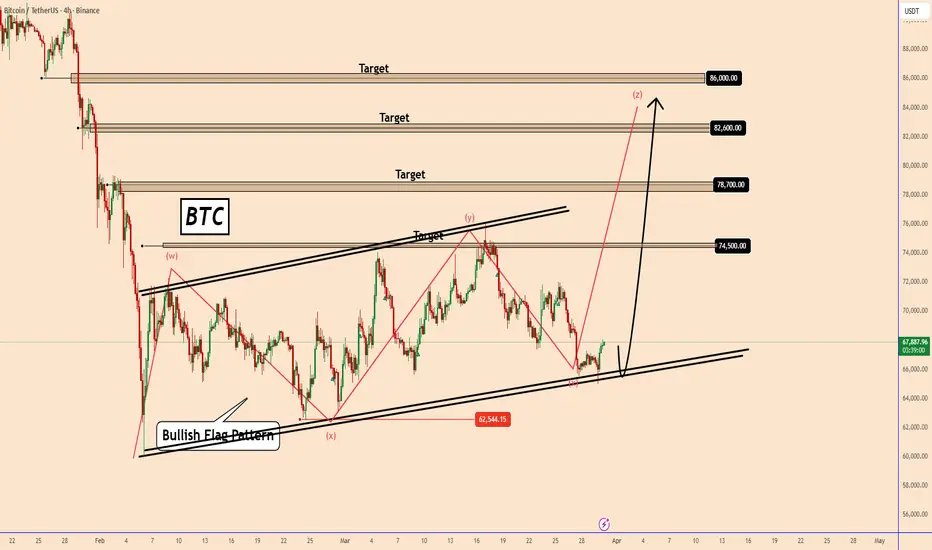
Bitcoin - 58k soon, then rally 88k! (Best opportunity, must see)Bitcoin has been pretty boring in past weeks, but this should change very soon. I am still expecting a last drop to 58k, but then a huge pump to 88k! Why? First of all, I think Bitcoin has been consolidating in this bearish flag for many weeks, and bearish flags are in general negative patterns for
About Bitcoin / TetherUS
Bitcoin, the first and most popular cryptocurrency, is known for its price volatility driven by institutional demand, regulations, and global events, while Tether (USDT) is widely used as a stable trading pair to avoid converting back to fiat. Together, Bitcoin and Tether play a central role in crypto markets, with Tether’s stability supporting Bitcoin trading and influencing investor behavior.
Related pairs

Bitcoin Bear Phase Active ABC Rally to $93K Then Drop to $51K+BTC has decisively transitioned into a bearish market structure following a confirmed breakdown of the primary ascending trendline that previously sustained the macro bull rally. The loss of this dynamic support, combined with sustained price acceptance below it, signals a clear shift in order flow

BTC to $100k. That's exactly why first — $55,000Everyone knows BTC is going to $100k. That's exactly why it goes to $55,000 first
When something is "obvious to everyone" - that's not a buy signal. That's the coordinate where liquidity is parked.
The current market consensus: rotation out of tech giants into real assets, infrastructure, and Bitc

BTC: Another Attempt To Start The Bullish TrendBTC: Another Attempt To Start The Bullish Trend
The current setup we have for BTC is one that I have shared before and it only managed to hit the first target and enter a larger structural area.
Currently BTC is transformed more but looks like we can be in a very large WXYXZ movement. BTC is on t
BTCUSDT Compression Near Support - Breakout Above 68K in FocusHello traders! Here’s my technical outlook based on the current BTCUSDT (2H) chart structure. BTC previously traded inside a broad structure, forming a swing high where price reversed and started building a descending channel with lower highs and lower lows, confirming bearish pressure. Currently, B

Bitcoin RoadmapToday, I want to share with you a mid-term outlook on Bitcoin ( BINANCE:BTCUSDT ) by analyzing it in a higher time frame—specifically, a 6-hour time frame—which could trigger a bullish move for Bitcoin, so stay with me.
In general, financial market movements over the past month have been heavily i

BTCUSDTHello Traders! 👋
What are your thoughts on Bitcoin?
Bitcoin has formed a clear descending channel after consistently printing lower highs and lower lows. However, over the past two months, price has been consolidating within a trading range, moving sideways without a clear directional trend. Curre

Why Bitcoin and Crypto May Surge Amid Geopolitical Tensions!As geopolitical tensions escalate—particularly involving major economies such as the United States, Iran, and Israel—the cryptocurrency market may be poised for a significant upward move. Historical precedent, such as the market response during the Russia-Ukraine conflict, suggests that digital asse

BTCUSDT Short: Weak Demand Signals Liquidity Sweep to 66KHello traders! Here’s my technical outlook based on the current BTCUSDT (4H) chart structure. BTC previously traded inside a range, after formed a rising trend line. The market faced rejection from a pivot high under a descending supply line, BTC broke below the trend line and the 68,400 supply zone

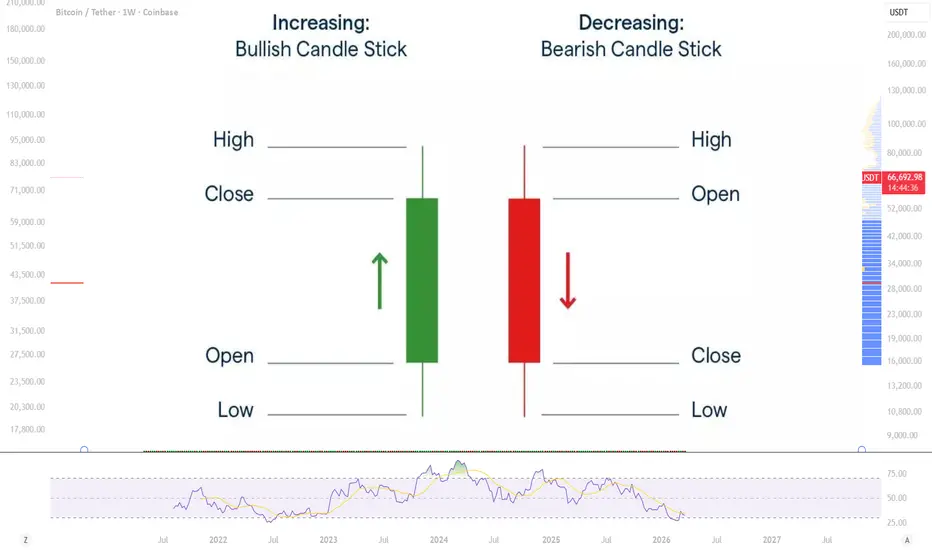
Candlestick Analysis — Complete Guide to Patterns📊 Candlesticks — the most popular way to read price action
The wide part of the candle is called the body.
It shows the price range between the open and close for a given period.
🟥 A red candle forms when the close is below the open
🟩 A green candle forms when the close is above the open
The th
See all ideas
Summarizing what the indicators are suggesting.
Oscillators
Neutral
SellBuy
Strong sellStrong buy
Strong sellSellNeutralBuyStrong buy
Oscillators
Neutral
SellBuy
Strong sellStrong buy
Strong sellSellNeutralBuyStrong buy
Summary
Neutral
SellBuy
Strong sellStrong buy
Strong sellSellNeutralBuyStrong buy
Summary
Neutral
SellBuy
Strong sellStrong buy
Strong sellSellNeutralBuyStrong buy
Summary
Neutral
SellBuy
Strong sellStrong buy
Strong sellSellNeutralBuyStrong buy
Moving Averages
Neutral
SellBuy
Strong sellStrong buy
Strong sellSellNeutralBuyStrong buy
Moving Averages
Neutral
SellBuy
Strong sellStrong buy
Strong sellSellNeutralBuyStrong buy
Displays a symbol's price movements over previous years to identify recurring trends.
Frequently asked questions
The current price of Bitcoin / TetherUS (BTC) is 67,993.51 USDT — it has risen 0.48% in the past 24 hours. Try placing this info into the context by checking out what coins are also gaining and losing at the moment and seeing BTC price chart.
Bitcoin / TetherUS price has risen by 1.31% over the last week, its month performance shows a −7.41% decrease, and as for the last year, Bitcoin / TetherUS has decreased by −18.95%. See more dynamics on BTC price chart.
Keep track of coins' changes with our Crypto Coins Heatmap.
Keep track of coins' changes with our Crypto Coins Heatmap.
Bitcoin / TetherUS (BTC) reached its highest price on Oct 6, 2025 — it amounted to 126,199.63 USDT. Find more insights on the BTC price chart.
See the list of crypto gainers and choose what best fits your strategy.
See the list of crypto gainers and choose what best fits your strategy.
Bitcoin / TetherUS (BTC) reached the lowest price of 3,156.26 USDT on Dec 15, 2018. View more Bitcoin / TetherUS dynamics on the price chart.
See the list of crypto losers to find unexpected opportunities.
See the list of crypto losers to find unexpected opportunities.
The safest choice when buying BTC is to go to a well-known crypto exchange. Some of the popular names are Binance, Coinbase, Kraken. But you'll have to find a reliable broker and create an account first. You can trade BTC right from TradingView charts — just choose a broker and connect to your account.
Crypto markets are famous for their volatility, so one should study all the available stats before adding crypto assets to their portfolio. Very often it's technical analysis that comes in handy. We prepared technical ratings for Bitcoin / TetherUS (BTC): today its technical analysis shows the sell signal, and according to the 1 week rating BTC shows the sell signal. And you'd better dig deeper and study 1 month rating too — it's neutral. Find inspiration in Bitcoin / TetherUS trading ideas and keep track of what's moving crypto markets with our crypto news feed.
Bitcoin / TetherUS (BTC) is just as reliable as any other crypto asset — this corner of the world market is highly volatile. Today, for instance, Bitcoin / TetherUS is estimated as 2.07% volatile. The only thing it means is that you must prepare and examine all available information before making a decision. And if you're not sure about Bitcoin / TetherUS, you can find more inspiration in our curated watchlists.
You can discuss Bitcoin / TetherUS (BTC) with other users in our public chats, Minds or in the comments to Ideas.