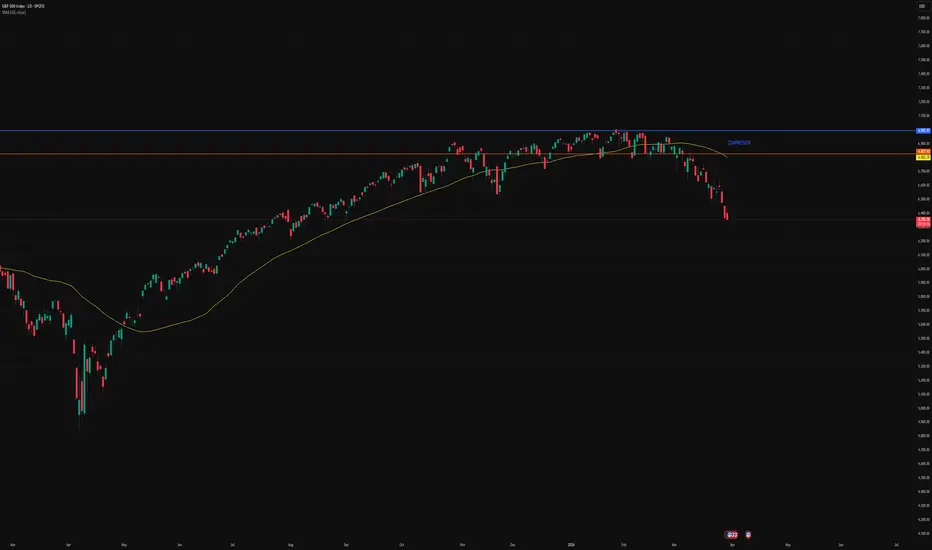
SPX: Structure Shifting Below HighsAfter a strong multi-month expansion, price transitioned into compression beneath prior highs.
The structure has now weakened, with price breaking below the rising 50-day moving average.
Key level:
– 6,800: prior support → now under pressure
The broader regime is no longer stable. Conditions have
S&P 500 Index
No trades
About S&P 500 Index
Standard and Poor's 500 Index is a capitalization-weighted stock market index measuring the performance of 500 large publicly traded companies in the United States. This index covers a wide range of industries, including technology, healthcare, energy, and finance. It serves as a benchmark for the overall health of the U.S. stock market, as well as a reflection of the country's economic strength.
Substantial gains in the S&P 500 are often interpreted as positive signals for the economy, while losses can be seen as indicators of potential trouble. Investors use this index as a barometer for their own portfolios and to assess the performance of individual stocks. The S&P 500 index plays a vital role in the financial world and is closely watched by analysts and policymakers.
Substantial gains in the S&P 500 are often interpreted as positive signals for the economy, while losses can be seen as indicators of potential trouble. Investors use this index as a barometer for their own portfolios and to assess the performance of individual stocks. The S&P 500 index plays a vital role in the financial world and is closely watched by analysts and policymakers.
Related indices
Markets Exit Q1 on a High Note Amid War Jitters. What About Q2?S&P 500 🔻 4.6%, Nasdaq 🔻 7.1%, Dow Jones 🔻 3.6%
It's January. Economic growth is accelerating, the Federal Reserve looks ready to cut rates further, the AI boom still has runway. The mood is genuinely good.
Then, on February 28, the United States and Israel launched strikes on Iran, and the moo

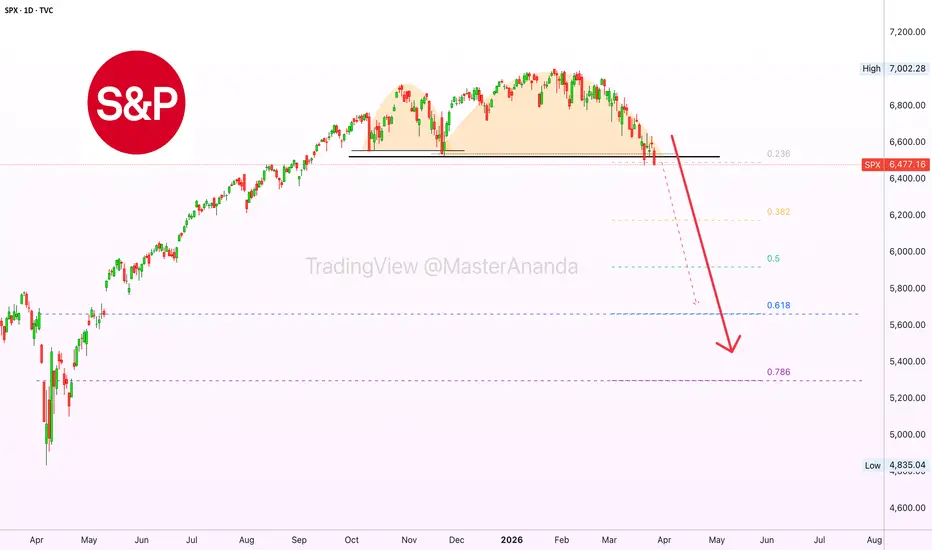
S&P500 closed 5 straight red weeks. Pressure piling up?S&P500 (SPX) has just closed its 5th straight red 1W candle something we haven't seen since October 2023. As we've mentioned numerous times in the past weeks, this is technically just the start of the market's new Bear Cycle.
Today we will expand our March 17 analysis (see chart below) where we iss

This area is importantFrom here to 6640 is heavy resistance. With the RSI almost reset I believe it's another selling opportunity. A little higher (over 6600) is likely, so best to wait until the present consolidation is over.

The S&P 500 Index (SPX) Crash & Unexpected EventsI am trying to find good news in a sea of negativity. We need something positive.
With the stock market crashing, the biggest crash in God knows how long, you would expect to see Gold rising to new all-time highs. This is what everybody who is making predictions says must happen. But Gold isn't ris
S&P500: Short on the 4H MA100, Channel Down topped.The S&P500 has turned neutral on its 1D technical outlook (RSI = 45.660, MACD - -82.010, ADX = 43.829) as the price rebounded to the top of the Channel Down to form a LH. The bullish wave hit the 4H MA100, which is the Resistance for the past month. The 4H RSI hit its own Resistance (70.00), almost

Hellena | SPX500 (4H): LONG to support area of 6735.Colleagues, structurally speaking, the higher-order “2” wave has completed its correction, and we should now look for a continuation of the upward trend.
If impulse “3” (red) has begun, then the correction wave of the intermediate order within wave “2” is currently ending or has ended in the 6326 ar

Into the WeekendI'm still bearish on the market unless they can hold above 6625. Oil still looks like it will test 120. Good luck!

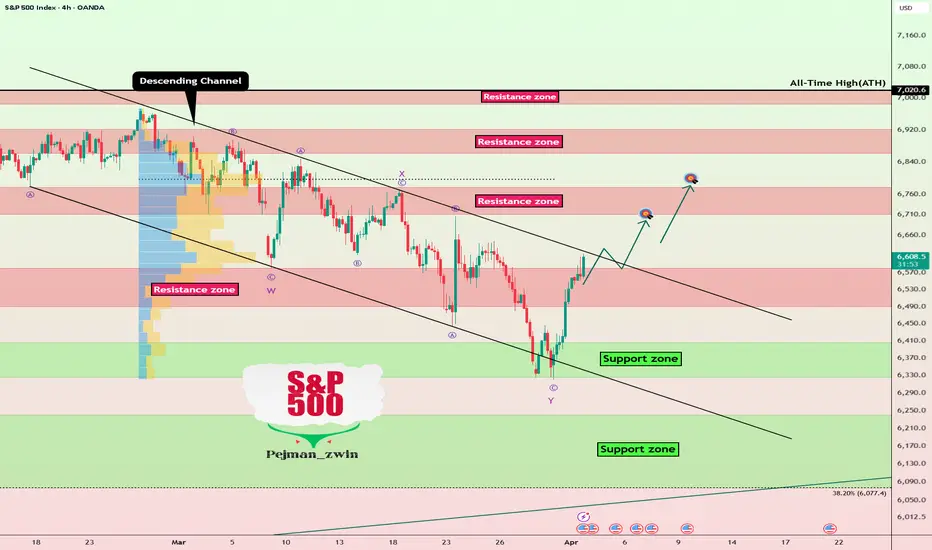
S&P 500 index Near Channel Break — Momentum Is BuildingThe S&P 500 index ( FX:SPX500 ) began to rise after news that a ceasefire between Iran and the United States was likely in the coming days, and Trump's statement that the war would end in three weeks created a wave of optimism among investors.
The S&P 500 index seems to have managed to break throu
US500: Bullish Reversal After Bear Trap – Targets 6670 & 6800US500: Bullish Reversal After Bear Trap – Targets 6670 & 6800
Yesterday's indices were all in the red and all had a clear bearish configuration.
During the London market close, they all broke out and clearly changed to the upside. This move was related to a possible end to the war between the US

See all ideas
Summarizing what the indicators are suggesting.
Oscillators
Neutral
SellBuy
Strong sellStrong buy
Strong sellSellNeutralBuyStrong buy
Oscillators
Neutral
SellBuy
Strong sellStrong buy
Strong sellSellNeutralBuyStrong buy
Summary
Neutral
SellBuy
Strong sellStrong buy
Strong sellSellNeutralBuyStrong buy
Summary
Neutral
SellBuy
Strong sellStrong buy
Strong sellSellNeutralBuyStrong buy
Summary
Neutral
SellBuy
Strong sellStrong buy
Strong sellSellNeutralBuyStrong buy
Moving Averages
Neutral
SellBuy
Strong sellStrong buy
Strong sellSellNeutralBuyStrong buy
Moving Averages
Neutral
SellBuy
Strong sellStrong buy
Strong sellSellNeutralBuyStrong buy
Displays a symbol's value movements over previous years to identify recurring trends.
Frequently asked questions
The current value of S&P 500 Index is 6,582.68 USD — it has risen by 0.11% in the past 24 hours. Track the index more closely on the S&P 500 Index chart.
S&P 500 Index reached its highest quote on Jan 28, 2026 — 7,002.28 USD. See more data on the S&P 500 Index chart.
The lowest ever quote of S&P 500 Index is 2.73 USD. It was reached on Jun 1, 1877. See more data on the S&P 500 Index chart.
S&P 500 Index value has increased by 0.41% in the past week, since last month it has shown a −3.20% decrease, and over the year it's increased by 17.95%. Keep track of all changes on the S&P 500 Index chart.
The top companies of S&P 500 Index are NASDAQ:NVDA, NASDAQ:AAPL, and NASDAQ:GOOGL — they can boast market cap of 4.31 T USD, 3.76 T USD, and 3.57 T USD accordingly.
The highest-priced instruments on S&P 500 Index are NYSE:NVR, NASDAQ:BKNG, and NYSE:AZO — they'll cost you 6,663.14 USD, 4,194.31 USD, and 3,400.54 USD accordingly.
The champion of S&P 500 Index is NASDAQ:SNDK — it's gained 1.40 K% over the year.
The weakest component of S&P 500 Index is NASDAQ:FISV — it's lost −74.69% over the year.
S&P 500 Index is just a number that lets you track performance of the instruments comprising the index, so you can't invest in it directly. But you can buy S&P 500 Index futures or funds or invest in its components.
The S&P 500 Index is comprised of 503 instruments including NASDAQ:NVDA, NASDAQ:AAPL, NASDAQ:GOOGL and others. See the full list of S&P 500 Index components to find more opportunities.