NATGAS: Forecast & Technical Analysis
Balance of buyers and sellers on the NATGAS pair, that is best felt when all the timeframes are analyzed properly is shifting in favor of the buyers, therefore is it only natural that we go long on the pair.
Disclosure: I am part of Trade Nation's Influencer program and receive a monthly fee for
Natural Gas Futures
No trades
About Natural Gas Futures
Natural Gas is a fossil fuel formed from plants and animals buried underground and exposed to extreme heat and pressure. Natural gas is used domestically for cooking, as a power source, in agriculture, and in industrial manufacturing. Natural gas prices fluctuate constantly depending mainly on production issues, stockpiles, weather conditions, economic growth, crude oil prices, and more recently coal. Natural gas is commonly measured in MMBtu, with 1 MMBTu equaling 1 million BTU (British Thermal Units).
Related commodities

Natural Gas Breakout Confirmed (Swing Trade)📊 Natural Gas Breakout Confirmed (Swing Trade)
✅ Buy Level Triggered: 254 (Daily Close Above)
🚀 Outlook:
Strong bullish momentum after confirmed breakout. Holding above 254 signals continuation move.
🎯 Swing Targets:
T1: 270
T2: 290
T3: 305
🏁 Final Target: 324
🛑 Stop Loss:
Below 245 (Closing Bas

NATGAS On The Rise! BUY!
My dear friends,
Please, find my technical outlook for NATGAS below:
The price is coiling around a solid key level - 2.807
Bias - Bullish
Technical Indicators: Pivot Points Low anticipates a potential price reversal.
Super trend shows a clear buy, giving a perfect indicators' convergence.
Goal

NATGAS FREE SIGNAL|SHORT|
✅NATGAS bearish ICT breakout confirmed as price delivers below the supply zone after clearing buyside liquidity. Strong displacement shows downside continuation, with price targeting external sellside liquidity pools.
—————————
Entry: 2.734$
Stop Loss: 2.812$
Take Profit: 2.621$
Time Frame: 6H
——

Natural Gas: Bullish Momentum Building Ahead .Natural Gas is currently holding a strong support zone near 260–265. A move above 272.8 may trigger bullish momentum, with an upside target around 281.
The immediate resistance zone is placed near 285–291.
The bullish view will be invalid if the price falls below 260.
Thank You ...

Gold Price Forecast | Oil | Dollar | Silver | Natural Gas0:00 Intro – Commodities Overview & Price Action Setup
commodities analysis, natural gas oil gold silver forecast, price action trading, support resistance levels, weekly trading outlook
0:30 Natural Gas – NG Analysis (Downtrend vs Bounce Setup) NYMEX:NG1!
natural gas analysis, NG price forecast,

NG - looking like a falling wedgeHourly chart of Natgas here
Looks like a falling wedge
Natgas is always tricky so play via calls is the idea
This is a follow up on the previous idea mentioned for natgas

NATGAS LOCAL LONG|
✅NATGAS is approaching a strong ICT demand area after a liquidity sweep below equal lows, indicating potential accumulation. If price reacts from this zone, a bullish move toward internal liquidity and higher targets is likely. Time Frame 4H.
LONG🚀
✅Like and subscribe to never miss a new idea!✅

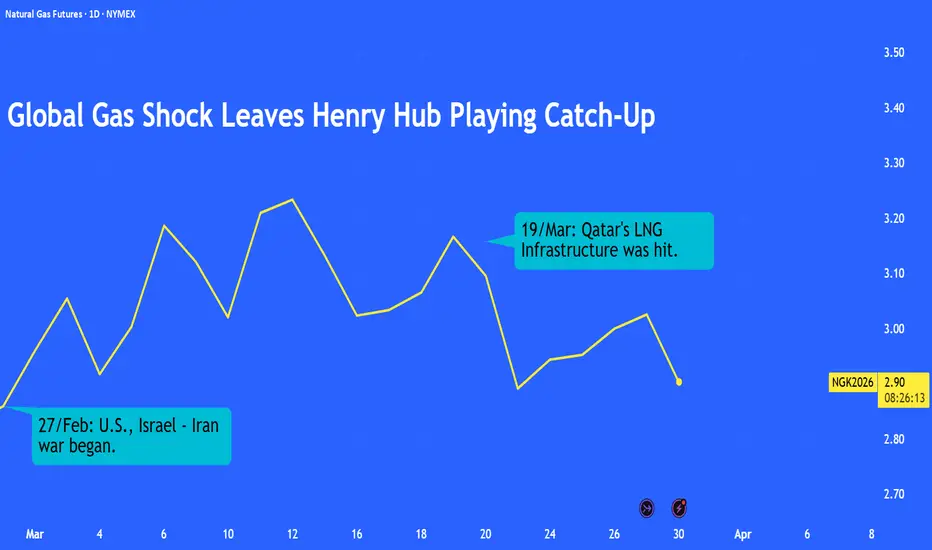
Global Gas Shock Leaves Henry Hub Playing Catch-UpThe Iran war has triggered a sharp surge in global gas prices, particularly in Europe and Asia. However, Henry Hub has responded more modestly, reflecting its domestic focus.
This note explores the divergence, key constraints limiting U.S. gas prices, and what the current setup implies for Henry H
Gold Stock Forecast | Oil | Dollar | Silver | Natural Gas0:00 Intro – Commodities Overview (Natural Gas, Oil, Dollar, Gold, Silver)
0:28 NG2 NYMEX:NG1! – Natural Gas Analysis (Range, Trendline Break, Key Support Levels)
2:50 Oil NYMEX:CL1! – Crude Oil Analysis (Geopolitical Impact, Resistance, Breakout/Flush Levels)
4:33 DXY – US Dollar Analysis (U

See all ideas
Summarizing what the indicators are suggesting.
Neutral
SellBuy
Strong sellStrong buy
Strong sellSellNeutralBuyStrong buy
Neutral
SellBuy
Strong sellStrong buy
Strong sellSellNeutralBuyStrong buy
Neutral
SellBuy
Strong sellStrong buy
Strong sellSellNeutralBuyStrong buy
A representation of what an asset is worth today and what the market thinks it will be worth in the future.
Displays a symbol's price movements over previous years to identify recurring trends.
Frequently asked questions
The current price of Natural Gas Futures is 2.648 USD / MMBTU — it has fallen −0.82% in the past 24 hours. Watch Natural Gas Futures price in more detail on the chart.
The volume of Natural Gas Futures is 123.95 K. Track more important stats on the Natural Gas Futures chart.
Open interest is the number of contracts held by traders in active positions — they're not closed or expired. For Natural Gas Futures this number is 241.03 K. You can use it to track a prevailing market trend and adjust your own strategy: declining open interest for Natural Gas Futures shows that traders are closing their positions, which means a weakening trend.
Buying or selling futures contracts depends on many factors: season, underlying commodity, your own trading strategy. So mostly it's up to you, but if you look for some certain calculations to take into account, you can study technical analysis for Natural Gas Futures. Today its technical rating is strong sell, but remember that market conditions change all the time, so it's always crucial to do your own research. See more of Natural Gas Futures technicals for a more comprehensive analysis.