Abstract
One clear observational prediction of the single-degenerate progenitor scenario as the origin of type Ia supernovae (SNe) is the presence of relatively narrow (≈1000 km s−1) Hα emission at nebular phases, although this feature is rarely seen. We present a compilation of nebular phase Hα limits for SN Ia in the literature and demonstrate that this heterogenous sample has been biased toward SN Ia with relatively high luminosities and slow decline rates, as parameterized by Δm15(B), the difference in B-band magnitude between maximum light and 15 days afterward. Motivated by the need to explore the full parameter space of SN Ia and their subtypes, we present two new and six previously published nebular spectra of SN Ia with Δm15(B) > 1.3 mag (including members of the transitional and SN1991bg-like subclasses) and measure nondetection limits of LHα < 0.85–9.9 × 1036 erg s−1, which we confirmed by implanting simulated Hα emission into our data. Based on the latest models of swept-up material stripped from a nondegenerate companion star, these LHα values correspond to hydrogen mass limits of MH ≲ 1–3 × 10⁻⁴ M⊙, which are roughly three orders of magnitude below that expected for the systems modeled, although we note that no simulations of Hα nebular emission in such weak explosions have yet been performed. Despite the recent detection of strong Hα in ASASSN-18tb (SN 2018fhw; Δm15(B) = 2.0 mag), we see no evidence that fast-declining systems are more likely to have late time Hα emission, although a larger sample is needed to confirm this result.
1. Introduction
Despite their intense study and use as standardizable candles to measure the expansion history of the universe, the exact nature of the progenitor system(s) of type Ia supernovae (SNe Ia) is still unknown. Two main progenitor channels are considered—the single-degenerate (SD) and double-degenerate (DD) scenarios. In the SD scenario, a single carbon–oxygen white dwarf gains material from a nondegenerate companion star (Whelan & Iben 1973), while in the DD scenario there is a second degenerate star in the system (Iben & Tutukov 1984; Webbink 1984). The details of how the thermonuclear explosion is triggered in each of these configurations is being actively studied.
There are several observational signatures that can signal the presence of a nondegenerate companion star and the SD scenario (for a review, see e.g., Maoz et al. 2014), but here we focus on the presence of narrow hydrogen lines in nebular phase SN Ia spectra. In the SD scenario, the supernova (SN) ejecta can collide with the companion star and strip its surface of material. Once the SN emission becomes optically thin at late times, and the observer can see into the central regions of the explosion, this swept-up material manifests itself as a relatively strong and narrow emission line. Initially this emission was anticipated in Marietta et al. (2000), and has since been the subject of several theoretical and numerical studies (e.g., Mattila et al. 2005; Pan et al. 2012; Liu et al. 2013; Lundqvist et al. 2013; Botyánszki et al. 2018). The models generically show narrow (∼1000 km s−1) emission from Hα in particular (helium and other lines are also plausible, depending on the companion star, although we focus on hydrogen in the current work) but there is considerable diversity in the predicted strength of the line from study to study. This depends on the physics included in each simulation, the strength of the explosion, and the details of the companion separation and type. This parameter space has not yet been explored in the models.
Definitive late-time narrow emission lines have not been detected in standard SN Ia, despite observations of 20 systems (see Table 1; Mattila et al. 2005; Leonard 2007; Lundqvist et al. 2013, 2015; Shappee et al. 2013, 2018; Maguire et al. 2016; Graham et al. 2017; Holmbo et al. 2018; Sand et al. 2018; Tucker et al. 2018; Dimitriadis et al. 2019; see the recently submitted Tucker et al. 2019 for even more systems). We note that there is a class of SN Ia-like objects, the so-called SN 2002ic-like or SN Ia-CSM events (e.g., Hamuy et al. 2003; Silverman et al. 2013), that display narrow Hα emission from early on in the SN’s evolution (but see Dilday et al. 2012; Graham et al. 2019). This emission is thought to originate from interaction with circumstellar material, although it is possible they are a signpost of the SD scenario. We largely leave aside these objects for the present study, although we note that they generally sit on the bright end of the SN Ia distribution, and have slowly declining light curves (e.g., Leloudas et al. 2015, see also Figure 1 of Taubenberger 2017).
Table 1. SN Ia Nebular Hα Limits and Light Curve Parameters
| SN Name | Δm15(B) | Hα Flux Limit | Hα Luminosity Limit | Phasea | Δm15(B) Ref. | Hα Ref. |
|---|---|---|---|---|---|---|
| (mag) | (10−17 erg s−1 cm−2) | (erg s−1) | (days) | |||
| From the Literature | ||||||
| SN 2001el | 1.13 | ⋯b | ⋯b | +398 | Krisciunas et al. (2003) | Mattila et al. (2005) |
| SN 2005am | 1.73 | 0.172 | 2.7 × 1035 | +381 | Hicken et al. (2009) | Leonard (2007) |
| SN 2005cf | 1.06 | 0.223 | 2.7 × 1035 | +384 | Hicken et al. (2009) | Leonard (2007) |
| SN 2009ig | 0.89 | 0.33 | 4.7 × 1035 | +405 | Foley et al. (2012a) | Maguire et al. (2016) |
| SN 2010gp | 1.19 | 0.18 | 2.4 × 1036 | +277 | Brown et al. (2017) | Maguire et al. (2016) |
| SN 2011ek | 1.13c | 0.18 | 6.2 × 1034 | +421 | Sullivan et al. (2012) | Maguire et al. (2016) |
| SN 2011fe | 1.18 | 3.14 | 1.5 × 1035 | +274 | Zhang et al. (2016) | Shappee et al. (2013) d |
| SN 2011iv | 1.69 | 1.87 | 9.7 × 1035 | +318 | Foley et al. (2012b) | Maguire et al. (2016) |
| SN 2012cg | 0.98 | 3.09 | 8.5 × 1035 | +339 | Vinkó et al. (2018) | Maguire et al. (2016) e |
| SN 2012cu | 1.05c | 0.56 | 1.3 × 1036 | +344 | Amanullah et al. (2015) | Maguire et al. (2016) |
| SN 2012fr | 0.82 | 4.79 | 2.1 × 1036 | +357 | Contreras et al. (2018) | Maguire et al. (2016) |
| SN 2012ht | 1.39 | 2.05 | 9.9 × 1035 | +433 | Yamanaka et al. (2014) | Maguire et al. (2016) |
| SN 2013aa | 1.02 | 1.46 | 5.7 × 1035 | +360 | Graham et al. (2017) | Maguire et al. (2016) |
| SN 2013cs | 1.11 | 1.18 | 2.7 × 1036 | +303 | Childress et al. (2016) | Maguire et al. (2016) |
| SN 2013ctf | ⋯ | 5.66 | 9.9 × 1035 | +229 | ⋯ | Maguire et al. (2016) |
| SN 2013gy | 1.23 | 45.0 | 1.7 × 1038 | +235 | Holmbo et al. (2018) | Holmbo et al. (2018) |
| SN 2014J | 1.12 | 16.0 | 2.2 × 1035 | +315 | Marion et al. (2015) | Lundqvist et al. (2015) |
| SN 2017cbv | 1.06 | 4.40 | 8.0 × 1035 | +302 | Hosseinzadeh et al. (2017) | Sand et al. (2018) |
| SN 2018oh | 0.96 | 0.32 | 2.6 × 1037 | +236 | Li et al. (2019) | Dimitriadis et al. (2019) g |
| ASASSN-18tbh | 2.0 | 35.0 | 2.2 × 1038 | +139 | Kollmeier et al. (2019) | Kollmeier et al. (2019) |
| New Measurements | ||||||
| SN 1999by | 1.90 | 22.3 | 5.3 × 1036 | +183 | Garnavich et al. (2004) | This work |
| SN 2003hv | 1.61 | 2.0 | 8.5 × 1035 | +320 | Leloudas et al. (2009) | ″ |
| SN 2003gs | 1.83 | 15.5 | 8.4 × 1036 | +200 | Krisciunas et al. (2009) | ″ |
| SN 2004eo | 1.46 | 1.8 | 9.9 × 1036 | +228 | Pastorello et al. (2007) | ″ |
| SN 2007gi | 1.40 | 4.2 | 3.0 × 1036 | +225 | Zhang et al. (2010) | ″ |
| SN 2007on | 1.96 | 8.2 | 3.1 × 1036 | +286 | Gall et al. (2018) | ″ |
| SN 2016brxi | ⋯ | 2.0 | 8.2 × 1036 | +183 | ⋯ | ″ |
| SN 2017fzw | 1.79 | 11.3 | 8.8 × 1036 | +233 | L. Galbany et al. (2019, in preparation) | ″ |
Notes. The top portion of the table is a compilation of literature values taken directly from their source, while the bottom presents new measurements of SN Ia with Δm15(B) > 1.3 mag.
aPhases are with respect to B-band maximum. bMattila et al. (2005) report an informal limit of MH ≈ 0.03 M⊙ but no explicit flux/luminosity limit. cConverted from stretch using the method from Altavilla et al. (2004). dSee also Lundqvist et al. (2015). eSee also Shappee et al. (2018). fNo light curve information is available for SN 2013ct. gSee also Tucker et al. (2018). hASASSN-18tb had a clear detection of Hα, unlike the other objects in this table. The reported values in this row are the true measurements, not limits. iWhile SN 2016brx does not have a measured Δm15(B) we place it in our sample as it is a confirmed SN1991bg-like, fast-declining SN Ia (Dong et al. 2018).Download table as: ASCIITypeset image
Recently, Kollmeier et al. (2019) presented a nebular spectrum (+139d after maximum light) of ASASSN-18tb (SN 2018fhw), a fast-declining (Δm15(B) = 2.0 mag) and subluminous SN Ia hosted by a dwarf elliptical galaxy. ASASSN-18tb was discovered by the All Sky Automated Survey for Supernovae (ASASSN; Shappee et al. 2014), and is studied in further detail by Vallely et al. (2019a). The spectrum showed clear, conspicuous Hα emission with a luminosity of LHα = 2.2 × 1038 erg s−1 and FWHM ≈ 1100 km s−1. In the context of the latest radiative transfer models of the expected hydrogen emission signature in nebular spectra (Botyánszki et al. 2018), such an Hα luminosity corresponds to ∼2 × 10⁻³ M⊙ of swept-up material, below expectations for the SD model. Nonetheless, uncertainties in the modeling and the fact that the models thus far have not studied subluminous SN Ia make this and other scenarios worth exploring. Further data on ASASSN-18tb are also needed to determine if other observational signatures of the SD model are evident.
Motivated by the Hα emission and fast-declining nature of ASASSN-18tb, in Section 2 we compile the literature sample of SN Ia with nebular Hα limits as a function of their light curve decline rate, Δm15(B), which is known to correlate with the luminosity and color of SN Ia (Phillips 1993). From this compiled data set, we notice a lack of Hα limits for SN Ia with a decline rate of Δm15(B) ≳ 1.3 mag. We then gather a sample of both new and archival nebular SN Ia spectra to constrain the incidence of late time Hα in such fast-declining systems, partially to explore this new parameter space and to put the recent results for ASASSN-18tb in context.
2. Nebular Hα Literature Search
We have collected all of the Hα nebular spectroscopy limits for SN Ia reported in the literature (Mattila et al. 2005; Leonard 2007; Lundqvist et al. 2013, 2015; Shappee et al. 2013, 2018; Maguire et al. 2016; Graham et al. 2017; Holmbo et al. 2018; Sand et al. 2018; Tucker et al. 2018; Dimitriadis et al. 2019), as well as the real detection of ASASSN-18tb (Kollmeier et al. 2019), and listed them in Table 1 under the “From the Literature” portion of the table. For each object we also list the most constraining Hα flux and luminosity limits, along with the phase at which the data was taken, labeled in days since B-band maximum. These results have been taken directly from the original papers and we make no attempt to homogenize them; one should keep in mind that many studies use different methodologies for deriving their observational limits.
At the same time, we have looked at the distribution in decline rates among these SN Ia, parameterized by Δm15(B), the difference in magnitude between a SN Ia at peak and 15 days after maximum in the B-band, which has long been known to correlate with the peak luminosity and color of SNe Ia (Phillips 1993). The fastest-declining SN Ia have the faintest absolute magnitudes, and vice versa.
In Figure 1 we plot the histogram of Δm15(B) values for the nebular Hα sample in comparison to the Carnegie Supernova Project’s (CSP) sample of SN Ia (Krisciunas et al. 2017), which we assume is nearly representative of the population as a whole. The CSP attempted to observe nearly every low-redshift SN in the southern hemisphere over a 5 yr period during their observing season (see also Hamuy et al. 2006), although these SNe were largely drawn from pointed galaxy SN searches, which was all that was available at the time. We also plot ASASSN-18tb, the recently announced SN Ia with nebular Hα emission. There are several things to note. First, ASASSN-18tb is on the very upper edge of the distribution of SN Ia in terms of Δm15(B). Second, the population of SN Ia that have nebular Hα limits is biased toward slower declining, relatively brighter events. There is a lack of Hα limits at Δm15(B) ≳ 1.3 mag, while the recent results for ASASSN-18tb indicate that is a promising region of parameter space to search for this signature of the SD scenario. In the next section, we attempt to further populate the Δm15(B) ≳ 1.3 mag region of parameter space by both presenting new SN Ia nebular spectra and measuring limits for previously published spectra that do not yet have reported Hα measurements.
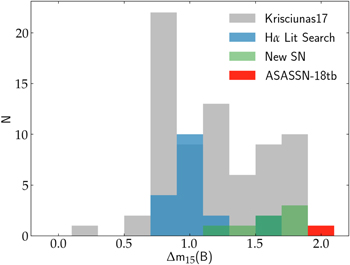
Figure 1. Histogram of Δm15(B) values for SNe Ia with nebular Hα limits from the literature (blue; see also Table 1) in comparison to the Carnegie Supernova Project’s sample (gray; Krisciunas et al. 2017). The sample with Hα limits is clearly biased toward SN Ia with lower Δm15(B) values (the brighter and slower declining events). We also show ASASSN-18tb (red), which has a clear Hα detection at Δm15(B) = 2.0 mag, an area of parameter space that has not yet been sampled. The green histogram represents the new measurements presented in this work.
Download figure:
Standard image High-resolution image3. Nebular Spectroscopy of Fast-declining SN Ia
In this section we present both new and archival nebular spectroscopy of SN Ia that have a Δm15(B) > 1.3 mag in order to fill in some of the unexplored parameter space seen in Figure 1; we further discuss the broad range of SN Ia and their subtypes that this sample represents below. For clarity, we refer to nebular spectra that have been previously published, but have not been used for placing limits on Hα as “archival” in this work, and they should not be confused with the Hα literature results presented in the top half of Table 1. Both the new and archival data are from multiple programs with different science goals, and so the data set is heterogenous in wavelength coverage, resolution, and signal-to-noise ratio.
The archival data set is a result of a literature search of prominent SN Ia that have been studied in detail, and have reduced spectra in public databases (Silverman et al. 2012; Yaron & Gal-Yam 2012; Guillochon et al. 2017). No attempt was made to search telescope archives for unpublished data, although such a search would likely be fruitful. All spectra must be at least +130 days past maximum in the B-band in order to qualify as a nebular spectrum, and have a published Δm15(B) value. We made one exception by including the SN 2016brx into our sample, which does not have a Δm15(B) measurement due to sparse light curve coverage, although it is a bona fide fast-declining SN1991bg-like SN Ia that would make it into our sample if the light curve data existed; see Dong et al. (2018) for details. If a previously published SN had multiple nebular spectra available, we only chose the highest signal-to-noise example to include in this study. We did not include objects whose nebular spectra were evidently low in quality upon inspection, or had other relevant issues. For instance, SN 1986G would be an excellent addition to our sample (Δm15(B) = 1.62; Phillips et al. 1987), but due to its proximity to an H ii region many of its nebular spectra have oversubtraction issues near Hα (Cristiani et al. 1992), and so we excluded it from our sample. During our search, Table 8 in Hsiao et al. (2015) and Table 3 in Vallely et al. (2019b) both proved useful for identifying SNe Ia that matched our search criteria described above.
The upper portion of Table 2 shows the observation log for the six spectra identified in the literature in our archival data set, and the data themselves are shown in Figure 2. We also list other parameters essential for inferring Hα limits in this table, including the derived color excess and distance to each SN. We emphasize again that this is not likely a complete set of published nebular SN Ia spectra with Δm15(B) > 1.3 mag without Hα limits. A more comprehensive search may yet turn up more examples.
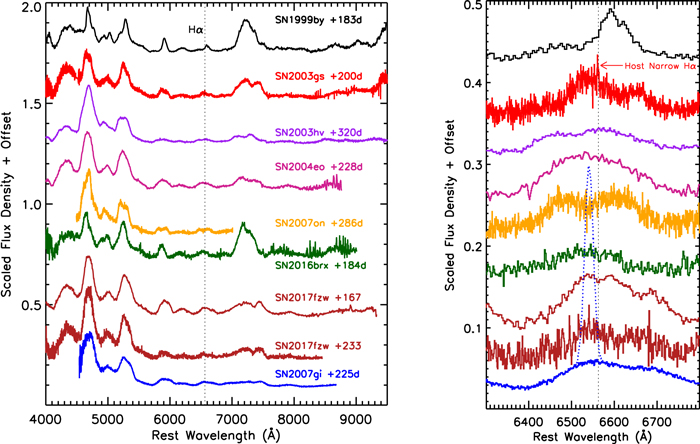
Figure 2. Nebular phase spectra of SNe Ia in our Δm15(B) > 1.3 mag sample; the spectra have been rescaled for presentation purposes. Spectra are labeled in the left panel, and have the same colors in both panels. On the right is a zoom in of the region around Hα, where one would expect narrow (FWHM ≈ 1000 km s−1) emission to be apparent in the SD scenario, although we see no such signature. For illustration, we have placed a simulated Hα line with FWHM = 1000 km s−1, and offset by − 1000 km s−1, onto the spectrum of SN 2007gi. This simulated feature has the same luminosity as the Hα line seen in ASASSN-18tb—we clearly see no such features in our sample. We do mark a very narrow Hα feature in SN 2003gs, which has a width of ≈75 km s−1. This feature is near the resolution of the Keck/ESI spectrum. Upon inspection of the 2D spectrum, this Hα emission clearly originates from the host galaxy rather than the SN; see Section 4 for details.
Download figure:
Standard image High-resolution imageTable 2. Nebular Spectroscopy Log
| SN Name | Observation | Phase | Telescope | Grating/Grism | Slit | Exposure | Res. | Scaled Mag | E(B − V)MW | E(B − V)host | Distance |
|---|---|---|---|---|---|---|---|---|---|---|---|
| Date (UT) | (days)a | Instrument | Width (″) | Time (s) | (Å) | (mag) | (mag) | (mag) | (Mpc) | ||
| Archival Data | |||||||||||
| SN 1999byb | 1999 Nov 9 | +183 | Keck/LRIS | 400/8500 | 1 |
250 | 6.9 | R = 19.70 | 0.016 | 0.0 | 14.1 |
| SN 2003hvc | 2004 July 25 | +320 | VLT/FORS1 | 300V/I | 1 |
4 × 1200 | 11.5 | R = 21.13 | 0.016 | 0.0 | 18.79 |
| SN 2003gsd | 2004 Feb 14 | +200 | Keck/ESI | Echelle | 1 |
1800 | 1.6 | R = 20.19 | 0.035 | 0.031 | 21.4 |
| SN 2004eoe | 2005 May 16 | +228 | VLT/FORS1 | 300V | 1 |
2 × 2280 | 11.5 | R = 21.81 | 0.109 | 0.0 | 67 |
| SN 2007onf | 2008 Aug 27 | +286 | Mag/LDSS3 | VPH-B | 0 |
4 × 1800 | 2.0 | R = 21.59 | 0.0 | 0.0 | 17.9 |
| SN 2016brxg | 2016 Oct 20 | +183 | Mag/LDSS3 | VPH-All | 1 |
7 × 1800 | 10.0 | R = 22.4 | 0.083 | 0.0 | 58.2 |
| New Data | |||||||||||
| SN 2007gi | 2008 Mar 26 | +225 | GN/GMOS | R400 | 0 |
2 × 650 | 2.2 | R = 20.59 | 0.024 | 0.20 | 24.6 |
| SN 2017fzw | 2018 Feb 6 | +167 | SALT/RSS | PG0300 | 1 |
2226 | 19 | r = 19.9 | 0.037 | 0.0 | 25.6 |
| 2018 Apr 13 | +233 | GS/GMOS | R400+B600 | 0 |
4 × 300 | 5.1/5.8 | r = 21.6 | ″ | ″ | ″ | |
Notes.
aPhase is in units of days with respect to B-band maximum. bSilverman et al. (2012). cLeloudas et al. (2009) is the source of the spectrum, color excess, distance, and late time light curve. dSilverman et al. (2012) is the source for the spectrum, while Krisciunas et al. (2009) is the source for the color excess, distance, and late time light curve. ePastorello et al. (2007) is the source of the spectrum, color excess, distance, and late time light curve. fFolatelli et al. (2013) is the source for the spectrum, while Gall et al. (2018) is the source for the color excess and distance. Note that we used SN 2007gi and SN 2003gs to infer the late time magnitude of SN 2007on; see Section 3 for details. gDong et al. (2018) is the source of the spectrum and the light curve from which we estimated the late-time magnitude of SN 2016brx.Download table as: ASCIITypeset image
We also present new nebular-phase spectra for two SN Ia, which are detailed in the bottom portion of Table 2. All of the spectra were reduced in a standard way, performing bias subtraction, flat-fielding, cosmic-ray rejection, local sky subtraction, and extraction of 1D spectra. A sensitivity function was derived from standard star observations to flux calibrate the spectra, which are presented in Figure 2.
In order to account for nonphotometric conditions and slit losses, and to get meaningful Hα narrow line limits, it is necessary to place our spectra on an absolute scale. For both the new and archival data, we rescale the spectra to match late-time photometry at a given epoch via simple linear interpolation or mild extrapolation. The source of the late-time light curve is detailed in Table 2, as well as the magnitude to which the spectrum was scaled. One exception is SN 2016brx, which has a very sparse late-time light curve, but which was matched with a SN1991bg light curve template by Dong et al. (2018); we estimated a R = 22.4 mag at the time of the nebular spectrum at +184d based on this comparison.13 Another exception is SN 2007on, which does not have light curve data beyond +90 days after B-band maximum. For this SN, we instead used the late-time light curves of SN 2007gi and SN 2003gs (both in our sample), rescaling them to the distance of SN 2007on and taking the average result between the two, resulting in an inferred R = 21.59 mag for SN 2007on at +286 days; the light curves were all well-matched at earlier epochs.
No previous data has been published for SN 2017fzw, and so we measure it is light curve parameters directly (Tables 1 and 2). This SN Ia was discovered by the Distance Less Than 40 Mpc (DLT40) fast-cadence nearby SN search (Tartaglia et al. 2018), and its full data set—including further work on its nebular spectra—will be studied elsewhere (Galbany et al. 2019, in preparation). We simply provide Hα detection limits here.
Once the spectra have been scaled to the photometry, we then correct for any Milky Way and host extinction using the extinction model of Fitzpatrick (1999). The values for the color excess used for this correction are listed in Table 2.
The properties of our new SN Ia nebular sample can be gleaned from their decline rates. They range from relatively normal SN Ia on the fast end of the decline rate distribution (e.g., SN 2007gi with Δm15(B) = 1.40 mag; Zhang et al. 2010) to so-called transitional SN Ia (e.g., SN 2007on with Δm15(B) = 1.90 mag; Gall et al. 2018), which display properties intermediate to that of normal SN Ia and SN 91bg-like events. The SN 1999by belongs to the class of SN 91bg-like events, given its lack of secondary maximum, and conspicuous Ti ii in its optical spectrum (Garnavich et al. 2004); as mentioned previously, SN 2016brx also belongs to this class (Dong et al. 2018). SN 2017fzw has secondary maxima in its i-band light curve, and so is not a true SN 91bg-like event (see discussion in Gall et al. 2018); we postpone a more detailed discussion of SN 2017fzw’s properties to future work. While it is beyond the scope of the current work, it is possible that fast-declining normal SN Ia, transitional SN Ia, and SN-91bg-like SNe all have different progenitor systems, and so more detailed studies of the nebular Hα statistics of each subclass may be warranted (e.g., see discussions in Hsiao et al. 2015; Dhawan et al. 2017; Gall et al. 2018). At the time of this writing, it is not clear if ASASSN-18tb fits in cleanly into any of these subtypes, although it seems to have properties of both the transitional and SN91bg-like SN Ia—we discuss this system further in Section 6. Nonetheless, as seen in Figure 1, it is clear that Hα limits are needed for all subtypes at the fast decline end of the SN Ia distribution.
4. Stripped Material Search via Hα
As discussed, a clear observational signature of the SD scenario is that stripped hydrogen (and possibly helium) rich material would be swept up and cause narrow emission lines (∼1000 km s−1) at late times. Here we focus on the Hα line, which is predicted to be strongest and is the subject of most modeling efforts. From inspection of Figure 2, there are no strong, narrow Hα lines apparent. We note that during the nebular phase, an Hα feature would sit atop the broad [Co iii] emission feature seen in the zoomed-in portion of this figure. The exception is SN 2003gs, which has an apparent Hα emission feature. This is narrower than expected from the SD scenario, which we discuss further below. We focus on setting limits on any trace amounts of Hα in these spectra, assuming an FWHM = 1000 km s−1 and a potential offset from the rest wavelength of up to ∼1000 km s−1, in accord with past efforts (e.g., Mattila et al. 2005; Leonard 2007; Botyánszki et al. 2018).
For setting limits on narrow Hα emission, we mimic the methodology of Sand et al. (2018), which we briefly describe here. We take the flux-calibrated, extinction, and redshift-corrected spectra and bin each to their native resolution, between ≈1.6 and 19 Å. We then establish a “continuum level” over the broad [Co iii] emission feature and surrounding regions by smoothing the spectrum on scales larger than the expected narrow Hα emission, using a second-order Savitsky–Golay filter with a width between 120 and 180 Å, depending on the spectrum. We experimented with this scale in order to best recover simulated, faint Hα features in our data. Any Hα feature of the scale that we are interested in would be apparent in the difference between the smoothed and binned spectrum.
To estimate the maximum Hα emission that could go undetected in our data, we assume a Hα line with FWHM = 1000 km s−1 and with a peak flux that is three times the root mean square of our residual spectrum, after taking the difference between the smoothed and binned data. The resulting flux and luminosity limits for these new measurements are presented in Table 1 alongside those of previous work. In Figure 3 we plot the Hα luminosity limits measured here as a function of Δm15(B), along with all of the literature measurements compiled in Table 1. Also plotted is the Hα detection of ASASSN-18tb, which is significantly stronger than nearly all the limits reported to date—if emission like that seen in ASASSN-18tb were common, it would have been detected in most searches. To illustrate this even more clearly, we have implanted a simulated line with the luminosity of Hα (along with FWHM = 1000 km s−1 and a velocity offset of 1000 km s−1) seen in ASASSN-18tb into our SN 2007gi data, as can be seen in the right panel of Figure 2—clearly any line near this strength would stand out in our data.
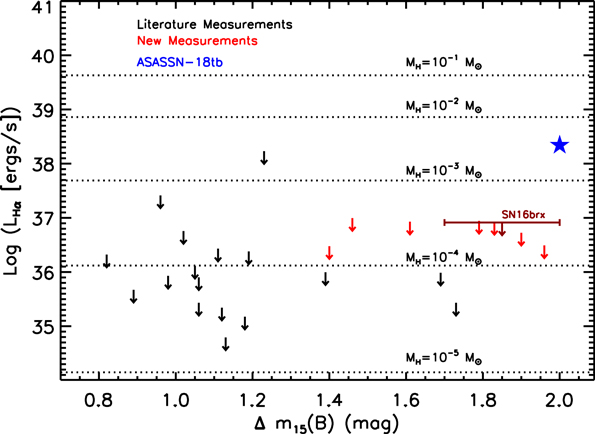
Figure 3. Summary of Hα luminosity limits from all literature measurements (black upper limits) as well as those presented in this work (red upper limits) at high decline rates. As we do not have a Δm15(B) measurement for SN 2016brx, but it is a confirmed SN91bg-like SN Ia, we have placed a range of 1.7 < Δm15(B) < 2 on this object, corresponding to the observed range for this subtype (see e.g., Figure 1 of Taubenberger 2017). Also shown is the Hα detection in ASASSN-18tb (Kollmeier et al. 2019, blue star), which is significantly stronger than the Hα luminosity limits presented here. Using Equation 1 from Botyánszki et al. (2018, with the corrected coefficients from Sand et al. 2018) we also show the correspondence between stripped hydrogen mass and Hα luminosity in their latest set of hydrodynamic simulations. For all of their SD models, several tenths of a solar mass of hydrogen material was stripped from the companion star. No attempt was made to correct Hα luminosities to the epoch of the Botyánszki et al. (2018) models; this order unity effect does not change the conclusions of this plot. The Hα upper limits for all the newly presented fast-declining SN Ia are at least an order of magnitude below the Hα detection in ASASSN-18tb.
Download figure:
Standard image High-resolution imageThere is a narrow Hα feature seen in the spectrum of SN 2003gs at the exact rest frame position of Hα, as is pointed out in the zoomed-in portion of Figure 2. The width of the feature is at the resolution of Keck/ESI; ≈1.6 Å or ≈75 km s−1. Upon request, the 2D spectrum of SN 2003gs was provided and inspected (T. Brink 2019, private communication), and there was clear, spatially extended Hα emission beyond the trace of the SN. We therefore conclude that this narrow Hα emission is from the host galaxy, and not the SN.
5. Stripped Mass Limits
In the previous section, we have measured Hα luminosity limits for a sample of nebular SN Ia with Δm15(B) > 1.3 mag, a region of parameter space relatively unexplored by previous work. In the SD scenario, it is expected that some hydrogen-rich material is stripped from the nondegenerate companion star during the explosion, which should manifest as a narrow Hα line at late times. However, our search, like most before it, turned up no definitive detections. Here we translate these line luminosity limits to limits on the amount of stripped hydrogen that could have gone undetected in our observations. For this, we use the 3D radiative transport results of Botyánszki et al. (2018), whose work derived from the SN Ia ejecta-companion interaction simulations of Boehner et al. (2017). A simulated spectrum of a normal SN Ia at +200 days after peak brightness was generated, incorporating stripped material from a solar abundance companion star. For models including main sequence, subgiant and red giant companion stars between ∼0.2 and 0.4 M⊙ of material was stripped, leading to LHα ≈ 4.5–15.7 × 1039 erg s−1. These Hα luminosities are ∼3 orders of magnitude brighter than our measured luminosity limits, and so we can rule out models like that presented by Botyánszki et al. (2018).
If the stripped hydrogen mass is intrinsically lower than that predicted by the Botyánszki et al. (2018) models, whether it be due to a weaker explosion, larger companion separation, or otherwise, a lower Hα luminosity is possible. To set mass limits on our own data, we use the quadratic formula presented by Botyánszki et al. (2018, see also the typographical correction to this formula in Sand et al. 2018), which was derived after manually changing the hydrogen density in their fiducial model. Using this, we find hydrogen mass limits of ∼1–3 × 10⁻⁴ M⊙. To put these values in context with other Hα limits, and the recent detection in ASASSN-18tb, we compile all the measurements in Figure 3. Lines of constant hydrogen mass are plotted using the formula provided by Botyánszki et al. (2018). Note that even though the model nebular spectrum of Botyánszki et al. (2018) was generated at +200 days after peak, we make no further correction to our derived hydrogen mass limits, even though our spectra (and those in the literature) were taken at other times. Any correction would be of order unity, while the hydrogen limits that we present are orders of magnitude below the model expectations. That said, further modeling efforts are necessary, especially for the weaker explosion energies of fast-declining SN Ia, to put definitive limits on the amount of ablated hydrogen mass. What is robust, however, is the fact that we do not find any other fast-declining SN Ia with Hα luminosities within ∼1–2 orders of magnitude of that found in SN 2018fhw.
6. Summary and Conclusions
Nebular Hα emission is an important signpost for the SD scenario (e.g., Marietta et al. 2000; Mattila et al. 2005; Botyánszki et al. 2018), although it has rarely been detected (but see the sample of circumstellar-interacting SN Ia, whose Hα emission appears prior to the nebular phase and may have a different origin; e.g., Dilday et al. 2012; Silverman et al. 2013; Graham et al. 2019). Motivated by recent observations of the fast-declining ASASSN-18tb (Δm15(B) = 2.0 mag), and the conspicuous detection of Hα in its nebular spectrum, we have collected all of the Hα nebular spectroscopy limits for SN Ia reported in the literature. Plotting this sample of SN Ia as a function of their decline rate, Δm15(B), clearly shows a deficit of measurements for faster-declining events, Δm15(B) ≳ 1.3 mag. The origin of this apparent bias is unknown, although it may simply be that faster-declining events are intrinsically fainter and are thus harder to observe at late times. Whatever the origin, it is important to measure nebular Hα limits for SN Ia across their decline rate distribution, and among their rarer subtypes. The current work is one step in that direction.
We have added eight SN Ia to the sample with Hα limits in their nebular spectra, all with decline rates of Δm15(B) > 1.3 mag. For two of these events we present new observations, while the other six have been published elsewhere for other purposes. No new Hα detections were made, with limits comparable to others in the literature, ∼3 orders of magnitude below expectations for the SD model presented by Botyánszki et al. (2018), and ∼1–2 orders of magnitude below the recent detection in SN 2018fhw. Further modeling of SN Ia with varying companion types, separations, and explosion energies are necessary before the observations presented here can firmly rule out the SD scenario.
It is interesting to note that all of the fast-declining SN Ia with Δm15(B) > 1.4 mag that we investigated exploded in early-type host galaxies consistent with previous studies that find both transitional and 91bg-like SN Ia favor lenticulars/ellipticals (e.g., Hamuy et al. 2000; Howell 2001; Sullivan et al. 2006; Neill et al. 2009; Pan et al. 2014, among others). Binary population synthesis studies have found it extremely difficult for SD SN Ia to significantly contribute to the overall SN Ia rate at long delay times (Ruiter et al. 2009; Mennekens et al. 2010; Claeys et al. 2014). Indeed, from our current study we have shown that among the fastest-declining and most subluminous SN Ia, no more than ≲15% exhibit nebular Hα emission, with upper limits on Hα luminosity which are ∼1–2 orders of magnitude below the actual detection in ASASSN-18tb.
While other studies will explore ASASSN-18tb in more detail, there are at least two things that make it unique and point to future areas of progress. First, given its Δm15(B) = 2.0 mag and its peak absolute luminosity of MB,max = −17.7 mag, ASASSN-18tb sits in between the transitional and 91bg-like SN Ia loci in that parameter space (see Figure 1 of Taubenberger 2017); as discussed in Section 4 there is diversity among the subluminous SNe Ia and they may originate via multiple channels. Also, ASASSN-18tb exploded in a satellite dwarf elliptical galaxy that is most likely metal-poor (ASASSN-18tb’s host, LEDA 330802, is projected ≈4.0 arcminutes, or ≈80 kpc, from the lenticular galaxy LEDA 14822, which both have nearly the same redshift of z = 0.0175, while LEDA 14822 is 4.2 mag brighter in J-band14 ). The mass retention efficiency of accreting white dwarfs is higher at lower metallicity (Shen & Bildsten 2007; Kobayashi et al. 2015), possibly making the SD scenario at long delay times more viable in metal-poor environments. Future surveys for late-time Hα should not only cover the Δm15(B) light curve parameter space as investigated in this study, but also as a function of SN Ia spectral subtype, host galaxy age, and host galaxy metallicity.
We are grateful to T. Brink for providing us with the 2D spectrum of SN 2003gs, and clarifying the exposure time for SN 1999by.
Based on observations obtained at the Gemini Observatory, which is operated by the Association of Universities for Research in Astronomy, Inc., under a cooperative agreement with the NSF on behalf of the Gemini partnership: the National Science Foundation (United States), National Research Council (Canada), CONICYT (Chile), Ministerio de Ciencia, Tecnología e Innovación Productiva (Argentina), Ministério da Ciência, Tecnologia e Inovação (Brazil), and Korea Astronomy and Space Science Institute (Republic of Korea), Programs GN-2008A-Q-17,GS-2018A-Q-315.
This research has made use of the NASA/IPAC Extragalactic Database (NED), which is operated by the Jet Propulsion Laboratory, California Institute of Technology, under contract with the National Aeronautics and Space Administration.
Research by D.J.S. is supported by NSF grants AST-1821987 and 1821967. Observations using Steward Observatory facilities were obtained as part of the observing program AZTEC: Arizona Transient Exploration and Characterization, which receives support from NSF grant AST-1515559. Data from the Southern African Large Telescope were obtained with Rutgers University proposal 2017-1-MLT-002 (PI: S.W.J.) and supported by NSF award AST-1615455. P. Milne and M. Moe acknowledge financial support from NASA grant ADAP-80NSSC19K0578.
M.L.G. acknowledges support from the DIRAC Institute in the Department of Astronomy at the University of Washington. The DIRAC Institute is supported through generous gifts from the Charles and Lisa Simonyi Fund for Arts and Sciences, and the Washington Research Foundation.
Facilities: Gemini North (GMOS) - , Southern African Large Telescope (RSS) - .
Software: astropy (Astropy Collaboration et al. 2013; The Astropy Collaboration et al. 2018), The IDL Astronomy User’s Library (Landsman 1993).
Footnotes
- 13
On 2016 November 4 (+199d), we also obtained 3 × 15 minutes V-band exposures of SN 2016brx with the 61-in Kuiper Telescope and Mont4K imager, and measured V = 23.0 ± 0.2 mag. Assuming that 91bg-like objects have a color of V − R ≈ 0 during this time period, and they decline at a rate of 0.025 mag per day (Milne et al. 2001), we would have expected R = 22.6 ± 0.2 mag at +184d; this confirms our estimate of R ≈ 22.4 mag at the same epoch.
- 14