Original content from this work may be used under the terms of the Creative Commons Attribution 4.0 licence. Any further distribution of this work must maintain attribution to the author(s) and the title of the work, journal citation and DOI.
The published article contains an error in the definition of the joining redshift. Additionally, we uncovered two computational errors: one that led to incorrect joining redshifts being assigned to a small subset of the satellite sample, and one that affected the normalization of the satellite number density profiles in Figure 9. In this erratum, we discuss the nature of these errors and we present the results we obtain after the errors are addressed. We note also that, per the preference of the TNG collaboration, the simulation used in the paper should be referred to as TNG100 in the title (as opposed to IllustrisTNG100).
The published article incorrectly states that the joining redshift was defined to be the initial time a satellite approached within the present-day virial radius of its host galaxy. The joining redshift used in the paper was, instead, defined to be the final time a satellite was located outside the present-day virial radius of its host. For clarity, here we will refer to the joining redshift defined to be the initial (final) time a satellite enters a sphere defined by the host’s z = 0 virial radius as zj i (zj f ). For consistency with the published article, the redshift at which a satellite “enters” is the redshift corresponding to the snapshot immediately prior to the snapshot in which the satellite is located within its host’s z = 0 virial radius unless the satellite’s merger tree does not contain that snapshot.
In the published article, 100 satellites were assigned joining redshifts  . Upon reanalysis, we found that these particular satellites actually have lower joining redshifts, which are more typical of other satellites in our sample. We are unable to reproduce the error that led to the incorrect zj
f
assignments in the published article, but it may have been caused by files that were inadvertently truncated when we originally downloaded the simulation data. We no longer have access to these original files and cannot verify whether this was, in fact, the cause of the error.
. Upon reanalysis, we found that these particular satellites actually have lower joining redshifts, which are more typical of other satellites in our sample. We are unable to reproduce the error that led to the incorrect zj
f
assignments in the published article, but it may have been caused by files that were inadvertently truncated when we originally downloaded the simulation data. We no longer have access to these original files and cannot verify whether this was, in fact, the cause of the error.
The satellite number density profiles are normalized by the number density of satellites at x = r/r200 = 1. However, in Figure 9 of the published article, only satellites with x < 1 were considered, which led to an error in the computation of ρ(x = 1).
In the published article, we used the joining redshift to investigate number density profiles for the “oldest” and “youngest” satellite populations. The oldest and youngest populations are of interest because it may be expected that the oldest satellites will have had time to come into virial equilibrium with their hosts’ halos. However, the final time a satellite entered its host’s halo may not correspond to the first time it entered its host’s halo. In this case, gravitational forces could begin to alter a satellite’s motion well before zj f . Thus, zj i may serve as a better proxy for the amount of time dynamical friction has acted on a satellite.
Figure 1 shows a scatter plot of zj
i
and zj
f
for each satellite. Points are colored based on the color of the satellite at the present day: red for red satellites and blue for blue satellites. Of the 3616 satellites in our sample that are within their hosts’ virial radii at z = 0, a total of 1860 have initial joining redshifts that exceed their final joining redshifts (i.e.,  for about half the sample). We consider these objects to be “splashback” satellites, since they enter, leave, and reenter their hosts’ halos over time.
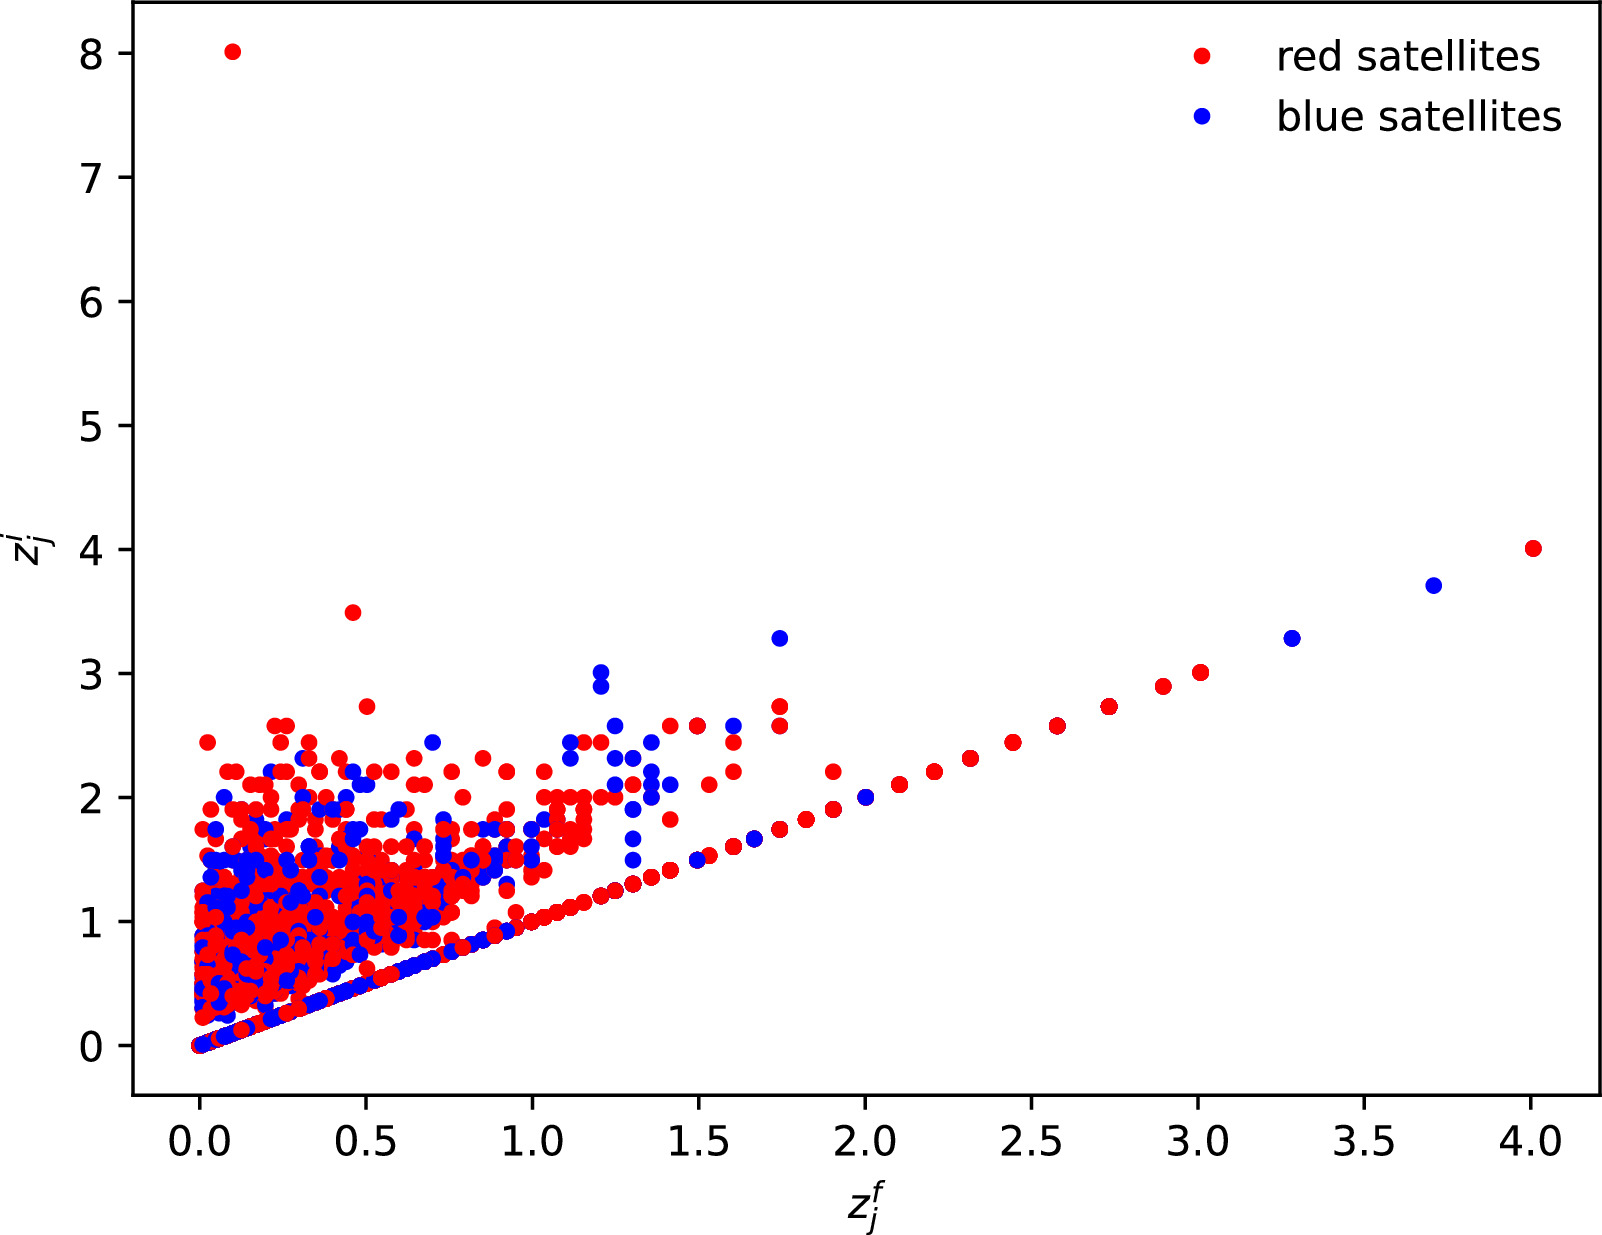
Figure 1. Comparison of the redshifts at which satellites initially entered their hosts’ halos, zj
i
, and the redshifts at which they entered their hosts’ halos for the final time, zj
f
. Approximately half of the satellites entered their hosts’ halos only one time; hence,  for these objects. Red points indicate satellites that are red at the present day, while blue points indicate satellites that are blue at the present day.
Download figure:
Standard image High-resolution imageFigure 2 shows radial number density profiles for the “oldest” (magenta) and “youngest” (cyan) satellites, where the “age” of the satellite is determined by the joining redshift as defined by zj f in the top panel and zj i in the bottom panel. There are two differences between the top panel of Figure 2 and the top panel of Figure 9 in the published article: (1) zj f has been corrected for 100 of the oldest satellites and (2) ρ(x = 1) is now estimated by performing a linear spline extrapolation of the satellite number density profile.
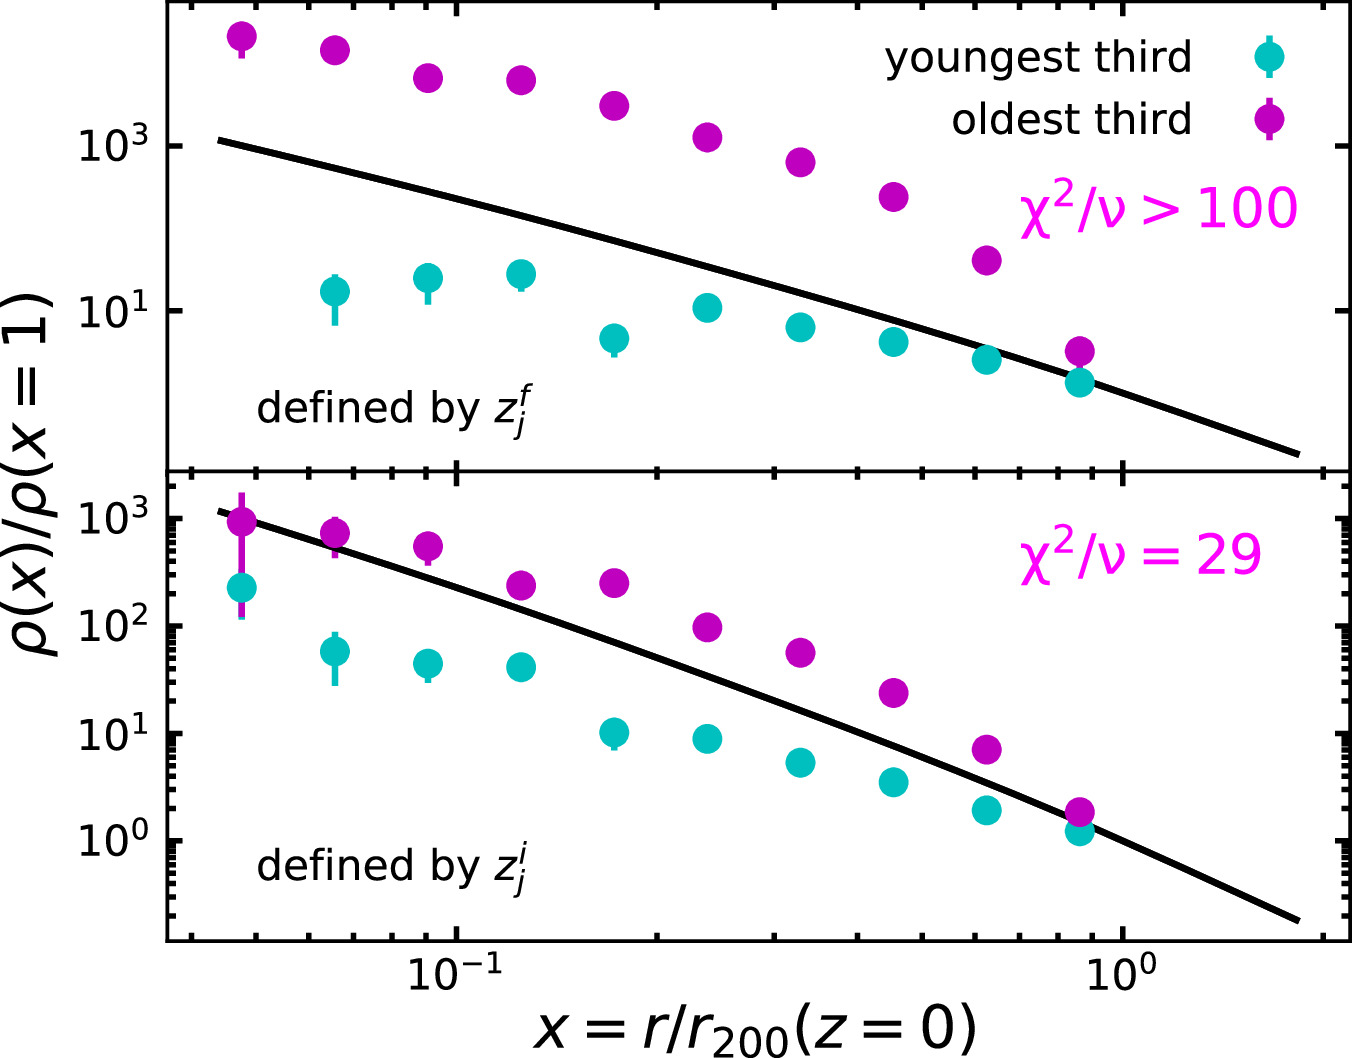
Figure 2. Normalized satellite number density profiles, computed separately for the oldest one-third of the satellites (magenta points) and the youngest one-third of the satellites (cyan points). The agreement between the profiles of the oldest satellites and the Navarro–Frenk–White profile of their hosts (black line) is quantified by the reduced χ2 statistic, provided in each panel. Top: “ages” of the satellites are determined by the redshift at which they joined their hosts’ halos for the final time, zj f . Bottom: “ages” of the satellites are determined by the redshift at which they initially joined their hosts’ halos, zj i .
Download figure:
Standard image High-resolution imageFor the oldest satellites in Figure 2, only 47 are located at x > 0.7 when the sample is defined using zj f , while 206 are located at x > 0.7 when the sample is defined using zj i . This is due to the inclusion of splashback satellites when zj i is used as the joining redshift (i.e., splashback satellites are counted as having joined their hosts’ halos upon their first entrances). Indeed, for x > 0.7, 98% of the oldest satellites as defined by zj i are splashback galaxies, compared to only 57% when the sample is defined by zj f . In the published work, the exclusion of many splashback galaxies from the number density profile of the oldest satellites resulted in an underestimate of ρ(x = 1), leading to an artificial inflation of the normalized densities at smaller host-satellite separations. The number density profile of the oldest satellites as defined by zj i still rises above the host mass density profile for large host-satellite separations but is in agreement with the mass density profile for x < 0.07.
It is clear from Figure 2 that defining the sample by zj i rather than zj f improves the agreement of the satellite number density profile with the host density profile (black line). However, the number density profile of the oldest satellites as defined by zj i still does not agree with the host mass density profile (χ2/ν = 29). Thus, the qualitative results of the published article are unchanged: there is no population of satellites whose number density profile is in good agreement with their host mass density profile.
In closing, we note that B. McDonough & R. Dsouza (2024) explore the consequences of adopting a joining redshift based on the first time a satellite enters a sphere defined by the host’s instantaneous virial radius, rather than the host’s virial radius at z = 0.
Acknowledgments
We would like to thank the anonymous reviewer for comments that led to a substantial improvement in this erratum, Reuben Dsouza for contributions to the code we used here, and the TNG collaboration for providing public access to the simulation data. This work was partially supported by National Science Foundation grant AST-2009397 and a Summer 2021 Massachusetts Space Grant Fellowship.