ABSTRACT
We present a new measurement of the α-spectroscopic factor (Sα) and the asymptotic normalization coefficient for the 6.356 MeV 1/2+ subthreshold state of 17O through the 13C(11B, 7Li)17O transfer reaction and we determine the α-width of this state. This is believed to have a strong effect on the rate of the 13C(α, n)16O reaction, the main neutron source for slow neutron captures (the s-process) in asymptotic giant branch (AGB) stars. Based on the new width we derive the astrophysical S-factor and the stellar rate of the 13C(α, n)16O reaction. At a temperature of 100 MK, our rate is roughly two times larger than that by Caughlan & Fowler and two times smaller than that recommended by the NACRE compilation. We use the new rate and different rates available in the literature as input in simulations of AGB stars to study their influence on the abundances of selected s-process elements and isotopic ratios. There are no changes in the final results using the different rates for the 13C(α, n)16O reaction when the 13C burns completely in radiative conditions. When the 13C burns in convective conditions, as in stars of initial mass lower than ∼2 M☉ and in post-AGB stars, some changes are to be expected, e.g., of up to 25% for Pb in our models. These variations will have to be carefully analyzed when more accurate stellar mixing models and more precise observational constraints are available.
1. INTRODUCTION
Approximately half of the elements heavier than iron in the universe are produced via a series of slow neutron capture reactions and competing β-decays (the s-process). During the s-process, the neutron number density is relatively low, of the order of 107 cm−3. When the flux reaches an unstable nucleus, it typically decays rather than captures another neutron and the s-process proceeds via the isotopes around the valley of β-stability (e.g., Burbidge et al. 1957). The astrophysical sites of the s-process are core He and shell C burning in massive stars for the elements lighter than Sr (Pignatari et al. 2010), and the “He intershell” of asymptotic giant branch (AGB) stars for the elements between Sr and Bi (Gallino et al. 1998). Stars with initial masses lower than roughly 9 M☉ reach the AGB phase in the final phases of their evolution, when both H and He have been exhausted in the core, leaving C and O in electron-degenerate conditions. Production of nuclear energy occurs in the H and He shells, which are located between the core and the extended convective envelope and are separated by the thin He intershell layer. AGB stars experience thermal pulses (TPs) when the usually dormant He-burning shell is suddenly activated. A large amount of energy is released, which drives convection in the He intershell. During TPs the star expands and cools and the H-burning shell is inactive. While He burning proceeds from the convective to the radiative regime, and eventually switches off, the convective envelope can penetrate the underlying He intershell and carry to the surface the products of He burning, in particular carbon and the elements heavier than iron made by the s-process. This mixing process is known as the “third dredge-up” (TDU). After the TDU ends, the star contracts and heats up again and H burning resumes until another TP occurs and the cycle is repeated. This sequence of events can occur from a few times to hundreds of times, depending on the stellar mass and the mass-loss rate. AGB stars suffer from very strong stellar winds, which erode the envelope roughly within a million years and shed the newly synthesized material mixed to the surface by the TDU into the interstellar medium. Eventually, the C–O degenerate core is left as a cooling white dwarf (see Herwig 2005, for a review on AGB stars).
According to the current standard model (Gallino et al. 1998; Busso et al. 1999; Goriely & Mowlavi 2000; Lugaro et al. 2003b; Cristallo et al. 2009b), some protons must diffuse from the convective envelope into the He intershell at the end of each TDU in order to produce enough 13C to account for the observed abundances of the s-process elements at the surface of AGB stars (see also Busso et al. 2001). A thin layer is then produced, known as the 13C “pocket” which is rich in 13C made via 12C(p, γ)13N(β+ν)13C. When the temperature in this region reaches about 9 × 10⁷ K, the 13C(α, n)16O reaction is activated and generates neutrons that trigger the s-process (Hollowell & Iben 1988; Gallino et al. 1988; Käppeler et al. 1990, 2011).
Considerable effort has been devoted to the direct measurement of the 13C(α, n)16O cross section (Sekharan et al. 1967; Davids 1968; Bair & Haas 1973; Kellogg et al. 1989; Drotleff et al. 1993; Brune et al. 1993; Harissopulos et al. 2005; Heil et al. 2008). These measurements have been performed at energies down to 270 keV, whereas the Gamow window is at 190 ± 40 keV, corresponding to a temperature of 100 MK. Since this energy is far below the Coulomb barrier, the reaction cross section is extremely small and direct measurement is sensitively limited by background signals and very difficult to perform in laboratories on Earth's surface. While a measurement has been proposed at the underground laboratory of LUNA (Costantini et al. 2009), at present, the experimental cross sections have to be extrapolated below 270 keV. A microscopic cluster model analysis of the 13C(α, n)16O and 13C(α, α) reactions by Descouvemont (1987) suggested that this extrapolation is critically affected by the 1/2+ subthreshold resonance in 17O (Ex = 6.356 MeV, just 3 keV below the α-decay threshold). The contribution from this resonance depends strongly on the α-width of the 1/2+ state in 17O, which can be derived from the spectroscopic factor (Sα) or the asymptotic normalization coefficient (ANC) of the α-cluster in this state.
The Sα and the ANC can be determined from the angular distribution of the direct α-transfer reaction using distorted-wave Born approximation (DWBA) or coupled reaction channel (CRC) analysis. Although three indirect measurements via the (6Li, d) or the (7Li, t) system have been performed by Kubono et al. (2003), Johnson et al. (2006), and Pellegriti et al. (2008) to study the Sα or the ANC of the 1/2+ state, a significant discrepancy of up to a factor of ∼30 still exists in the derived Sα and ANC. Therefore, it is interesting to perform a new measurement of the Sα and the ANC via an independent transfer reaction. In addition, it is necessary to understand the impact of the different resulting 13C(α, n)16O rates on the s-process nucleosynthesis in AGB stars.
In this paper, we determine a new stellar rate of the 13C(α, n)16O reaction and incorporate it in calculations of the s-process nucleosynthesis in AGB stars. First, we measure the angular distribution of the 13C(11B, 7Li)17O reaction to determine the Sα and the ANC for the 1/2+ state in 17O. Using this experimental ANC we derive the α-width for the 1/2+ subthreshold resonance, which is currently the most uncertain parameter for determining the 13C(α, n)16O rate. Finally, we use the new rate and different rates available in the literature as input for simulations of AGB stars to study their influence on the abundance of some selected s-process elements and isotopic ratios.
2. MEASUREMENT AND EVALUATION OF THE ANC
2.1. Experimental Procedure
The measurement of the angular distribution for the 13C(11B, 7Li)17O reaction was performed at the HI-13 tandem accelerator of the China Institute of Atomic Energy in Beijing. We used a 11B beam with an energy of 50 MeV leading to the production of the excited states in 17O at Ex = 3.055 MeV, 3.843 MeV, 4.554 MeV, and 6.356 MeV. The angular distribution of the elastic scattering for the entrance channel (11B + 13C) was also measured. We used a self-supporting 13C target with a thickness of 75 ± 6 μg cm−2 and an initial purity of 88%. A 26 MeV 7Li beam was also delivered for measurement of the exit channel (7Li + 17O) elastic scattering. Natural silicon monoxide of 86 ± 7 μg cm−2 was prepared onto a 40 ± 3 μg cm−2 carbon foil, serving as the oxygen target. In addition, a self-supporting 12C target of 66 ± 5 μg cm−2 was used for calibration of the focal plane and background subtraction during the entire experiment.
To monitor the possible buildup of 12C, the 11B elastic scattering on the 13C target was measured at the start and at the end of the measurement for each angle. This showed that the 12C buildup was negligible compared to the initial impurity in the 13C target, possibly due to the rather low gas pressure (⩽10−6 mbar) in the reaction chamber. To determine the absolute amount of 12C in the 13C target we measured the angular distributions of the 11B+12C elastic scattering with both the natural 12C target and the enriched 13C target. The absolute amounts of 12C and 13C in the 13C target were found to be 9.0 ± 0.7 and 66 ± 5 μg cm−2, respectively.
The beam current was measured by a Faraday cup covering an angular range of ±6° in a laboratory frame and used for the absolute normalization of the cross sections at θlab > 6°. The Faraday cup was removed when measuring the cross sections at θlab ⩽ 6°. A Si ΔE − E telescope located at θlab = 25° was employed for the relative normalization of the cross sections at θlab ⩽ 6° by measuring the elastic scattering of the incident ions on the targets. In addition, the ratio of current integration in the Faraday cup to the elastic scattering events was measured at the start and the end of the measurement for each angle θlab ⩽ 6° by restoring the Faraday cup. The ratios changed by less than 2%, which thus led to a reliable normalization of the cross sections at θlab ⩽ 6°.
The reaction products were focused and separated by a Q3D magnetic spectrograph and recorded by a two-dimensional position-sensitive silicon detector (PSSD, 50 × 50 mm) fixed at the focal plane of the spectrograph. The two-dimensional position information from the PSSD enabled the products emitted into the acceptable solid angle to be recorded completely. The energy information from the PSSD was used to remove the impurities with the same magnetic rigidity.
Due to the presence of 12C in the 13C target, the 7Li events from the 13C(11B, 7Li)17O* (6.356 MeV) reaction were mixed with those from the 12C(11B, 7Li)16O* (6.917 MeV) reaction. To evaluate this background the (11B, 7Li) reactions were measured for both the 13C and 12C targets at each angle with the same experimental setup. As an example, in Figure 1 we display the focal-plane position spectra of 7Li at θlab = 10° from the (11B, 7Li) transfer reactions. The background from 12C accounts for approximately half of the total events from the 13C target. After background subtraction and beam normalization, the angular distributions of the elastic scattering and the 13C(11B, 7Li)17O* (6.356 MeV) reaction were obtained, as presented in Figures 2 and 3. In Figure 3, we also display the angular distributions of the 13C(11B, 7Li)17O reaction leading to the other three states (Ex = 3.055 MeV, 3.843 MeV, and 4.554 MeV). Note that the measurements for these three states were not affected by the 12C background.
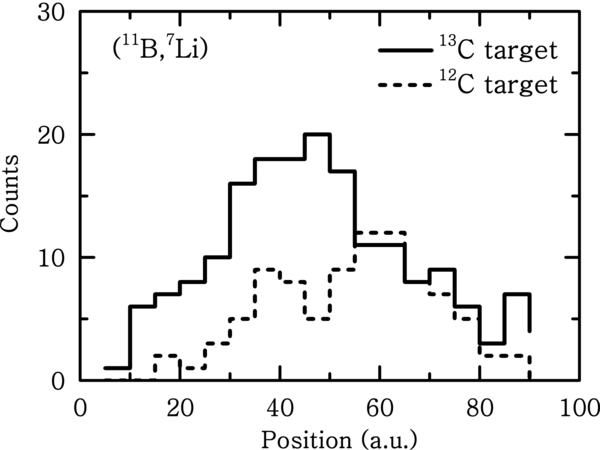
Figure 1. Focal-plane position spectra of the 7Li events at θlab = 10° from the α-transfer reactions. The solid and dashed lines denote the results from the enriched 13C target and natural 12C target, respectively.
Download figure:
Standard image High-resolution image
Figure 2. Angular distributions of the 11B+13C elastic scattering at incident energy of 50 MeV and the 7Li+16O elastic scattering at incident energy of 26 MeV. The solid curves represent the calculations with the fitted OMP parameters.
Download figure:
Standard image High-resolution image
Figure 3. Angular distributions of the 13C(11B, 7Li)17O reaction leading to the excited states at Ex = 3.055 MeV, 3.843 MeV, 4.554 MeV, and 6.356 MeV. The curves denote the DWBA calculations with the fitted OMP parameters. DWBA1 and DWBA2 represent the results using the spectroscopic amplitudes of 11B from Rudchik et al. (2005) and Kurath (1973), respectively.
Download figure:
Standard image High-resolution image2.2. Extraction of the ANC
The finite-range DWBA method with the FRESCO code (Thompson 1988) was used to analyze the experimental angular distributions of the transfer reaction. The optical model potential (OMP) parameters for the entrance and exit channels were obtained by fitting the experimental angular distributions of the 11B + 13C and 7Li + 16O elastic scattering, respectively (Figure 2). Full complex remnant term interactions were included in the transfer reaction calculations. The parameters of the core–core (7Li + 13C) potential of Cook et al. (1987) gave a reasonable account of the elastic scattering of 7Li from 13C at 34 MeV. The parameters used in the DWBA calculations are listed in Table 1.
Table 1. OMP Parameters Used in the Present DWBA Calculation
| Channel | Ein | V | rv | av | W | rw | aw |
|---|---|---|---|---|---|---|---|
| 11B+13C | 50.0 | 182.64 | 0.788 | 0.740 | 8.193 | 1.250 | 0.740 |
| 7Li+17O | 26.0 | 114.20 | 0.737 | 0.719 | 34.602 | 0.997 | 0.764 |
| 7Li+13C | 31.8 | 159.00 | 0.630 | 0.810 | 8.160 | 1.330 | 0.780 |
Notes. Ein denotes the incident energy in MeV for the relevant channels, V and W are the depths (in MeV) of the real and imaginary parts of Woods–Saxon potential, and r and a are the radius and diffuseness (in fm) of Woods–Saxon potential.
Download table as: ASCIITypeset image
To obtain the spectroscopic factor (Sα) and the ANC of the α-cluster in 17O the spectroscopic amplitudes of the α-cluster in the ground state of 11B need to be fixed. The single-particle wave function describing the relative motion between α-cluster and 7Li core in the 11B ground state can have two components denoted by quantum numbers NLj = 3S0 and 2D2, respectively, where N is the number of radial nodes that include the origin but not the infinity and L and j are the orbital and total angular momenta, respectively. The spectroscopic amplitudes of these two components are −0.509 and 0.629, respectively, from a shell model calculation (Kurath 1973), and −0.638 and −0.422, respectively, from the translationally invariant shell model (Rudchik et al. 2005). In the present analysis, both sets of spectroscopic amplitudes were used and the resulting difference was incorporated in the total uncertainty of our result.
The α-cluster single-particle wave functions were calculated using conventional Woods–Saxon potentials whose depths were adjusted to reproduce the binding energies of the α-cluster in the ground state of 11B and in the four states of 17O. The quantum numbers NLj for the α-cluster in the 6.356 MeV 1/2+ state of 17O were fixed to be 4P1 by the oscillatory energy conservation relation 2(N − 1) + L = ∑4i = 12(ni − 1) + li, where ni, li are the corresponding single-nucleon shell quantum numbers. In addition, the quantum numbers for the α-cluster in the other three states, 3.055 MeV 1/2−, 3.843 MeV 5/2−, and 4.554 MeV 3/2−, were determined to be 4S0, 3D2, and 3D2, respectively.
The geometry parameters, radius r0 and diffuseness a, of the Woods–Saxon potential for the α-cluster in 11B were adjusted to give the root mean square (rms) radius ( fm) of the α-cluster wave function. This was calculated using the following relation between cluster sizes and their mean distances within a nucleus,

where the rms radii of 4He, 7Li, and 11B were taken to be 1.47 fm, 2.384 fm, and 2.605 fm, respectively (Liatard et al. 1990). The resulting parameters are r0 = 0.92 fm and a = 0.65 fm. We investigated the dependence of the calculated Sα and ANC on the geometry parameters for 11B. With a diffuseness between 0.65–0.75 fm, the radius was adjusted to reproduce the rms radius of 3.204 fm. The impact of this change on the Sα was found to be less than 2%. We also investigated the dependence of the Sα and the ANC on the geometry parameters for 17O using the same range of r0 (0.9–1.06 fm) and a (0.60–0.76 fm) that was selected by maximum likelihood function set at the 3σ level by Pellegriti et al. (2008). Using steps of 0.02 fm for both r0 and a, 81 sets of geometry parameters were obtained and used to calculate 81 values of the Sα and the ANC. Their standard deviations were taken as the uncertainty deriving from the geometry parameters for 17O. The parameters r0 = 1.00 fm and a = 0.76 fm provide the best description for the angular distributions of the four states (see also Figure 3).
In Figure 3, we display the calculated angular distributions normalized to the experimental data for the 13C(11B, 7Li)17O reaction populating the 3.055 MeV, 3.843 MeV, 4.554 MeV, and 6.356 MeV states in 17O. For the 3.055 MeV state the Sα factor was found to be 0.19 ± 0.06, compatible with the values obtained from the (6Li, d) reaction (Sα ≈ 0.18–0.3) by Keeley et al. (2003) and from the (7Li, t) reaction (Sα = 0.27 ± 0.05) by Pellegriti et al. (2008). For the 3.843 MeV and 4.554 MeV states the Sα factors were found to be 0.078 ± 0.025 and 0.060 ± 0.019, respectively. These disagree with the values of 0.19–0.34 and 0.27–0.48, respectively, for the two states, given by Keeley et al. (2003), who adopted geometry parameters r0 = 1.25 fm and a = 0.65 fm for 17O and used a coupled-channel calculation to fit the data. When using these geometry parameters we were not able to reproduce our measured 13C(11B, 7Li)17O angular distributions of the four states and obtained an extremely small value of maximum likelihood function. For the 4.554 MeV state our result is consistent with that of Pellegriti et al. (2008), who found an Sα factor of 0.10 ± 0.05 via the (7Li, t) reaction.
The Sα for the 6.356 MeV 1/2+ state of 17O was derived to be 0.37 ± 0.12. The error results from the statistics (23%), the target thickness (8%), the uncertainties from the spectroscopic amplitudes (3%) for 11B, the geometry parameters (2%) for 11B, and the geometry parameters (20%) for the 1/2+ state of 17O. The square of the Coulomb modified ANC ( ) was then extracted to be 4.0 ± 1.1 fm−1 using the relation,
  , where ϕ(R) is the radial single-particle wave function for the α-cluster in the 1/2+ state of 17O, and
  is the Coulomb-modified Whittaker function, with Γ(L + 1 + η) being the gamma function and η the Coulomb parameter. The uncertainty in the ANC of 27.5% is smaller than that in the Sα of 32.4%. This is because the variation of the geometry parameters yields a change in ϕ(R) that is opposite in sign to the change in Sα so the uncertainty from the 17O geometry parameters in
  of 12% is smaller than that in Sα of 20%.
2.3. Different Evaluations of the ANC
Three independent measurements in addition to the present work have been performed to date to study the ANC or the Sα of the 1/2+ state in 17O. A very small spectroscopic factor (Sα ∼ 0.011) was found via measurement of the 13C(6Li, d)17O angular distribution with an incident energy of 60 MeV (Kubono et al. 2003). This indicated that the contribution of the 1/2+ subthreshold resonance is negligible. However, a reanalysis of the same experimental data showed that the DWBA analysis of Kubono et al. (2003) could be flawed (Keeley et al. 2003). These authors derived larger Sα factors of 0.36 and 0.40 via DWBA and CRC calculations, respectively. Johnson et al. (2006) measured the 6Li(13C, d)17O angular distribution at sub-Coulomb energies (8 and 8.5 MeV) and derived  = 0.89 ± 0.23 fm−1. Pellegriti et al. (2008) measured the 13C(7Li, t)17O angular distribution with two incident energies (28 and 34 MeV). The Sα and
  were found to be 0.29 ± 0.11 and 4.5 ± 2.2 fm−1, respectively.
In Table 2, we list the Sα and  values from the present study and from the literature sources mentioned above. Good agreement for the Sα and
  is found between Keeley et al. (2003), Pellegriti et al. (2008), and the present work, which used three different transfer systems and covered an energy range of 4–10 MeV/u. This indicates that the Sα and ANC for the 1/2+ state of 17O should not significantly depend on the selection of transfer systems and incident energies. On the other hand, the
  obtained from the 6Li(13C, d) reaction at sub-Coulomb energies by Johnson et al. (2006) is about five times smaller than that obtained in the present work and by Pellegriti et al. (2008). The sub-Coulomb (6Li, d) α-transfer cross section was recently remeasured to understand the source of this discrepancy and the data analysis is in progress (G. V. Rogachev 2012, private communication). It remains to be seen if this analysis will result in a revised value of
  .
.
Table 2. The Sα and ANC ( ) as Derived from Different Measurements for the 1/2+ Subthreshold State of 17O
| Reference | Transfer System | Incident Energy | Sα |  |
|---|---|---|---|---|
| (MeV) | (fm−1) | |||
| Kubono et al. (2003) | 13C(6Li, d) | 60 | 0.011 | |
| Keeley et al. (2003) | 13C(6Li, d)a | 60 | 0.36–0.40b | |
| Johnson et al. (2006) | 6Li(13C, d) | 8.0 and 8.5 | 0.89 ± 0.23 | |
| Pellegriti et al. (2008) | 13C(7Li, t) | 28 and 34 | 0.29 ± 0.11 | 4.5 ± 2.2 |
| Present work | 13C(11B, 7Li) | 50 | 0.37 ± 0.12 | 4.0 ± 1.1 |
Notes. aReanalysis of the experimental data of Kubono et al. (2003). bSee Table 3 of Keeley et al. (2003); these values also depend on different normalization procedures used in their work.
Download table as: ASCIITypeset image
3. THE 13C(α, n)16O REACTION RATE
The astrophysical S-factor of the 13C(α, n)16O reaction via the resonances can be calculated with the Breit–Wigner formula,

where μ is the reduced mass of the α + 13C system; ER represents the resonance energy; JR, Jp, and Jt are the spins of the excited states in 17O, α, and 13C, respectively; Γα, Γn, and Γtot denote the α-, neutron-, and total widths, respectively; and Q is the reaction Q-value of 13C(α, n)16O.
For the resonances above the α-threshold, the energy dependence of these partial widths is given by

and

where Γα(ER) and Γn(ER) denote the experimental α- and neutron-widths, respectively;  is the α-penetrability; and li and lf are the orbital angular momenta for the α and neutron in the excited states of 17O, respectively (see, e.g., Iliadis 2007).
For the subthreshold resonance, the energy dependence of the neutron-width can also be obtained by Equation (4), while the dependence of the α-width is expressed as

Here the reduced α-width γ2α can be given by

and was extracted to be 12.7 ± 3.5 keV at the channel radius Rc = 7.5 fm. This large radius was chosen to reach the Coulomb asymptotic behavior of ϕ(R), as suggested by Descouvemont (1987) and Pellegriti et al. (2008).
In Table 3, we list the resonant parameters for the 1/2+ subthreshold state employed to obtain the astrophysical S-factor of the 1/2+ subthreshold resonance in 13C(α, n)16O. The uncertainties in the S-factor were investigated by varying γ2α, ER, and Γn(ER). We also investigated the dependence of the S-factor on the channel radius by changing Rc from 6 fm to 7.5 fm. The S-factor at the Gamow peak of 190 keV, S(190), was derived to be (8.4 ± 2.3)×105 MeV b. The error is dominated by the uncertainty in the resonant parameters for the 1/2+ subthreshold state. The uncertainty from the channel radius is 4% in S(190), varying slightly with the energy.
Table 3. Resonant Parameters for 17O Used in the Present Calculations
| Level | Ex | ER | Jπ | Γn(ER) | Γα(ER) | γ2α |
|---|---|---|---|---|---|---|
| (keV) | (keV) | (keV) | (keV) | (keV) | ||
| 1 | 6356 | −3 | 1/2+ | 124 | 12.7a | |
| 2 | 7165 | 806 | 5/2− | 1.38 | 0.0033 | |
| 3 | 7201 | 842 | 3/2+ | 340b | 0.08b | |
| 4 | 7378 | 1019 | 5/2+ | 0.64 | 0.01 | |
| 5 | 7381 | 1022 | 5/2− | 0.96 | 0.003 | |
| 6 | 7558 | 1199 | 3/2− | 500 | 0.08 | |
| 7 | 7688 | 1329 | 7/2− | 13 | 0.01 | |
| 8 | 7956 | 1597 | 1/2+ | 84 | 6.7 | |
| 9 | 7991 | 1632 | 1/2− | 250 | 16 | |
| 10 | 8058 | 1699 | 3/2+ | 71 | 15 | |
| 11 | 8200 | 1841 | 3/2− | 48 | 4.0 | |
| 12 | 8342 | 1983 | 1/2+ | 8.1 | 2.2 |
Notes. Ex and ER represent level energy and resonant energy, respectively. Ex, ER, Jπ, Γn(ER), and Γα(ER) are taken from the compilation by Tilley et al. (1993). aReduced α-width from this work. bThe α- and neutron-widths for the 3/2+ resonance at ER = 842 keV were adjusted to provide the best fitting of the experimental data, which resulted in broader partial widths than the recommended values [Γn(ER) = 280 keV, Γα(ER) = 0.07 keV] of Tilley et al. (1993).
Download table as: ASCIITypeset image
We calculated the total S-factor of 13C(α, n)16O by including the properties of the 17O states up to 8.342 MeV from the compilation of Tilley et al. (1993), and considering their interferences. However, the resulting total S-factor did not agree with the data from the direct measurements of Drotleff et al. (1993), who measured the S-factor at the lowest energies to date, and of Heil et al. (2008), who performed a systematic experimental verification of neutron efficiency over a range of well-defined energies. Moreover, the resonant structure near the 3/2+ resonance at ER = 0.842 MeV was not well reproduced using the parameters from Tilley et al. (1993). Hence, we adjusted the α- and neutron-widths for this state to provide the best fit of the experimental data. The fitting resulted in broader partial widths [Γα(ER) = 0.08 keV, Γn(ER) = 340 keV] than the recommended values of Tilley et al. (1993) [Γα(ER) = 0.07 keV, Γn(ER) = 280 keV], in agreement with Pellegriti et al. (2008) and Heil et al. (2008). All resonant parameters used in the present calculations are listed in Table 3.
In Figure 4, we display the resulting astrophysical 13C(α, n)16O S-factor as a function of the energy in the center of mass frame (Ec.m.). The uncertainty mainly results from the resonant parameters of the 1/2+ subthreshold state since the resonant parameters of the states above the α-emission threshold are relatively well constrained by fitting the experimental data. The contribution of the 1/2+ resonance results in a clear increase of the S-factor at lower energies. At the Gamow peak of 190 keV the 1/2+ subthreshold resonance dominates the 13C(α, n)16O reaction. At this energy the contribution of this resonance accounts for 61% of total S-factor.
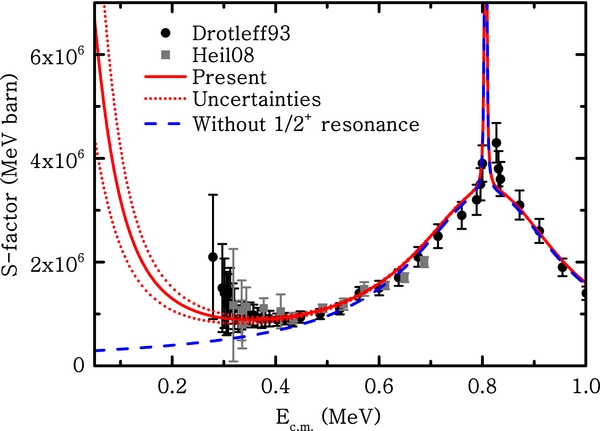
Figure 4. Astrophysical S-factor for the 13C(α, n)16O reaction. Dots and squares represent the data of Drotleff et al. (1993) and Heil et al. (2008), respectively. The solid and dotted (red) curves represent the present S-factor and its uncertainties. The dashed (blue) curve represents the S-factor by excluding the contribution of the 1/2+ subthreshold resonance.
Download figure:
Standard image High-resolution imageThe astrophysical 13C(α, n)16O reaction rate was calculated with the present S-factor using

where NA is Avogadro's number. In Table 4, we list the present adopted rate as a function of the temperature together with its upper and lower limits. In Figure 5, we compare the present rate with the previous compilations by CF88 (Caughlan & Fowler 1988) and NACRE (Angulo et al. 1999) and with other rates available in the literature (Denker et al. 1995; Kubono et al. 2003; Johnson et al. 2006; Pellegriti et al. 2008; Heil et al. 2008) at a temperature of 100 MK. Our rate agrees with that of Denker et al. (1995) and it is about two times smaller than the NACRE recommended rate, but within its lower limit. Both the rates by NACRE and those by Denker et al. (1995) were derived from an extrapolation of the lowest energy experimental data available to date of Drotleff et al. (1993). There is a large discrepancy of up to a factor of two between the present rate and the rates by CF88, Kubono et al. (2003), and Johnson et al. (2006) due to the fact that CF88 did not take into account the contribution of the 1/2+ subthreshold resonance and Kubono et al. (2003) and Johnson et al. (2006) found a significantly smaller contribution than ours of this resonance to the rate. Our rate is in good agreement with that of Pellegriti et al. (2008), who found a contribution of the subthreshold resonance similar to ours, and is consistent with that of Heil et al. (2008), who used an extensive multichannel R-matrix analysis to constrain the possible contribution from subthreshold resonances by taking into account all open reaction channels for the 13C + α and 16O + n systems.
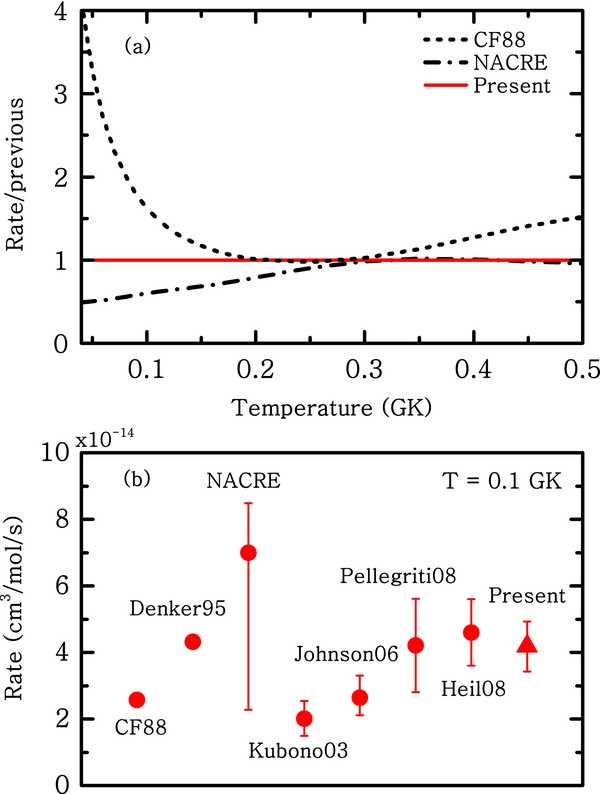
Figure 5. Comparison of the present 13C(α, n)16O rate with the previous results available in the literature (Caughlan & Fowler 1988; Denker et al. 1995; Angulo et al. 1999; Kubono et al. 2003; Johnson et al. 2006; Pellegriti et al. 2008; Heil et al. 2008). (a) Ratio of the present rate to the CF88 and NACRE compilations, in a temperature range of 0.04–0.5 GK. (b) Comparison of the present rate with those listed above at a temperature of 0.1 GK.
Download figure:
Standard image High-resolution imageTable 4. Numerical Values of the Present 13C(α, n)16O Rates (cm3 mol−1 s−1) with the Adopted Value, Upper Limits, and Lower Limits for the 0.04–3.0 GK Temperature Range and the Coefficients ai in Equation (8) for These Three Rates
| Reaction Rate | Coefficients | ||||||
|---|---|---|---|---|---|---|---|
| T9 | Adopted | Upper | Lower | ai | Adopted | Upper | Lower |
| 0.04 | 2.63 × 10⁻²⁴ | 3.41 × 10⁻²⁴ | 1.92 × 10⁻²⁴ | a1 | 79.3008 | 52.8016 | 87.5453 |
| 0.05 | 1.63 × 10⁻²¹ | 2.07 × 10⁻²¹ | 1.23 × 10⁻²¹ | a2 | −0.304890 | −0.204024 | −0.301248 |
| 0.06 | 2.17 × 10⁻¹⁹ | 2.70 × 10⁻¹⁹ | 1.67 × 10⁻¹⁹ | a3 | 7.43132 | −23.2591 | 9.17396 |
| 0.07 | 1.07 × 10⁻¹⁷ | 1.31 × 10⁻¹⁷ | 8.44 × 10⁻¹⁸ | a4 | −84.8689 | −42.4710 | −95.7947 |
| 0.08 | 2.67 × 10⁻¹⁶ | 3.21 × 10⁻¹⁶ | 2.14 × 10⁻¹⁶ | a5 | 3.65083 | 35.1371 | 4.66751 |
| 0.09 | 4.04 × 10⁻¹⁵ | 4.78 × 10⁻¹⁵ | 3.28 × 10⁻¹⁵ | a6 | −0.148015 | −17.3173 | −0.221941 |
| 0.10 | 4.19 × 10⁻¹⁴ | 4.90 × 10⁻¹⁴ | 3.46 × 10⁻¹⁴ | a7 | 37.6008 | 6.45708 | 40.9578 |
| 0.15 | 1.67 × 10⁻¹⁰ | 1.86 × 10⁻¹⁰ | 1.46 × 10⁻¹⁰ | a8 | 62.5775 | 64.3536 | 63.1390 |
| 0.20 | 3.33 × 10⁻⁸ | 3.59 × 10⁻⁸ | 3.03 × 10⁻⁸ | a9 | −0.0277331 | −0.302435 | 0.0195985 |
| 0.30 | 3.09 × 10⁻⁵ | 3.20 × 10⁻⁵ | 2.96 × 10⁻⁵ | a10 | −32.3917 | 3.36966 | −34.5026 |
| 0.50 | 8.06 × 10⁻² | 8.12 × 10⁻² | 7.98 × 10⁻² | a11 | −48.9340 | −64.0633 | −47.2196 |
| 1.0 | 2.44 × 10² | 2.45 × 10² | 2.44 × 10² | a12 | 44.1843 | 1.62313 | 44.0189 |
| 2.0 | 5.99 × 10⁴ | 6.00 × 10⁴ | 5.97 × 10⁴ | a13 | −20.8743 | 0.00566612 | −20.9558 |
| 3.0 | 6.12 × 10⁵ | 6.13 × 10⁵ | 6.10 × 10⁵ | a14 | 2.02494 | 31.1730 | 0.905521 |
Note. The overall fitting errors are all less than 7% at temperatures from 0.04 to 10.0 GK.
Download table as: ASCIITypeset image
For convenience, we fitted our rate with the expression used in the astrophysical reaction rate library REACLIB (Thielemann et al. 1987; Rauscher & Thielemann 2001),

Here, T9 is the temperature in units of 1 GK. The coefficients ai for our adopted value and lower and upper limits of the 13C(α, n)16O reaction rate are listed in Table 4. The overall fitting errors are less than 7% at temperatures from 0.04 to 10 GK.
4. ASTROPHYSICAL IMPLICATIONS FOR s-PROCESS NUCLEOSYNTHESIS IN AGB STARS
To assess and understand the impact of the new rates of the 13C(α, n)16O reaction, we used a post-processing code where a nuclear network of 320 species (from H to Bi) and 2336 reactions is solved simultaneously with mixing within the star when convective regions are present. We used stellar structure inputs, such as temperature, density, and convective velocity, calculated previously by the Stromlo stellar structure code (Lattanzio 1986) including mass loss on the AGB phase with the prescription of Vassiliadis & Wood (1993). We included the formation of the 13C pocket by artificially allowing an exponentially decreasing proton profile to form just below the base of the convective envelope at the end of each TDU episode over a mass of 0.002 M☉ (roughly 1/10th of the mass of the He intershell, in the low-mass AGB models considered here). The details of this procedure and the codes used to compute the models have been described previously (e.g., Lugaro et al. 2004; Karakas et al. 2009).
We considered four models, which are summarized in Table 5: an M = 3 M☉ model of metallicity Z = 0.02 similar to that discussed by Lugaro et al. (2003b), an M = 1.8 M☉ model of Z = 0.01 from Karakas et al. (2010), and M = 1 M☉ and M = 1.5 M☉ models of Z = 0.0001 from Lugaro et al. (2012). We selected these models for three reasons. (1) Models of higher masses probably do not experience the 13C neutron source as protons burn while being ingested in the He intershell, preventing the formation of the 13C pocket (Goriely & Siess 2004; Herwig 2004). It is still not clear what the effect of this burning is on the whole stellar structure and the s-process, but it seems reasonable to us for the time being to not include a 13C pocket for masses larger than ∼4 M☉. In these massive AGB stars, the temperature in the TPs exceeds 300 MK so that the 22Ne(α, n)25Mg reaction is activated and likely plays the role of the main neutron source (van Raai et al. 2012). (2) The 13C in the pocket normally burns before the onset of the following TP (Straniero et al. 1995); however, in some cases the temperature may not be high enough for this to happen and some 13C could be left over to burn in the following TP (see also Cristallo et al. 2009b). In our lowest-mass models the first few 13C pockets are ingested in the following TP while they still contain a relatively large amount of 13C. These models are thus qualitatively different from the M = 3 M☉ model where 13C always burns before the onset of the next TP. In detail, we have 6, 15, and 2 TDU episodes in the M = 1.8 M☉ model of Z = 0.01, and the M = 1.5 M☉ and M = 1 M☉ models of Z = 0.0001, respectively. These numbers also represent the number of 13C pockets introduced in each model, since a 13C pocket is introduced after each TDU episode. Of these 13C pockets, the first 4 and 3 for the M = 1.8 M☉ and M = 1.5 M☉ models, respectively, are ingested in the following TP while the abundance of 13C by number is still higher than 10−4. The same occurs for both the 13C pockets introduced in the M = 1 M☉ model. As the AGB star evolves the temperature in the He intershell increases so that this effect disappears for later 13C pockets. The exact number of ingested 13C pockets relative to their total number increases with decreasing the stellar mass and increasing the metallicity. This is because the temperature decreases for lower masses and higher metallicities and thus the chance of some unburnt 13C surviving to be ingested in the next TP is higher. (3) Finally, the low-mass and low-metallicity models (1 M☉ and 1.5 M☉, Z = 0.0001) present a further regime for the activation of the 13C neutron source. Proton ingestion episodes occur in the first few TPs during which a small amount of protons are ingested directly inside the TPs and thus some extra 13C is produced and burnt inside these convective regions (Cristallo et al. 2009a; Lugaro et al. 2012). In Figure 6, we schematically illustrate the location in time and space where the different regimes operate within the thermally pulsating structure of an AGB star and indicate the models where the regimes occur.
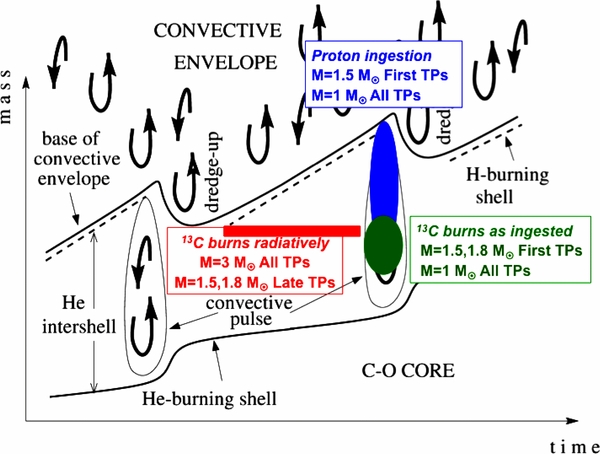
Figure 6. Schematic diagram of the evolution of the structure of an AGB star with the superimposed locations where neutrons are released by the 13C neutron source in the different regimes described in the text. Also indicated are the masses of the models and the typical TPs where each regime occurs.
Download figure:
Standard image High-resolution imageTable 5. Summary of the Stellar Models
| Mass | Metallicity | Number of 13C Pockets |
|---|---|---|
| (M☉) | (Z) | |
| 1.0 | 0.0001 | 2 |
| 1.5 | 0.0001 | 15 |
| 1.8 | 0.01 | 6 |
| 3.0 | 0.02 | 16 |
Download table as: ASCIITypeset image
In Figure 7, we display the variations of the abundance of some selected s-process elements and isotopic ratios at stellar surface at the end of the evolution obtained from our models using the present 13C(α, n)16O rate with respect to the two compilations, CF88 and NACRE, respectively (see Figure 5 for a comparison of reaction rates). The results obtained using the rates from Pellegriti et al. (2008), Heil et al. (2008), and Denker et al. (1995) agree with the present rate within 10% for all the models. The rate from Johnson et al. (2006) produces larger variations, but always within those reported for the CF88 and NACRE rates. Using the rate from Kubono et al. (2003) on the other hand produces variations outside of the ranges in Figure 7, e.g., Pb is up to 40% lower than the value obtained using the present rate. We chose to plot the elements representing the first s-process peak (Sr), the second s-process peak (Ba), and the third s-process peak (Pb). These can be observed in stars and provide a description of the overall s-process distribution, which is a function of the total time-integrated neutron flux. We further plot two isotopic ratios: 96Zr/94Zr and 86Kr/82Kr. These are sensitive to the activation of the branching points at 95Zr and 85Kr, respectively, and thus to the local value of the neutron density. These ratios can be measured in meteoritic stardust silicon carbide (SiC) grains that originated in C-rich AGB stars. We also report on the production of fluorine, however, we find that its production is not significantly sensitive (by ≃10% at most) to the choice of the 13C(α, n)16O reaction rate in all four models (see also Lugaro et al. 2004).

Figure 7. Percent of the variations of the abundance and isotopic ratios when using the present rate with respect to the CF88 and NACRE compilations. The horizontal coordinates denote fluorine and the selected s-process elements (Sr, Ba, Pb) and isotopic ratios (86Kr/82Kr, 96Zr/94Zr). Panels (a)–(d) show the results for the models of M = 1.0 M☉, M = 1.5 M☉, M = 1.8 M☉, and M = 3.0 M☉, respectively. See the text for details.
Download figure:
Standard image High-resolution imageIn the 1.8 M☉, Z = 0.01 model, we find that the overall s-process distribution changes when different 13C(α, n)16O rates are used. The present rate produces 16% more Ba and 25% more Pb than the slower CF88 rate. On the other hand, the present rate results in a 14% lower abundance of Pb than the faster NACRE rate. These differences are a signature of a different efficiency of the s-process. A lower efficiency produces less Ba and Pb than Sr because for the neutron capture flux to reach Ba and Pb, higher number of neutrons per Fe seed are required. A slower rate results in more 13C left over in the pocket to be engulfed in the following TP and the s-process is less efficient when 13C is engulfed in the TP than when 13C burns radiatively for two reasons. (1) In the radiative 13C pocket there is no mixing among the different layers of the pocket and thus 14N nuclei produced in the region of the pocket where the initial number of proton is higher than 0.01 are not mixed to the 13C-rich layer. This produces the highest s-process efficiency because 14N is a neutron poison via the 14N(n, p)14C reaction, which removes neutrons from being captured by Fe seeds and their progeny. In the convective TP instead 13C nuclei are mixed with the 14N present in the pocket as well as in the H-burning ashes. (2) The neutrons in the radiative 13C pocket are released over a very small mass (0.002 M☉ in our models), there are more neutrons present locally per initial Fe seed, and the flux of neutron captures can reach to the heaviest elements up to Pb. In the convective TP instead, the neutrons are released over a larger mass (∼0.01–0.02 M☉ in our models); there are less neutrons per Fe seed resulting in the production of the lighter s-process elements like Sr. The isotopic ratios plotted in Figure 7 behave in the opposite way of Pb because the local neutron density is higher, and thus branching points are more activated, when 13C is ingested in the TPs due to the higher temperature, resulting in a shorter burning timescale.
Interestingly, the low-metallicity Z = 0.0001 models present a result opposite from the Z = 0.01 model. For example, in the 1 M☉ model the present rate produces 25% less Pb than the slower CF88 rate. These stellar models have lower masses and a much larger fraction of 13C burns while ingested in the TP, together with 14N, due to both incomplete burning of the 13C pocket before the next TP and the proton ingestion episodes. As mentioned above, 14N acts as a neutron poison via the (n, p) channel, but at the same time it is destroyed by α-captures in the TP. Hence, the timescale of 13C ingestion and burning with respect to that of 14N has an impact on the final neutron flux. This could explain why slower 13C(α, n)16O rates produce more free neutrons since, if neutrons are released at later times, there is less 14N to capture them. In these conditions, one should also consider the effect of recycling of the protons made by the 14N(n, p)14C reaction. These protons can be captured by the abundant 12C to make more 13C, but also by 13C itself. It is difficult to evaluate analytically the final outcome of all these combined effects. Overall, our numerical models, which simultaneously solve mixing and burning in the TPs, indicate that the present rate results in a lower overall neutron flux than the CF88 rate. This is accompanied by a higher or a lower neutron density, depending on the stellar mass and the exact ratio of 13C burning convectively to 13C burning radiatively. Seventeen percent lower and 22% higher 86Kr/82Kr ratios, which are extremely sensitive to even small changes in the neutron density, are obtained for the 1 M☉ and 1.5 M☉ models, respectively.
In the 3 M☉, Z = 0.02 model we do not find any variations in the resulting abundances within 5%. This is because in this model 13C always completely burns before the onset of the next TP. The total integrated neutron flux is thus determined only by the initial amount of 13C in the pocket and not by how fast it burns. We would expect the same behavior for a more massive AGB model if a 13C pocket was to be considered in these cases. The isotopic ratios in this model are also not sensitive to the 13C(α, n)16O rate as they depend mainly on the neutrons released in the TPs when the 22Ne neutron source is marginally activated.
It is interesting to compare the predicted abundances of the s-process elements and isotopic ratios with the observations. We find that some differences up to 25% are predicted by the s-process models, particularly for Pb, when varying the 13C burning rates. Pb can be measured in carbon-enhanced metal-poor stars in the Milky Way halo, which are believed to carry the chemical signature of mass transfer from a more massive companion during its AGB phase. However, the spectroscopic abundances in s-process-enhanced stars are currently determined with typical uncertainties around 80% (see Table 2 of Masseron et al. 2010), larger than the differences found here. In addition, the formation of the 13C pocket itself is very uncertain and there is no agreement on exactly which mechanism drives it, and on the impact of processes such as rotation and magnetic fields. Also the details of the proton ingestion episodes found in our low-metallicity models depend on the treatment of convective borders in stars, one of the largest uncertainties in stellar modeling. Future observations with high-resolution and high signal-to-noise ratio spectra of low-metallicity stars, and further understanding of the formation of the 13C pocket and the proton ingestion episodes will be all important for better constraining the s-process model predictions.
Isotopic ratios affected by branching points are indicative of the 13C burning rate, even though also in this case, other uncertainties including the neutron capture cross section of the unstable nucleus at the branching point may have a more important effect. The 96Zr/94Zr ratio has been measured in S-type AGB stars and in meteoritic stardust SiC grains that originated from AGB stars of roughly solar metallicity. The data of 96Zr/94Zr from meteoritic grains are more precise (with uncertainties as low as 5%−10%; Lugaro et al. 2003a) than the data from S-type stars, where often it was only possible to derive upper limits (Lambert et al. 1995). The differences of 22% found here when changing the 13C(α, n)16O rate do not drastically change the interpretation of the data, which mostly indicate strong deficits in 96Zr, with respect to solar, and are matched overall by AGB models (Lugaro et al. 2003a). In the case of 86Kr/82Kr, stardust SiC data range from ∼0.5 to 2 of the solar ratio of 1.52 (Lewis et al. 1994). Our AGB models of metallicity around solar (Z = 0.01, 0.02), which are believed to well represent the parent stars of this stardust, only produce 86Kr/82Kr ratios lower than solar. However, Verchovsky et al. (2004) showed that the 86Kr atoms are probably implanted in SiC by the high-velocity winds experienced during the evolution that follows the AGB, the post-AGB, and the planetary nebula nucleus phases. The effect of the 13C(α, n)16O reaction rate needs to be evaluated with regard to the composition of Kr inside the He intershell, which is exposed to the surface during these final phases of the evolution instead of the surface abundances as done in the present work. In this context the possibility of a proton ingestion in the very late TP sometimes occurring during the post-AGB evolution also has to be taken into account. First simulations of this proton ingestion event by Herwig et al. (2011) have shown that the 13C(α, n)16O reaction rate plays a main role in determining the final abundances (see their Figure 12). These models need to be further investigated in relation to the present 13C(α, n)16O reaction rate and the 86Kr/82Kr ratios in SiC grains.
5. SUMMARY AND CONCLUSION
We determined the stellar rate of the 13C(α, n)16O reaction and incorporated the new reaction rate in calculations of the s-process nucleosynthesis in AGB stars. The Sα and ANC for the 6.356 MeV 1/2+ subthreshold state in 17O were obtained from the measurement of the 13C(11B, 7Li)17O angular distribution. This provided an independent examination to shed some light on the existing discrepancies in the Sα and ANC values derived from different authors. Based on the measured ANC, we extracted the α-width of the 1/2+ state in 17O, which is currently the most uncertain parameter for determining the 13C(α, n)16O reaction rate. By using the present α-width and considering the properties of 17O states up to 8.342 MeV as well as their interferences, we derived the astrophysical S-factor and the stellar rate of the 13C(α, n)16O reaction. At a temperature of 100 MK, the new rate is roughly two times larger than the CF88 value and two times smaller than that recommended by NACRE (see Figure 5). Verification of the present result using other independent techniques is desirable, e.g., the Trojan horse approach (Spitaleri et al. 1999; Mukhamedzhanov et al. 2008), and the isospin symmetry approach based on a measurement of the 1/2+ 6.560 MeV state in 17F (Timofeyuk et al. 2007). In addition, an extension of the experimental data of 13C(α, n)16O toward lower energies is highly desirable, which can probably only be performed in an underground laboratory, e.g., LUNA (see Costantini et al. 2009).
We incorporated different 13C(α, n)16O reaction rates in calculations of the s-process nucleosynthesis in AGB stars and found the following. (1) If 13C burns completely in radiative conditions during the interpulse phase (as for stars of initial mass greater than ∼2 M☉), there is no change in the final results. (2) If some 13C burns inside the convective TPs instead (for stars of initial mass lower than ∼2 M☉), we find changes of up to 25% in the s-process results, particularly for Pb. There are model uncertainties related to the result of point (2). (a) When 13C burning in the TPs is due to incomplete burning of the 13C during the interpulse period, the exact stellar mass and metallicity range where incomplete burning of the 13C during the interpulse period occurs, as well as TP numbers, and the exact amount of 13C ingested, all depend sensitively on the temperature and density in the 13C pocket, on the interpulse period, and on the details of the inclusion of the 13C pocket. (b) When 13C burning in the TPs is due to ingestion of protons directly inside the TP (as in low-mass and low-metallicity stars, as well as in post-AGB stars experiencing a late TP, see Herwig et al. 2011), the amount of 13C and neutrons produced strongly depends on the physical and numerical treatment of the mixing scheme adopted, which is at present uncertain.
Due to these model uncertainties, together with the fact that the stellar observations have relatively large error bars, it is presently not possible to conclude if the new rate of the 13C(α, n)16O reaction provides the best match to the available observational constraints. This may be possible in the future, however, when development of recent three-dimensional hydrodynamical models of the proton ingestion episodes (Stancliffe et al. 2011) will allow a better understanding of neutron production and the s-process inside TPs to be compared to the composition of stellar observations and stardust grains.
B.G. thanks Natasha Timofeyuk for helpful discussions on DWBA calculation and isospin symmetry in mirror α-decays, Grigory Rogachev for useful discussions on the source of the discrepancy between their results, and Grigory Rogachev and Faïrouz Hammache for providing him with their reaction rates in tabular form. M.L. acknowledges the support of the ARC via a Future Fellowship and of Monash University via a Monash Fellowship. We thank the anonymous referee for many helpful comments and suggestions. We acknowledge the staff of Tandem Accelerator for the smooth operation of the machine. This work was supported by the National Natural Science Foundation of China under grant Nos. 11021504, 10735100, and 11035001; the National Basic Research Program of China (New physics and technology at the limits of nuclear stability); and the Outstanding tutors for doctoral dissertations of S&T project in Beijing under grant No. YB20088280101.