ABSTRACT
The high-frequency-peaked BL Lacertae object RGB J0710+591 was observed in the very high-energy (VHE; E > 100 GeV) wave band by the VERITAS array of atmospheric Cherenkov telescopes. The observations, taken between 2008 December and 2009 March and totaling 22.1 hr, yield the discovery of VHE gamma rays from the source. RGB J0710+591 is detected at a statistical significance of 5.5 standard deviations (5.5σ) above the background, corresponding to an integral flux of (3.9 ± 0.8) × 10−12 cm−2 s−1 (3% of the Crab Nebula's flux) above 300 GeV. The observed spectrum can be fit by a power law from 0.31 to 4.6 TeV with a photon spectral index of 2.69 ± 0.26stat ± 0.20sys. These data are complemented by contemporaneous multiwavelength data from the Fermi Large Area Telescope, the Swift X-ray Telescope, the Swift Ultra-Violet and Optical Telescope, and the Michigan–Dartmouth–MIT observatory. Modeling the broadband spectral energy distribution (SED) with an equilibrium synchrotron self-Compton model yields a good statistical fit to the data. The addition of an external-Compton component to the model does not improve the fit nor brings the system closer to equipartition. The combined Fermi and VERITAS data constrain the properties of the high-energy emission component of the source over 4 orders of magnitude and give measurements of the rising and falling sections of the SED.
1. INTRODUCTION
RGB J0710+591 was originally discovered by HEAO A-1 (Wood et al. 1984); it is a BL Lac object located at a redshift of z = 0.125 (Giommi et al. 1991). Hubble Space Telescope observations of this blazar show a fully resolved diskless galaxy that can be modeled using an elliptical profile with a nuclear point source (Scarpa et al. 2000). In addition, RGB J0710+591 is found to have an optical “compact companion” located at a distance of 14 (3.5 kpc) from the core of the active galactic nucleus. The nature of this companion is unknown, but it could be a foreground star or an unresolved faint galaxy. It is, however, too luminous for a globular cluster (Falomo et al. 2000) and is not seen in radio (Giroletti et al. 2004).
Blazars are characterized by spectral energy distributions (SEDs) consisting of two peaks, the low-energy peak arising from synchrotron emission and the high-energy (HE) peak from either leptonic or hadronic interactions (for a review of the emission mechanisms in blazars, see Böttcher 2007). Depending on the location of the low-energy peak, BL Lac objects are classified as being high-frequency-peaked (HBL; νpeak ∼ 1016–1018 Hz), intermediate-frequency-peaked (IBL; νpeak ∼ 1015–1016 Hz), or low-frequency-peaked (LBL; νpeak ∼ 1013–1015 Hz). The location of the low-energy SED peak of RGB J0710+591 (identified as EXO 0706.1+5913 in the following reference) is higher than ∼1018 Hz (Nieppola et al. 2006), clearly identifying it as an HBL.
RGB J0710+591 is a well-known HBL featured in many catalogs, but it was not detected in the HE (E > 100 MeV) band by the EGRET instrument on the Compton Gamma-ray Observatory. In the very high-energy (VHE; E > 100 GeV) band, the Whipple 10 m imaging atmospheric Cherenkov telescope (IACT) reported several flux upper limits for observations taken in different epochs: (0.91, 1.69, 3.58, and 4.29) ×10−12 cm−2 s−1 (99.9% confidence level) above (350, 350, 500, and 400 GeV), respectively, corresponding to (8.7%, 16.1%, 52.4%, and 45.9%) of the Crab Nebula's flux (Horan et al. 2004). The HEGRA IACT system reported a flux upper limit above 1.08 TeV of 0.91 × 10⁻¹² cm−2 s−1 (99% confidence level) corresponding to 6% of the Crab Nebula's flux (Aharonian et al. 2004).
There are several compelling reasons to study RGB J0710+ 591 in the MeV–TeV energy range. Due to the hardness of its X-ray spectrum, the HE peak is expected to be located in an ideal location for HE and VHE observations. There are both leptonic (Ghisellini & Madau 1996; Böttcher & Chiang 2002) and hadronic models (Aharonian 2000; Mücke et al. 2003) that explain the photon-production mechanism of the HE peak. The continuous measurement of the SED from MeV to TeV energies is vital to constrain certain aspects of the emission models and to perhaps exclude some of them entirely. For example, some leptonic models appear harder at HEs than hadronic models. At VHE energies, photons interact via pair-production with the infrared component of the extragalactic background light (EBL; Gould & Schréder 1967). This causes a decrease in the observed flux and a softening of the observed spectrum. Thus, extragalactic objects at moderate redshifts with reasonably hard VHE spectra are ideal candidates to indirectly study the history of the EBL and its SED, particularly in the optical to far infrared (see, e.g., Aharonian et al. 2007).
VHE γ-ray emission from RGB J0710+591 was discovered by VERITAS during the 2008–2009 observing season (Ong et al. 2009). Following this, the VERITAS collaboration initiated a multiwavelength (MWL) observation campaign that included the participation of the Fermi Large Area Telescope (LAT) in HE γ-rays, the Swift X-ray Telescope (XRT) in X-rays, and the Swift Ultra-Violet and Optical Telescope (UVOT) and the Michigan–Dartmouth–MIT (MDM) observatory in optical. The resulting MWL SED spans 13 decades in energy.
2. VERITAS OBSERVATIONS
VERITAS is an array of four 12 m IACTs located in southern Arizona at the F. L. Whipple Observatory (Weekes et al. 2002; Holder et al. 2008). VERITAS has an energy resolution of ∼15% between 100 GeV and 30 TeV, an angular resolution of ∼01 (68% containment) per event, and a field of view (FoV) of 3
5. VERITAS can detect a source with a flux of 1% of the Crab in <50 hr, while a 5% Crab Nebula flux source is detected in ∼2.5 hr. These specifications are valid for the data taken during this campaign; the VERITAS array was subsequently upgraded, resulting in a significant improvement in sensitivity (Perkins et al. 2009).
RGB J0710+591 was observed with VERITAS from 2008 December to 2009 March during astronomical darkness and partial moonlight for a total time of 34.9 hr. Approximately 30% of these observations are rejected due to poor weather or hardware-related problems with the majority rejected due to weather, resulting in 22.1 hr of exposure (livetime corrected). The average zenith angle of the observations is 30°. The VERITAS data are calibrated and cleaned as described in Daniel et al. (2008). After calibration, several noise-reducing selection criteria (cuts) are made, including rejecting those events where only the two closest-spaced telescopes participated in the trigger. The VERITAS standard analysis consists of stereo parameterization using a moment analysis (Hillas 1985) and following this, scaled parameters are used for event selection (Aharonian et al. 1997; Krawczynski et al. 2006). This selection is based on a set of cuts that are a priori optimized using data taken on the Crab Nebula where the γ-ray excess has been scaled by 0.01 to account for weaker sources like RGB J0710+591. VERITAS observed RGB J0710+591 in “wobble” mode, where the center of the FoV is offset by 05 from the blazar, to allow for simultaneous source and background measurements (Berge et al. 2007). The reflected region model (Aharonian et al. 2001) is used to calculate the background events from several off-source regions. A total of 576 on-source events are observed from the direction of RGB J0710+591 and 3890 are seen in the background regions. Depending on the pointing direction either eight or nine background regions are used resulting in a final α of 0.115 (here α is the ratio of the areas of the on- and off-source regions). This results in an excess of 129 events. This excess has a statistical significance of 5.5 standard deviations (σ) and corresponds to an integral flux of (3.9 ± 0.8) × 10−12 cm−2 s−1 (3% of the Crab Nebula's flux) above 300 GeV. There is no evidence for variability during these observations (a fit of the light curve to a constant flux yields a reduced chi-squared value of 0.21). The excess is point like and is located at 07h10m26
4 ± 2.4sstat, 59°09′00″ ± 36″stat (J2000, see Figure 2; the systematic uncertainty in the pointing is 90″) which is 49″ away from the location of RGB J0710+591 (07h10m30
07, 59°08′20
5) measured by the Very Large Array (VLA) at 5 GHz (Laurent-Muehleisen et al. 1999). The VERITAS source name is VER J0710+591. The θ2 distributions for the on-source and background regions are shown in Figure 1 (here, θ is the distance between the source location and the location of an event). The photon energy spectrum can be fit by a simple power law (dN/dE = I(E/E0)−Γ, E0 = 1 TeV) with photon index ΓVHE = 2.69 ± 0.26stat ± 0.20sys (see Table 1 for the spectral points). The fit yields a χ2 per degree of freedom of χ2/dof = 1.3/3.
Figure 1. Distribution of θ2 for on-source VHE events (point, shaded region) from observations of RGB J0710+591. θ is the distance from the source location to the event location. The dashed line represents the location of the cut on θ2 applied to the data. The θ2 cut retains events which lie to the left of the line.
Download figure:
Standard image High-resolution image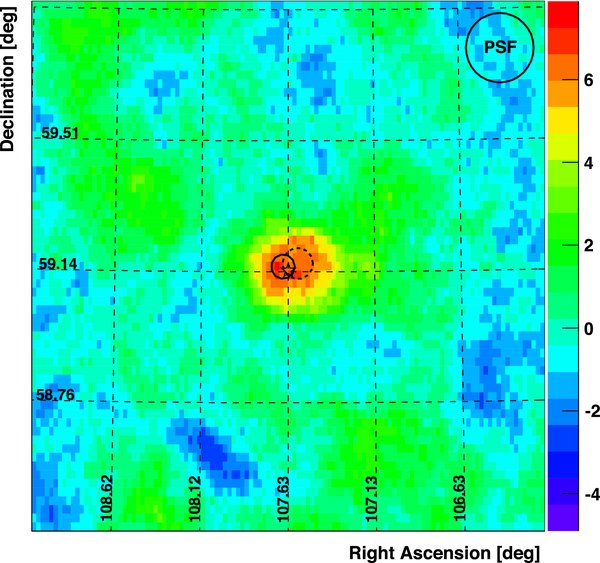
Figure 2. Smoothed VHE significance map of RGB J0710+591 from the VERITAS observations. The VLA location of the blazar is shown as a star. The solid circle is centered at the best fit location of the excess emission in the VERITAS data; the radius of the circle is the sum of the statistical and systematic uncertainties. The dashed circle is the best fit plus a 95% containment radius of 27 to the Fermi LAT data. Both locations are consistent with the VLA position of RGB J0710+591. The VERITAS point-spread function (PSF) is shown in the top right corner.
Download figure:
Standard image High-resolution imageTable 1. The VERITAS Spectral Bins
| Elow | Ehigh | Flux | Flux Error | Excess | Sig. |
|---|---|---|---|---|---|
| (TeV) | (TeV) | (cm−2 TeV−1 s−1) | (cm−2 TeV−1 s−1) | (σ) | |
| 0.31 | 0.53 | 8.9 × 10⁻¹² | 3.6 × 10⁻¹² | 29.9 | 2.7 |
| 0.53 | 0.92 | 2.4 × 10⁻¹² | 7.7 × 10⁻¹³ | 32.9 | 3.5 |
| 0.92 | 1.6 | 7.3 × 10⁻¹³ | 2.2 × 10⁻¹³ | 24.3 | 3.9 |
| 1.6 | 2.7 | 8.6 × 10⁻¹⁴ | 5.6 × 10⁻¹⁴ | 6.07 | 1.7 |
| 2.7 | 4.6 | 3.1 × 10⁻¹⁴ | 2.0 × 10⁻¹⁴ | 4.25 | 2.0 |
| 4.6 | 7.9 | 7.4 × 10⁻¹⁵ | 99% upper limit | −0.26 | −0.23 |
Notes. “Elow” and “Ehigh” are the low- and high-energy bounds; “Flux” is the differential flux; “Excess” is the number of excess events; “Sig.” is the significance of the bin.
Download table as: ASCIITypeset image
3. FERMI OBSERVATIONS
The Fermi LAT is a pair-conversion gamma-ray detector sensitive to photons in the energy range from below 20 MeV to more than 300 GeV (Atwood et al. 2009). The LAT data for this analysis were taken between 2008 August 4 and 2009 August 4. The data are analyzed using the standard likelihood tools distributed with the Science Tools v9r15p3 package available from the Fermi Science Support Center. 86 Only events having the highest probability of being photons, those in the “diffuse” class, are used. To limit contamination by Earth albedo gamma rays which are produced by cosmic rays interacting with the upper atmosphere, only events with zenith angles <105° are selected. Events with energy between 100 MeV and 300 GeV and within a circular region of 10° radius centered on the VLA coordinates of RGB J0710+591 are analyzed with an unbinned maximum likelihood method (Cash 1979; Mattox et al. 1996). The background emission is modeled using a Galactic diffuse emission model and an isotropic component.87 The fluxes are determined using the post-launch instrument response functions P6_V3_DIFFUSE.
A point source is detected with a significance of more than eight standard deviations. The best-fit position (07h10m37s, 59°09′32″) has a 95% containment radius of 27 and is statistically consistent with the VLA coordinates of RGB J0710+591 (see Figure 2). The highest energy photon associated with the source has an energy of 75 GeV. The time-averaged Fermi spectrum is fit by a power law for which I = 1.43 ± 0.35stat ± 0.10sys × 10−14 cm−2s−1 MeV−1, ΓHE = 1.46 ± 0.17stat ± 0.05sys, and E0 = 8.8 GeV is the energy at which the correlation between the fit values of I and ΓHE is minimized. The spectral index reported in the 1FGL catalog (Abdo et al. 2010) for this source is 1.28 ± 0.21stat. The discrepancy between that result and the result reported here can be explained by the different energy range considered in the likelihood model of the source: 100 MeV–100 GeV for the catalog analysis, 100 MeV–300 GeV for the present analysis. The lack of photons above 75 GeV carries information that is important for the fit results. No evidence for variability is detected.
4. SWIFT OBSERVATIONS
A total of seven Swift (Gehrels et al. 2004) XRT and UVOT observations of RGB J0710+591 were performed between 2009 February 20 and 2009 March 2 (observation identifications 00031356001 through 00031356007). The total XRT observation time is 15.2 ks while the total UVOT observation time is 14.8 ks. The Swift XRT data are analyzed with HEAsoft 6.5 using the most recent calibration files. The first three XRT observations in photon-counting mode have source count rates of ∼0.7–1.5 counts s−1, resulting in significant photon pile-up in the core of the point-spread function (PSF), which occurs for rates >0.5 counts s−1. The photon pile-up is avoided by using an annular region with inner radius ranging from 2 to 7 pixels and an outer radius of 30 pixels (472) to extract the source counts. Background counts are extracted from a 40 pixel radius circle in a source-free region. For the last four XRT observations in windowed-timing mode, source counts are extracted from a rectangular region of 40 by 20 pixels high, with background counts extracted from a nearby source-free rectangular region of equivalent size. Evidence for marginal flux variability between the Swift XRT observations is indicated by a probability of 0.004 for a fit of a constant flux. The time-averaged XRT data can be fit with an absorbed power-law model where the hydrogen column density NH is fixed at 4.4 × 1020 cm−2 (Kalberla et al. 2005), resulting in a combined spectrum with a photon index of 1.86 ± 0.01, with a χ2/dof = 371/303. This hard spectrum is consistent with a synchrotron peak above 10 keV, as can be inferred from the radio to X-ray SED generated from archival data, including an EXOSAT detection (Giommi et al. 1995).
Swift UVOT (Roming et al. 2005) data are presented in the six bands of v, b, u, uvm1, uvm2, and uvw2. The UVOTSOURCE tool is used to extract counts, correct for coincidence losses, apply background subtraction, and calculate the source flux (Poole et al. 2008). The standard 5″ radius source aperture is used, with a 20″ background region. The source fluxes are extinction corrected using the dust maps of Schlegel et al. (1998). Since the stacked UVOT images are not deep enough to sample the host galaxy profile, no attempt is made to correct for the contribution of the host galaxy and this can be seen as an increase in flux in the optical portion of the SED (Figure 3) starting with the u band.
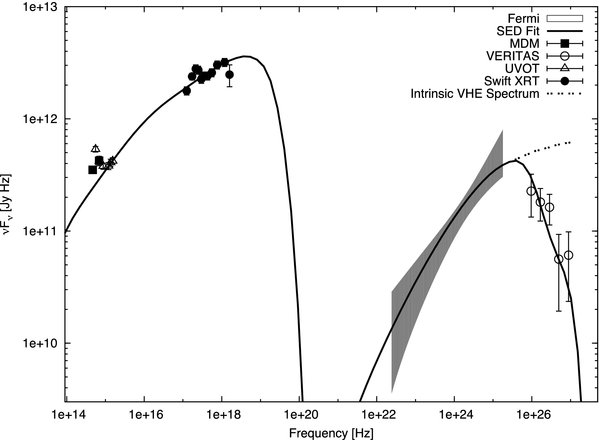
Figure 3. Broadband spectral energy distribution (SED) of RGB J0710+591. The closed squares are R- and B-band data from the MDM 1.3 m telescope; the open triangles are from the Swift UVOT; closed circles are from the Swift XRT; the shaded area is the Fermi LAT measurement; the open circles are the measured VERITAS data. The broadband spectral model is the equilibrium SSC version from Böttcher & Chiang (2002) with a cooling break energy occurring around 1.3 × 10¹⁶ Hz. Note that the optical measurements (MDM and Swift u, b and v bands) are affected by emission from the host galaxy and are thus not used in the SED fit. The SED model curve includes EBL absorption using the model of Franceschini et al. (2008), and the dashed line is the de-absorbed VHE spectrum.
Download figure:
Standard image High-resolution image5. MDM OBSERVATIONS
The observations of RGB J0710+591 taken from 2009 February 19 through 24 with the MDM Observatory 1.3 m telescope88 in R and B bands are bias-subtracted and flat-fielded using the Image Reduction and Analysis Facility (IRAF; Tody 1993, 1986). Instrumental magnitudes are extracted using the IRAF DAOPHOT package and calibrated using four comparison stars in the field, with comparison star magnitudes from the Naval Observatory Merged Astrometric Dataset (NOMAD) catalog (Zacharias et al. 2004), and extinction coefficients AB = 0.166, AR = 0.106 from the NASA/IPAC Extragalactic Database (NED).89
The host galaxy of RGB J0710+591 makes a significant contribution to the optical fluxes measured by MDM. The host galaxy subtractions for this BL Lac object were calculated previously in Hyvönen et al. (2007) and these subtractions are used to correct for the host galaxy contribution to the flux measurements. The resulting extinction- and host-galaxy-corrected optical flux in the R band (4.68 × 10¹⁴ Hz) is (3.51 ± 0.07) × 1011 Jy Hz and in the B band (6.85 × 10¹⁴ Hz) is (4.23 ± 0.41) × 1011 JyHz. Even with the host galaxy corrections, the MDM data are still higher than the UV measurements made by the Swift UVOT which are dominated by the nucleus. Thus, the MDM and Swift optical data in the u, b, and v bands still have contributions due to the host galaxy and should be considered upper limits. No substantial optical variability is seen over the course of the 5 day observation period.
6. MODELING AND DISCUSSION
The observed broadband SED of RGB J0710+591 is shown in Figure 3. The data, excluding the MDM and Swift u, b, and v bands which are affected by contributions from the host, are fit with a purely leptonic synchrotron self-Compton (SSC) model. Specifically, an equilibrium version of the model of Böttcher & Chiang (2002), as described in Acciari et al. (2009), is used. The best-fit parameters are listed in Table 2. The VHE data in the plot are the measured values and the model includes the effects of intergalactic γ − γ absorption using the EBL models of Franceschini et al. (2008) and the reported redshift of z = 0.125. De-absorbing the VHE data using the same models results in a de-absorbed spectral index of ΓVHE∼1.85.
Table 2. The Equilibrium Model Parameters for the Purely Leptonic SSC Model That Was Used to Fit the SED of RGB J0170+591
| Parameter | Value |
|---|---|
| γmin | 6 × 10⁴ |
| γmax | 2 × 10⁶ |
| e− injection spectral index | 1.5 |
| Escape time parameter | ηesc = 100a |
| Magnetic field at z0 | 0.036 G |
| Bulk Lorentz factor | Γbulk = 30 |
| Blob radius | 2 × 1016 cm |
| θobs | 1 |
| Redshift | z = 0.125 |
| Le (jet) | 4.49 × 1043 erg s−1 |
| LB (jet) | 1.75 × 1042 erg s−1 |
| LB/Le | 3.90 × 10⁻² |
Notes. Details about the model can be found in the text. atesc = ηesc*R/c. bEquivalent to the superluminal angle.
Download table as: ASCIITypeset image
Many of the model parameters are not constrained by the observations. In particular, the choice of the bulk Lorentz factor (Γbulk) and observing angle (θobs) are somewhat arbitrary and similarly good fits can be obtained using other values. Evidence from portions of the radio structure is supportive of a small observing angle which corroborates the small value obtained here. However, the bulk Lorentz factor derived from these same data is lower (Giroletti et al. 2006). Regardless, the synchrotron portion of the SED always turns over far below the X-ray regime. Therefore, in order to obtain the observed hard X-ray spectrum, a very hard injection index (q = 1.5) has to be assumed. This poses challenges to standard (first-order) Fermi acceleration models (Stecker et al. 2007), and it might indicate second-order Fermi acceleration or other modes of acceleration (e.g., shear at boundary layers). The fit requires a rather low magnetic field of B = 0.036G, far below equipartition. This cannot be remedied even with the choice of a higher Doppler factor.
Additionally, an external-Compton (EC) component was added to the model to see if the resulting fit would improve, or if the system would be closer to equipartition. However, in order to produce an EC peak at sufficiently high frequencies, a very low magnetic field is needed. Thus, the inclusion of an EC component does not lead to an overall improvement of the fit statistically, or with respect to equipartition.
With a photon index ΓVHE = 2.69, RGB J0710+591 is one of the hardest VHE blazars detected to date. Furthermore, out of the 19 blazars detected by both VHE instruments and Fermi, RGB J0710+591 has the hardest HE photon index (Abdo et al. 2009) and Nieppola et al. (2006) found that RGB J0710+591 has one of the highest low-energy SED peaks out of a sample of over 300 BL Lac objects and place it in a list of 22 ultra-high-frequency-peaked candidates. Nevertheless, the observed SED is well fit by a purely leptonic SSC model without the need to include an external component.
Observations of the similarly hard (ΓVHE = 2.50) and distant (z = 0.1396) blazar 1ES 0229+200 (Aharonian et al. 2007) indicated that the EBL density in the mid-IR band was close to the lower limits measured by Spitzer. These constraints on the EBL are based on the assumption that the intrinsic spectrum of blazars must have a spectral index of 1.5 or larger. Thus, if blazars like 1ES 0229+200 and RGB J0710+591 are unusual objects, this assumption might not be valid because their intrinsic spectral indices could be smaller than 1.5. However, the modeling of RGB J0710+591 and other similar blazars indicates that hard-spectrum VHE blazars might not be exotic (i.e., having an intrinsic spectral index less than 1.5) and are part of the general blazar population. Therefore, using VHE observations of hard spectrum blazars to constrain EBL models as done in Aharonian et al. (2007) continues to be a valid undertaking.
The VERITAS Collaboration acknowledges support from the U.S. Department of Energy, the U.S. National Science Foundation and the Smithsonian Institution, by NSERC in Canada, by Science Foundation Ireland, and by STFC in the UK. This research has made use of the NASA/IPAC Extragalactic Database (NED) which is operated by the Jet Propulsion Laboratory, California Institute of Technology, under contract with the National Aeronautics and Space Administration.
The Fermi LAT Collaboration acknowledges generous ongoing support from a number of agencies and institutes that have supported both the development and the operation of the LAT as well as scientific data analysis. These include the National Aeronautics and Space Administration and the Department of Energy in the United States, the Commissariat à l’Energie Atomique and the Centre National de la Recherche Scientifique/Institut National de Physique Nucléaire et de Physique des Particules in France, the Agenzia Spaziale Italiana and the Istituto Nazionale di Fisica Nucleare in Italy, the Ministry of Education, Culture, Sports, Science, and Technology (MEXT), High Energy Accelerator Research Organization (KEK) and Japan Aerospace Exploration Agency (JAXA) in Japan, and the K. A. Wallenberg Foundation, the Swedish Research Council, and the Swedish National Space Board in Sweden.
Additional support for science analysis during the operations phase is gratefully acknowledged from the Istituto Nazionale di Astrofisica in Italy and the Centre National d’Études Spatiales in France.
Footnotes
- 86
- 87
- 88
- 89