Abstract
The observational data of high redshift galaxies become increasingly abundant, especially since the operation of the James Webb Space Telescope, which allows us to verify and optimize the galaxy formation model at high redshifts. In this work, we investigate the merging history of massive galaxies at 3 < z < 6 using a well-developed semi-analytic galaxy formation catalog. We find that the major merger rate increases with redshift up to 3 and then flattens. The fraction of wet mergers, during which the sum of the cold gas mass is higher than the sum of the stellar mass in two merging galaxies, also increases from ∼34% at z = 0 to 96% at z = 3. Interestingly, almost all major mergers are wet at z > 3. This can be attributed to the high fraction (>50%) of cold gas at z > 3. In addition, we study some special systems of massive merging galaxies at 3 < z < 6, including the massive gas-rich major merging systems and extreme dense proto-clusters, and investigate the supermassive black hole–dark matter halo mass relation and dual active galactic nuclei. We find that the galaxy formation model reproduces the incidence of those observed massive galaxies, but fails to reproduce the relation between the supermassive black hole mass and the dark matter halo mass at z ∼ 6. The latter requires more careful estimates of the supermassive black hole masses observationally. Otherwise, it could suggest modifications of the modeling of the supermassive black hole growth at high redshifts.
1. Introduction
The models of galaxy formation and evolution based on the standard cosmological model perform well in explaining the properties of galaxies in the nearby galaxies, however, theories and observations remain unclear in the early universe. With the development of observational facilities in the past decade, several observational results, including massive compact systems up to the first billion years after the Big Bang (Marrone et al. 2018; Miller et al. 2018) and the high-z quasars (e.g., McLure & Jarvis 2002; McLure & Dunlop 2004; Fan 2006; Shimasaku & Izumi 2019), provide important evidence on the sustained growth mode for massive galaxies in the early universe, especially on their merging history.
Miller et al. (2018) reported an extremely concentrated proto-cluster at z ∼ 4.3 (SPT2349-56), which contains 14 submillimeter galaxies (SMGs) within a projected region of 130 kpc, some of the SMGs are likely to undergo a rapid merger and form a massive elliptical galaxy at the core of a cluster with the mass ∼1015 M⊙ in the nearby universe. Marrone et al. (2018) reported a gas-rich major merger with both galaxy’s stellar masses above 1010 M⊙ at z ∼ 6.9 (SPT0311-58) with an extremely high star formation rate of about a thousand M⊙ yr−1. These observational massive compact star-forming galaxies in the early universe contribute more to the star formation rate density and dominate the high-mass galaxy stellar mass function potentially (e.g., Williams et al. 2019; Forrest et al. 2020; Rennehan et al. 2020). Investigating the incidence of these objects statistically at z > 4 is meaningful to understand the merging history of massive galaxies at high redshift.
Developing observations of high-redshift quasars imply that supermassive black holes (SMBHs) with Mbh ∼ 109 M⊙ formed within the first billion years after the Big Bang. The SMBHs grow rapidly via galaxy mergers predicted by the hierarchical formation of galaxy. However, Shimasaku & Izumi (2019) claimed that the black hole (BH) mass versus host halo mass relationship at z ∼ 6 indicates a fast growth of black holes at high redshift, as opposed to the milder evolution of the stellar-to-halo mass relation. Based on the relation proposed by Shimasaku & Izumi (2019), Bansal et al. (2022) assumed a simplistic model to study how galaxy mergers affect the evolution of SMBHs in the central galaxies, and constrain a lowest mass with ∼1010 M⊙ of dark matter halo which can contain a SMBH. It should be interesting to investigate the merging of massive galaxies from the aspect of the black hole–halo mass relation at z ∼ 6 within the framework of hierarchical structure formation.
The standard model predicts that the formation of these massive systems at high redshifts is related to galaxy mergers, especially major mergers (Sanders et al. 1990; Hopkins et al. 2008; Hewlett et al. 2017; Calabrò et al. 2019). Galaxy mergers are widely studied in observations and simulations (e.g., Guo & White 2008; Lotz et al. 2008, 2011; Rodriguez-Gomez et al. 2015; Qu et al. 2017; Mantha et al. 2018) up to z ∼ 3. Thus we first examine the ratios and contribution of galaxy merger from z = 0 to 6, with the galaxy catalog extracted from Guo et al. (2011, 2013). Especially, we attempt to look for observed massive objects in simulation, and investigate the Mbh–M200 relation as well as the active galactic nucleus (AGN) pair fraction statistically. We expect to provide predictions for future observations and constraints for current galaxy formation model. Thus we make use of a large galaxy catalog extracted from a classical semi-analytic model (SAM) based on the Millennium Simulation (MS) (Springel et al. 2005).
This paper is organized as follows. In Section 2, we briefly introduce the galaxy catalog we use in this work. In Section 3, we describe the galaxy merger diagram illustrated by our galaxy model and present the incidence of the recent observational massive objects up to z ∼ 6. We summarize our conclusions in Section 4.
2. Galaxy Catalog
In this work, we use the galaxy catalog (MS-W7) presented in Guo et al. (2013), which is constructed by implementing the semi-analytic model of Guo et al. (2011) on N-body merger trees extracted from the Millennium Simulation (Springel et al. 2005) but with WMAP7 cosmology directly. The Millennium Simulation follows the evolution of 21603 dark matter particles from z ∼ 127 to the present day in a comoving box of side length 710 Mpc. The cosmological parameters used in the catalog are based on WMAP7, with Ωm = 0.272, Ωb = 0.045, Ωλ = 0.728, n = 0.961, σ8 = 0.807 and H0 = 70.4 km s−1 Mpc−1. The mass of the simulation particles is 1.3 × 10⁹ M⊙, which makes the galaxy catalog to be nearly complete above stellar mass 109 M⊙. We refer readers to Guo et al. (2011, 2013) for more detailed descriptions on MS-W7.
In this catalog, we mainly consider galaxies with M* > 1010 M⊙, which is massive enough to resolve the most massive objects we are interested in. Several SAMs have been developed in the past decades (De Lucia & Blaizot 2007; Guo et al. 2011; Henriques et al. 2015, etc.) and achieved good match for the properties of local galaxies, Henriques et al. (2015) even reproduce better stellar mass function at z ∼ 3. However, the predicted galaxy merger rates differ by an order of magnitude in different models (Hopkins et al. 2010; Vulcani et al. 2016b). Thus we stick to use the catalog from Guo et al. (2013), galaxy merger rate of which matches the observational results well (see more details in Figure 1 in Section 3.1).
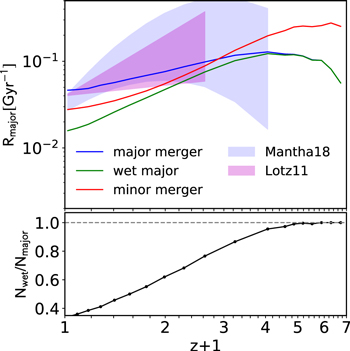
Figure 1. (Top) The major merger rate (blue solid line), wet major merger rate (green solid line) and minor merger rate (red solid line) of galaxies with M* > 1010 M⊙ as a function of redshift. The magenta and purple shaded regions show the observational constraints of Lotz et al. (2011) and Mantha et al. (2018), respectively. (Bottom) The fraction of wet major mergers in all major mergers. The horizontal gray dashed line represents unity.
Download figure:
Standard image High-resolution image3. Results
In Section 3.1, we describe the merger diagram, especially major mergers, across redshift 0–6 for galaxies with M* > 1010 M⊙. In Section 3.2, we investigate the incidence of of several certain observed massive objects, including massive gas-rich galaxy pair, proto-clusters and SMBHs, and the fraction of AGN pairs in the merging black holes.
3.1. Ratios and Contributions of Mergers up to Redshift 6
In this section, we investigate the evolution of galaxy assembly through galaxy mergers up to z ∼ 6. In semi-analytic models, a galaxy merger takes place when a galaxy has more than one direct progenitor. Direct progenitors of a galaxy could be found in adjacent or nonadjacent previous snapshots. If a galaxy has m (m ≥ 2) direct progenitors, the galaxy is assumed to have experienced m − 1 mergers between these two snapshots. Merger events can be classified into different types according to their stellar mass ratio of the two merging galaxies:  , where
  and
and  represent the stellar mass of the primary and secondary galaxies, respectively. A merger is defined as major merger if μ ≥ 1/4; minor merger if 1/10 ≤ μ ≤ 1/4; and accretion if μ < 1/10, which is not considered in this work. We also classify mergers according to their gas to stellar mass ratio:
  . Agreed with previous works (e.g., Lagos et al. 2018), a merger is defined as a wet (gas-rich) merger if
  , otherwise it is a dry (gas-poor) merger. Note that in the semi-analytic model we use in this work, “cold gas” indicates atomic and molecular gas which composes the gaseous disk.
We describe the galaxy merger rate as Rm = fmerg/τ, where fmerg is the galaxy merger fraction, calculated by dividing the number of galaxies involved in merging events by the total number of galaxies at each snapshot, and τ is the time interval between the snapshots of the descendant galaxies and their direct progenitors in the simulation. In the upper panel of Figure 1, we show the galaxy merger rate whose stellar mass is above 1010 M⊙ as a function of redshift over z ∼ 0–6. We can see that the minor merger rate increases with redshift monotonically across z ∼ 0–6. The major merger rate also increases with redshift at lower redshift but levels off at z ∼ 3. At z ≲ 2, the minor merger rate is lower than the major merger rate slightly, and becomes higher than the major merger rate by about a factor of 2 up to z > 3. A higher frequency of the major merger with the same definition of major and minor merger within a similar mass range is similar to the result of Emerge (O’Leary et al. 2021). Also, the merger rate is related to the upper and lower limit of the stellar mass ratios (Guo & White 2008), as well as the infalling efficiency. The major merger rate should be lower than the minor merger rate if we choose the progenitor stellar mass ratio of 3 to 1.
Within the observed redshift range of Lotz et al. (2011) at z ≤ 1.5 (the magenta region) and Mantha et al. (2018) at z ≤ 3 (the purple region), our major merger rate agrees with the observational constraints quite well, though the uncertainties in observations are relatively large. Note that the galaxies used in Mantha et al. (2018) are more massive than 2 × 10¹⁰ M⊙. We divide their results by a factor of 1.30–1.45 at each redshift to match the samples in this work, as the major merger rate of galaxies with M* > 2 × 10¹⁰ M⊙ is 1.30–1.45 times the one with M* > 1010 M⊙ at each redshift in our catalog.
In the lower panel of Figure 1, we show the evolution of wet major merger fraction. We can see that the gas-rich fraction of major mergers increases from 34% to nearly 100% from redshift 0 to 3, which indicates that wet major mergers play a crucial role in the assembly of galaxies at high redshifts. This increase is a natural result of the increasing fraction of cold gas in merging galaxies. Figure 2 shows the evolution of the cold gas fraction of galaxies, defined as fgas ≡ Mgas/(M* + Mgas), in three different mass ranges. As shown in Figure 2, the gas fraction increases by about two times from redshift 0 to 4 and low-mass galaxies have more cold gas compared with massive ones. We notice that even in the most massive range, with M* = 1010.5–1011
M⊙, almost all galaxies have fgas > 1/3 above z ∼ 3, represented by the green horizontal line in Figure 2. If both merging galaxies have fgas > 1/3, we have  , then it will be a wet merger according to our definition. Thus the evolution of the gas fraction in galaxies is consistent with the evolution of the gas-rich fraction in major mergers.
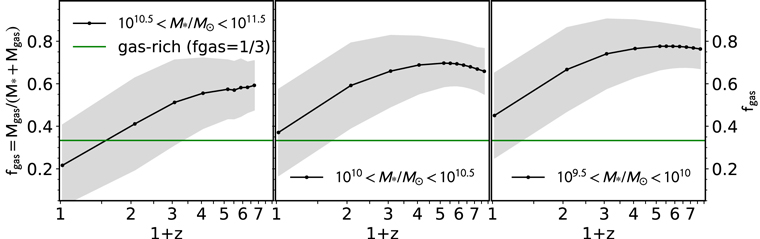
Figure 2. The mean cold gas fraction as a function of redshift for the three galaxy classes in the stellar mass bin of 1010.5–1011.5 M⊙ (left), 1010–1010.5 M⊙ (center), and 109.5–1010 M⊙ (right). Shaded regions present 1σ scatter of the distributions. The green line presents fgas ≡ Mgas/(M* + Mgas) = 1/3, which is the lower-limit for the so-called gas-rich galaxies. If both merging galaxies are gas-rich, the merger will be a wet merger.
Download figure:
Standard image High-resolution imageTo evaluate the relative importance of different merger types to galaxy growth, we calculate fractional mass contributions (fmass) of different merging channels, including major mergers, wet major mergers, and minor mergers. The fractional mass contribution is defined as the merged stellar masses fraction of the final stellar mass across the assembly history, under the assumption that all the mass of these objects is accreted by the main progenitor, i.e., the most massive progenitor. Note that in this work, we only focus on central galaxies, avoiding the effects of some environmental processes such as strangulation and ram pressure stripping. In Guo et al. (2011), satellites that have lost their host subhaloes could be totally disrupted to be intracluster stars by very strong tidal forces, depending on orbital parameters and mass ratio. We neglect contributions of these disrupted satellites.
The fractional mass contributions of different merger types are shown in Figure 3. We can see that the mean contribution of major mergers decreases from 8.84% to 0.55% from redshift 0 to 6, and that of minor mergers decreases from 2.26% to 0.49%. We find that there is only ∼10% of the final stellar mass is contributed from major and minor mergers for local galaxies with M* > 1010 M⊙. Limited by the resolution of our simulation, we do not consider the contribution from accretion. Nevertheless, Qu et al. (2017) found that the fractional mass contribution from external processes, including mergers with all mass ratios, is 10%–20% from redshift 0 to 3, and major mergers make more contributions in the more massive galaxies. Moreover, major mergers make a greater contribution to galaxy assembly than minor mergers across redshift 0–6, even though the major merger rate is lower than the minor merger rate at z ≳ 2.
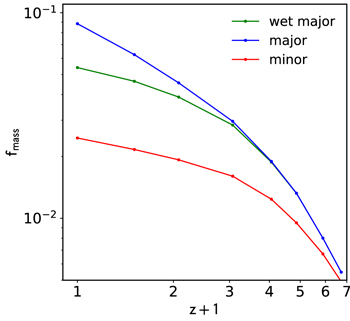
Figure 3. The mean fractional stellar mass contributions of major mergers (blue line), wet major mergers (green line) and minor mergers (red line) for galaxies with M* > 1010 M⊙ at different redshifts. As the assembly histories of galaxies are quite different, the scatter of fmass is huge (see Figure 4). Here we only plot the mean relation for simplicity.
Download figure:
Standard image High-resolution imageTo illustrate the role of major mergers in galaxy assembly, we then investigate how many local galaxies have experienced more than one major merger through their formation history. The number fraction of the galaxies that have experienced N times of major mergers (fmN ) until z ∼ 0 is calculated in Figure 4. We find that fmN=1 is constantly about 26% over stellar mass range 1010–1011 M⊙ and decreases slightly in the most massive end. fmN=2 increases mildly with stellar mass. It increases by a factor of 2 from the stellar mass of about 1010 M⊙ to the most massive end. fmN≥3 increases rapidly with stellar mass and reaches 50% up to M* ∼ 3 × 10¹¹ M⊙. It is clear that more massive galaxies have experienced more major mergers throughout their assembly history. Therefore, detailed studies on the major mergers are essential to understand the evolution of most massive galaxies.
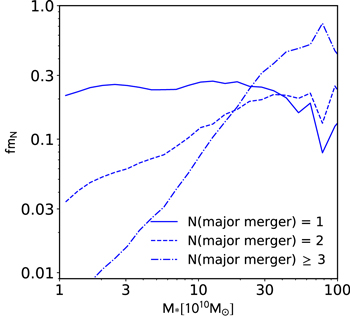
Figure 4. The number fraction of local galaxies that have experienced one major merger (solid line), two major mergers (dashed line) and at least three major mergers (dotted–dashed line) until z ∼ 0 as a function of stellar mass.
Download figure:
Standard image High-resolution image3.2. Observational Massive Objects at High Redshifts
In this section, we compare the simulation data with observational measurements of massive gas-rich pair, and distribution ranges of massive proto-clusters, central massive black hole masses, as well as dual AGNs (DAGNs). We investigate counterparts of observed massive objects at z > 3 in the galaxy catalog, which should contribute to understand the hierarchical formation in the distant universe.
3.2.1. Massive Gas-rich Galaxy Pair up to Redshift 6
Motivated by a gas-rich major merger with both stellar masses above ∼1010
M⊙ at z ∼ 6.9, observed through far-infrared in Marrone et al. (2018), we explore the fraction of such gas-rich major mergers with both stellar masses ( ) above a certain value at high redshift. First, we compare the gas-rich major merger fraction of galaxies with
  with data from the MUSE Hubble Ultra Deep Field Survey (Ventou et al. 2017),
5
which covers a
with data from the MUSE Hubble Ultra Deep Field Survey (Ventou et al. 2017),
5
which covers a  area, wavelength 4750–9300 Å, as shown by the blue lines in Figure 5. The pair fraction of galaxies with
  in our galaxy catalog is about 0.7% across the redshift range 1–7 and agrees well with the observational constraints. That is to say, on average we could find one major merger with
  among 142 galaxies at redshift 4–6 without any other selection effect. We then explore how many cases described in Marrone et al. (2018) could be found in our galaxy catalog. As shown by the solid red line in Figure 5, the major merger fraction with
  decreases from 0.6% to 0.1% from redshift 1 to 5. Its number density is about 10−8 cMpc−3 at z ∼ 5. Nevertheless, we find that there is no such massive pair at z > 5 in our galaxy catalog. We fit the evolution of the fraction at redshift 1–5 and extrapolate it to higher redshifts, as indicated by the red dotted–dashed line. We predict that on average the pair fraction with
  at z ∼ 7 is about one over 1430 galaxies, which is one magnitude lower than the one with
  . Note that the galaxy catalog we used in this work shows a deficit at the massive end of stellar mass function above redshift 2, especially for galaxies with M* > 1010.5
M⊙ at z > 3 (see Guo et al. 2011, 2013), which could be responsible for the lack of such massive pairs at z > 5.
. Note that the galaxy catalog we used in this work shows a deficit at the massive end of stellar mass function above redshift 2, especially for galaxies with M* > 1010.5
M⊙ at z > 3 (see Guo et al. 2011, 2013), which could be responsible for the lack of such massive pairs at z > 5.
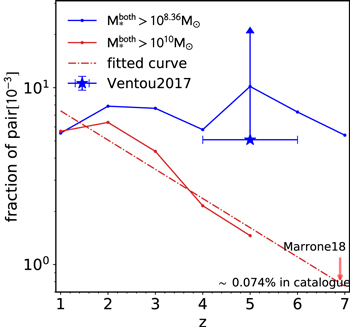
Figure 5. The gas-rich major merger fraction with both stellar masses ( ) above a given stellar mass as a function of redshift. The blue and red solid lines represent the fraction of wet major mergers with both stellar masses above 108.36
M⊙ and 1010
M⊙ in the simulation, respectively. The blue star with arrow indicates the observational constrained lower limit for
) above a given stellar mass as a function of redshift. The blue and red solid lines represent the fraction of wet major mergers with both stellar masses above 108.36
M⊙ and 1010
M⊙ in the simulation, respectively. The blue star with arrow indicates the observational constrained lower limit for  of Ventou et al. (2017). The red dotted–dashed line fits the evolution of the fraction with
  at redshift 1–5 in our galaxy catalog. The red arrow marks the corresponding redshift of the object in Marrone et al. (2018).
Download figure:
Standard image High-resolution image3.2.2. Proto-cluster up to Redshift 4
Miller et al. (2018) reported a uniquely dense massive system at z ∼ 4.3, which consists of at least 14 gas-rich star-forming SMGs, whereas they are located within a projected region that is only around 130 kpc in diameter. These 14 SMGs indicate the dynamical halo mass to be 1013 M⊙. Some other observed proto-clusters that contain as many SMGs as this system extends over much larger areas in the sky. Such a dense system is likely to merge to form a massive elliptical galaxy at the core of a galaxy cluster in the nearby universe.
To explore the incidence of such a dense system, we investigate how gas-rich (fgas > 0.3) star-forming (star formation rate >10 M⊙ yr−1) satellites (M* ≥ 109 M⊙) distribute within massive haloes with 1012.8 ≤ M200/ M⊙ ≤ 1013.5 over redshift 2–5, where M200 is halo mass, the total mass of particles within the radius where a mean overdensity exceeding 200 times the critical value. We evaluate the extension of a satellite system as the physical distance from the Nth satellite to the central galaxy. Especially, we use projected distance from a random line of sight to compare with that in the observation. As shown in Figure 6, the extension of satellite systems consisting of 14 gas-rich star-forming satellites are 0.41 Mpc and 0.06 Mpc at redshift 2 and 5, respectively. We find that the system reported in Miller et al. (2018) is well located within the 1σ scatter of the distribution, indicating such dense massive system is not rare at high redshift in our galaxy formation model. The projected distance is only about 1/2 − 1/3 of the physical distance, which implies that we need to be careful when we deal with projected distances. The effect of projection is a considerable factor if we attempt to compare the extension of an observed satellite system.
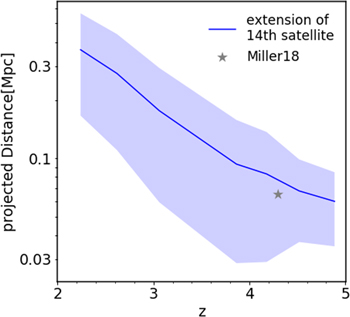
Figure 6. The extension of gas-rich (fgas > 1/3) star-forming (star formation rate >10 M⊙ yr−1) satellite systems within massive haloes with 1012.8 ≤ M200/ M⊙ ≤ 1013.5 at each redshift in our galaxy formation model, i.e., the projected physical distance from the 14th gas-rich star-forming satellite to the central galaxy. The colored region shows corresponding 1σ scatter. The gray star represents the extension of the observed system of 14 SMGs (the radius of the projected region, 0.065 Mpc) at z ∼ 4.3 in Miller et al. (2018).
Download figure:
Standard image High-resolution image3.2.3. Super Massive Black Holes and Active Galactic Nuclei
Shimasaku & Izumi (2019) reported the relation between the mass of SMBHs and the mass of their host dark matter haloes for 49 quasi-stellar objects (QSOs) at z ∼ 6. They found the vast majority of these z ∼ 6 SMBHs are more massive than expected from the local Mbh–M200 relation. While the evolution of the stellar-to-halo mass ratio is much milder, especially for haloes with M200 < 1012.5 M⊙ (Girelli et al. 2020), these results imply a rapid SMBH growth in dark matter haloes at z ≥ 6.
We present Mbh versus M200 relation at z ∼ 0 and 6 in the galaxy formation model in Figure 7, as shown by solid lines with different colors. Our results share a similar trend with previous works (e.g., Ferrarese 2002; Mutlu-Pakdil et al. 2018). However, the slope of local relation in our galaxy catalog is shallower than the best-fitted relation in observation (Ferrarese 2002) and the prediction of Illustris hydrodynamical simulation (Mutlu-Pakdil et al. 2018). This deviation could be caused by the estimation of halo mass which depends on the relationship of viral velocity, circular velocity and rotation velocity in observation, or by the different BH growth mechanisms in galaxy models. We notice that most BH masses of the observed QSOs in Shimasaku & Izumi (2019) are above ∼108 M⊙ even in haloes with M200 = 1011–1012 M⊙ at z ∼ 6, and the most massive ones are even above 109 M⊙, about two magnitudes more massive than our model predictions. Such a deviation from local relation is perhaps caused by the lack of low-luminosity BHs in observations at high redshift. But unfortunately, the BH growth mechanism mainly driven by major mergers in our galaxy formation model fails to reproduce these BHs at z ∼ 6, which implies that more physical details are needed about BH growth.
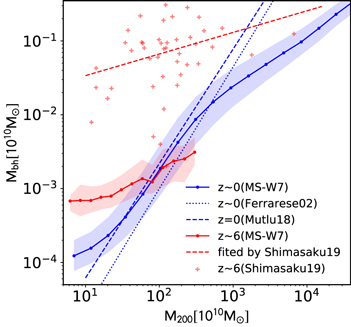
Figure 7. BH masses as a function of their host halo masses. Blue and red solid lines represent the relation in our galaxy catalog at redshift 0 and 6, respectively, and the colored regions indicate corresponding 25th and 75th percentiles of the distributions. The red pluses are the observational results at z ∼ 6 of Shimasaku & Izumi (2019), and the red dashed line is their fitting. The blue dashed line is fitted by local observational results of Ferrarese (2002), and the blue dotted line is extracted from Illustris simulation by Mutlu-Pakdil et al. (2018) at z ∼ 0.
Download figure:
Standard image High-resolution imageBecause a census of DAGNs across cosmic history is important to study BH binaries and reconcile galaxy mergers with BH growth, and major mergers are believed to trigger AGNs at low redshift, we attempt to explore the evolution of DAGN fraction (fDAGN) in gas-rich BH major mergers with primary stellar mass above 1010 M⊙ up to redshift 5. In wet mergers, we define a BH as an AGN if its mass is larger than a critical value Mbh,crit. If both merged BHs meet this criterion, it is considered as a DAGN system, otherwise it is a single AGN (SAGN) or not an AGN system. Since observations show that BH masses of most quasars have the lowest limit of 107 M⊙ (McLure & Dunlop 2004), we first consider a critical mass Mbh,crit = 107 M⊙. As shown in the top panel of Figure 8, fDAGN with Mbh,crit = 107 M⊙ increases with redshift across redshift 0–5. Moreover, we find that a critical mass Mbh,crit = 107.7 M⊙ matches the hydrodynamical simulation result of Volonteri et al. (2016a). 6 Here we divide their result by the wet merger fraction in major mergers at z = 0, 2 to get the DAGN fraction in wet major mergers as shown by the red line. fDAGN with Mbh,crit = 107.7 M⊙ increases with redshift until it reaches the peak at z ∼ 3. In the lower panel of Figure 8, we also present the number ratio of DAGNs to SAGNs in gas-rich BH mergers. We find that the ratio of DAGNs to SAGNs defined by the lower mass cut increases from 1.0 to 2.1, which indicates that there are more DAGNs than SAGNs, if low mass black hole is bright enough at high redshift. Meanwhile, with the higher mass cut definition, DAGNs are rare (only ∼25% of SAGNs) across the cosmic time.
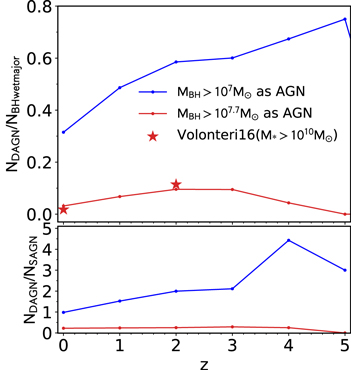
Figure 8. (Top) Dual AGN (DAGN) fraction of primary galaxies with stellar masses above 1010 M⊙. Blue and red lines indicate results with different BH critical mass of AGN in wet BH major mergers (blue: Mbh,crit = 107 M⊙; red: Mbh,crit = 107.7 M⊙). Red stars mark the hydrodynamical simulation result of Volonteri et al. (2016a). (Bottom) The number ratio of DAGNs to single AGNs (SAGNs) in gas-rich black hole mergers.
Download figure:
Standard image High-resolution image4. Conclusion and Discussion
In this work, we use the galaxy catalog of Guo et al. (2011, 2013) in the Millennium Simulation to explore galaxy–galaxy merger, especially major mergers across redshift 0–6. The major merger rate matches observation constraints well up to z ∼ 3. Moreover, we find that almost all major mergers are gas-rich at z > 3 which is the result of the increasing gas fraction in galaxies with increasing redshifts.
Because the high ratio of the wet major mergers at z > 3, to understand the starburst, BH rapid growth as well as AGN active during wet major mergers are crucial to the modeling of galaxy formation at high redshifts. We believed that the resolved cold gas phases (H i and H ii in disks) in semi-analytic models developed by (Xie et al. 2017; Henriques et al. 2020, etc.), which could be used to compare with future high-redshift observations (Sun et al. 2020), should help to refine the processes of star-forming during wet mergers. Furthermore, the galaxy merger diagram in our model, including the merger rate and the effect of major merger on the transition of galaxy and black hole evolution in the early universe, should be checked carefully combined with future observations (e.g., Faisst et al. 2019; González-López et al. 2019; Marsan et al. 2022, and A. Muzzin et al. 2022, in preparation).
Furthermore, we compare our model predictions with some merging phenomena on massive galaxies 3 < z < 6, and some main conclusions are as the below individually:
- 1.The incidence of gas-rich major merger: We predict that on average one wet major merger case with
 can be found among ∼1430 galaxies with comparable mass at z ∼ 7, though the selection criterion of dust and gas fraction is loose relative to the observed systems in Marrone et al. (2018). Also, we notice that our catalog shows a lack of massive galaxies at z > 3, one of improvements on this issue is additional constraints on SN feedback (e.g., Henriques et al. 2015; Hirschmann et al. 2016; Fontanot et al. 2017).
 - 2.The incidence of the dense starburst core in a cluster: We found that a dense system consisted of 14 gas-rich star-forming satellites could be located in an average projected physical region with a radius ∼0.06 Mpc in a cluster at 4 < z < 5, while the similar system found in Miller et al. (2018) is located within the 1σ scatter of the data distribution in simulation. This indicates that such a dense massive system is not rare at high redshift underlying our galaxy formation model. Also, improving the precision of measurement in the high-z observation is important in the future exploration.
- 3.The black hole–halo mass relation: In our catalog, although the relationship between SMBH mass and bulge stellar mass at z ∼ 0 satisfies the observed scaling relation, the local relationship between SMBH mass and host halo mass deviates from observational constraints slightly. Besides, our galaxy model fails to reproduce SMBHs with Mbh > 108 M⊙ at z ∼ 6. This suggests that the BH growth in early universe needs additional mechanisms.
- 4.The dual AGN fraction in wet major merger: AGNs are simply defined as BHs above a critical mass in wet major mergers. If we assume a lowest critical BH mass of 107 M⊙, the DAGN fraction increases with redshift and reaches the peak at z ∼ 5, and the ratio of DAGNs over SAGNs increases from 1 to 2 times over redshift 0–3. Whereas, if we assume a more realistic critical mass of 107.7 M⊙, the DAGN fraction reaches the peak at z ∼ 2 and decreases to zero at z ∼ 5.

Thus our galaxy model could reproduce the observational massive merging events at high redshift, while fails to reproduce the black hole–halo mass relation and the super massive black holes at z ∼ 6 as we have observed in a decade. As the AGN feedback is a key ingredient of galaxy evolution in simulations, it should be interesting to explore how to seed a black hole in early universe in SAMs, and to check the reliability of the black hole seeding and growth model from different simulations. Combining with that more optically obscured AGNs are discovered by Wide-Field Infrared Sky Explorer high-sensitivity hard-X-ray observations (e.g., Satyapal et al. 2014; Koss et al. 2018) within the BH separation of several kpc, we believe that the accretion mode of BHs in mergers, as well as the galaxy formation model in the early universe should be optimized in the future. Also, with the operation of James Webb Space Telescope, more observational data on the merging history of massive galaxies at high redshift will be available, we will be in a golden age to verify the formation history of galaxies during their earlier lives.
Acknowledgments
This work is supported by the National Key R&D Program of China (Nos. 2018YFE0202900 and 2022YFA1602901), the NSFC grant (Nos. 11988101, 11873051 and 12125302), CAS Project for Young Scientists in Basic Research Grant (No. YSBR-062), and the K.C. Wong Education Foundation. Q.G. acknowledges the National Key Research and Development of China (No. 2018YFA0404503), NSFC grant (No. 12033008), the K.C. Wong Education Foundation, and the science research grants from the China Manned Space Project with Nos. CMS-CSST-2021-A03 and CMS-CSST-2021-A07. P.H. acknowledges the support by the National Natural Science Foundation of China (Nos. 12047569 and 12147217), and by the Natural Science Foundation of Jilin Province, China (No. 20180101228JC).
Footnotes
- 5
Note that almost all major mergers are gas-rich at z > 3 in our simulation, as shown in the lower panel of Figure 1, allowing us to compare the gas-rich major merger fraction in simulation with the spectroscopic close pair counts in observation directly.
- 6
Volonteri et al. (2016a) presents the DAGN fraction in major mergers.