Abstract
Solar active regions (ARs) are crucial for understanding the long-term evolution of solar activities and predicting eruptive phenomena, including solar flares and coronal mass ejections. However, the cycle-dependent properties in the north–south asymmetry of ARs are not fully understood. In this study, we investigate the hemispheric distribution of ARs from Carrington rotations 1909–2278 (between 1996 May and 2023 November) by using three parameters that describe the magnetic field distribution of ARs: number, area, and flux. The main findings are as follows: (1) The three AR parameters show significant hemispheric asymmetry in cycles 23–25. The strong correlation between the AR area and flux indicates that they can better reflect the intrinsic properties of the solar magnetic field. (2) The correlation between sunspot activity and AR parameters varies in the two hemispheres across the different cycles. The AR parameters provide additional information for the variations in sunspot activity, which can better predict the intensity and cyclical changes of solar activity. (3) The variation in the fitting slope sign of the asymmetry index for AR parameters reflects periodic changes in hemispheric ARs, providing valuable insights into the activity of other stars. (4) Both the dominant hemisphere and the cumulative trend of AR parameters display a cycle-dependent behavior. Moreover, the trend variations in the AR area and flux are similar, reflecting the long-term evolutionary characteristics of the solar magnetic field. Our analysis results are relevant for understanding the hemispheric coupling of solar magnetic activity and its cyclic evolutionary patterns.
Original content from this work may be used under the terms of the Creative Commons Attribution 4.0 licence. Any further distribution of this work must maintain attribution to the author(s) and the title of the work, journal citation and DOI.
1. Introduction
Active regions (ARs) are areas on the Sun characterized by strong magnetic fields, originating from the emergence of flux tubes (Y. Fan 2009; M. C. M. Cheung et al. 2010). They are regarded as the primary sources of various solar activities, ranging from small-scale brightenings and jets to major events such as flares and coronal mass ejections (CMEs; L. van Driel-Gesztelyi & L. M. Green 2015). These regions determine solar polar fields and drive the variability of the solar cycle, exerting different impacts on space weather and various solar activities (M. Nagy et al. 2017; J. Jiang et al. 2019; S. Toriumi & H. Wang 2019). Therefore, studying the temporal and spatial behaviors of ARs is particularly important. Lots of studies have investigated the formation and evolution (N. R. Sheeley 1981; M. C. M. Cheung et al. 2010; M. C. M. Cheung & M. L. DeRosa 2012; R. F. Stein & Å. Nordlund 2012; M. A. Weber et al. 2023), and magnetic properties (S. A. Jaeggli & A. A. Norton 2016; V. I. Abramenko et al. 2018) of ARs, revealing flux variations and intercycle differences (A. V. Zhukova et al. 2019, 2020, 2022; A. Norton et al. 2023). These studies provide both theoretical and observational support for understanding the mechanisms and evolution of solar magnetic activity (P. Charbonneau 2014; J. Christensen-Dalsgaard 2021).
The study of individual ARs and their properties began with sunspot drawings and daily observations, but was revolutionized by G. E. Hale (1908), who demonstrated their magnetic nature (Hale’s law). The interactions of rising flux concentrations and supergranule-scale flows during the emergence process are key physical mechanisms in AR formation (V. Bumba & R. Howard 1965; A. C. Birch et al. 2019). The short-lived ARs exhibit regularity at different latitudes and evolve with solar cycles (N. N. Kontor & T. G. Khotilovskaya 1988). The magnetic properties of the AR display significant north–south (N-S) asymmetry during the cycle maximum, which is related to the internal magnetic field generation mechanisms of the Sun and magnetohydrodynamic (MHD) processes (R. C. Canfield & A. A. Pevtsov 1998). In recent years, significant progress has been made in AR research. V. Grigoryev et al. (2022) found that the formation of ARs is closely related to the large-scale magnetic field. T. Zhang et al. (2024a) analyzed automatically detected ARs and found that the northern hemisphere dominated both in AR number and cumulative area during solar cycle 24 (SC24). By studying ARs of different morphologies, A. V. Zhukova et al. (2019, 2020) revealed the interaction between mean-field dynamo mechanisms and small-scale turbulent dynamo processes, as well as the magnetic properties and temporal evolution of ARs across solar cycles. Subsequently, A. Zhukova et al. (2023) and A. Zhukova (2024) found that ARs of different morphologies exhibit a significant N-S asymmetry that varies over the solar cycles. The hemispheric asymmetry may be attributed to dynamo processes of the global magnetic field, the interaction of dipolar and quadrupolar components, and turbulent magnetic field effects. Although numerous studies have explored the characteristics of ARs, there is still a lack of extensive research on their asymmetric distribution. To date, the study of the N-S asymmetry in solar activity has garnered considerable attention (P. I. Duchlev 2001; J. Jiang et al. 2007a).
The N-S asymmetry is one of the most striking manifestations of the solar cycle (M. Schüssler & R. H. Cameron 2018; R. Das et al. 2022), driven by the dynamic processes of the convective dynamo (S. Hazra & D. Nandy 2019; L. Kitchatinov & A. Khlystova 2021; E. Blanter & M. Shnirman 2021). The hemispheric asymmetry of the solar magnetic structures plays a crucial role in understanding the internal dynamo mechanism and subphotospheric dynamics (P. Chowdhury et al. 2013). The 11 yr cycle of sunspot positions follows “Spörer’s law of zones” as illustrated by the well-known “Butterfly diagram” (E. W. Maunder 1904). This periodicity is reflected not only in the variation in sunspot numbers (D. H. Hathaway et al. 1999), but also in the spatial distribution of ARs (A. V. Zhukova et al. 2020).
Many previous studies have used solar activity indicators, including sunspot numbers and sunspot group numbers (K. Li et al. 2000; M. Temmer et al. 2002; K. J. Li et al. 2009; A. M. Veronig et al. 2021), sunspot area (R. Oliver & J. L. Ballester 1994; J. L. Ballester et al. 2005; B. Ravindra et al. 2021), flare index (T. Ataç & A. Özgüç 1996, 2001; A. Özgüç et al. 2003, 2004; S. Roy et al. 2020), filaments/prominences (V. K. Verma 2000; K. J. Li et al. 2010; T. Zhang et al. 2024a), and CMEs (P.-X. Gao et al. 2009; X. J. Zhang et al. 2023) to study the asymmetry of solar activity. For solar ARs, most studies have focused primarily on magnetic flux to analyze N-S asymmetry. However, other parameters, such as the number and area of the AR, are also critical indicators of solar magnetic activity (F. Tang et al. 1984; D. H. Hathaway 2015). The differences and evolutionary patterns of these parameters remain inadequately understood between the two hemispheres and different solar cycles. Thus, more research is needed to better understand the hemispheric characteristics of ARs in different parameters.
Moreover, past studies and reconstructions of solar activity have utilized data from all magnetic regions on the solar surface (i.e., on dark sunspots, bright faculae-plage, and network) (F. Berrilli et al. 2020; Y. M. Wang & J. L. Lean 2021; T. Chatzistergos et al. 2022; V. Penza et al. 2024). These data are crucial for understanding the magnetic activity and variations in the Sun and Sunlike stars. The sunspot number is the only direct measurement of solar activity (approximately 1600–1900) (I. G. Usoskin et al. 2003; R. Arlt & J. M. Vaquero 2020), and many studies have used it as the sole proxy to reconstruct past magnetic activity and irradiance (G. Petrie et al. 2021; A. R. Yeates et al. 2023). These studies improved our understanding of the mechanisms behind the solar activity variations. Therefore, studying the relationship between AR parameters (i.e., number, area, and flux) and sunspot activity from 1996 to 2023 is also important for reconstructing past solar activity.
In this paper, we use the latest comprehensive AR database provided by R. Wang et al. (2024) that systematically analyzes the hemispheric distribution characteristics of AR parameters during SC23 to SC25. In addition, we further study the relationship between the AR parameters and sunspot activity, providing a new perspective for solar magnetic activity. The remainder of this paper is structured as follows: Section 2 introduces the data and methods used in our study. Section 3 presents the results and analysis of the hemispheric distribution characteristics of ARs. Conclusions and discussions are provided in Section 4.
2. Data and Methods
2.1. AR Parameters
The data for this study are derived from the live homogeneous AR database7 provided by R. Wang et al. (2023, 2024). They developed a method to automatically detect ARs from 1996 onward based on the Michelson Doppler Imager on board the Solar and Heliospheric Observatory (SOHO/MDI; P. H. Scherrer et al. 1995) and the Helioseismic and Magnetic Imager on board the Solar Dynamics Observatory (SDO/HMI; P. H. Scherrer et al. 2012) synoptic magnetograms. This method has advantages in excluding decayed ARs, unipolar regions, and ensuring compatibility with any available synoptic magnetograms. They calibrated the identified AR area and flux and calculated the dipole field. This database enhances our understanding of solar cycles, particularly the variations in the polar magnetic field.
The database comprises 2892 ARs spanning from CR 1909 to CR 2278 (1996.5–2023.11), includes two sets of parameters: the first set consists of basic AR parameters, such as number, area, and total unsigned flux, while the second set includes parameters directly related to solar cycle variability, such as the initial dipole field (Di), the final dipole field (Df), and the bipolar magnetic region approximations for both parameters, denoted as  . This study employs the following key parameters: the latitude of the flux-weighted centroid for both polarities and the whole AR, and the area and flux of each polarity. Additionally, the Carrington rotation (CR) number and label are commonly used to uniquely identify each AR. We apply the CR period as defined by W. T. Thompson (2006) to calculate the specific appearance times of each AR.
As illustrated in Figure 1, the latitude–time relationship diagrams of the three AR parameters from 1996 to 2023 form the typical pattern “Maunder butterfly diagram” (E. W. Maunder 1904). Panels (a), (b), and (c) clearly demonstrate that (1) ARs begin emerging at midlatitudes (approximately 30°) in the early stages of the cycle. As the cycle progresses, the emergence moves closer to the equator. This equatorward progression of emergence of ARs is known as Spörer’s law (E. W. Maunder 1903); and (2) the spatial and temporal variations of ARs are asynchronized between the two hemispheres.
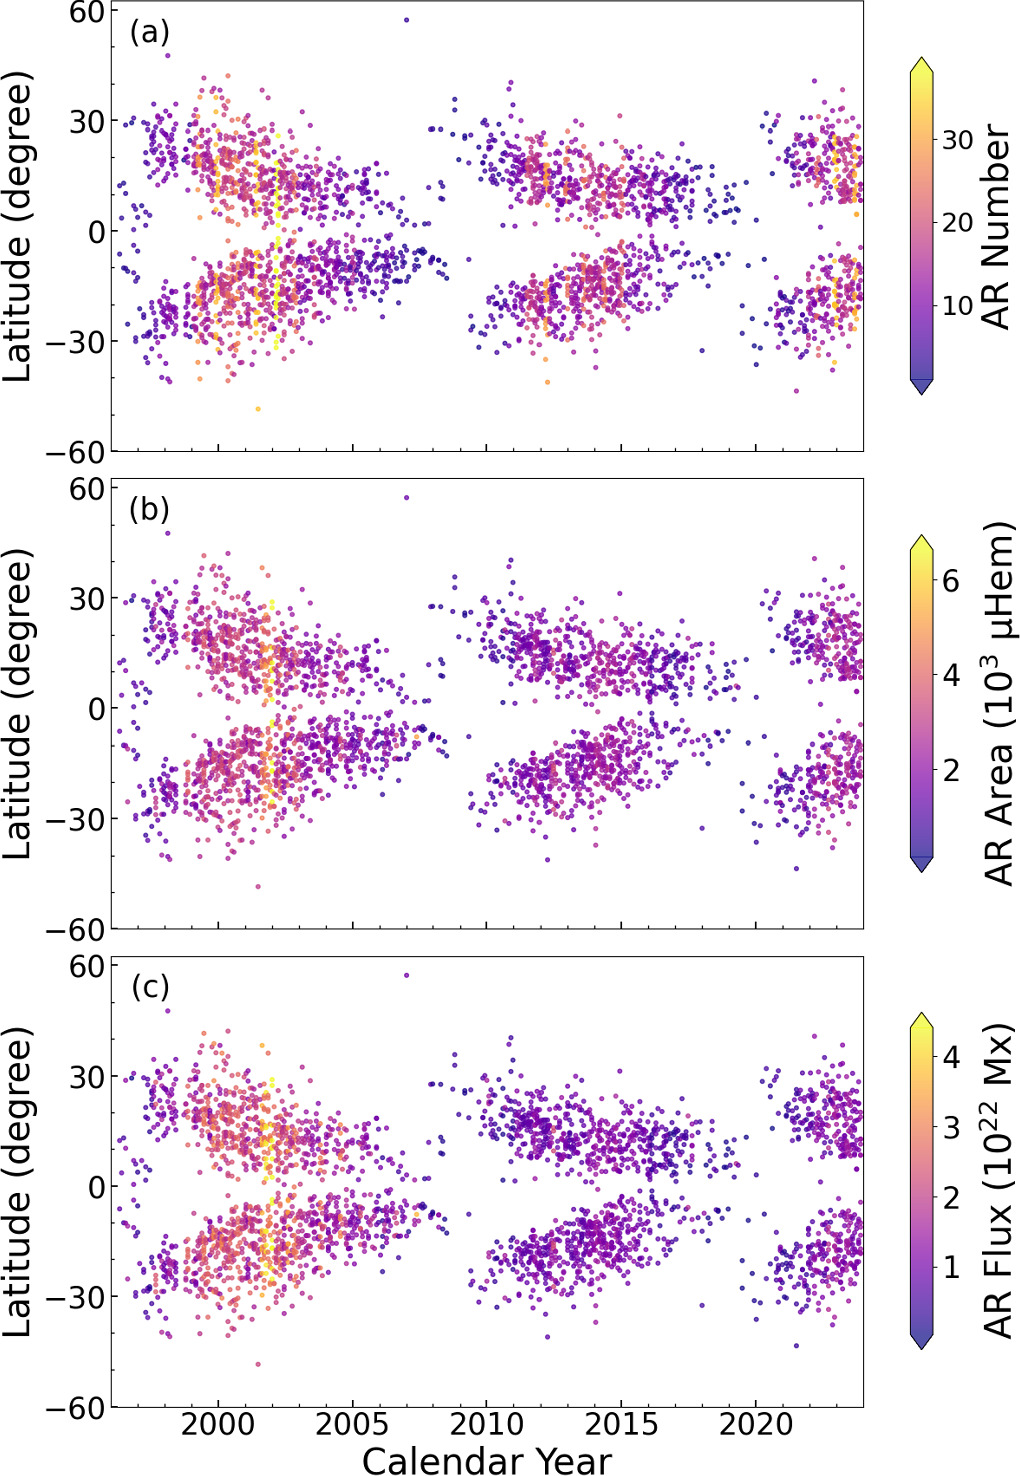
Figure 1. Butterfly diagrams of AR parameters from 1996 May to 2023 November. From top to bottom, the panels depict the latitude–time distribution of AR number, area, and flux. The colors show AR number, average area, and flux, respectively.
Download figure:
Standard image High-resolution imageFigure 2 displays the temporal variations of the three AR parameters in different hemispheres, spanning SC23 to part of SC25. All data are processed with a 13 month smoothing filter to remove high-frequency fluctuations. The curve reveals periodic fluctuations in solar activity and highlights differences between the two hemispheres. From Figure 2, one can see that (1) there is a clear N-S asymmetry in the three parameters of the AR across different solar cycles; (2) the trends of the AR area and flux are similar throughout the period that show significant differences from the AR number; and (3) the AR area and flux in SC24 have decreased significantly compared to SC23, while the AR number remains relatively consistent across both cycles. These differences may offer valuable insights for predicting the intensity of future solar cycles.

Figure 2. Time evolution of the AR parameters from 1996 May to 2023 November. From top to bottom: AR number, area, and flux. The blue (red) lines represent the northern (southern) hemisphere. The black (gray) dashed lines represent the maximum and minimum times of the solar cycles.
Download figure:
Standard image High-resolution image2.2. Sunspot Parameters
ARs are concentrated areas where the solar magnetic field interacts with plasma and serve as crucial environmental factors in the formation of sunspots. Sunspot activity is a fundamental indicator of the solar cycle (H. Schwabe 1844; D. H. Hathaway 2015), and the numbers and areas of sunspots are critical observational metrics for assessing magnetic field strength. Studying the relationship between sunspot activity and AR parameters may provide important values for understanding solar internal magnetic activity and dynamic processes.
This study utilizes the monthly time series of the hemispheric sunspot data, compiled by the World Data Center–Sunspot Index and Long-term Solar Observations8 (F. Clette et al. 2014). The database has been widely regarded as the standard reference for solar cycle behavior and is commonly used to investigate the long-term evolution of the solar cycle (R. Arlt & J. M. Vaquero 2020; V. M. S. Carrasco et al. 2021). The sunspot area data are derived from the monthly sunspot areas (in units of millionths of a solar hemisphere) (D. H. Hathaway 2015) compiled by the Royal Greenwich Observatory, the US Air Force, and the National Oceanic and Atmospheric Administration.9 Figure 3 presents the monthly distribution of sunspot numbers and areas across different hemispheres from 1996 May to 2023 November, aligned with the specific occurrences of ARs.

Figure 3. Monthly distribution of sunspot numbers and areas. Top panel: the monthly average hemispheric sunspot numbers, with the northern (southern) hemisphere show in blue (red). Bottom panel: same as the top panel, but corresponds to sunspot areas, smoothed using a 13 month running average. The gray dashed lines represent the minimum times of the solar cycle.
Download figure:
Standard image High-resolution imageAs shown in Figure 3, there are significant differences in solar activity between the two hemispheres, as can be observed: (1) the sunspot numbers and areas occur asynchronously in both hemispheres, exhibiting different intensities of development; and (2) the sunspot numbers and areas in SC24 have decreased significantly compared to SC23, especially in the northern hemisphere. This trend resembles the changes for the AR area and flux shown in Figure 2, but differs from the variation in the AR number.
Table 1. Correlation between AR Parameters and Sunspot Parameters in Different Cycles and Hemispheres
| Sunspot Parameters | Solar Cycle | Hemisphere | AR Number | AR Area (μHem) | AR Flux (Mx) | |||
|---|---|---|---|---|---|---|---|---|
| (r) | (k) | (r) | (k) | (r) | (k) | |||
| Sunspot number | SC23 | N | 0.9888 | 0.8786 | 0.9099 | 0.6200 | 0.9100 | 0.4081 |
| S | 0.9738 | 0.7572 | 0.8888 | 0.5399 | 0.8965 | 0.3640 | ||
| SC24 | N | 0.9770 | 0.6213 | 0.8492 | 0.6825 | 0.8490 | 0.6617 | |
| S | 0.9631 | 0.6089 | 0.9024 | 0.6637 | 0.9012 | 0.6095 | ||
| Sunspot area | SC23 | N | 0.9664 | 0.7408 | 0.9695 | 0.0589 | 0.9777 | 3.9092 |
| S | 0.9121 | 0.6499 | 0.9489 | 0.0541 | 0.9577 | 3.6555 | ||
| SC24 | N | 0.9446 | 0.5260 | 0.9744 | 0.0641 | 0.9798 | 6.2530 | |
| S | 0.9144 | 0.5670 | 0.9803 | 0.0708 | 0.9837 | 6.5355 | ||
Note. The correlation coefficient (r) represents the Pearson correlation coefficient between sunspot parameters and AR parameters. The values (k) represent the fitting slope obtained from linear regression between sunspot parameters and AR parameters. All the correlation coefficients are above the 99% confidence level.
Download table as: ASCIITypeset image
2.3. Analysis Methods
2.3.1. Expression of Hemispheric Asymmetry
The hemispheric asymmetry of solar activity is one of the most significant and intriguing features of the solar cycle. The N-S asymmetry of the AR parameters can be characterized by the normalized asymmetry index (NAI; H. W. Newton & A. S. Milsom 1955; J. L. Ballester et al. 2005) or the absolute asymmetry index (AAI; M. Temmer et al. 2006; N. V. Zolotova & D. I. Ponyavin 2006; R. Donner & M. Thiel 2007), which are expressed as follows:


Here, VN and VS represent the values of the three AR parameters in a certain year for the northern and southern hemispheres, respectively.
Furthermore, to better illustrate the long-term behavior of the hemispheric asymmetry, K. J. Li et al. (2009) proposed the cumulative absolute asymmetry index (CAAI; J. Zhang & W. Feng 2015; X. Zhang et al. 2024b), defined as follows:

Here, CN and CS denote the cumulative monthly values of the AR parameters in the northern and southern hemispheres, respectively. We calculated the values of the AR parameters for the two hemispheres during SC23–SC25 (see Sections 3.4 and 3.5). By quantitatively analyzing these asymmetry indices, we can gain deeper insights into the magnetic field evolution dynamics between the two hemispheres across different cycles and reveal their underlying physical mechanisms.
2.3.2. Statistical Testing
To assess the statistical significance of the NAI for each year, we calculated the actual probability of generating such an asymmetrical distribution. Consider n objects distributed across two hemispheres, where each object has a random probability of  appearing in one hemisphere. We use the following binomial formula (4) to derive the probability P(k) of obtaining k objects in one hemisphere and (n − k) objects in the other hemisphere (G. Vizoso & J. L. Ballester 1990; M. Carbonell et al. 1993; B. Joshi et al. 2006):

The probability of obtaining more than d objects in one hemisphere is
In general, if the probability of the AR parameters in a certain year is less than 10% or greater than 90%, it is deemed that the distribution of the ARs in the two hemispheres has statistical significance and is not caused by random fluctuations. In contrast, if the probability is greater than 10% and less than 90%, the distribution of the ARs in both hemispheres is relatively balanced and statistically insignificant.
3. Analysis Results
3.1. Distribution of the AR Parameters
As illustrated in Figure 2, the three AR parameters show different temporal behaviors in the two hemispheres. For the AR number, the two hemispheres are highly synchronized, and the distributions remain relatively concentrated during the ascending phase of SC23. However, significant phase differentiation occurs between the two hemispheres during the declining phase of SC23, with the southern hemisphere leading the northern one. In addition, the activity patterns of both hemispheres exhibit a step-like evolution. The depth of the gap between the two main maxima of the cycle in different hemispheres is similar, and the time profiles look almost like a plateau. After entering SC24, the two main maxima are formed by ARs in different hemispheres (the northern hemisphere dominates in the first maximum, while the southern hemisphere takes the lead in the second maximum), reflecting a marked hemispheric difference. This trend is observed not only in the AR number but also in the variations of the AR area and flux. This aligns with the findings of S. Mandal & D. Banerjee (2016), who showed that the double peaks may occur in one of the hemispheres without having any counterpart of the same in the other hemisphere. During the ascending phase (2010–2013) and the descending phase (2016–2020) of SC24, the activity of the northern hemisphere significantly exceeds that of the southern one. Furthermore, it should be noted that activity in the southern hemisphere increases rapidly and forms the second peak after the first peak of SC24, while the northern hemisphere weakens and levels off. This divergence results in a significant amplitude difference between the two hemispheres.
For the AR area and flux, their variation trends are quite similar but differ from the behavior of the AR number. The distribution of activity across the two hemispheres is relatively dispersed, with a slight overall dominance in the northern hemisphere during the ascending phase of SC23. The first peak occurs in the northern hemisphere, followed by a rapid increase in the AR area and flux in the southern hemisphere. Meanwhile, the northern hemisphere’s activity enters a relatively steady phase, displaying a plateau-like structure. During this interval, the AR number in both hemispheres remains relatively stable. This phenomenon can be attributed to the turbulent component of the dynamo, which leads to variations in the magnetic flux of AR, thereby enhancing activity in the southern hemisphere. This suggests that variations in the AR area and flux are more critical for studying the solar surface magnetic field.
The activity in the southern hemisphere is slightly stronger than in the northern one during SC25 (2021–2022). Subsequently, the activity becomes relatively concentrated across both hemispheres, and the northern hemisphere leads the southern one by 2023 November. This phase of evolution provides valuable insights for understanding and predicting solar cycles.
Overall, the AR parameters show significant asynchrony during different solar cycles. In addition, compared to SC23, there is a significant decrease in the AR area and flux during SC24, which may be attributed to the intensity of the solar cycles (F. K. Dagnew et al. 2020; A. Prasad et al. 2022). The trends in the AR area and flux are more pronounced than the AR number, a fact that had been studied before (A. Zhukova et al. 2023). The double-peak structure of a cycle as a whole is formed by ARs from both hemispheres, except for the AR number in SC23. This asynchrony reveals an asymmetric evolution of the solar magnetic field between the two hemispheres, reflecting the complex magnetic field restructuring and hemispheric differences throughout the solar cycle.
3.2. Correlations between the AR Parameters
According to the study by R. Wang et al. (2023), calibration of parameters based on SOHO/MDI and SDO/HMI synoptic magnetograms found that discrepancies still persisted after the corrected identification results. This mainly affected the AR number with minimal impact on the AR area and flux. They emphasized that the AR area and flux are critical for studying the solar surface magnetic field, whereas the AR number is relatively less impactful. Furthermore, they also found that the ratios of SC23 and SC24 for the AR area and flux are almost identical. This similarity is consistent with the well-known linear correlation between the AR area and flux (N. R. Sheeley 1966).
As mentioned in Section 3.1, the trend of variation of the AR area and flux is similar between the two hemispheres. Therefore, the correlations between the three AR parameters may provide deeper insights, and it is more likely to help further understand the roles and mutual interactions of different parameters during solar cycles, as well as the formation and evolution of the solar magnetic field.
Figure 4 shows the correlation between the three AR parameters across the different solar cycles. It is evident from the figure that the AR area and flux consistently exhibit the strongest correlation across all observed periods, with the Pearson correlation coefficients reaching 0.9928, 0.9914, 0.9986, and 0.9752 for SC23, SC24, SC25, and the entire period, respectively. The correlation coefficients in Figure 4 are both above the confidence level of 95%, implying a high degree of correlation between the three AR parameters. This robust correlation is succeeded by the relationship between the AR number and area, while the correlation between the AR number and flux remains the lowest. This relationship remains consistent across the different solar cycles, further validating and reinforcing the conclusions of N. R. Sheeley (1966), providing a better understanding of the solar magnetic field’s variation patterns and its behavior across the different solar cycles. In addition, we also observe that compared to SC23, the correlation between the AR area and flux decreases during SC24, while the correlation between the AR number and area, as well as between the AR number and flux, increased, highlighting the differences between the three parameters of the AR.

Figure 4. Scatter plots of correlation coefficients between pairs of AR parameters across the different solar cycles. From top to bottom, the panels display the correlation between the AR number and area, the AR number and flux, and the AR area and flux, with each subplot labeled with the respective correlation coefficient (r) and the slope of the fitted line (k). Red dots indicate actual observed data points, while the blue line represents the fitted trend line.
Download figure:
Standard image High-resolution image3.3. Differences between the AR Parameters and Sunspot Parameters
To better investigate the relationship between the AR parameters and sunspot activity in different hemispheres, the monthly distributions of the AR parameters and sunspot numbers are plotted as shown in Figure 5. Panel (a) shows the monthly distribution of the AR numbers and sunspot numbers in different hemispheres, while panels (b) and (c) correspond to the AR area and flux versus sunspot numbers, respectively. Figure 6 is similar to Figure 5, but shows the monthly distributions of the AR parameters compared to the sunspot areas. Here, some data are scaled to facilitate the visualization of correlation variations (e.g., in Figure 5(a), the sunspot numbers are divided by 13 in the two hemispheres).

Figure 5. Monthly distribution of the AR parameters (red lines) and sunspot numbers (blue lines), where solid lines represent the northern hemisphere and dashed lines represent the southern hemisphere. The gray dashed lines represent the minimum times of the solar cycle. All data are processed with a 13 month smoothing filter to remove high-frequency fluctuations.
Download figure:
Standard image High-resolution image
Figure 6. Similar to Figure 5, but showing the comparison between the AR parameters and sunspot areas.
Download figure:
Standard image High-resolution imageTo provide a clearer view of the correlation, Table 1 presents the correlation coefficients between the sunspot numbers and areas with various AR parameters in different cycles and hemispheres. Our research shows that there is a strong correlation between the three parameters of the AR and sunspot activity across the different solar cycles and hemispheres. As illustrated in panels (b) and (c) of Figure 6, the trends of the AR area and flux are similar to those of sunspot areas. This indicates that the formation and evolution of ARs are closely related to the variations in sunspot areas, making the AR area and flux important indicators of sunspot activity intensity. In contrast, the correlation between the AR area, flux, and sunspot numbers is slightly weaker in the southern hemisphere during SC23 and in the northern hemisphere during SC24.
In addition, there are differences in the correlation between the two hemispheres across the different solar cycles. The correlation in the northern hemisphere is stronger than in the southern one during SC23. In contrast, the southern hemisphere exhibits a higher overall correlation compared to the northern hemisphere in SC24, except for the number of AR and sunspot parameters. This indicates that there are differences in the structure and distribution of ARs, with magnetic reconnection and the evolutionary processes of ARs causing these differences. Furthermore, the solar magnetic field structure becomes more complex and unstable during the cycle minimum, which may lead to discrepancies in the intensity of activity between the two hemispheres. The weak correlation may reflect this complexity.
In conclusion, sunspot areas demonstrate a strong correlation with the AR parameters, especially the AR area and flux, which can serve as important indicators of solar magnetic activity and AR evolution. In contrast, while sunspot numbers reflect the frequency of the formation (see Figure 5(a)), they are less precise in capturing intensity and flux characteristics. The relationship between sunspot activity and AR parameters not only exhibits asymmetry across the different solar cycles, but also shows significant hemispheric differences, highlighting the regionality and complexity of solar magnetic activity (J. M. Beckers & E. H. Schröter 1968; S. Toriumi et al. 2017). This provides important reference value for understanding the solar interior magnetic field activity and dynamic processes.
3.4. Dominant Hemisphere of the AR Parameters in Each Year
Table 2 shows the annual total numbers of ARs in each hemisphere. The NAI and the corresponding probabilities for each year are calculated using Equations (1) and (5), respectively. A binomial distribution is applied to determine the dominant hemisphere for each year, where the symbol “⋯” indicates that the levels of ARs in both hemispheres are approximately equal. Tables 3 and 4 are similar to Table 2, but correspond to the AR area and flux, respectively.
Table 2. Asymmetrical Distribution of the AR Number for Each Year from 1996 to 2023
| Year | VN | VS | Asymmetry | Probability | Dominant Hemisphere |
|---|---|---|---|---|---|
| 1996 | 10 | 10 | 0 | 5.881 × 10⁻¹ | ⋯ |
| 1997 | 40 | 34 | 0.081 | 7.920 × 10⁻¹ | ⋯ |
| 1998 | 37 | 45 | −0.098 | 1.601 × 10⁻¹ | ⋯ |
| 1999 | 98 | 98 | 0 | 5.285 × 10⁻¹ | ⋯ |
| 2000 | 110 | 110 | 0 | 5.269 × 10⁻¹ | ⋯ |
| 2001 | 105 | 109 | −0.019 | 3.663 × 10⁻¹ | ⋯ |
| 2002 | 91 | 118 | −0.129 | 2.625 × 10⁻² | S |
| 2003 | 59 | 79 | −0.145 | 3.673 × 10⁻² | S |
| 2004 | 37 | 72 | −0.321 | 2.525 × 10⁻⁴ | S |
| 2005 | 31 | 53 | −0.262 | 5.817 × 10⁻³ | S |
| 2006 | 10 | 41 | −0.608 | 1.694 × 10⁻⁶ | S |
| 2007 | 8 | 17 | −0.360 | 2.164 × 10⁻² | S |
| 2008 | 9 | 6 | 0.200 | 8.491 × 10⁻¹ | ⋯ |
| 2009 | 12 | 7 | 0.263 | 9.165 × 10⁻¹ | N |
| 2010 | 43 | 26 | 0.246 | 9.853 × 10⁻¹ | N |
| 2011 | 89 | 69 | 0.127 | 9.528 × 10⁻¹ | N |
| 2012 | 81 | 78 | 0.019 | 6.244 × 10⁻¹ | ⋯ |
| 2013 | 72 | 102 | −0.172 | 9.255 × 10⁻³ | S |
| 2014 | 72 | 109 | −0.204 | 2.300 × 10⁻³ | S |
| 2015 | 67 | 59 | 0.064 | 7.886 × 10⁻¹ | ⋯ |
| 2016 | 62 | 27 | 0.393 | 9.999 × 10⁻¹ | N |
| 2017 | 35 | 12 | 0.489 | 9.998 × 10⁻¹ | N |
| 2018 | 15 | 9 | 0.250 | 9.242 × 10⁻¹ | N |
| 2019 | 7 | 5 | 0.167 | 8.062 × 10⁻¹ | ⋯ |
| 2020 | 10 | 22 | −0.375 | 1.003 × 10⁻² | S |
| 2021 | 36 | 43 | −0.089 | 1.841 × 10⁻¹ | ⋯ |
| 2022 | 83 | 82 | 0.006 | 5.618 × 10⁻¹ | ⋯ |
| 2023 | 94 | 87 | 0.0389 | 7.239 × 10⁻¹ | ⋯ |
Note. VN and VS represent the values of the AR number in a certain year for the northern and southern hemispheres, respectively. Asymmetry represents NAI (see Equation (1)). The symbol “⋯” indicates that the levels of ARs in both hemispheres are approximately equal.
Download table as: ASCIITypeset image
Table 3. Asymmetrical Distribution of the AR Area for Each Year from 1996 to 2023
| Year | VN (μHem) | VS (μHem) | Asymmetry | Probability | Dominant Hemisphere |
|---|---|---|---|---|---|
| 1996 | 7349 | 20,135 | −0.465 | 2.962 × 10⁻³ | S |
| 1997 | 61,494 | 45,316 | 0.152 | 9.509 × 10⁻¹ | N |
| 1998 | 77,117 | 101,679 | −0.137 | 2.584 × 10⁻² | S |
| 1999 | 304,493 | 242,349 | 0.114 | 9.965 × 10⁻¹ | N |
| 2000 | 352,941 | 306,098 | 0.071 | 9.693 × 10⁻¹ | N |
| 2001 | 323,792 | 377,736 | −0.077 | 1.892 × 10⁻² | S |
| 2002 | 277,032 | 388,023 | −0.167 | 6.714 × 10⁻⁶ | S |
| 2003 | 136,706 | 173,384 | −0.118 | 1.772 × 10⁻² | S |
| 2004 | 82,764 | 144,874 | −0.273 | 1.346 × 10⁻⁵ | S |
| 2005 | 48,178 | 92,102 | −0.313 | 6.281 × 10⁻⁵ | S |
| 2006 | 7757 | 74,117 | −0.811 | 6.661 × 10⁻¹⁶ | S |
| 2007 | 6078 | 25,129 | −0.611 | 9.610 × 10⁻⁵ | S |
| 2008 | 4917 | 6273 | −0.121 | 2.744 × 10⁻¹ | ⋯ |
| 2009 | 11,728 | 6385 | 0.295 | 9.519 × 10⁻¹ | N |
| 2010 | 48,001 | 35,503 | 0.150 | 9.381 × 10⁻¹ | N |
| 2011 | 201,282 | 101,226 | 0.331 | ≈1.0 | N |
| 2012 | 169,369 | 147,466 | 0.069 | 9.022 × 10⁻¹ | N |
| 2013 | 125,907 | 199,266 | −0.226 | 1.880 × 10⁻⁵ | S |
| 2014 | 139,795 | 291,050 | −0.351 | 6.800 × 10⁻¹⁴ | S |
| 2015 | 141,957 | 108,418 | 0.134 | 9.867 × 10⁻¹ | N |
| 2016 | 82,243 | 28,863 | 0.480 | ≈1.0 | N |
| 2017 | 45,872 | 15,897 | 0.485 | ≈1.0 | N |
| 2018 | 14,215 | 5434 | 0.447 | 9.904 × 10⁻¹ | N |
| 2019 | 8168 | 1390 | 0.709 | 9.980 × 10⁻¹ | N |
| 2020 | 6828 | 29,887 | −0.628 | 2.063 × 10⁻⁵ | S |
| 2021 | 38,847 | 56,092 | −0.182 | 3.211 × 10⁻² | S |
| 2022 | 182,123 | 173,986 | 0.023 | 6.833 × 10⁻¹ | ⋯ |
| 2023 | 218,907 | 190,829 | 0.069 | 9.240 × 10⁻¹ | N |
Note. VN and VS represent the values of the AR area in a certain year for the northern and southern hemispheres, respectively. Asymmetry represents NAI (see Equation (1)). For the calculation of the actual distribution probabilities, the AR area is uniformly rounded to an integer and divided by 103 μHem. The symbol “⋯” indicates that the levels of ARs in both hemispheres are approximately equal.
Download table as: ASCIITypeset image
Table 4. Asymmetrical Distribution of the AR Flux for Each Year from 1996 to 2023
| Year | VN (Mx) | VS (Mx) | Asymmetry | Probability | Dominant Hemisphere |
|---|---|---|---|---|---|
| 1996 | 3.707 × 10²² | 1.479 × 10²³ | −0.599 | 2.213 × 10⁻³ | S |
| 1997 | 4.305 × 10²³ | 3.193 × 10²³ | 0.148 | 9.173 × 10⁻¹ | N |
| 1998 | 5.095 × 10²³ | 7.277 × 10²³ | −0.176 | 1.922 × 10⁻² | S |
| 1999 | 2.328 × 1024 | 1.820 × 1024 | 0.122 | 9.947 × 10⁻¹ | N |
| 2000 | 2.650 × 1024 | 2.362 × 1024 | 0.057 | 9.100 × 10⁻¹ | N |
| 2001 | 2.453 × 1024 | 2.752 × 1024 | −0.057 | 8.697 × 10⁻² | S |
| 2002 | 2.109 × 1024 | 2.920 × 1024 | −0.161 | 1.243 × 10⁻⁴ | S |
| 2003 | 1.146 × 1024 | 1.322 × 1024 | −0.071 | 1.260 × 10⁻¹ | ⋯ |
| 2004 | 6.543 × 10²³ | 1.092 × 1024 | −0.251 | 3.026 × 10⁻⁴ | S |
| 2005 | 4.012 × 10²³ | 7.247 × 10²³ | −0.287 | 8.473 × 10⁻⁴ | S |
| 2006 | 4.800 × 10²² | 5.051 × 10²³ | −0.826 | 5.504 × 10⁻¹² | S |
| 2007 | 3.984 × 10²² | 1.926 × 10²³ | −0.657 | 2.441 × 10⁻⁴ | S |
| 2008 | 2.790 × 10²² | 4.319 × 10²² | −0.215 | 2.266 × 10⁻¹ | ⋯ |
| 2009 | 7.256 × 10²² | 3.929 × 10²² | 0.297 | 8.867 × 10⁻¹ | ⋯ |
| 2010 | 2.941 × 10²³ | 1.814 × 10²³ | 0.237 | 9.605 × 10⁻¹ | N |
| 2011 | 1.066 × 1024 | 5.233 × 10²³ | 0.342 | ≈1.0 | N |
| 2012 | 9.039 × 10²³ | 8.004 × 10²³ | 0.061 | 8.005 × 10⁻¹ | ⋯ |
| 2013 | 6.319 × 10²³ | 1.064 × 1024 | −0.255 | 3.339 × 10⁻⁴ | S |
| 2014 | 6.876 × 10²³ | 1.605 × 1024 | −0.400 | 2.505 × 10⁻¹⁰ | S |
| 2015 | 7.248 × 10²³ | 5.708 × 10²³ | 0.119 | 9.207 × 10⁻¹ | N |
| 2016 | 4.130 × 10²³ | 1.522 × 10²³ | 0.461 | 9.999 × 10⁻¹ | N |
| 2017 | 2.339 × 10²³ | 9.565 × 10²² | 0.420 | 9.932 × 10⁻¹ | N |
| 2018 | 6.157 × 10²² | 2.663 × 10²² | 0.396 | 9.102 × 10⁻¹ | N |
| 2019 | 4.495 × 10²² | 5.265 × 10²¹ | 0.790 | 3.125 × 10⁻² | S |
| 2020 | 2.722 × 10²² | 1.514 × 10²³ | −0.695 | 6.561 × 10⁻⁴ | S |
| 2021 | 1.894 × 10²³ | 3.074 × 10²³ | −0.238 | 3.245 × 10⁻² | S |
| 2022 | 9.944 × 10²³ | 9.504 × 10²³ | 0.023 | 6.401 × 10⁻¹ | ⋯ |
| 2023 | 1.187 × 1024 | 1.011 × 1024 | 0.080 | ≈8.999 × 10⁻¹ | ⋯ |
Note. VN and VS represent the values of the AR flux in a certain year for the northern and southern hemispheres, respectively. Asymmetry represents NAI (see Equation (1)). For the calculation of the actual distribution probabilities, the AR flux is uniformly divided by 1022 Mx. The symbol “⋯” indicates that the levels of ARs in both hemispheres are approximately equal.
Download table as: ASCIITypeset image
Table 5. Asymmetrical Distribution of the AR Parameters during SC23 to SC25
| AR Parameters | Solar Cycle | VN | VS | Asymmetry | Probability | Dominant Hemisphere |
|---|---|---|---|---|---|---|
| AR number | SC23 | 644 | 792 | −0.103 | 4.155 × 10⁻⁵ | S |
| SC24 | 556 | 502 | 0.051 | 9.546 × 10⁻¹ | N | |
| SC25 | 223 | 235 | −0.026 | 2.718 × 10⁻¹ | ⋯ | |
| AR area (μHem) | SC23 | 1,689,849 | 1,997,215 | −0.083 | 1.935 × 10⁻⁷ | S |
| SC24 | 989,305 | 940,528 | 0.025 | 8.677 × 10⁻¹ | ⋯ | |
| SC25 | 446,704 | 451,164 | −0.005 | 4.337 × 10⁻¹ | ⋯ | |
| AR flux (Mx) | SC23 | 1.283 × 1025 | 1.493 × 1025 | −0.076 | 3.081 × 10⁻⁵ | S |
| SC24 | 5.139 × 1024 | 5.062 × 1024 | 0.008 | 6.109 × 10⁻¹ | ⋯ | |
| SC25 | 2.398 × 1024 | 2.422 × 1024 | −0.005 | 4.457 × 10⁻¹ | ⋯ | |
Note. VN and VS represent the values of the three AR parameters in a certain year for the northern and southern hemispheres, respectively. Asymmetry represents NAI (see Equation (1)). For the calculation of the actual distribution probabilities, the AR area is uniformly rounded to an integer and divided by 103 μHem, and the AR flux is uniformly divided by 1022 Mx. The symbol “⋯” indicates that the levels of ARs in both hemispheres are approximately equal.
Download table as: ASCIITypeset image
As shown in Table 2, one can see that, among the hemispheric asymmetry of the AR numbers within 28 yr (from 1996 to 2023), the hemispheric asymmetry is highly significant in 15 cases and insignificant in 13 cases. This indicates that more than 53% of the observations exhibit a pronounced N-S asymmetry. This finding suggests that the hemispheric asymmetry in the AR number is a genuine physical phenomenon during this period. We observe that there is no dominant hemisphere in terms of the AR number during the ascending phase of SC23, whereas the southern hemisphere shows dominance after 2002. The northern hemisphere dominates before and after the maximum time of SC24, while the southern hemisphere dominates during the cycle maximum. For the ongoing SC25, as the data only cover the ascending phase, the trend is likely similar to the SC23 with no clear dominant hemisphere, except for the year 2020.
From Table 3, it is evident that the hemispheric distribution of the AR area shows a significant asymmetry in 26 cases (from 1996 to 2023), with only two cases being insignificant. This means that more than 90% of the observations show a pronounced N-S asymmetry, indicating that the hemispheric asymmetry of the AR area during this period is a genuine physical phenomenon. Observations reveal that the dominant hemisphere for the AR area was inconsistent before 2001; however, the southern hemisphere consistently dominates during SC23 (after 2001), except for 2008. In addition, the southern hemisphere dominates during the maximum time of SC24, while the northern hemisphere is dominant before and after this period.
From Table 4, the hemispheric distribution of the AR flux reveals a significant asymmetry in 22 cases (from 1996 to 2023), with only six cases being insignificant. This indicates that more than 78% of the observations exhibit a pronounced N-S asymmetry, confirming that the hemispheric asymmetry for the AR flux during this period is a genuine physical phenomenon. The overall trend in the AR flux closely resembles that of the AR area throughout the entire period, with the exception of certain years.
The magnetic field in the solar polar regions plays a crucial role throughout the solar cycle, gradually accumulating and reconfiguring during the solar polarity reversal. The polarity reversal period acts as a transition phase, leading to differences in the dominant hemisphere before and after the reversal time. Significant differences are observed across the different solar cycles: the southern hemisphere’s magnetic field appears to be stronger during SC23. In contrast, the AR parameters are dominant in the northern hemisphere before and after the maximum time of SC24, while the southern hemisphere leads during the cycle maximum (2013–2014). During SC25, the trend of the AR number likely resembles that of SC23, while the AR area and flux are likely to be the opposite of SC24.
3.5. Dominant Hemispheres for SC23–SC25
To determine the dominant hemisphere for the AR parameters in each solar cycle, we calculated the counts of the AR number, area, and flux in each hemisphere in different solar cycles. Table 5 provides the specific numerical values. Here, the time interval of SC23 is from 1996 May to 2008 November, SC24 is from 2008 December to 2019 November, and SC25 is from 2019 December to 2023 November.
There is a significant difference in the dominant hemisphere among different solar cycles. The three AR parameters dominate in the southern hemisphere during SC23, while the activity levels of the three AR parameters are nearly equal in the two hemispheres during SC25. In SC24, the AR number highlights the dominance of the northern hemisphere, while the AR area and flux exhibit comparable intensities in both hemispheres.
As shown in Table 5, we can easily see that the dominant hemisphere varies among the three AR parameters. The dominant hemispheres for the AR area and flux are consistent across the different solar cycles, whereas they differ from the AR number. Specifically, the northern hemisphere dominates for the AR number during SC24, while the AR area and flux show nearly equal intensities in both hemispheres.
From the above analyses, we can conclude that the hemispheric ARs vary in different ways at different solar cycles and parameters.
3.6. Slope of the Asymmetry in the AR Parameters
Here, we first use the NAI (see Equation (1)) and the AAI (see Equation (2)) to quantify the asymmetry of the three AR parameters in the two hemispheres. Subsequently, we plot the monthly time series of both indices for the AR parameters spanning from 1996 May to 2023 November (see Figures 7–9). Figure 7 shows the time series of the two asymmetry indices of the AR number. We observe that the fitted slopes of both asymmetry indices are negative in SC23. However, the slopes are positive in SC24 and SC25. Figures 8 and 9 display the time series of the two asymmetry indices for the AR area and the flux, respectively. We observe that the slopes of the two asymmetry indices for the AR area and flux in SC24 are exactly opposite: the fitted slope of the AAI is negative, while the fitted slope of the NAI is positive. This could be due to the low values of the AR parameters during the minimum time of SC24. Then we select data where the monthly total AR counts in both hemispheres are greater than or equal to 5 to analyze the NAI of the three AR parameters. We find that for both the AR area and flux, the fitted slope in SC24 changes from positive to negative. This result further verifies and strengthens the research of X. J. Zhang et al. (2022), who found that the fitted slopes of hemispheric sunspot activity during SC20–SC24 are negative and argued that the correct asymmetry index for regression analysis should be based on the absolute difference in solar activity between the two hemispheres. If one wants to use the NAI, only solar activity above a certain threshold should be considered.

Figure 7. Regression fit lines for the monthly values (6 month average) of N-S asymmetry in the AR number across the different cycles. Upper panel: scatter plot of absolute asymmetry values over time; Lower panel: similar to the upper panel but corresponding to normalized asymmetry. Red dots represent actual data points, and the blue line indicates the fitted regression line. The number of data points (n), correlation coefficient (r), and fitted slope (k) are given on the plots.
Download figure:
Standard image High-resolution image
Figure 8. Same as Figure 7, but showing the regression lines of the N-S asymmetry in the AR area across the different cycles.
Download figure:
Standard image High-resolution image
Figure 9. Same as Figures 7 and 8, but showing the regression lines of the N-S asymmetry in the AR flux across the different cycles.
Download figure:
Standard image High-resolution imageDuring the solar cycle minimum, the AR number is very low, and a small denominator can result in large values. Therefore, we primarily use the AAI to analyze the fitting slope of the AR parameters. Based on Figure 7, there is a correlation between asymmetry and time at a confidence level of 99% for the AR number during SC23 (the correlation coefficient is −0.481 and the number of data points is 137). The equation of the regression line is asymmetry = 
 , where the unit of time is in years. However, there may be no correlation between asymmetry and time during SC24 (the correlation coefficient is 0.083 and the number of data points is 120) and the equation of the regression line is asymmetry =
  . During SC25, there is a correlation between asymmetry and time at a 99% confidence level (the correlation coefficient is 0.502 and the number of data points is 42) and the equation of the regression line is asymmetry =
  .
.
Based on Figure 8, there is a correlation between asymmetry and time at a 99% confidence level for the AR area during SC23 (the correlation coefficient is −0.337 and the number of data points is 137). The equation of the regression line is asymmetry = 
 , where the unit of time is in years. However, there may be no correlation between asymmetry and time during SC24 (the correlation coefficient is −0.033 and the number of data points is 120) and the equation of the regression line is asymmetry =
  . During SC25, there is a correlation between asymmetry and time at a 99% confidence level (the correlation coefficient is 0.538 and the number of data points is 42) and the equation of the regression line is asymmetry =
  .
.
Based on Figure 9, there is a correlation between asymmetry and time at the 99% confidence level for the AR flux during SC23 (the correlation coefficient is −0.321 and the number of data points is 137). The equation of the regression line is asymmetry =  , where the unit of time is in years. However, there may be no correlation between asymmetry and time during SC24 (the correlation coefficient is −0.060 and the number of data points is 120) and the equation of the regression line is asymmetry =
  . During SC25, there is a correlation between asymmetry and time at a 99% confidence level (the correlation coefficient is 0.583 and the number of data points is 42) and the equation of the regression line is asymmetry =
  .
.
For SC24, we plot the time variation of the AAI of the three AR parameters before 2013 and after 2014 (see Figure 10), respectively. Before 2013, the asymmetry of the three AR parameters shows a correlation with time at 90% confidence levels, and their asymmetry fitting slopes are all negative. After 2014, the asymmetry of the three AR parameters shows a correlation with time at 99% confidence levels, and their asymmetry fitting slopes are all positive.
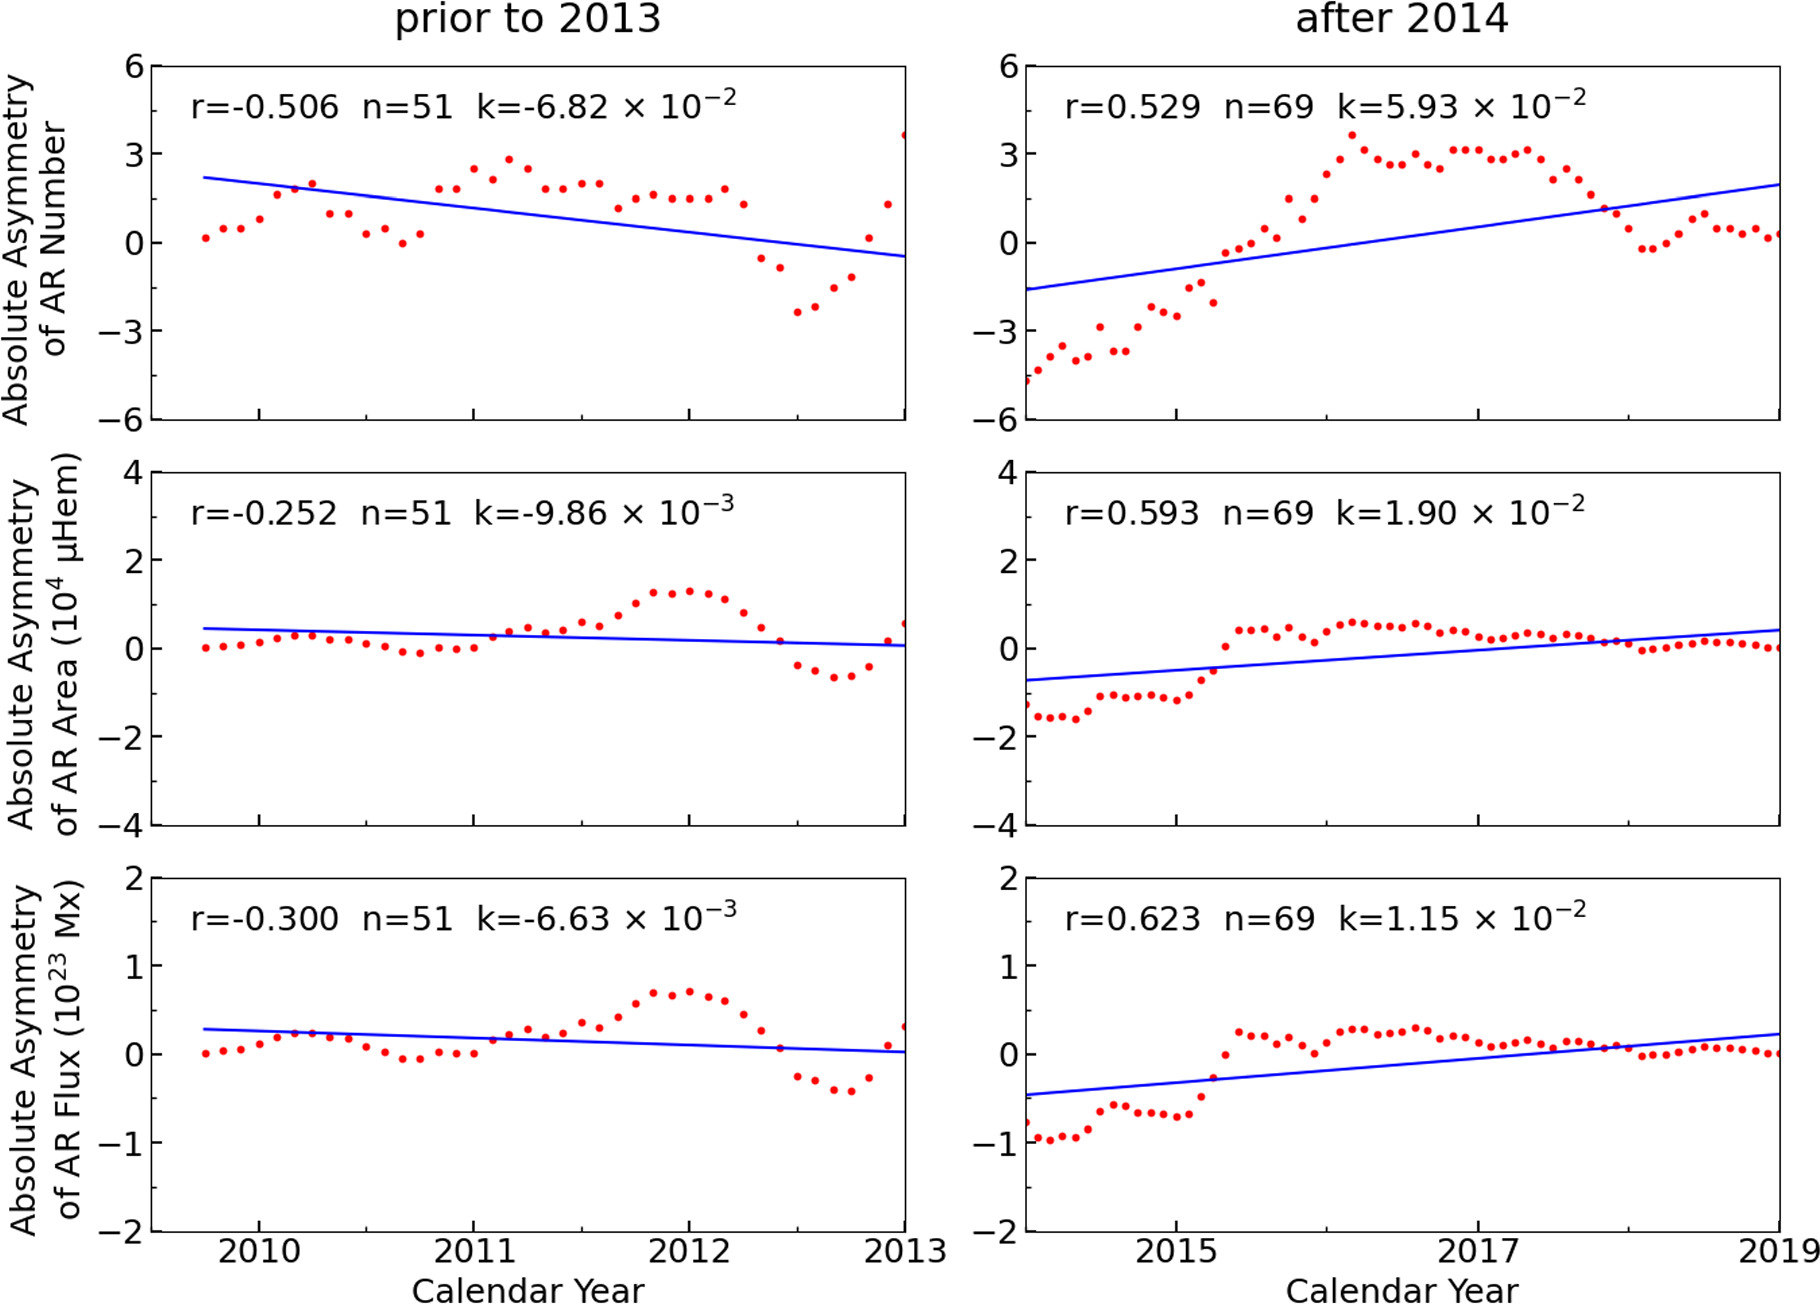
Figure 10. Regression fit lines for the monthly values (6 month average) of N-S asymmetry in the three AR parameters during SC24. Left panel: the relationship between the three AR parameter asymmetries and time prior to 2013. Right panel: similar to the left panel, but corresponding to the period after 2014. Red dots represent actual data points, and the blue line indicates the fitted regression line. The number of data points (n), correlation coefficient (r), and fitted slope (k) are given on the plots.
Download figure:
Standard image High-resolution imageFor the three parameters of the solar ARs, their fitting trends are consistent with sunspot activity (X. J. Zhang et al. 2022). In SC23, the absolute asymmetry fitting slopes for the AR parameters are negative, while the fitting slopes are positive in SC25. For SC24, we observe that the fitting slopes for the three AR parameters are negative before 2013, and the fitting slopes become positive after 2014. F. Y. Li et al. (2019) mentioned that the sign of the slope changes near the maximum of SC24. This behavior is not seen in other cycles, and they consider it a unique property of SC24.
3.7. Cumulative Trend of the Hemispheric AR Parameters
To better understand the systematic change in hemispheric asymmetry during different phases of a solar cycle, we applied the hemispheric cumulative sum to study the intercycle trend of the dominance of the AR parameters between the two hemispheres. Figure 11 presents the cumulative counts of the AR number, area, and flux over time from 1996 May to 2023 November.
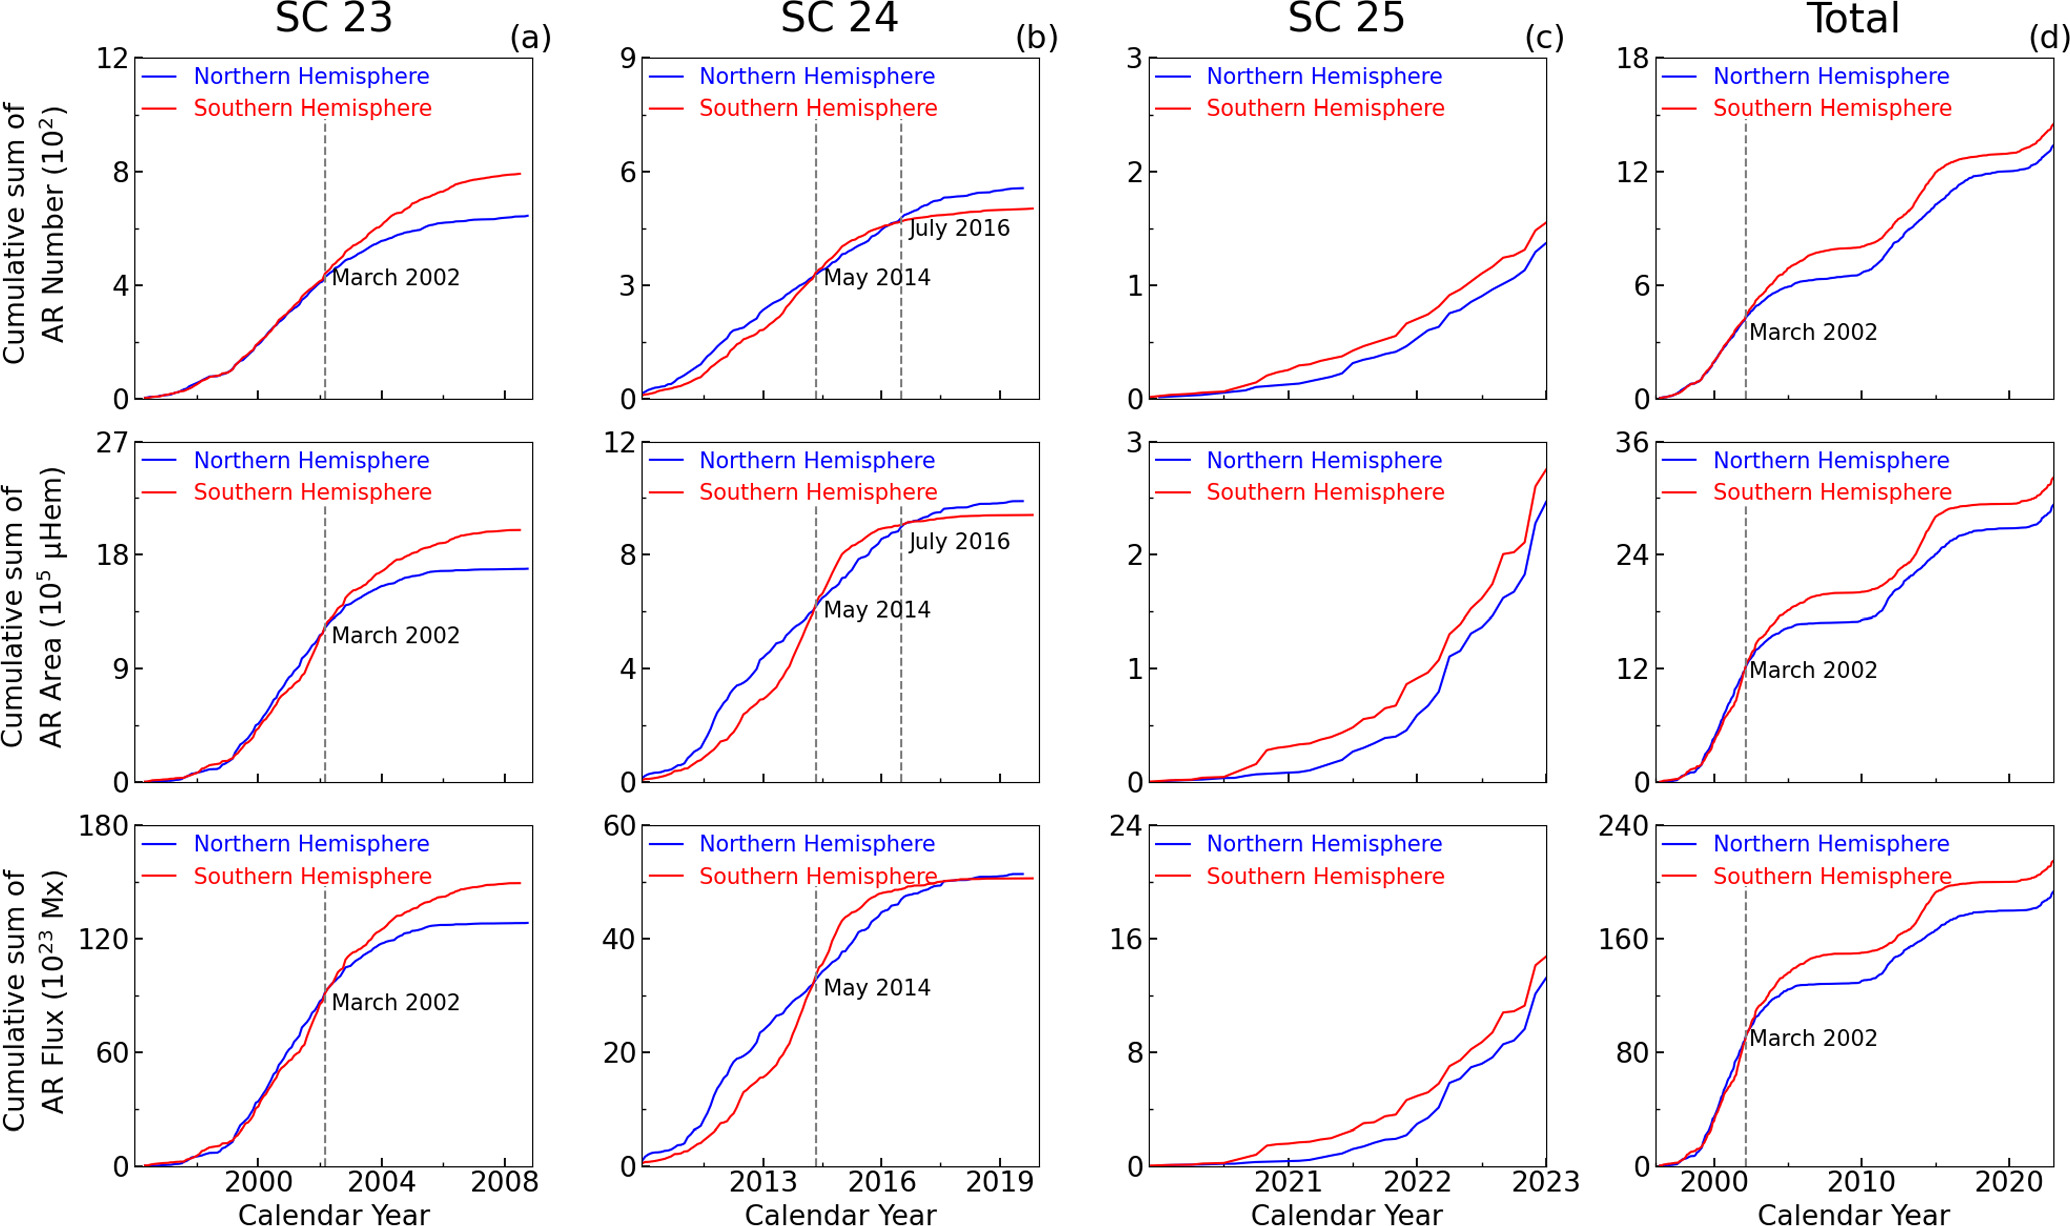
Figure 11. Panel (a): cumulative counts of the AR parameters in the southern (red) and northern (blue) hemispheres during SC23. Panels (b), (c), and (d) are similar to panel (a), but correspond to the cumulative counts for SC24, SC25, and the entire period, respectively.
Download figure:
Standard image High-resolution imageFigure 11(a) illustrates that the cumulative counts of the AR number exhibit distinct temporal behaviors compared to those of the AR area and flux during SC23. The AR number shows roughly equivalent activity levels between the two hemispheres prior to 2002 March. For the AR area and flux, we can observe that the two lines are very close in the two hemispheres, but overall, the cumulative counts in the northern hemisphere are slightly higher than in the southern one. After 2002 March, the cumulative counts of the three AR parameters have become significantly higher in the southern hemisphere, with the divergence becoming larger and larger between the two hemispheres at the end of the cycle. That is, from a global perspective, the southern hemisphere clearly dominates in all AR parameters during this period.
Figure 11(b) shows the hemispheric variations in the cumulative counts of the AR parameters during SC24. The cumulative counts for all AR parameters in the northern hemisphere exceed those in the southern one prior to 2014 May; however, the cumulative counts of the AR number and area in the southern hemisphere are larger than those in the northern one from 2014 May to 2016 July. Following this period, the northern hemisphere once again leads in AR number and area, with the hemispheric difference continuing to grow at the end of the cycle. In terms of the AR flux, the activity in the southern hemisphere is significantly stronger than that in the northern one from 2014 May to 2017 July; the two lines are very close at the end of SC24. Thus, from a global perspective, the cumulative counts of the AR number and area are dominated by the northern hemisphere before and after the maximum time of SC24, while the three parameters are dominated by the southern hemisphere during the cycle maximum.
Figure 11(c) shows the cumulative evolution of the AR parameters across the two hemispheres during SC25. The activity in the southern hemisphere consistently exceeds that in the northern hemisphere at the beginning of the cycle. As the cycle progresses, the divergence between the two hemispheres becomes increasingly pronounced.
Figure 11(d) presents the hemispheric evolution of the AR parameters from 1996 May to 2023 November. It can be seen that the trends before 2002 March resemble those observed in the early phase of SC23 (before 2002 March). However, the cumulative counts of the AR parameters in the southern hemisphere are consistently larger than those in the northern one after 2002 March, and the divergence between the two hemispheres becomes increasingly pronounced over time. These findings suggest that the southern hemisphere exhibits a clear dominance during this period.
To better show the trend difference of the hemispheric cumulative counts, Figure 12 shows the variation in the cumulative absolute asymmetry (see Equation (3)) of the AR parameters in different solar cycles. The red and blue lines indicate an excess in the cumulative sum between the southern and northern hemispheres.
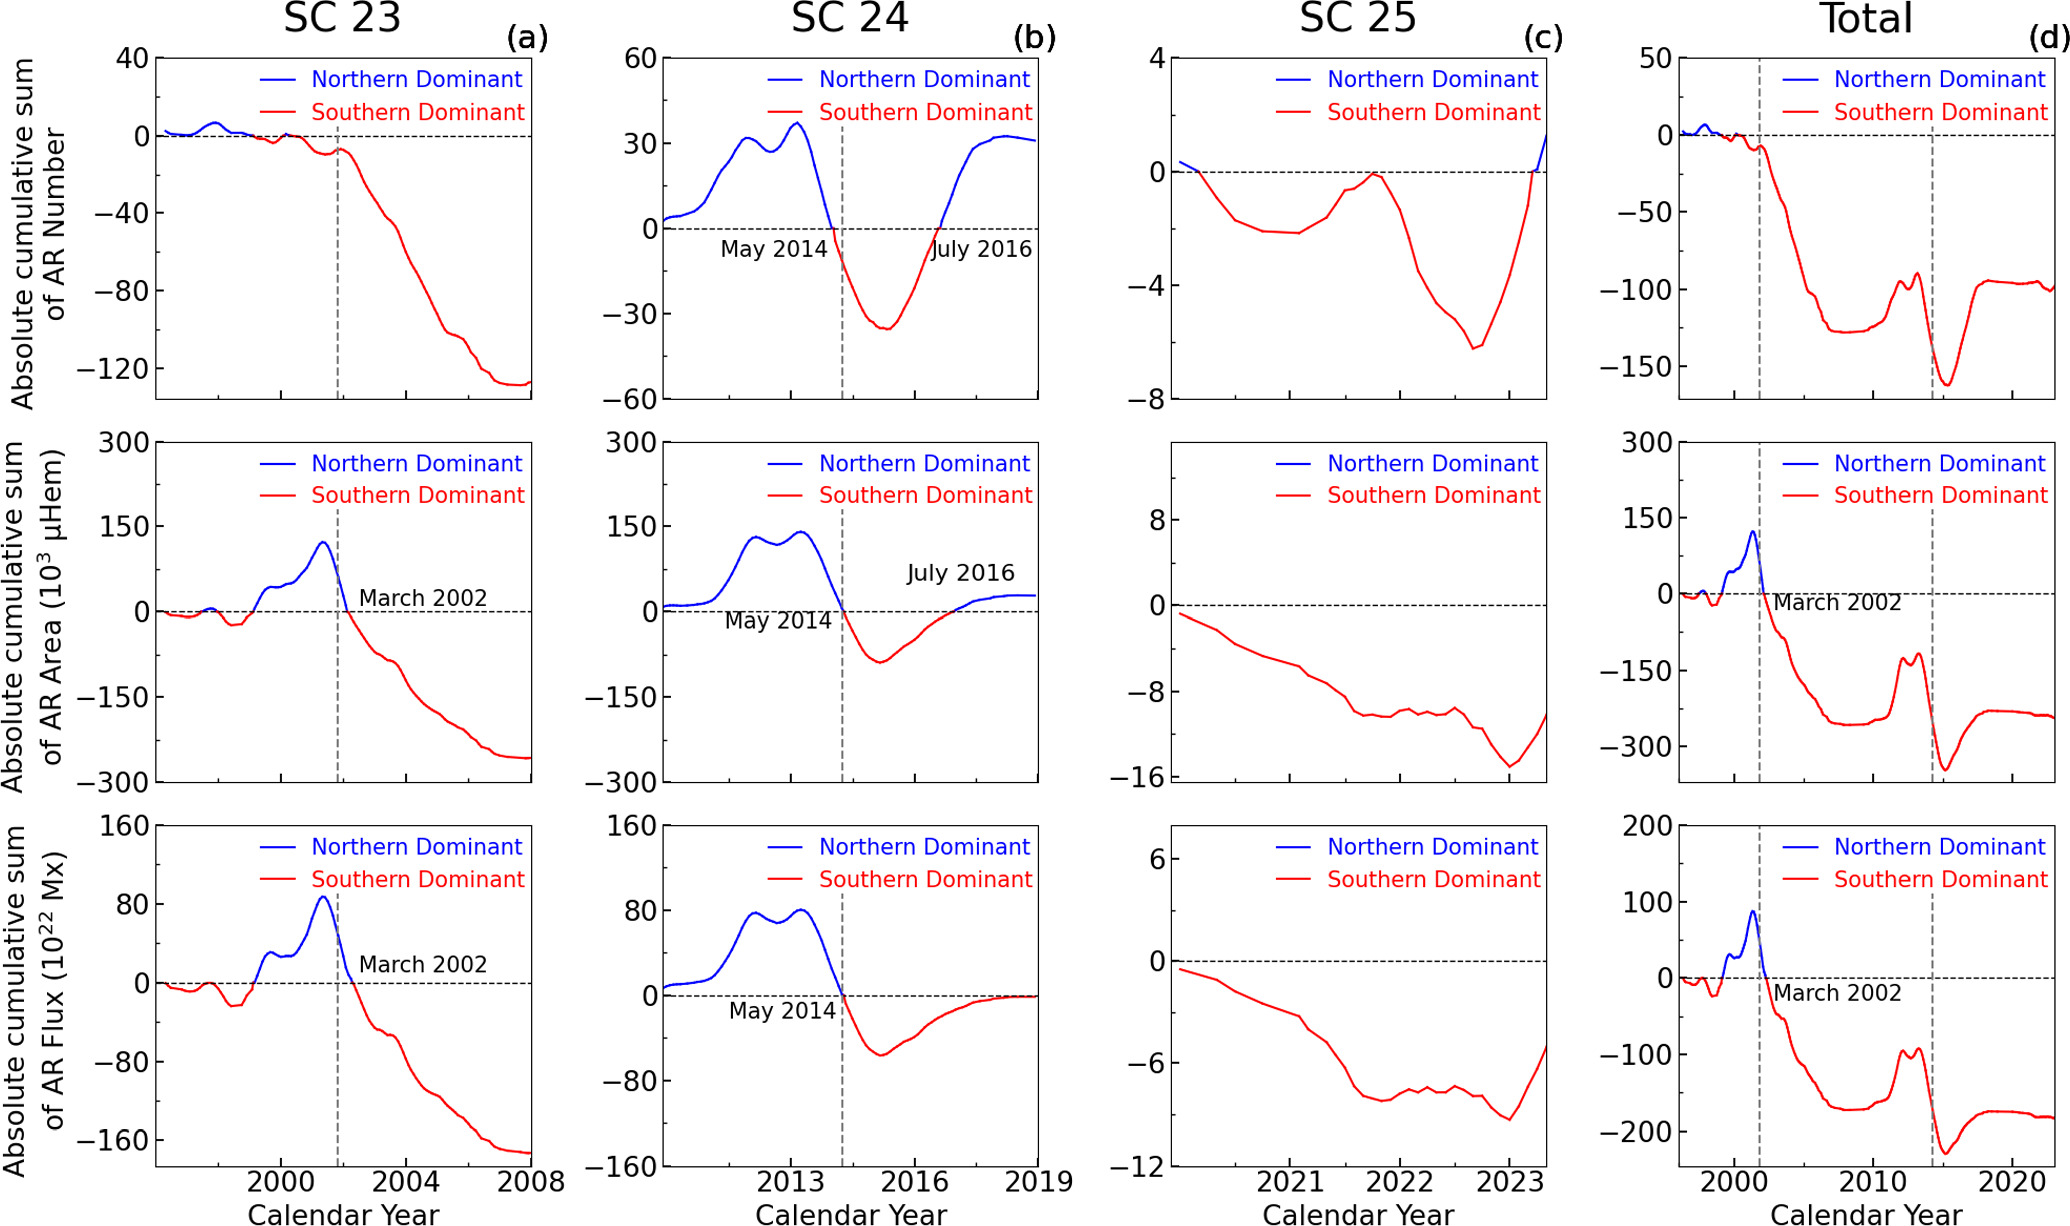
Figure 12. Panel (a): cumulative asymmetry in the AR parameters across different hemispheres during SC23. The red and blue lines indicate an excess in the cumulative sum between the southern and northern hemispheres. Panels (b), (c), and (d) are similar to panel (a), corresponding to SC24, SC25, and the entire time period, respectively.
Download figure:
Standard image High-resolution imageOur findings show that the patterns for each solar cycle remain consistent with those presented in Figure 11, indicating that the trends of the AR area and flux are similar. The temporal behavior of the AR area and flux differs from that of the AR number during SC23; however, from a global perspective, the southern hemisphere demonstrates clear dominance across all parameters, with hemispheric asymmetry steadily increasing over time. The northern hemisphere dominates in terms of the AR number during SC24. In addition, the three AR parameters are dominated by the southern hemisphere during the ascending phase of SC25 and throughout the period.
4. Conclusions and Discussions
For a single synoptic magnetogram, the magnetic field distribution of the ARs is primarily described by three parameters: number, area, and flux, which are not considered to be symmetrically distributed in the two hemispheres. This study systematically analyzes the hemispheric distribution of the AR parameters based on a homogeneous AR database, covering SC23 to part of SC25.
The distribution of the AR parameters shows significant asymmetry between the two hemispheres, showing the cycle-dependent properties (see Figure 2). Our results align with the sunspot velocity trends derived by K. J. Li (2010) in SC24. They observed that the drift velocity in the northern hemisphere was higher than in the southern one during the rising phase (2010–2014). After 2015, the velocity increased in both hemispheres, but migration in the southern hemisphere was faster than that in the northern hemisphere. T. Zhang et al. (2024a) suggested that the asymmetry of the drift velocity in the two hemispheres for the ARs may be related to the unusual migration of the magnetic field in SC24. The latitude distribution of the AR parameters follows Spörer’s law of zones. Additionally, compared to SC23, both the AR area and flux in SC24 have significantly decreased, which is consistent with sunspot activity. G. M. Brown & D. R. Evans (1980a) found that the activity regions of solar faculae exhibit distinct latitude distribution differences at different stages of the cycle, a phenomenon that is also similar to the latitude distribution of sunspots. We also observe differences in activity intensity and peak timing in both hemispheres, with the northern hemisphere reaching its peak earlier than the southern one. This may originate from the uneven distribution and evolution of the magnetic field (D. B. Swinson et al. 1986; J. Javaraiah 2022). The observed hemispheric asymmetries may result from complex interactions between dipolar and quadrupolar magnetic field modes during their evolution in different hemispheres (L. Kitchatinov & A. Khlystova 2021; A. Zhukova et al. 2023). In addition, L. H. Deng et al. (2019, 2020) found that the solar quasi-biennial oscillations (QBOs) exhibit hemispheric asymmetry. On the one hand, the QBOs of solar Hα flare activity show phase and amplitude asymmetry in the two hemispheres, reflecting the complex dynamics of solar activity in each hemisphere. Furthermore, although the QBOs of polar faculae exhibit global coherence, their manifestation differs between the hemispheres, revealing the intrinsic complexity of the N-S asymmetry in solar activity.
The area and flux of the AR exhibit a strong positive correlation between different solar cycles (see Figure 4), confirming and reinforcing the linear relationship between the AR area and flux (N. R. Sheeley 1966). The correlation between the AR area and flux varies across the different cycles (with SC24 being smaller than SC23), and their trends differ from the AR number. The complex magnetic fields of the ARs serve as an energy source for intense solar activities such as flares, jets, and CMEs (J. Jing et al. 2006; S. Toriumi et al. 2017; S. Toriumi 2022). Although the AR number is a representative indicator of solar activity, it is insufficient to fully reflect the actual intensity of the ARs. T. Li et al. (2020) found a strong negative correlation between the proportion of eruptive flares to the total number of flares and the flux of the AR. This implies that even if the number of ARs is high, the total magnetic flux may not increase significantly if most of the regions are small, thereby influencing the eruptive characteristics of flares. The results in Section 3.1 align with the previous findings by T. Li et al. (2020), where the variation in the AR number differs from that of the AR area and flux during SC23. Therefore, in future studies of solar activity monitoring and periodic variations, parameters such as area and flux may become more critical and better reflect the essence of ARs.
Compared to sunspot numbers or sunspot group numbers, sunspot areas are considered to have greater physical significance (P. Charbonneau 2014; L. H. Deng et al. 2016), and are an important indicator of the scale and intensity of ARs. There is a linear relationship between the AR parameters and sunspot parameters, which varies across the different cycles and hemispheres. In previous studies, G. M. Brown & D. R. Evans (1980b) indicated that the evolution of sunspots and the variation of faculae exhibited high regularity within a given cycle, and this relationship appeared similar in both hemispheres. However, significant differences were observed across different cycles. This contrasted with the differences in the correlation between the two hemispheres found in this study. P. Foukal (1998) showed a clear nonlinear relationship between white-light faculae and sunspot areas, with the variation in their ratio possibly linked to the solar magnetic field generation mechanism. A. Hempelmann & W. Weber (2012) indicated that there is a significant nonlinear relationship between sunspot number and total solar irradiance (TSI), while its linear relationship with Terrestrial Insolation is stronger than with TSI. Furthermore, S. Criscuoli (2016a, 2016b) investigated the relation between the filling factor of magnetic elements, the magnetic element coverage area, and sunspot numbers, respectively. They found that daily data fit a quadratic function best, while 6 month averages are better described by a linear function. Sunspot activity is closely related to the magnetic field distribution. The AR parameters offer additional insights into changes in sunspot activity, contributing to more accurate predictions of the intensity and cyclical fluctuations of solar activity (G. M. Brown & D. R. Evans 1980b). They also reflect deeper complexities and variations in the magnetic field strength (J. H. Thomas & N. O. Weiss 1992; S. K. Solanki 2003). Sunspots are not merely accompanying phenomena of ARs, they share underlying physical connection and may be jointly governed by MHD processes inside the Sun. Studying the relationship between AR parameters and sunspot parameters provides valuable insights for understanding the solar internal magnetic activity and dynamic processes.
The three parameters of the AR exhibit hemispheric dominance differences before and after the maximum time of solar cycles, which may be influenced by the reversal of magnetic field polarity. We observe a distinct double-peak structure during SC24 (see Figure 2), which is formed by ARs from different hemispheres at different times. L. Svalgaard & Y. Kamide (2013) suggested that the occurrence of two or more solar activity peaks in different hemispheres associated with the corresponding differences in polar field reversal times is a common characteristic of solar cycles. The asymmetric polar field reversal is merely a result of the asymmetry in solar activity, indicating that the overall magnetic field evolution of ARs is governed by the differing activity levels in the two hemispheres. We find that the hemispheric ARs exhibit distinct variation patterns across the different solar cycles and parameters (see Table 5). The similarity between the AR area and flux in the dominant hemisphere during different solar cycles further demonstrates the strong correlation between them. Statistical tests indicate that the N-S asymmetry of the AR parameters is a real observational phenomenon. The current SC25 is underway and existing data show that the southern hemisphere has a slight dominance. The activity trend resembles that of SC23, showing slightly higher intensity than SC24. This is consistent with the predictions of (A. Prasad et al. 2022; X. Liu et al. 2023; X. Su et al. 2024). As the cycle progresses, this trend of asymmetry is expected to develop further.
The NAI is a useful parameter, provided that the monthly number of ARs is sufficiently large (X. J. Zhang et al. 2022). Research on the asymmetry index shows that the occurrence of ARs is uneven in both hemispheres, reflecting the intrinsic complexity of the solar magnetic field (see Figures 7–9). Moreover, the change in the fitting slope sign before 2013 and after 2014 may be related to the magnetic field polarity reversal near the maximum of SC24 (H. D. Babcock 1959; X. Sun et al. 2015; M. I. Pishkalo 2019). This indicates that the generation and reversal mechanisms of the solar magnetic field are not completely symmetric, influenced by the enhancement of local magnetic fields in each hemisphere, which may stem from the nonuniformity of the solar dynamo mechanism. J. Jiang et al. (2007b) and A. Goel & A. R. Choudhuri (2009) noted that hemispheric asymmetry in the next cycle could be caused by random effects on the dynamo process at the end of the previous cycle. The hemispheric asymmetry of solar ARs is also closely related to different phases of the solar cycle (B. Joshi et al. 2006; A. A. Norton & J. C. Gallagher 2010). Furthermore, A. R. Choudhuri (2017) discussed the extrapolation of the solar dynamo to solar-like stars and the connection between solar cycles and stellar activity cycles. Therefore, the hemispheric asymmetry of solar ARs discussed in this study can also be used to understand the activity behaviors of other stars.
Analysis of cumulative effects reveals that the long-term cumulative trends of the three parameters of the AR in different hemispheres exhibit significant differences across the different solar cycles (see Figures 11 and 12). X. J. Zhang et al. (2023) found that the cumulative trends of different types of CMEs exhibited different patterns during SC23 and SC24. The hemispheric asymmetry of solar activity is not merely a localized phenomenon but exhibits significant long-term and periodic characteristics (J. Javaraiah 2019, 2021).
This study provides a preliminary insight into the patterns of N-S asymmetry in AR parameters. Future observational data will offer more empirical evidence for analyzing hemispheric differences in solar activity and uncover additional evolutionary trends of ARs. These findings will not only provide a new theoretical framework for solar physics research but also establish a robust scientific foundation for predicting future solar activity and its impact on space weather.
Acknowledgments
We thank the reviewers for the valuable comments and suggestions that improved the paper. We also thank Ruihui Wang, Jie Jiang, and YuKun Luo for creating the live homogeneous database of solar ARs. This work is supported by the National Nature Science Foundation of China (12463009), the Yunnan Fundamental Research Projects (grant Nos. 202301AV070007, 202401AU070026, 202501AU070154, 202501AT070366), the “Yunnan Revitalization Talent Support Program” Innovation Team Project (grant No. 202405AS350012), the Scientific Research Foundation Project of Yunnan Education Department (2025Y0720, 2025Y0721, 2025J0502), and the GHfund A (202407016295).
Footnotes
- 7
- 8
- 9