Abstract
A solar energetic particle event was detected by the Integrated Science Investigation of the Sun (IS⊙IS) instrument suite on Parker Solar Probe (PSP) on 2019 April 4 when the spacecraft was inside of 0.17 au and less than 1 day before its second perihelion, providing an opportunity to study solar particle acceleration and transport unprecedentedly close to the source. The event was very small, with peak 1 MeV proton intensities of ∼0.3 particles (cm2 sr s MeV)−1, and was undetectable above background levels at energies above 10 MeV or in particle detectors at 1 au. It was strongly anisotropic, with intensities flowing outward from the Sun up to 30 times greater than those flowing inward persisting throughout the event. Temporal association between particle increases and small brightness surges in the extreme-ultraviolet observed by the Solar TErrestrial RElations Observatory, which were also accompanied by type III radio emission seen by the Electromagnetic Fields Investigation on PSP, indicates that the source of this event was an active region nearly 80° east of the nominal PSP magnetic footpoint. This suggests that the field lines expanded over a wide longitudinal range between the active region in the photosphere and the corona.
1. Introduction
NASA’s Parker Solar Probe (PSP) mission is designed to explore dynamic, energetic processes in the solar corona and near-Sun interplanetary space (Fox et al. 2016). Launched in 2018 August into a highly elliptical solar orbit, it will utilize seven Venus gravitational assists over the course of 7 yr to successively lower its perihelion, ultimately to under 10 R☉ (0.046 au). Already by 2019 September it had made three perihelion passes at 0.166 au, closer than achieved by any previous mission, and has observed several small solar energetic particle (SEP) events (McComas et al. 2019). From its vantage point so much closer to the Sun, in addition to uncovering the origin of the solar wind, it is expected that its observations will help elucidate the mechanisms that accelerate SEPs and govern their transport throughout the inner heliosphere, helping to disentangle the roles of shocks, reconnection, waves, turbulence, and drifts in these processes.
During the solar encounter portion of PSP’s second orbit, a pair of small SEP events occurred 2 days apart (Figure 1), originating from an active region (AR) nearly 80° east of PSP’s nominal coronal magnetic footpoint. The first, on April 2 (day of 2019 = 92 in the figure), was clearly detected by PSP instrumentation at energies below several hundred keV but showed almost no increase in protons at 1 MeV and above. The second event, on April 4 (day 94), was observed when PSP was less than 0.17 au from the Sun and less than a day before perihelion. In contrast to the April 2 event, the increase in MeV protons was obvious, but it was much smaller in <100 keV particles and near background levels. As is evident by the relative spacing of the traces in Figure 1 and the relative heights of the two events at a given energy, the April 4 event had a significantly harder proton energy spectrum than the April 2 event. It is the April 4 event that is the focus of this paper; for more information on observations during the April 2 event and comparisons between the two, see E. C. Roelof et al. (2019, in preparation).
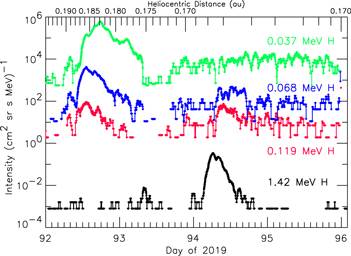
Figure 1. Time profiles of proton intensities at the indicated energies for the period 2019 April 2 00:00–2019 April 6 02:00. The top three traces are from IS⊙IS/EPI-Lo time-of-flight measurements, while the bottom trace is from IS⊙IS/EPI-Hi/LET1. In all cases, 60-point moving averages of minute-cadence data are shown. The distance of PSP from the Sun during this period is displayed on the top axis.
Download figure:
Standard image High-resolution image2. Instrumentation
The PSP Integrated Science Investigation of the Sun (IS⊙IS) consists of a suite of two energetic particle instruments, together with their associated science operations, data processing, analysis tools, and personnel (McComas et al. 2016). One of the instruments, EPI-Lo, measures particles using the time-of-flight versus energy technique and determines composition, spectra, and anisotropies of particles with energies from ∼20 keV nucleon−1 to several MeV nucleon−1 (McComas et al. 2016; Hill et al. 2017). The other, EPI-Hi, is made up of three silicon solid-state detector telescopes, two low-energy telescopes (LET1 and LET2), and one high-energy telescope (HET), which use the dE/dx versus residual energy technique to measure particles over the combined energy range of ∼1–200 MeV nucleon−1 (McComas et al. 2016; Wiedenbeck et al. 2017). Each LET and HET telescope is cylindrical, with LET1 and HET being double-ended and LET2 single-ended. Each of the five EPI-Hi apertures views a cone lying in the PSP orbital plane with a half-angle width of ∼45°, and each measures a subset of rates in up to 25 smaller directional sectors within its full field of view to provide anisotropy information (McComas et al. 2016). When the spacecraft is oriented with its long axis pointing at the Sun and turned so that EPI-Hi is on the leading side of the spacecraft (the orbital ram direction), as during solar encounters, one LET1 aperture (LET-A) is pointed 45° west of the Sun–spacecraft line (i.e., along the nominal Parker spiral direction at 1 au), while the opposite end (LET-B) is pointed 135° east of the Sun. LET2 is oriented orthogonal to LET1, that is, its single aperture normally points 135° west of the Sun. One HET aperture points 20° west of the Sun, with the opposite end 160° east of the Sun. These fields of view for each EPI-Hi aperture are illustrated in Figure 18 of McComas et al. (2016).
Most of the particle data used in this study come from PSP/IS⊙IS/EPI-Hi. Although the April 4 event was observed by EPI-Lo, it was near the instrument’s sensitivity limit (see Figure 1). Detection efficiencies and backgrounds in EPI-Lo are currently being assessed (Hill et al. 2020), and intercalibration with EPI-Hi is underway (Joyce et al. 2020); preliminary EPI-Lo observations during this event are presented elsewhere (McComas et al. 2019; Joyce et al. 2020; E. C. Roelof et al. 2019, in preparation). As we show in Section 3.1, the 2019 April 4 event studied here was very small, anisotropic, and spectrally soft. With a proton energy threshold of ∼8 MeV, EPI-Hi/HET did not detect the event at all. As mentioned above, the LET2 telescope points away from the Sun (in a direction where particle intensities were lower), and it also has a thicker entrance window (and hence a higher energy threshold) than LET1; as a result, the measured count rates in LET2 were more than an order of magnitude lower than in LET1 during this event. Therefore, all of the EPI-Hi data shown here come exclusively from LET1, both A and B apertures.
3. Observations
3.1. In Situ Observations
The hydrogen and helium elemental energy spectra from EPI-Hi, averaged over the 2019 April 4 SEP event from 02:00 to 18:00, are compared in Figure 2 for LET-A and LET-B. To estimate the quiet-time background levels, a loose selection of quiet periods was made by requiring that the daily averaged proton intensity near 3 MeV (specifically, in the 2.83–3.36 MeV energy bin) be <8.9 × 10⁻⁵ particles (cm2 sr s MeV)−1. This cut excludes SEP events (such as those discussed in McComas et al. 2019; Giacalone et al. 2020; Schwadron et al. 2020; Wiedenbeck et al. 2020), as well as intensity enhancements due to particles associated with stream interaction regions (SIRs) and corotating interaction regions (CIRs; Cohen et al. 2020). The resulting “quiet” intervals total ∼34 days, and the H and He spectra averaged over this period are shown in black in the left pair of panels in Figure 2 (LET-A and LET-B quiet spectra were examined separately and found to be consistent, and so they have been averaged together). Above ∼5 MeV, the quiet-time proton spectrum has both the intensity and spectral shape expected for galactic cosmic rays (GCRs). The turn-up at lower energies is not completely understood, but it may contain contributions from misidentified, out-of-geometry high-energy GCRs or smaller SIR or CIR events that were missed by the loose quiet cut; in any case this unidentified background is only ∼1% of the LET-A and ∼10%–20% of the LET-B proton intensity during the April 4 event. Similarly, the intensity of the quiet-time He spectrum above 5 MeV nucleon−1 is about as expected from the combination of anomalous cosmic-ray (ACR) He and GCR He, but the peculiar wiggle in the shape of the spectrum indicates some sort of instrumental effect, which is under investigation but of no concern for this study since the SEP spectrum in this event does not extend to these energies. The low-energy He quiet-time spectrum suggests the presence of unidentified backgrounds or instrumental effects, but it is at <10% of the LET-A He SEP spectrum and thus relatively unimportant.
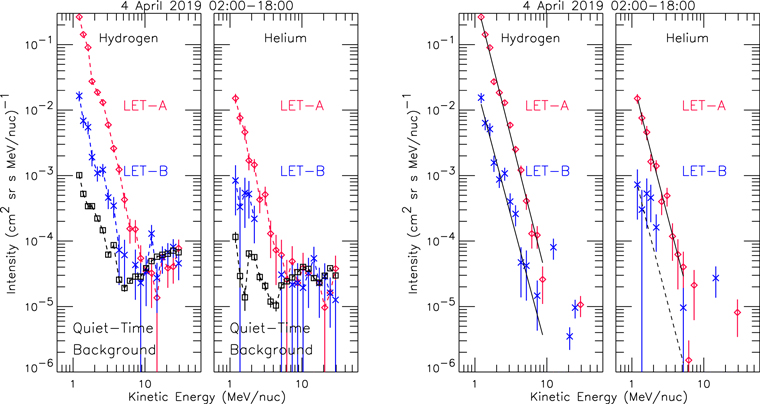
Figure 2. Hydrogen and helium differential energy spectra averaged over the duration of the 2019 April 4 SEP event (02:00–18:00) from IS⊙IS/EPI-Hi/LET1. Spectra measured in the aperture facing generally toward the Sun (LET-A) are in red, while those in the opposite aperture (LET-B) are in blue; a large antisunward anisotropy results in much higher intensities in LET-A than in LET-B. Backgrounds due to quiet-time particles unrelated to the SEP event (see text) are shown in black in the left pair of panels and are subtracted from the SEP data in the right pair of panels. Power-law fits are shown in the right panels as solid black lines over the energy interval used in the fit; the dashed line for LET-B helium is simply the LET-A helium fit scaled downward by the fit hydrogen LET-A/LET-B ratio, a factor of 21.
Download figure:
Standard image High-resolution imageIn the pair of panels on the right side of Figure 2, the background-corrected spectra are shown. At this early stage of the mission during this quiet solar minimum, with very limited high-energy particle data with which to evaluate instrument performance, instrumental effects are still present in these spectra (most notably the dip around 2 MeV nucleon−1). Nevertheless, the spectra seem consistent with a single power law over the energy range of ∼1–8 MeV nucleon−1. Within formal statistical uncertainties, the spectral indices for the power-laws fits for LET-A H, LET-B H, and LET-A He are the same, at −4.36 ± 0.06, −4.12 ± 0.26, and −4.21 ± 0.26, respectively. Statistics for LET-B He are too meager to permit a sensible fit. For illustration purposes, the LET-A He fit has been scaled by the 1 MeV H LET-B-to-LET-A ratio. The result suggests that the spectral shape of LET-B He may be similar to that of LET-A He and that the B-to-A He ratio is similar to that for H.
Preliminary intercalibration of EPI-Hi and EPI-Lo (Joyce et al. 2020) indicates that the proton power-law spectra shown here do not continue down to 100 keV with the same index. Instead, there seems to be a spectral break or rollover somewhere between ∼300 keV and 1 MeV, with a harder spectral index below. At present, the EPI-Lo proton efficiency and background are too uncertain to justify attempting to fit a single functional form to the combined spectra from EPI-Lo and EPI-Hi in this very small event. Furthermore, the extreme anisotropy, along with the fact that the fields of view of the two instruments are different (McComas et al. 2016), would make such a fit problematic.
After the background subtraction in Figure 2, the He/H ratio is found to be 0.052 ± 0.002, as shown in Figure 3. This value is well determined at 1–2 MeV nucleon−1 and consistent with being independent of energy, but the low statistics and resulting large uncertainties mean that a sizable increase or decrease in this ratio at energies from 2 to 8 MeV nucleon−1 cannot be ruled out.
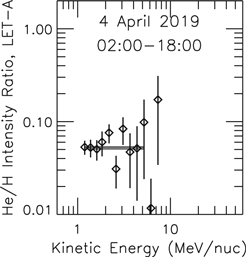
Figure 3. He/H ratio measured in IS⊙IS/EPI-Hi/LET-A as a function of energy, after quiet-time background subtraction, averaged over the duration of the 2019 April 4 SEP event. The average value of 0.052 ± 0.002 is marked by the horizontal lines.
Download figure:
Standard image High-resolution imageAlthough EPI-Hi is capable of measuring electrons, protons, and heavier elements up through nickel, as well as He isotopes (McComas et al. 2016), no electrons above 0.5 MeV or ions heavier than 4He were detected above quiet-time background levels, and no 3He was observed in this very small SEP event. Using the same analysis employed by Wiedenbeck et al. (2020) for their study that made a definitive 3He detection in the much larger 2019 April 21 SEP event, we find 0 3He nuclei and 19 4He nuclei in the narrow energy range of 1.35–1.75 MeV nucleon−1 at near-normal incidence angles. Although this results in a formal 1σ upper limit (using Poisson statistics) of 0.097 for the 3He/4He ratio, we find no strong evidence of additional 3He at higher energies, suggesting that with further analysis a lower limit could be obtained.
The absence of ions heavier than He in this event is interesting, since the He intensity reached two orders of magnitude above background (and background levels appear to be lower for the heavier ions), which would have been large enough to detect some heavies if their abundances relative to He were typical of those seen in SEPs (Reames 2014). As shown in Figure 4, during the entire period of 2019 April 4 02:00–18:00, there were no LET-A heavy ions detected below 5 MeV nucleon−1, one oxygen nucleus in LET-B (consistent with the expected quiet-time ACR oxygen background), and two LET-B particles with an apparent atomic number between 2 and 5, probably due to instrumental background of the sort suggested to explain the quiet-time low-energy proton increase discussed above. Based on the 0 detected counts, the 1σ Poisson upper limit for the LET-A 1–5 MeV nucleon−1 oxygen intensity during this period is 3.2 × 10⁻⁵ particles (cm2 sr s MeV nucleon−1)−1. Since the He intensity at the mean energy in this interval is ∼5 × 10⁻³ particles (cm2 sr s MeV nucleon−1)−1 (Figure 2), the O/He ratio must be <0.006 (and after accounting for expected ACR oxygen background, this would drop to ∼0.004). This value is significantly lower than the average value reported in SEPs of ∼0.02 (Reames 2014) and closer to spectroscopically measured coronal and photospheric values of 8 × 10⁻³ (Feldman & Widing 2003) and 6 × 10⁻³ (Lodders 2010; Caffau et al. 2011), respectively. In contrast, during the April 2 event, when EPI-Hi saw almost no increase in protons (Figure 1) and the 1 MeV nucleon−1 He intensity was ∼30 times lower, LET-A detected 12 heavy nuclei up to Fe below 5 MeV nucleon−1, with another two nuclei heavier than oxygen in LET-B (Figure 4). Thus, not only was the O/He ratio at MeV energies in the April 4 event somewhat lower than typical SEP values, but the heavy-ion-to-He ratio was also at least ∼300 times lower than in the event only 2 days earlier from the same AR. See E. C. Roelof et al. (2019, in preparation) for further discussion of the characteristics of the composition in the April 2 event and comparison with the April 4 event, particularly at lower (EPI-Lo) energies.
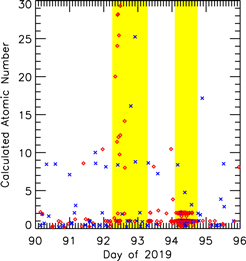
Figure 4. Calculated atomic number vs. arrival time for particles entering LET-A (red diamonds) and LET-B (blue crosses) with energies of ∼1–5 MeV nucleon−1, using pulse-height data. Yellow bands indicate the time periods of the April 2 (left) and April 4 (right) SEP events. The calibration is preliminary, so the calculated atomic number is only approximate, particularly for the heavier ions.
Download figure:
Standard image High-resolution imageThe SEP event is highly anisotropic, with event-averaged intensities in Figure 2 coming from the Sun in LET-A ∼21 times higher than those heading toward the Sun in LET-B (early in the event the anisotropy was even greater, as presented later in Figure 6). Furthermore, the intensities are not uniform throughout the LET-A aperture, as shown in Figure 5, but instead vary relatively smoothly by more than an order of magnitude across its field of view. We have not yet determined pitch-angle distributions; at this early stage of the analysis the sectored geometry factors used were calculated with a preliminary map of field-of-view obstructions for an isotropic distribution and not yet iterated based on the measured anisotropy, deconvolved to disentangle the overlapping fields of view, or had Compton–Getting corrections applied to convert to the solar wind rest frame (as discussed in E. C. Roelof et al. 2019, in preparation), so the intensity distribution in Figure 5 is not exact. Nevertheless, the intensities do seem to peak somewhere near the magnetic field directions measured by the Electromagnetic Fields Investigation (FIELDS; Bale et al. 2016) magnetometer on PSP, as would be expected for a field-aligned beam of particles.
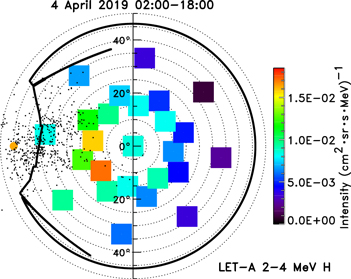
Figure 5. Directional intensities of 2–4 MeV protons averaged over the 2019 April 4 SEP event in the 25 LET-A sectored viewing directions shown using the color scale on the right. On this polar plot, values of the radial coordinates indicate the angle (marked on the axis) from the telescope boresight, while angular coordinates correspond to the azimuthal angle about the telescope axis, with the vertical direction normal to the spacecraft orbit. The colored squares are shown centered on the nominal sector viewing directions, but their shapes and sizes are not representative of those of the sectors themselves, which overlap considerably (McComas et al. 2016) and together fill the region outlined by the thick black curve, which marks the boundary of the full LET-A field of view. (Along the left-hand side, the spacecraft thermal protection system and FIELDS antennas obstruct part of the field of view). Black dots mark the direction of the magnetic field as measured by FIELDS, using 1-minute data over the period 04:00–12:00, when most of the particles appear (see Figure 6). The filled orange circle at the left indicates the position of the Sun on the same angular scale.
Download figure:
Standard image High-resolution imageTime profiles of 1.12–5.66 MeV protons on both LET-A and LET-B are shown in Figure 6. The entire event is very brief, lasting only ∼15 hr, and takes ∼4 hr from onset to reach peak intensities. The most notable structure in the event is a pronounced dip in LET-A intensities by a factor of ∼5 around 07:00. Near the peak of the event, the LET-A intensities are a factor of ∼30 times greater than those in LET-B. Although particles are not detected in LET-B until ∼1.5 hr after they first arrive in LET-A, the very limited statistics in LET-B make it difficult to determine whether this is a genuine onset delay; scaling from the LET-A intensities suggests that only ∼2 additional particles in LET-B between ∼3:45 and 4:30 would give the same onset in both apertures. Similarly, it is unclear whether or not the dip at 07:00 in LET-A is completely absent from LET-B.
The SEP time profile from Figure 6 is compared with variations in solar wind parameters in Figure 7, using data from the FIELDS magnetometer (Bale et al. 2016) and from the Solar Proton Cup (SPC) of the Solar Wind Electrons Alphas and Protons suite (SWEAP; Kasper et al. 2016) on PSP. As shown in panel (c), roughly half the time during this event the magnetic field longitude is outside the LET-A field of view, by up to ∼30° (this is also seen in Figure 5). If the proton pitch-angle distribution were aligned with the field and narrow compared to the 45° half-angle LET-A aperture, movement of the beam out of the LET-A field of view would result in a decrease in the measured particle intensity, but the observed dip in protons near 07:00 does not seem to be associated with any obvious change in the average field longitude. (In contrast, the large change in field longitude at ∼16:30 essentially marks the end of the particle event in EPI-Hi). The dip is, however, temporally correlated with small changes in the solar wind: a 15% decrease in magnetic field magnitude, 40% decrease in solar wind density, and 15% (50 km s−1) increase in solar wind speed as the spacecraft apparently entered a very small, weak rarefaction region20 or encountered a small transient.
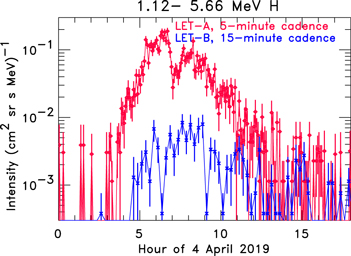
Figure 6. Time profiles of 1.12–5.66 MeV hydrogen from IS⊙IS/EPI-Hi/LET1 at a 5-minute cadence for LET-A (red) and 15-minute cadence for LET-B (blue) during the 2019 April 4 SEP event. Statistical uncertainties are shown on each point.
Download figure:
Standard image High-resolution image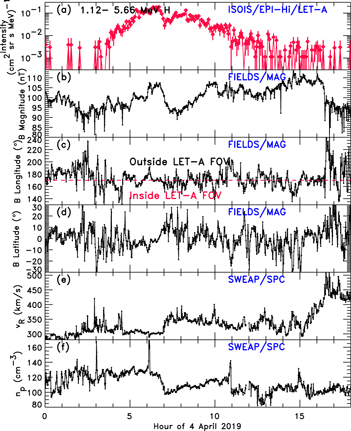
Figure 7. Time profile of 1.12–5.66 MeV hydrogen from IS⊙IS/EPI-Hi/LET-A at a 5-minute cadence (as in Figure 6) in panel (a) compared with the 1-minute cadence magnetic field magnitude (panel (b)), RTN magnetic longitude (panel (c)), and RTN magnetic latitude (panel (d)) from the PSP/FIELDS magnetometer, and with the 1-minute cadence radial solar wind speed (panel (e)) and solar wind proton density (panel (f)) from the PSP/SWEAP/SPC instrument. The approximate demarcation between longitudinal directions inside and outside the LET-A field of view is indicated by the dashed red line in panel (c).
Download figure:
Standard image High-resolution imageNote that in Figure 1 the higher-energy protons in the April 4 event start to increase hours before the lower-energy protons. This velocity dispersion is examined more closely in Figure 8, where the reciprocal of the particle velocity is plotted versus the arrival time for EPI-Lo He and H rates and for EPI-Hi proton pulse-height data. If the particle injection profile at the source were a step function and they traveled without scattering, the first-arriving particles at each energy would form a sharp, linear edge on such a plot. The slope of that edge would give the path length the particles traveled, while the intercept on the horizontal axis would indicate the particle release time at the Sun. Although the combined data show some indication of an onset slope, the edge is very indistinct, perhaps in part due to low statistics. For comparison, dashed lines show where such an onset edge would be if the particles left the Sun at the time of the observed solar activity described in Section 3.2 and traveled scatter-free along a magnetic field line with a length equal to that of the nominal Parker spiral from the corona to PSP (0.168 au). Solid lines corresponding to a much larger path length of 0.35 au are also shown, which seem to come closer to reproducing the observed slopes. Our interpretation of these observations is discussed in Section 4.
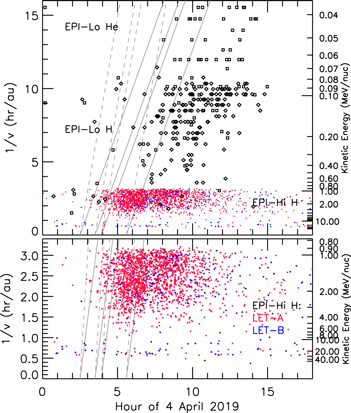
Figure 8. Top panel: reciprocal of the particle velocity plotted vs. detection time for IS⊙IS/EPI-Lo 1-minute helium rates (black squares) and hydrogen rates (black diamonds), and for IS⊙IS/EPI-Hi proton pulse-height event data from LET-A (red) and LET-B (blue). The energy corresponding to the reciprocal velocity is shown on the right axis. A symbol is plotted for EPI-Lo when the corresponding rate is nonzero; no distinction is made for counts greater than 1. Tilted gray lines indicate the expected location of particles if they left the Sun at the time of any of the four STEREO/EUVI surges identified in Figure 10 and traveled without scattering for a distance equal to that of the nominal Parker spiral at perihelion for a solar wind speed of 350 km s−1, 0.168 au (dashed lines), or a much longer path length of 0.35 au (solid lines). Bottom panel: enlarged view of only the EPI-Hi data from the top panel.
Download figure:
Standard image High-resolution image3.2. Solar Observations
Due to the location of PSP at the time, observations from the Extreme UltraViolet Imager (EUVI; Howard et al. 2008) on the Ahead Solar TErrestrial RElations Observatory (STEREO-A; Kaiser et al. 2008) spacecraft provide the only means to locate the source of the event detected by EPI-Hi on 2019 April 4. At 03:00 on this date, near the particle event onset, STEREO-A was at 324° Carrington longitude and PSP at 359° (as shown in Figure 9), only about 35° apart in longitude and 1° apart in latitude, so most of the solar hemisphere facing PSP was within STEREO’s field of view. The very quiet solar conditions make the identification of the solar origins quite straightforward. There was only one AR visible to STEREO-A on the disk, located at N06, L = 292 (in Carrington coordinates), 32° east of STEREO’s central meridian, and numbered AR 12738 when it rotated into view of Earth a few days later. This same region was the source of the event detected by EPI-Lo on April 2 (E. C. Roelof et al. 2019, in preparation) and of much larger SEP events observed by IS⊙IS and at 1 au on April 20–21 (Schwadron et al. 2020; Wiedenbeck et al. 2020). The AR remained active throughout the PSP perihelion passage, with multiple narrow ejections occurring daily. We focus on the activity during the first 7 hr of April 4 that is most relevant to the in situ observations discussed here. The ejections were very similar to each other. They were narrow, were curved, and contained cold material seen in absorption. This morphology is characteristic of Hα surges (e.g., Roy 1973; Schmahl 1981; Chae et al. 1999), and we adopt this interpretation in this paper. All surges originated from an area on the AR western edge and were directed toward the southwest (Figure 10), roughly toward the nominal PSP coronal magnetic footpoint.
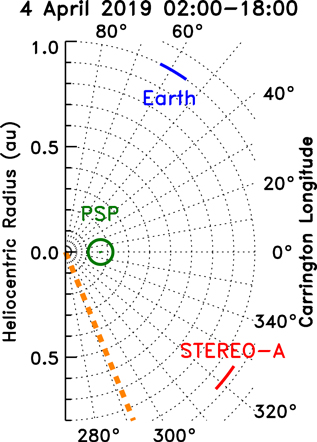
Figure 9. Locations of Earth (blue), STEREO-A (red), and PSP (green; circled) in heliographic radius and Carrington longitude during the period 02:00–18:00 on 2019 April 4. During this interval, both Earth and STEREO-A move ∼82 clockwise on this plot (eastward in longitude), while PSP moves ∼2
9 counterclockwise (westward). The longitude of AR 12738 is indicated by the dashed orange line.
Download figure:
Standard image High-resolution imageFigure 10. STEREO-A EUVI 195 Å observations of the solar activity related to the April 4 SEP event in direct (left panels) and running difference (5 minutes apart; right panels) images. The EUVI images have been enhanced by a wavelet algorithm to remove the stray-light background (Stenborg et al. 2008). Snapshots of four surges at their times of maximum visibility are shown here; the first appearances in EUVI for surges #1, #2a, #2b, and #3 are at about 02:30, 03:30, 03:55, and 05:35, respectively. A 9 s video that includes these frames and covers 6 hr of observations beginning at 01:00 on 2019 April 4 is available in the online version of the paper.
(An animation of this figure is available.)
Download figure:
Video Standard image High-resolution imageWe identified four surge events between 02:00 and 07:00 UT, as labeled in Figure 10. All have counterpart type III signatures in the FIELDS/Radio Frequency Spectrometer (RFS; Bale et al. 2016; Pulupa et al. 2017) spectra, shown in Figure 11. Note that the times reported for EUVI have a 5-minute cadence, while the RFS spectra used here have subminute resolution. Although they have unmistakable type III signatures, surges #1 and #3 are unremarkable in terms of material ejection. The most massive are surges #2a and #2b, which occur in succession and exhibit the clearest signatures of plasma motion. The plasma moves along a curved southwestern trajectory and appears to return to the surface at point F (see online movie accompanying Figure 10). No waves can be detected for any of these surges. No coronal mass ejections (CMEs) are detected from either STEREO-A or the Large Angle and Spectrometric Coronagraph (LASCO; Brueckner et al. 1995) on board the Solar and Heliospheric Observatory (Domingo et al. 1995) satellite (only LASCO/C3 is available during this period owing to a campaign). The lack of CMEs is consistent with the lack of surface manifestations, such as waves or dimmings. Large-enough surges are usually seen as jets (e.g., Vourlidas et al. 2003), which are narrow. The LASCO/C3 images show faint, narrow outflows between 06:30 and 11:10 UT along approximately the PSP position angle, but it is difficult to say whether they are associated with the radio or in situ signatures discussed here.
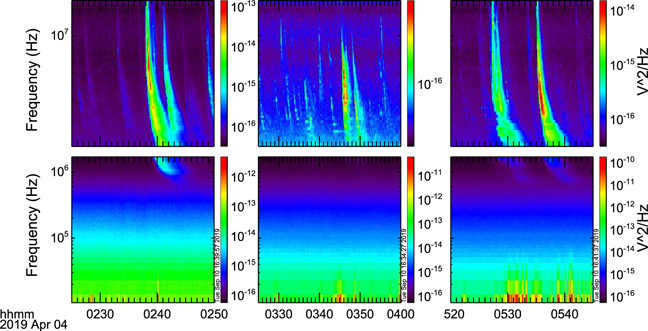
Figure 11. Dynamic radio spectra from the PSP/FIELDS/RFS at high frequencies (top) and low frequencies (bottom) around the times of the STEREO/EUVI surges shown in Figure 10. Type III signatures corresponding to surge #1 are shown in the left panels, surges #2a and #2b in the middle panels, and surge #3 in the right panels. Note the different time and intensity scales in each panel; the radio emission during surges #2a and #2b is significantly weaker than for the others.
Download figure:
Standard image High-resolution imagePrevious studies have reported “mini-CMEs” and other associated very small-scale activity such as miniwaves and minidimmings at a high rate of ∼1 event per minute distributed across the quiet Sun (e.g., Innes et al. 2009; Podladchikova et al. 2010). While we cannot rule out their presence, such activity has not been associated with the production of escaping particles accelerated to MeV energies. In contrast, the surges we identify here are the largest manifestations of solar activity during this period, originate from the only AR on the disk, and are associated with type III emission. As shown in Figure 8, they are temporally associated with the April 4 SEP event.
4. Discussion
Peak MeV proton intensities in the very small 2019 April 4 SEP event are similar to those in the many SIR events seen during the PSP mission so far (Cohen et al. 2020). Although the relatively soft proton spectral index of −4.36 is somewhat harder than the average SIR value of ∼−5 in the Cohen et al. (2020) study, what unmistakably marks this as an SEP event is the large antisunward anisotropy, significant velocity dispersion, and associated solar activity (EUVI surges and type III radio emission).
Studies based on previous multispacecraft observations find the peak intensity in an SEP event to decrease with heliocentric radius, R, as R−α, where typically α < 3 (Lario et al. 2013). If a spacecraft at 1 au were magnetically well connected to PSP, where peak MeV proton intensities were ∼0.2 protons (cm2 sr s MeV)−1 (Figure 6), one might therefore expect it to have seen an event with a peak intensity of at least ∼10−3 protons (cm2 sr s MeV)−1. The Low Energy Telescope on STEREO-A (Mewaldt et al. 2008) saw no increase in MeV protons above its background level of ∼5 × 10⁻⁵ protons (cm2 sr s MeV)−1, but its nominal magnetic footpoint in the corona (for the observed solar wind speed of 350 km s−1) was ∼23° west of that of PSP, or over 100° west of the AR (near-Earth spacecraft were even farther away in longitude than STEREO, as shown in Figure 9). It may be that energetic particles did make it to 1 au, but that STEREO-A was simply too poorly positioned in longitude to detect the event. However, evaluating the expected intensity dependence on longitude using the functional form and average parameters in Lario et al. (2013) (for 15–40 MeV protons), we find that the longitudinal difference between PSP and STEREO-A magnetic footpoints would have reduced the intensity at STEREO-A by only a factor of ∼3, not the factor of ∼20 required to make the event undetectable. Of course, many events have been observed where intensities fall more rapidly with radius or longitude than average (Lario et al. 2013), which evidently was the case here too.
In the event studied here, the He/H ratio of 0.052 ± 0.002 is high compared to the average value at 1–4 MeV nucleon−1 in large SEPs of 0.036 (Reames 1995) and compared to values in the much larger SEP events EPI-Hi observed later in 2019 April (Wiedenbeck et al. 2020); it is also much higher than the range of 0.016–0.031 found in the SIR events observed by PSP (Cohen et al. 2020). However, He/H in SEPs can vary greatly from event to event and even in SIRs throughout the solar cycle (Lario et al. 2003). The He/H ratio in this event does match that of 0.052 ± 0.005 measured spectroscopically in the corona (Laming & Feldman 2001). Although it also agrees well with the ∼0.05 measured in high-speed solar wind or at solar maximum at all speeds, it is large compared to the ∼0.02 found in slow solar wind at solar minimum (Aellig et al. 2001), conditions that describe the actual observing environment. Unfortunately, the small size of the event means that we have no additional composition measurements with which to constrain the likely source material of the energetic particles, but as described in Section 3.1, the absence of heavies seems more in line with expected coronal or photospheric composition than “typical” SEP composition. The extreme enhancement of heavy ions in EPI-Hi observed in the April 2 event produced by the same AR is completely absent here only 2 days later (Figure 4).
The differential energy spectrum averaged over the April 4 SEP event is very soft, with an index (for LET-A protons) of −4.36 on energy. If converted to phase-space density, the index on momentum would be −10.7. In diffusive shock acceleration theory, this index is equal to −3s/(s − 1), where s is the shock compression ratio (Blandford & Ostriker 1978). So if there was a shock involved in accelerating these particles (and there is no evidence of any), it must have been very weak, with a compression ratio of only 1.4. The AR was over the limb from Earth, so no measurement of any X-ray flare was possible, but as the region transited the Earth-facing side of the solar disk from April 6 to 19, it produced numerous small (B-class) flares. However, compositionally the particle event does not exhibit the 3He and heavy ion enhancements usually found in flare-accelerated material. It may be that the observed plasma motion in the EUVI surges generates sufficient compression to accelerate particles to these low energies via some compressive acceleration mechanism (Giacalone et al. 2002; Roelof 2015). Alternatively, a “pressure cooker” mechanism found to accelerate ions in planetary auroras may also operate in the solar corona, and it has been proposed as a possible SEP accelerator (Mitchell et al. 2020). In this scenario, strong downward field-aligned currents confine positively charged ions that undergo perpendicular heating by broadband electrostatic waves, gaining energy until the mirror force allows them to overcome the electric potential and escape. The occurrence of type III emission in this event indicates the presence of streaming electrons, a necessary requirement for this mechanism to work.
During the April 4 event, PSP was 0.17 au from the Sun (Figure 1), immersed in slow solar wind with a velocity of ∼350 km s−1 (Figure 7) at Carrington longitude 359°. Under these conditions, the nominal Parker spiral field line connects PSP to the corona at ∼11° Carrington longitude. The AR producing the EUVI surges (Figure 10), and presumably the concurrent type III radio emission (Figure 11) and the source of the April 4 SEP event, was located at 292° (Figure 9), nearly 80° east of the nominal magnetic footpoint. At this time, Earth was located near 60°, so the AR was about 38° over the east limb from Earth, nearly 3 days away from making an appearance in near-Earth-based magnetic imagers that could produce photospheric synoptic maps. Thus, tracing the field back to the photosphere using these maps with models such as the current sheet source surface model (Zhao & Hoeksema 1995; Poduval & Zhao 2014) is prone to larger-than-usual uncertainties, but attempts are in progress. Online synoptic maps from the Global Oscillation Network Group (GONG; https://gong2.nso.edu/archive/patch.pl) of the magnetic connectivity between the ecliptic and photosphere using the potential field source surface (PFSS; Wang & Sheeley 1992) model show conflicting results between Carrington rotations 2215 (March 12–2019 April 8) and 2216 (April 8–May 5). In rotation 2215, field lines from longitudes ∼290°–360° map to a low-latitude extension of the north polar coronal hole. The AR had not yet emerged in this synoptic map, and the field polarity disagrees with the inward polarity measured at PSP. By rotation 2216 the field polarity is correct, and field lines from the ecliptic do map back to the far western edge of AR 12738, but only over longitudes ∼300°–335°. This is only half the longitudinal span required to connect to PSP at 11°, which is shown to be connected instead to the southern polar coronal hole.
Recently, an SEP study by Klassen et al. (2018) reported an electron event observed by STEREO at 1 au with an impulsive rise and strong anisotropy, clearly indicating a good magnetic connection between the flare site and the observer, despite the fact that the source was 90° east of the nominal magnetic footpoint. As was the case for the event we discuss, Klassen et al. (2018) found that PFSS modeling did not account for the magnetic connection in the event they studied, at least in part because their event was also over the limb as seen from Earth. EUV observations showed a very long jet propagating from the AR to the nominal magnetic footpoint of the observer, highly inclined from the radial direction. Although this event was much larger in particles and electromagnetic emission than the 2019 April 4 event and therefore better observed, the particle propagation and magnetic field configuration may have been similar in the two events.
While the nominal magnetic footpoint of PSP was ∼80° from the AR, it was only ∼10° south of the heliospheric current sheet (HCS) according to Wilcox Solar Observatory (http://wso.stanford.edu) coronal field maps for both Carrington rotations 2215 and 2216 (and the field polarity measured in situ at PSP matches that expected from these maps). The AR was only ∼10° northeast of the HCS. Perhaps solar particle transport along the HCS as described by Battarbee et al. (2018) played a role. In their models, Battarbee et al. (2018) find that protons injected from an AR near an idealized HCS are efficiently transported in longitude along it via drifts, westward during A > 0 polarity solar cycles such as the one we are currently experiencing. The mean drift velocity along the sheet is calculated to be relatively fast, at 0.463 times the particle speed (Burger et al. 1985). Furthermore, when their modeled HCS is wavy rather than flat, escape of the particles from the HCS in areas of large inclination (as was present locally near the AR) allows them to cross the HCS, which is required for particle transport during the 2019 April 4 event if the source region and HCS location have been correctly identified.
If the particle injection at the source were a step function in time, the large velocity dispersion observed (Figure 8) would suggest that the average path length of the field line followed by the first-arriving particles was unusually long, a factor of ∼2 times greater than that of the nominal magnetic connection between PSP and the corona. This seems physically unlikely, as the measured field was nearly radial throughout the event (Figure 7), with no indication of a large loop or observed CME. Also, a step function injection would result in a sharp onset edge in a velocity dispersion plot, unlike that observed, unless the particles underwent a significant amount of scattering, which is difficult to reconcile with the large anisotropy that persists throughout the event (Figure 6). Thus, we conclude that the particle injection time profile was most likely not a step function, but rather extended in time.
As discussed in Section 3.1 above, the dip in LET-A protons around 07:00 in Figure 6 does not seem to be due to movement of the particle beam from inside to outside of LET’s field of view. There are no EUVI surges observed near this time (Figure 10) that might indicate a new injection of particles. Both the duration and magnitude of the dip are similar to those of dispersionless “dropouts” that have been observed in small SEP events at 1 au (Mazur et al. 2000), in which field line mixing between the source and observer occasionally results in a flux tube that is not connected to the SEP source, and thus empty of energetic particles, convecting past the observer. However, in the case of the April 4 event, the expected dispersion is so small that it is unclear whether or not the decrease is in fact dispersionless (Figure 8). Furthermore, the dip does not seem to be present at the same time in LET-B, which it should be if it were the result of an empty flux tube. As we described in Section 3.1, the dip does coincide with small changes in the solar wind environment. However, the change in energetic particle intensity (by a factor of ∼5) is very much larger than the change in the local magnetic field magnitude (15%) or solar wind density (40%), perhaps suggesting that changes nearer the source are responsible.
5. Summary
In the PSP/IS⊙IS/EPI-Hi instrument at energies above 1 MeV, the 2019 April 4 SEP event was soft, brief, very small, and highly anisotropic. Specifically, the proton spectral index was −4.36 in energy, its total duration was only ∼15 hr, proton intensities reached the GCR background by about 8 MeV, and event-averaged proton intensities in the generally sunward-facing aperture were ∼21 times greater than those in the aperture pointed 180° away, with an additional variation of a factor of more than 10 across the sunward aperture. No electrons or ions heavier than 4He were detected above quiet-time background levels, and no 3He nuclei were observed, but their intensities might be below instrument sensitivity levels in this very small event. The absence of heavy ions relative to He suggests that the event may be depleted in heavy elements compared with average SEP elemental composition. The only solid composition measurement possible is the He/H ratio, which at 0.052 is higher than the typical value found in SEPs (Reames 2014), but closer to values measured in the photosphere or corona (Feldman & Widing 2003; Lodders 2010; Caffau et al. 2011). STEREO/EUVI images show small surges in an AR ∼80° east of the nominal magnetic footpoint, temporally associated with type III emission detected by FIELDS/RFS and the EPI-Hi energetic particles. The large amount of particle velocity dispersion with a blurred onset edge, in the presence of a large anisotropy that persists throughout the event, is most easily interpreted as arising from a particle injection profile that was extended in time with transport that was nearly scatter-free.
No shocks or CMEs were observed in association with this event, and the very soft spectrum indicates that if any shock were involved in accelerating the particles, it must have been very weak (with a compression ratio of ∼1.4). Small flares may have been present in the AR but were unobservable behind the limb from near-Earth X-ray detectors, and the particle composition does not show typical signatures of flare-accelerated material. Acceleration involving heating of particles confined by field-aligned currents (Mitchell et al. 2020) is a possibility, as is compressive acceleration (Giacalone et al. 2002; Roelof 2015). It is unclear how the particles were transported 80° in longitude. Expansion of the AR field lines between the photosphere and corona by this amount is not impossible, but a survey of 14 yr of PFSS maps suggests that it would likely require a region of open field lines in the photosphere at least ∼5° in diameter (see Figure 4 of Wiedenbeck et al. 2013). However, as the Klassen et al. (2018) observations show, at times the PFSS model may simply fail to correctly identify existing highly nonradial field lines near ARs. Alternatively, drift along the nearby HCS (Battarbee et al. 2018) may also have played a role. Some mechanism imprinted a factor of ∼5 intensity drop midway through the event, which left only a small signature in the local solar wind.
The very small size of the single near-perihelion SEP event studied here severely limits our ability to draw definitive conclusions regarding the nature of particle acceleration and transport in it. Conceivably, from a vantage point even closer to the source, such an event with multiple type III bursts and EUVI surges may resolve into many discrete particle injections, just as was revealed in earlier studies comparing SEPs at 1 and 0.3 au (Wibberenz & Cane 2006). The very existence of this event, during an exceptionally quiet solar minimum and completely undetectable in situ at 1 au, raises the possibility that such events are more common than one might expect. Perhaps they provide an important source of seed particles available for acceleration in larger SEP events (although the lack of heavy ion enrichment in the April 4 event only 2 days after the extreme enhancement on April 2 may suggest a rather limited duration for the presence of this seed population, at least from these very small events). No additional SEP events have yet been identified by EPI-Hi inside 0.25 au, but other small near-perihelion events have been seen at lower energies by EPI-Lo (McComas et al. 2019; Giacalone et al. 2020; Hill et al. 2020; E. C. Roelof et al. 2019, in preparation) and at MeV energies by EPI-Hi at larger solar distances (Schwadron et al. 2020; Wiedenbeck et al. 2020). Overall, the 2019 April 4 event provides a tantalizing glimpse of what we hope to see with greater clarity as PSP gets ever closer to the Sun during its remaining 21 orbits over the next 6 yr and solar activity picks up on the way to solar maximum.
This work was supported by NASA under contract NNN06AA01C. Parker Solar Probe was designed, built, and is now operated by the Johns Hopkins University Applied Physics Laboratory as part of NASA’s Living With a Star (LWS) program. Support from the LWS management and technical team has played a critical role in the success of this mission. We appreciate the contributions of the many individuals who have made PSP the successful mission that it is, in particular the EPI-Hi engineers W. R. Cook, B. Kecman, G. Dirks, and N. Angold. We gratefully acknowledge the test and calibration support provided by Michigan State University’s National Superconducting Cyclotron Laboratory, Texas A&M University’s Cyclotron Institute, and the Lawrence Berkeley National Laboratory’s 88-inch Cyclotron Laboratory. The ISʘIS data and visualization tools are available to the community at https://spacephysics.princeton.edu/missions-instruments/isois; data are also available via the NASA Space Physics Data Facility (https://spdf.gsfc.nasa.gov/).We thank the GONG and Wilcox Solar Observatory teams for making their data readily accessible online. S.D.B. acknowledges the support of the Leverhulme Trust Visiting Professorship program.
Footnotes
- 20
At this point near perihelion the spacecraft was moving faster than corotation, unlike the more familiar case when an observer changes heliolongitude slowly compared with the solar rotation rate. Since PSP’s Carrington longitude was moving westward, it would overtake a rarefaction region by approaching it from the eastern, slow-speed side, and the solar wind speed would increase upon entering the rarefaction.