Abstract
We present a near-complete catalog of the metal-rich population of thermally pulsing asymptotic giant branch (AGB) stars in the northwest quadrant of M31. This metal-rich sample complements the equally complete metal-poor Magellanic Cloud AGB catalogs produced by the SAGE program. Our catalog includes Hubble Space Telescope (HST) wide-band photometry from the Panchromatic Hubble Andromeda Treasury survey, HST medium-band photometry used to chemically classify a subset of the sample, and Spitzer mid- and far-IR photometry that we have used to isolate dust-producing AGB stars. We have detected 346,623 AGB stars; these include 4802 AGB candidates producing considerable dust, and 1356 AGB candidates that lie within clusters with measured ages, and in some cases metallicities. Using the Spitzer data and chemical classifications made with the medium-band data, we have identified both carbon- and oxygen-rich AGB candidates producing significant dust. We have applied color–mass-loss relations based on dusty-AGB stars from the LMC to estimate the dust injection by AGB stars in the PHAT footprint. Applying our color relations to a subset of the chemically classified stars producing the bulk of the dust, we find that ∼97.8% of the dust is oxygen-rich. Using several scenarios for the dust lifetime, we have estimated the contribution of AGB stars to the global dust budget of M31 to be 0.9%–35.5%, which is in line with previous estimates in the Magellanic Clouds. Follow-up observations of the M31 AGB candidates with the JWST will allow us to further constrain stellar and chemical evolutionary models, and the feedback and dust production of metal-rich evolved stars.
Original content from this work may be used under the terms of the Creative Commons Attribution 4.0 licence. Any further distribution of this work must maintain attribution to the author(s) and the title of the work, journal citation and DOI.
1. Introduction
Intermediate-mass stars (0.8–8 M⊙) go through a short thermally pulsing asymptotic giant branch (TP-AGB) phase in the final stages of their evolution. During this period, they undergo large thermal pulses and contribute a considerable amount of their material (up to 80%) back to the interstellar medium (ISM) via dense stellar winds (e.g., Groenewegen & Sloan 2018). As these stars lose mass, much of the circumstellar material condenses into dust grains. Collectively, AGB stars 7 are rivaled only by supernovae in terms of their total dust production. They contribute significantly to the dust and metals in nearby galaxies (Matsuura et al. 2009; Riebel et al. 2012; Schneider et al. 2014; Srinivasan et al. 2016; Boyer et al. 2017), and may have a similar impact in high-redshift galaxies.
While it is clear that these stars affect galaxies in a number of ways, their complex circumstellar environments make quantifying their impact a challenge (Karakas & Lattanzio 2014; Höfner & Olofsson 2018). Convection, mass loss, and other internal processes introduce degeneracy into radiative transfer models, stellar evolutionary models, and cosmological simulations. Uncertainties in AGB dust properties limit our ability to understand the dust budgets of galaxies. All of these uncertainties are further compounded by the unknown effects of metallicity. In this paper, we will explore the characteristics of metal-rich AGB stars in M31 and compare them with metal-poor samples in the Magellanic Clouds (MCs) to look for clues to how metallicity affects the observational characteristics of AGB stars, as well as their mass loss, dust production, and evolution.
1.1. M31
M31 is one of the few nearby, metal-rich galaxies that we can resolve with current instruments and is the best nearby example of a star-forming massive galaxy like our own. It is an L* galaxy 8 hosting a diversity of stellar populations, a spiral structure, a traditional spheroidal component, and a source of disk and bulge components. M31's stellar population is primarily metal-rich ([M/H]∼−0.2–0.1), but has stars that span an order of magnitude in iron abundance (Gregersen et al. 2015).
M31's size, distance, and unobscured view make it an excellent target for studying metal-rich stellar populations. Its stellar population has a known common distance, measured using multiple methods and with little disagreement (776 kpc; Freedman & Madore 1990; Dalcanton et al. 2012; Riess et al. 2012; Li et al. 2021). It is similar in size to the Milky Way (Chemin et al. 2009; Kafle et al. 2018), and is largely unobstructed by foreground dust, with little extinction limiting our sensitivity to the sources in the optical. Its internal dust has also been well mapped (Dalcanton et al. 2012; Draine et al. 2014). This is in stark contrast to the Galactic samples, which are incomplete, due to foreground extinction, and have highly uncertain distances. Gaia is also only able to measure distances to nearby Galactic AGB stars given the migration of the photocenters, as a result of convective cells (Chiavassa et al. 2011, 2018). M31 therefore allows us to study a statistically large sample of AGB stars in a single galaxy with minimal issues caused by extinction, crowding, and uncertain distances.
The Panchromatic Hubble Andromeda Treasury (PHAT; Dalcanton et al. 2012) program covered a third of M31's disk (Figure 1), with UV, optical, and NIR imaging. This data set has been used to study stellar and galaxy evolution in great detail (e.g., Rosenfield et al. 2012; Lewis et al. 2015; Williams et al. 2017). With M31's large stellar mass, and abundance of resolved stars (120 million; Williams et al. 2014), this data set offers the opportunity to study different stellar processes in a metal-rich environment without being limited by Poisson statistics. Clusters have been detected in M31 (Krienke & Hodge 2007, 2008; Barmby et al. 2009; Hodge et al. 2009; Perina et al. 2010; Johnson et al. 2015). Using the superior sensitivity and angular resolution of the PHAT data, we can identify AGB candidates in clusters with associated ages, masses, and metallicities.
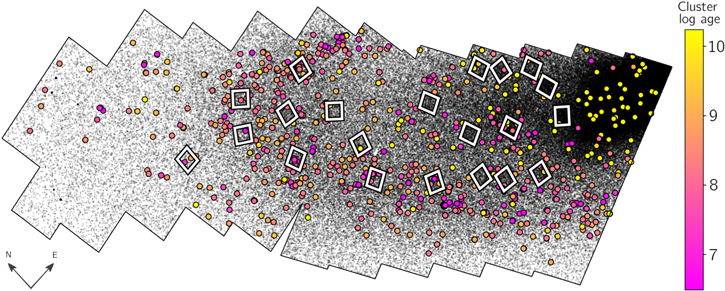
Figure 1. The spatial distribution of the AGB candidates identified here (black), outlined by the PHAT footprint. Clusters with known ages and detected AGB candidates are marked with circles (see Section 4), and the medium-band HST footprints where TP-AGB chemical types (carbon- or oxygen-rich) that have been determined by Boyer et al. (2019) are marked with white squares. While our HST data are limited to the PHAT footprint, Spitzer imaging data exists covering the entirety of M31's disk.
Download figure:
Standard image High-resolution imagePrevious ground-based observations targeting AGB stars in M31 have been limited to shallow observations, low angular resolution, and/or small fields (Brewer et al. 1995, 1996; Kodaira et al. 1998; Davidge 2001; Battinelli & Demers 2005; Davidge et al. 2005; Boyer et al. 2013; Hamren et al. 2015; Boyer et al. 2019; Massey et al. 2021; Ren et al. 2021; Wang et al. 2021). By characterizing M31's AGB population, we will have the confidence of uniformity and statistical power needed to compare it to other nearby galaxies. We will then be able to probe how metallicity affects AGB dust properties and the global dust budget.
1.2. Metallicity and Dust
AGB dust and dust production have been studied in the MCs and other nearby metal-poor dwarf galaxies (e.g., Sloan et al. 2009). While carbon stars produce carbonaceous dust species like graphite, oxygen-rich AGB stars produce silicates made up of different species of olivines and pyroxenes (Gail et al. 2009; Jones et al. 2012). The exact properties of the dust (e.g., composition, shape, grain size, grain size distribution, porosity, and refractory metal content), however, are still unknown, and likely change depending on the elemental abundances and the environment, leaving the impact of metallicity unclear.
It is expected that the dust production of oxygen-rich AGB stars should be affected by metallicity. A decrease in metals should limit the number of available sites for dust-seed nucleation (Lagadec & Zijlstra 2008; Nanni et al. 2018). This conclusion is supported by evidence of decreased dust production from the Large Magellanic Cloud (LMC) to the Small Magellanic Cloud (SMC) and nearby globular clusters (Sloan et al. 2008; McDonald et al. 2009; Sloan et al. 2010; McDonald et al. 2011a). However, studies have found evidence for (van Loon 2000; van Loon et al. 2005) and against (McDonald et al. 2011b; Sloan et al. 2012, 2016) the claim that carbon-rich AGB dust production depends on metallicity. Theoretical models have attempted to predict the effect of metallicity on the dust production of both oxygen-rich and carbon-rich AGB stars (see Ferrarotti & Gail 2006; Nanni et al. 2013, 2014). While uncertain, these models favor a small impact of metallicity on the total AGB dust output.
There have also been empirical studies suggesting that metallicity can have a dramatic impact on the wind speeds of AGB mass outflows, with differing effects for carbon- (Groenewegen 2012) and oxygen-rich (Goldman et al. 2017; McDonald et al. 2019, 2020) AGB stars. While based on a limited range in metallicity, and small samples, metallicity seems to have a much larger impact on the wind speeds of oxygen-rich AGB stars.
While sufficient numbers of AGB stars have been discovered and studied in metal-poor environments (McDonald et al. 2010; Boyer et al. 2011; Riebel et al. 2012; Srinivasan et al. 2016; Boyer et al. 2017; Goldman et al. 2019a, 2019b; Karambelkar et al. 2019), to begin assessing the role of metallicity on AGB evolution, we need data in the metal-rich regime to fully leverage previous studies. In this paper, we take advantage of the exquisite sensitivity and resolution of the space-based archival data from the Hubble Space Telescope (HST) and Spitzer to identify the AGB population in M31. We produce the most complete catalog of metal-rich AGB stars to date, with particular focus on dust production, complementing the metal-poor samples already identified in the MCs. Section 2 outlines the data, Section 3 describes our catalog matching method and classification criteria, Section 4 discusses the catalog results, and Section 5 discusses the impact of AGB stars on the dust budget of M31.
2. Data
In this work, we use archival imaging of M31 from the HST (Dalcanton et al. 2012; Boyer et al. 2013, 2019) and Spitzer (Barmby et al. 2006) as well as classifications from the archival stellar spectra from Keck (Guhathakurta et al. 2006). These data cover the UV through the IR with coverage in both wide and narrow bands that probe molecular features. Here we combine these data to identify the evolved-star population in the PHAT footprint of M31 (Figure 1).
2.1. Broadband Photometry
2.1.1. HST/PHAT
The PHAT survey resolved ∼120 million stars in M31. The observations were split into 23 subregions referred to as “Bricks” that collectively cover ∼0.5 square degrees of M31's disk. These regions were imaged with the HST in ultraviolet (F275W and F336W), optical (F475W and F814W), and near-infrared (F110W and F160W) filters using the WFC3/UVIS, ACS/WFC3, and WFC3/IR instruments, respectively. The HST data are sensitive down to the red clump (F160W ∼ 24 mag) in each of these filters in the outskirts of the galaxy, where crowding is minimal. In the most crowded regions near the bulge (Bricks 1 and 3), the depth is closer to F160W ∼ 21.5 mag. Point-spread function (PSF) photometry was performed using DOLPHOT (Dolphin 2002) after which we applied photometric quality cuts. These cuts require the F110W and F160W photometry to satisfy the good-star “GST” sharpness and crowding criteria (outlined in Williams et al. 2014) used to limit contamination. As the PHAT data only covers around a third of M31's disk, we have restricted our catalog to stars in this region.
2.1.2. Spitzer
Barmby et al. (2006) and Gordon et al. (2006) observed M31 with the Spitzer Space Telescope using both the Infrared Array Camera (IRAC; Fazio et al. 2004) and the Multiband Imaging Photometer for Spitzer (MIPS; Rieke et al. 2004), respectively, in bands centered at 3.6, 4.5, 5.8, 8.0, and 24 μm. These observations covered the entirety of the disk including the PHAT footprint. The Spitzer/IRAC observations had limited spatial resolution (≲2″) compared to HST (007–0
15). The IRAC data are also less sensitive, with a limit near the tip of the red-giant branch (TRGB; [3.6] ∼ 21.2 mag). Most TP-AGB stars are brighter than the TRGB, allowing us to identify a near-complete TP-AGB population in M31 from the optical to mid-IR (discussed further in 2.4). We measured PSF photometry on the individual dithered IRAC exposures using the DUST in Nearby Galaxies with Spitzer (DUSTiNGS) pipeline (Boyer et al. 2015), which uses DAOphot II and ALLSTAR (Stetson 1987). We also require our Spitzer IRAC photometry to meet the photometric quality criteria (GST) that remove extended objects and image artifacts. The photometry are required to be detected over a level of 5σ, meet DAOphot sharpness (−0.4 < Sλ
< 0.4) and χ2 > 4 thresholds, and must be detected in both the [3.6] and [4.5] filters. We will refer to this data as the Spitzer good-star catalog (GSC).
We have matched our IRAC-GSC sources with the longer-wavelength Spitzer data ([5.8], [8.0], and [24]) from Khan 2017). While the Khan (2017) catalog includes the IRAC [3.6] and [4.5] data, the DUSTiNGS pipeline provides higher-fidelity data for brighter sources in the 3.6 and 4.5 μm filters (see Boyer et al. 2015, for details). This provides more precise AGB classifications using the IR data. The DUSTiNGS pipeline measures the coadded frames for the fainter sources ([3.6] > 14.7 mag) to obtain the deepest possible photometry. Using these mosaicked and subsampled images, however, can distort the PSF; for example, if it includes a rotation between frames. Since brighter sources are more sensitive to changes in the PSF, the DUSTiNGS pipeline performs the photometry for the brighter sources on the individual images.
The photometric catalog from Khan (2017) also appears to have limited calibration. Given the spatial distribution of the sources, the catalog does not include many of the necessary corrections including the array location correction, pixel-phase correction, pixel solid angle variation correction, and color correction. Here, we include the lower-resolution longer-wavelength (5.8, 8, and 24 μm) photometry from Khan (2017), but these data are not used for stellar classification or any other measurements or derived values in this work.
2.2. HST Medium-band Photometry
Boyer et al. (2019) observed M31 in 21 fields (white squares in Figure 1) in three near-IR medium-band HST filters, F127M, F139M, and F153M. These filters probe features from water in oxygen-rich AGB stars and CN+C2 in carbon stars (Boyer et al. 2013, 2017, 2019), and allow for the classification of the chemical types (discussed further in Section 2.6). These data were also run through the PHAT photometric pipeline (described in Williams et al. 2014), and used the same sharpness and crowding cuts to exclude blended and extended sources. 9 The photometry are complete in each of the three bands down to around 22–23 mag, several magnitudes below the TRGB, ensuring completeness in this subset of the sample.
2.3. SPLASH
Optical spectra for 1867 AGB stars are available from the Spectroscopic and Photometric Landscape of Andromeda's Stellar Halo (SPLASH) survey (Guhathakurta et al. 2006). These data were taken using the DEIMOS instrument on the Keck II 10 m telescope, with a spectral range of 4800–9500 Å that spans different molecular features in both oxygen- and carbon-rich AGB stars. The survey targeted sources primarily in the outer disk where crowding is low. The spectra were used to classify AGB stars using color–magnitude diagrams (CMDs) and a suite of spectral templates (Hamren et al. 2015; Prichard et al. 2017). Carbon-rich AGB stars were identified using the C2 Swan bands and oxygen-rich AGB stars using the TiO bands and near-IR Ca ii triplet. We have matched our AGB candidates with the SPLASH classifications and have included them in our catalog.
2.4. Catalog Completeness
The completeness of our data is limited by crowding and thus depends on the radial distance to the galaxy center. Figure 2 shows the completeness of the HST and Spitzer data in concentric radial bins, with each bin consisting of all the catalog sources at the specified deprojected radius (r) ±1 kpc. We show four example regions that demonstrate the range of completeness from the most (r = 2 kpc) to least crowded regions (r = 14 kpc).
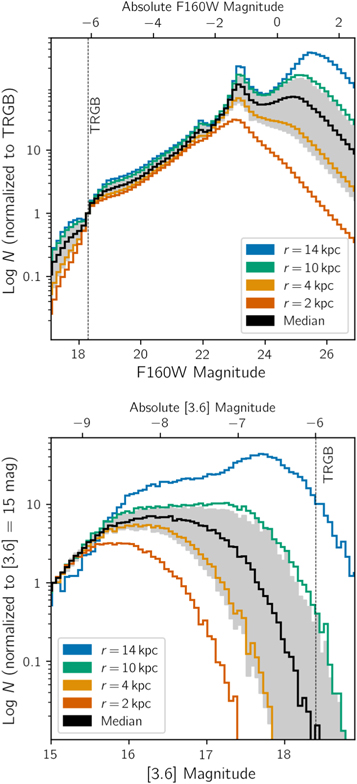
Figure 2. Luminosity functions illustrating the completeness of our M31 data for HST (top) and Spitzer (bottom) in radial arcs across the PHAT footprint. Each radial bin includes all photometry at a specified deprojected radius (r) ±1 kpc, so long as they meet the data quality sharpness and crowding cuts. The TRGB is shown for both filters. Also shown is the median functions of the completeness calculated at 1 kpc intervals, as well as the 68% confidence level around the median calculated by bootstrapping (shown in gray).
Download figure:
Standard image High-resolution imageOur HST data are complete in even our most-crowded regions down to F160W∼22 mag, four magnitudes below the TRGB. This ensures that we can detect even the faintest and lowest-mass evolved stars with HST. We are limited, however, in detecting those stars that are so dusty that they are obscured in the optical and near-IR; we target these sources with Spitzer. Our Spitzer photometry are complete down to [3.6] ∼ 15.9 mag (M[3.6] = −8.5) for most of our sample and down to [3.6] ∼ 15.4 mag in our most crowded regions. While not as deep as the HST data, this level of completeness is sufficient for detecting most of the dustiest evolved stars in the MCs, which we estimate at 92% and 98% of the x-AGB samples in the SMC and LMC, respectively. This ensures that we have completeness for the bulk of the AGB population using our combined HST and Spitzer catalog.
2.5. Contamination
Before identifying evolved stars in our catalog, we will discuss potential sources of contamination. We expect some contamination from a variety of IR-bright sources. This includes foreground stars and background galaxies, image artifacts and blended sources, and ISM features confused as stars.
Foreground Contamination. We expect some contamination from foreground stars that may be masquerading as our most luminous AGB candidates, distributed around the disk. We expect most of these foreground stars to be M dwarfs with a small fraction of red giants (Massey & Evans 2016; Ren et al. 2021). We have modeled the expected foreground contamination using the trilegal code (Girardi et al. 2012), centered on, and with the same size, as the PHAT footprint. We estimate that 367 foreground sources (<0.1% of the AGB sample) would fall within our AGB selection criteria. We also estimated contamination based on the data from Boyer et al. (2019). The medium-band filters are able to isolate AGB stars from foreground stars, and suggests the contamination may be as high as 2.6%. However, the Boyer et al. (2019) data also includes other contaminants, especially massive stars, so some of that 2.6% may be due to these other stellar types belonging to M31.
Foreground Diffraction Spikes. Spurious detections within the wings of diffraction spikes from foreground stars can be confused with AGB stars in the PHAT data, while still passing the GST criteria. To identify these, we identify concentrations of stars not associated with clusters. From this sample subset, we identify sources based on pixel statistics of F160W image cutouts. We use the standard deviation (σ) and max counts per pixel (Vmax) within 3″ × 3″ F160W image cutouts and select all sources within our clustered subsets with Vmax > 100 and σ > 10. We then remove foreground diffraction spikes by inspecting the image cutouts that meet these criteria.
Background Contamination. Nearby samples of evolved stars like those in the MCs are far more luminous than typical background galaxies. In more distant samples like M31, however, the apparent brightness of the AGB stars is closer to the brightness of background galaxies. Regardless, the high resolution of the HST observations ensures that these would be removed by our photometric quality cuts.
Blending Contamination. The HST data is not strongly affected by blending for bright stars, except near M31's bulge and cluster centers. We have mitigated these effects using crowding cuts in the HST data (outlined in Williams et al. 2014). In contrast, the lower-resolution Spitzer imaging is likely to be affected by unresolved blended stars, which would overinflate the measured brightness. We have also used crowding cuts in our Spitzer photometry (see Section 2.1.2), but remain crowding-limited throughout the disk. For the dustiest sources detected with the HST and Spitzer (described later in Section 4.1), the fraction of the sample that have a dusty (F110W−F160 > 2 mag and F110W < 20 mag) PHAT source within Spitzer's FWHM (∼2″) is eight sources or roughly 0.17%. This ensures that most of the dusty sources are not significantly affected by blending.
ISM Confusion. IR-bright ISM features also have the potential to create spurious detections that may appear as our dustiest TP-AGB stars. The MIPS 24 μm photometry has a much lower angular resolution than our HST or IRAC photometry, making it difficult to distinguish ISM from stellar sources morphologically. While no crowding or sharpness cuts have been made to the MIPS data (Khan 2017), it is not used in the AGB selection criteria, and thus should not affect the source selection of the AGB catalog. We expected minimal contamination from ISM features in the [3.6] and [4.5] filters.
2.6. Chemical Types
AGB stars have circumstellar environments of either carbon- or oxygen-rich chemistry, or, in some rare cases, both (Merrill 1922). The circumstellar chemistry is determined by the relative abundances of carbon and oxygen after the majority of these elements have combined to form CO. These abundances depend on internal processes referred to as third dredge-up events (TDUs) and hot-bottom burning (HBB). The C/O boundaries in stellar properties where these processes dominate, however, are still unclear. Models predict that the C/O boundaries vary dramatically with metallicity and initial mass (Marigo et al. 2013; Karakas 2014; Marigo et al. 2017), and observations have shown that the carbon-star formation drops dramatically (and may even be prevented) in metal-rich environments (Brewer et al. 1995; Boyer et al. 2013, 2019).
We can use chemically classified AGB stars in M31 to probe the conditions that favor production of either carbon- or oxygen-rich AGB atmospheres. The chemical subtypes of carbon (C) or oxygen (M) have already been determined for a subset of the AGB stars in small regions of M31. Hamren et al. (2015) spectroscopically identified 103 carbon-rich and 736 oxygen-rich AGB stars. Boyer et al. (2019) identified 346 carbon stars and 20,441 oxygen-rich AGB stars photometrically using medium-band HST filters (Figure 3). While both of these data sets only cover small areas across the PHAT footprint, we use these classifications to calibrate our AGB classification criteria for the full M31 sample; we will discuss this further in Section 3.3.
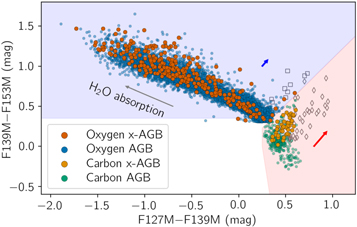
Figure 3. Our M31 AGB candidates that were previously classified as oxygen- or carbon-rich (Boyer et al. 2019), with the subsets we have subsequently classified as the dustiest, extreme (x-) AGB candidates (discussed further in Section 4.1). Also shown are the dustiest carbon- (diamonds) and oxygen-rich (squares) sources in the LMC (Groenewegen & Sloan 2018). Extinction vectors with an E(J − Ks ) = 1 mag are shown for oxygen-rich (blue arrow) and carbon-rich (red arrow) dust species, with 60% silicates and 40% AlOx for the oxygen-rich dust and 70% amorphous carbon and 30% SiC dust for the carbon-rich dust.
Download figure:
Standard image High-resolution image2.7. Clusters
Thanks to their well-defined ages and metallicities, clusters have been critical for calibrating complex phases of stellar evolutionary models like the TP-AGB. For decades these calibrations have relied primarily on small samples of AGB stars in 31 clusters in the MCs (Frogel et al. 1990). These clusters, however, span a limited range of ages and metallicities, and suffer from stochastic sampling. While stochastics can be overcome by binning (e.g., Girardi & Marigo 2007), LMC clusters with ages ∼1.6 Gyr have also shown to have derived quantities that are not proportional to the AGB lifetimes. This effect, referred to as “TP-AGB boosting,” compromises a large fraction of the MC clusters’ utility as AGB calibrators (Girardi et al. 2013). As clusters in M31 span a larger range in age (and metallicity) than the LMC, we do not expect TP-AGB boosting to affect so much the M31 cluster sample. The larger range of cluster ages and metallicities also provides data near the unexplored boundaries in parameter space where we expect transitions in circumstellar chemistry. A handful of AGB candidates have also been identified near clusters in other nearby galaxies (e.g., Karambelkar et al. 2019).
Thousands of clusters have been identified in the M31 PHAT data (Johnson et al. 2015), providing pockets of stars with known ages and metallicities. The compilation of cluster ages and masses combines results from CMD fitting for younger clusters (<300 Myr) as presented in Johnson et al. (2016) and integrated-light estimates of the ages and masses using the method by Fouesneau et al. (2014), compiled by Beerman (2015). Girardi et al. (2020) identified 937 AGB candidates, and we have identified a similar slightly higher number of AGB candidates (N = 1356). The discrepancy in these numbers is related to the differences in the selection criteria (discussed later in Section 4.2). Cluster membership was determined in Girardi et al. (2020) and here by having the on-sky positions within the apparent radius (measured by Johnson et al. 2015) of each cluster.
3. Compiling the AGB Catalog
We have culled and then matched the PHAT photometry to the HST medium-band and Spitzer photometry based on their positions and brightness. The catalog matching process includes the following four steps:
- 1.PHAT. We include an initial cut (described in the following section) to remove faint and bluer (non-AGB) PHAT sources (∼120 million → ∼23 million stars).
- 2.Other HST. We match the selected subset of the PHAT catalog (∼23 million) to the medium-band HST data using the stellar positions (within 1″). The F814W band data from Williams et al. (2014) was rereduced by Boyer et al. (2019) simultaneously with the medium-band data (same data, but performed independently) and was used to assess the quality of matches; we will call this cat1.
- 3.Spitzer. We match our Spitzer IRAC [3.6] and [4.5] “GSC” catalog to the Spitzer catalog with the longer-wavelength ([5.8], [8.0], and [24]) data from Khan (2017) using the source positions and brightness. Within the PHAT footprint, the Khan catalog also included 3.6 and 4.5 μm data, reduced independently. We use that photometry for matching sources (see below) but not for subsequent catalogs; we will call this cat2.
- 4.Final Catalog. We match the resulting two catalogs (cat1, cat2) based on the stellar positions (within 1″) and refer to this as cat3.
Each of these steps is described further in the following sections.
3.1. Culling the PHAT Data
Given the differences in the depth, angular resolution, and wavelength coverage of our HST and Spitzer data, we must first rid our HST data of sources unlikely to be AGB stars to achieve better matching of the catalogs. The HST data is far more sensitive than the Spitzer photometry, which is only sensitive down to the TRGB, and has a higher spatial density of sources due to the higher resolution. With the differences in sensitivity, we run the risk of matching the highly reddened Spitzer photometry with other spurious sources in the PHAT data. To mitigate this, we have used several HST cuts to reject the fainter and bluer sources from the HST catalog of plausible AGB candidates.
The HST selection of candidate AGB stars is any of the following:
- 1.F110W < 20.28 mag, to restrict to luminous stars.
- 2.F160W < 19.28 mag, to restrict to luminous stars.
- 3.F110W–F160W > 1.2 and above the line (F160W) =2 × (F110W − F160W) + 16.88 mag, to recover dustier AGB candidates.
As shown in Figure 4, we limit the HST data to all of the PHAT sources that are no more than 1 mag below the TRGB (measured in Boyer et al. 2019) in either the F110W or F160W filters (Requirements A and B). We also include fainter stars if they are significantly reddened (Requirement C), to allow for dusty-AGB candidates whose circumstellar extinction can make them quite faint even in the near-IR filters (e.g., Boyer et al. 2017). We will now compile the IR component of our catalog.
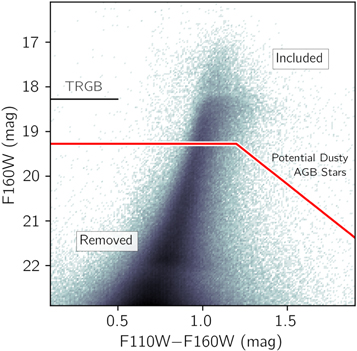
Figure 4. An HST-CMD showing the initial cuts to the PHAT catalog. These cuts remove fainter non-AGB sources while still including fainter reddened sources. This cut minimizes spurious matches between the HST and Spitzer data.
Download figure:
Standard image High-resolution image3.2. Matching with Spitzer
In Step 3, above, we match our Spitzer catalog, with IRAC [3.6] and [4.5] data, to the Spitzer catalog by Khan (2017), which includes data in the [3.6], [4.5], [5.8], [8.0], and [24] filters. The Khan (2017) catalog is larger that our Spitzer catalog due to our additional crowding and sharpness cuts, and thus we match only 52% of the Khan (2017) catalog within 1″. The Khan (2017) sources without matches are not restricted to any region of the IR-CMD (Figure 5). This gives us more confidence that our matching routine is not biased against specific stellar types.
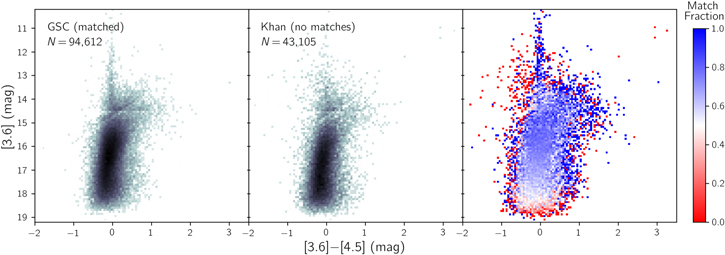
Figure 5. CMDs showing the Spitzer-GSC data with matches to the Khan (2017) catalog (left), the Khan (2017) catalog with no matches to GSC (center), and binned regions with the fraction of the GSC sources with matches to Khan (2017) shown in color (right). We see no clear biases in the matched-fraction CMD indicating that we are not missing any parts of the IR-CMD in our matching process.
Download figure:
Standard image High-resolution imageWe have used both position and brightness in matching our Spitzer catalogs. We match catalogs by taking each of our Spitzer sources within the PHAT footprint (N = 137,717) and examining the three nearest sources from the larger Khan (2017) catalog within 1″ (N = 201,381 within the PHAT footprint). We then compare each of the three 3.6 μm mag to our source’s 3.6 μm mag, and select the best-fitting [3.6] match based on brightness, so long as the data is available. This resulted in sources where the second-closest (N = 3453; 3.6%) and third-closest (N = 183; 0.2%) spatial matches were chosen on the basis of being better magnitude matches. If none of the three sources within 1″ have a magnitude match within 3%, we do not include any of the [5.8], [8.0], or [24] data from Khan (2017); this excluded 1010 (1.1%) of the sources. We use a relatively conservative 3% brightness matching limit as the data are the same, but the photometry is performed independently. Our brightness matching ensures that, for matches that do differ significantly at 3.6 μm (some by as much as 10%), further differences are not included in the less-sensitive, longer-wavelength filters.
In Step 4, we match the HST (cat1) and Spitzer (cat2) catalogs using their positions. We have 7023 Spitzer sources from cat2 (5%) without any HST matches. We omit the Spitzer data in these cases. In the case of multiple Spitzer matches to the same HST source, we use the nearest positional match.
3.3. AGB Criteria
Using the matched and culled catalog described in the previous sections, we applied color and magnitude cuts to identify the AGB candidates spanning the PHAT footprint. Our classification criteria were guided using the AGB sample already identified by Boyer et al. (2019), and are illustrated in Figure 6. We start with the HST data, including sources above the TRGB. We also exclude blue supergiants and main-sequence stars by limiting our selection to red colors.
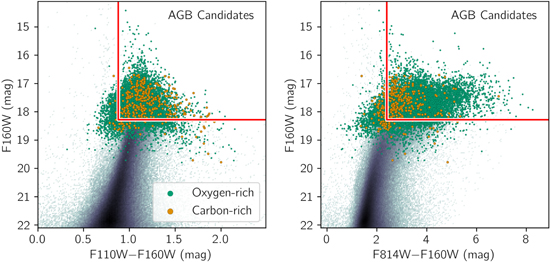
Figure 6. CMDs showing the chemically classified AGB sample from Boyer et al. (2019) that was used to calibrate the AGB classification criteria (red lines). The oxygen- and carbon-rich stars from Boyer et al. (2019) are shown as green and orange points, respectively. The PHAT photometry for Brick 9 is shown in black, for reference.
Download figure:
Standard image High-resolution imageHST AGB candidate (all of the following):
- 1.F110W < 19.28 mag or F160W < 18.28 mag.
- 2.F110W–F160W > 0.88 mag (applied only if data is available).
- 3.F814W–F160W > 2.4 mag (applied only if data is available).
The slight magnitude difference between the initial PHAT selection and AGB criteria will become more clear when we discuss our additional AGB criteria in the IR (Section 3.4).
3.3.1. AGB Criteria Effectiveness
We have used our previously classified AGB stars from Boyer et al. (2019) to determine the effectiveness of our AGB criteria. Of the sources classified as AGB stars using medium-band HST photometry (20,787), 25% (6282) did not meet our HST AGB criteria; this is split up between 14% (4648) that fall below the TRGB in F110W and F160W, 11% (2,281) that we remove using the F814W–F160W color cut, 5% (1,074) that we remove with the F110W–F160W color cut, and 0.3% (74) that did not have any match to the PHAT data within 1″. The previous medium-band color cuts have better discretionary power for identifying AGB stars. The TRGB requirement in Boyer et al. (2019) applied to any of five filters (as opposed to our two) providing more opportunities to classify sources as AGB stars. We expect these removed sources in the medium-band regions to be AGB candidates, and they are reintroduced into the catalog based on the previous classification.
Our color cuts were selected to balance recovering chemically classified sources from Boyer et al. (2019) and removing warmer red supergiants. The completeness and contamination levels for different magnitude and color cuts, as well as the criteria we chose, are shown in Figure 7. Our magnitude requirements were chosen to be in line with those of Boyer et al. (2019), and we use their estimates for the TRGB for our criteria. For our color cuts, we chose our F110W–F160W color threshold to be in line with that of Girardi et al. (2020), which aims to remove red supergiants (RSGs) and foreground stars. Figure 7 illustrates our balance in recovering the chemically classified sample while limiting contamination. The figure does not show our potential contamination from warmer supergiants, which are not isolated in broadband filters, and which can be more challenging to identify. We have added additional AGB criteria in the IR to recover the dustiest AGB stars too obscured to be detected with HST, as discussed in the following sections.
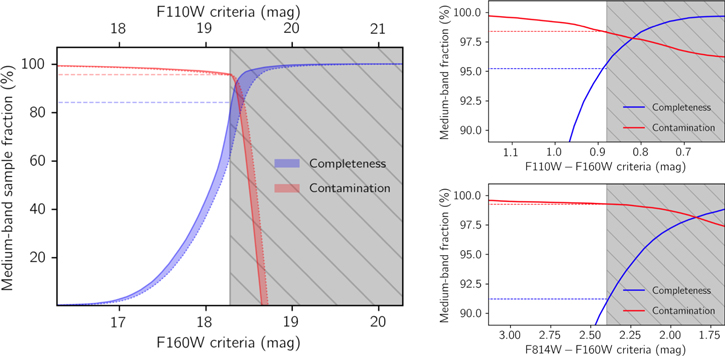
Figure 7. Our completeness vs. contamination (or rather, sample purity) recovering AGB stars classified with medium-band data (Boyer et al. 2019), using our AGB criteria. Left: the AGB magnitude criteria completeness vs. contamination showing an increasing fraction of the sample having sources with medium-band data but not classified as AGB stars toward fainter magnitudes and below our criteria (shown in gray); our criteria require photometry above the TRGB in the F110W (top axis) or F160W (bottom axis) filters. Shown are the F110W (dotted blue/red lines) and F160W (solid blue/red lines) filter criteria and the fraction of the sample (dashed lines) at our more inclusive magnitude requirement (F110W or F160W) for the completeness and contamination. Right: similar figures showing the AGB color criteria completeness vs. contamination for our color criteria. These figures are limited to sources that also meet our AGB magnitude criteria.
Download figure:
Standard image High-resolution image3.4. Dusty-AGB Stars
An intermediate-mass star in the core He-burning phase produces a modest amount of dust, but still loses mass in a form of stellar winds driven by acoustic and chromospheric processes (Dupree et al. 1984). As it evolves from the core He-burning to AGB phase, the star begins to pulsate, levitate more material out to larger radii, and produce significant dust. As mass in the envelope is lost and surface gravity decreases, the strength of the pulsations and mass loss increases.
Even with the inclusion of the fainter red sources in the PHAT data, it is possible that we are missing some of these dusty-AGB stars. We therefore add stars back into the catalog if their Spitzer [3.6]–[4.5] color puts them in the region of the CMD where dusty-AGB stars are likely to be located (Boyer et al. 2011, 2017); with this additional inclusion criteria, we recover 78 dusty-AGB candidates (Figure 8), which would have been missed using our HST criteria alone. While a small number, these are among the dustiest sources (see Section 4.1), so it is important to include them in the final sample.
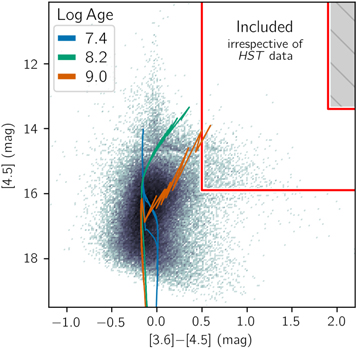
Figure 8. A CMD isolating Spitzer sources that are bright and reddened in the IR. These have been included in the AGB catalog irrespective of their HST data (or lack of HST data). PARSEC isochrones (Marigo et al. 2017) are shown to indicate the end stage of evolution before the onset of AGB mass loss and considerable dust production.
Download figure:
Standard image High-resolution imageAdditional inclusion (either of the following):
- 1.[3.6] − [4.5] > 0.5 and [4.5] < 16.4 mag; to recovered the dusty-AGB stars too faint or obscured to be detected in the near-IR.
- 2.We also add stars back in that were identified as AGB stars by Boyer et al. (2019) using medium-band filters.
Based on the AGB photometry in the LMC (Riebel et al. 2012), we expect that we are not missing many dusty-AGB stars that are too obscured and faint for our HST criteria, yet not sufficiently reddened in the IR to meet our Spitzer criteria. We can use the much deeper 2MASS J and H photometry for the LMC AGB sample as a proxy for our HST F110W and F160W filters as they share a similar wavelength coverage. Applying our near-IR and Spitzer AGB criteria to the LMC AGB sample, we would only have missed three AGB stars (0.017% of the full LMC AGB sample).
This additional inclusion step is used to recover dusty-AGB stars that either were not detected in HST or did not meet the criteria due to extreme circumstellar dust extinction. The HST criteria, which requires HST photometry above the TRGB, differs from the initial HST selection (one mag below TRGB). This is done to include HST photometry for sources classified as AGB candidates based on their Spitzer photometry, but that have fainter HST photometry. We also include an additional removal criteria that removed four background galaxies.
Additional removal (either of the following):
- 1.[3.6] − [4.5] > 1.9 and [4.5] < 13.4 mag; to remove background galaxies.
- 2.Manually identified as foreground or imaging artifact.
3.5. AGB Catalog Results
We have identified AGB candidates within the PHAT footprint using data from the HST and Spitzer. The results of our classification process are shown in Table 1. In total, we find 346,623 AGB candidates. With the Spitzer data, we add an additional 1976 AGB candidates based only on their Spitzer photometry. We have also cross-matched our AGB candidates with the clusters identified by Johnson et al. (2015). We have identified 1356 AGB candidates within the measured radii of M31 PHAT clusters. This number is slightly higher than those identified with similar color and magnitude cuts in Girardi et al. (2020). Given that the PHAT footprint covers around a third of M31's disk, we expect around 1 million AGB stars in M31's full disk. We find AGB candidates associated with 76 carbon-rich and 34 oxygen-rich AGB stars from SPLASH, and 1933 matches with red supergiant candidates identified in Ren et al. (2021); we expect these may be RSGs or massive AGB stars.
Table 1. M31 Source Statistics
| NAll | NO-rich | NC-rich | |
|---|---|---|---|
| Initial selection | 2,325,605 | 20,441 | 346 |
| AGB | 346,623 | 20,441 | 346 |
| x-AGB | 4802 | 284 | 45 |
| Cluster AGB | 1356 | 101 | 1 |
| Cluster x-AGB | 17 | 0 | 0 |
Note. The cuts used for the initial selection of the PHAT catalog (Initial selection) are discussed in Section 3.1. The oxygen-rich (O-rich) and carbon-rich (C-rich) classifications are from HST (Boyer et al. 2019) and are only for a small subset of the sample in small regions across the PHAT footprint. Also listed are results for extreme (x-)AGB stars (described later in Section 4.1). We expect additional cluster x-AGB stars to exist outside of the regions that were covered by PHAT.
Download table as: ASCIITypeset image
We have included the AGB candidates and their photometry in a catalog (Table 2), which also includes the previous chemical classifications, and cluster properties. The estimated foreground extinction toward M31 is E(B−V) = 0.062 (Schlegel et al. 1998), far less than the levels of differential extinction within M31's disk (Dalcanton et al. 2015). We have used foreground extinction-corrected photometry for matching source brightness in the medium-band HST and PHAT catalogs and for the AGB classification, but present the uncorrected photometry in Table 2. We find 539 AGB candidates (0.16%) within 1″ of stars with positive measured parallaxes from Gaia EDR3 (Gaia Collaboration et al. 2021). We expect some of these may be foreground M dwarfs as parallaxes in AGB stars are highly affected by their convective cells. We leave these stars in the catalog, but flag them as potential foreground contamination.
Table 2. The Photometry of the M31 AGB Sample
| Column No. | Column Name | Description |
|---|---|---|
| 1 | ID | ID for this catalog |
| 2 | R.A. | Position in degrees (J2000) |
| 3 | Decl. | Position in degrees (J2000) |
| 4 | Brick | PHAT Brick (1 − 23; Williams et al. 2014) |
| 5 | R | Deprojected radius from galaxy center (kpc) |
| 6 | Radius Z | Estimated [M/H] based on R (relation from Gregersen et al. 2015) |
| — Stars within clusters (Johnson et al. 2015) | ||
| 7 | Cluster ID | ID from cluster catalog |
| 8 | Cluster Z | Cluster [Fe/H] measured spectroscopically by Caldwell et al. (2011) |
| 9 | Cluster Log Age | Log age of cluster |
| 10 | Cluster Mass | Log mass of cluster |
| 11 | Cluster Radius | Cluster visible radius |
| 12 | Cluster Distance | Source distance to cluster center |
| — PHAT photometry (Dalcanton et al. 2012) | ||
| 13 | F275W | WFC3/UVIS magnitude |
| 14 | F336W | WFC3/UVIS magnitude |
| 15 | F475W | ACS/WFC magnitude |
| 16 | F814W | ACS/WFC magnitude |
| 17 | F110W | WFC3/IR magnitude |
| 18 | F160W | WFC3/IR magnitude |
| — Medium-band HST photometry for small regions (Boyer et al. 2019; our Figure 1) | ||
| 19 | F127M | WFC3/IR magnitude |
| 20 | F139M | WFC3/IR magnitude |
| 21 | F153M | WFC3/IR magnitude |
| — IRAC photometry (performed here following Boyer et al. 2015) | ||
| 22 | IRAC1 | IRAC [3.6] mag |
| 23 | IRAC2 | IRAC [4.5] mag |
| — Additional Spitzer photometry (Khan 2017) | ||
| 24 | IRAC3 | IRAC [5.8] mag |
| 25 | IRAC4 | IRAC [8.0] mag |
| 26 | MIPS24 | MIPS [24] mag |
| — Classifications for full PHAT footprint | ||
| 27 | AGB | Classified here as AGB candidate based on HST criteria |
| 28 | x-AGB | Classified here as dusty-AGB candidate based on Spitzer criteria |
| 29 | RHeB Candidate | Classified here as RHeB candidates |
| 30 | RSG Candidate | Classified as red supergiant candidate Ren et al. (2021) |
| — Classifications for small subset | ||
| 31 | Chem Type | AGB photometric chemical type for small regions from HST (Boyer et al. 2019, our Figure 1) |
| 32 | SPLASH Type | AGB spectroscopic chemical type for small subset from SPLASH (Hamren et al. 2015) |
| 33 | Gaia | Gaia foreground candidate |
Note. Positions are from the PHAT catalog (Williams et al. 2014), otherwise from the IRAC catalog, which is aligned to 2MASS astrometry (Cutri et al. 2003). Metallicites are inferred from cluster data (Cluster Z, compiled from the literature for globular clusters) or estimated (Radius Z) using the gradient measured by Gregersen et al. (2015). The method for determining cluster values depends on the optimal method for the age of the cluster (“Best” in Beerman 2015). Photometry and errors (included but not shown) are in Vega magnitudes. Chemical types were determined by Boyer et al. (2019) in 21 fields using the medium-band HST photometry (C, M) included in this catalog, or from the additional DEIMOS/Keck II optical spectra (C, M) from the SPLASH survey (Hamren et al. 2015). The full catalog also contains uncertainties for all the photometry and the sharp, round, and crowd parameters for the HST wide band photometry.
Only a portion of this table is shown here to demonstrate its form and content. A machine-readable version of the full table is available.
Download table as: DataTypeset image
Gregersen et al. (2015) found a metallicity gradient in M31 by fitting the red-giant branch (RGB) population in the PHAT catalog with sets of isochrones. The gradient is smooth excluding an asymmetric metallicity enhancement between 3 and 6 kpc related to M31's bar. In addition to the photometry, cluster properties, and classifications, Table 2 includes the deprojected radius (Rdeproj) for each source, as well as the estimated metallicity ([M/H]) based on this metallicity gradient. We calculate the deprojected radius as the on-sky distance from the galaxy center (00h42m44330, +41°16′07″.50), assuming a position angle of 38°, and inclination of 74° (Barmby et al. 2006), and using the relation [M/H] = − 0.02 × Rdeproj (kpc)+ 0.11.
3.5.1. AGB Completeness
Within our HST data, we are not significantly affected by crowding and completeness, as most of our sample is brighter than the TRGB. Figure 9 shows the F110W luminosity distribution of the photometric catalog and our various cuts at different deprojected radii from the center of M31. In the initial PHAT data, we can identify features like the TRGB around 19 mag, the early AGB bump at 22.5 mag, and the red clump around 24 mag; completeness begins to drop around 25 mag. Our final AGB catalog has isolated sources primarily above the TRGB in the F110W filter, or those reddened in the HST or Spitzer filters. The similarity of the chemically classified and AGB candidates samples gives us confidence that we are not missing fainter AGB stars in our HST data due to completeness issues. For our AGB stars classified using the Spitzer data, we may be more affected by crowding, especially near the galaxy center.
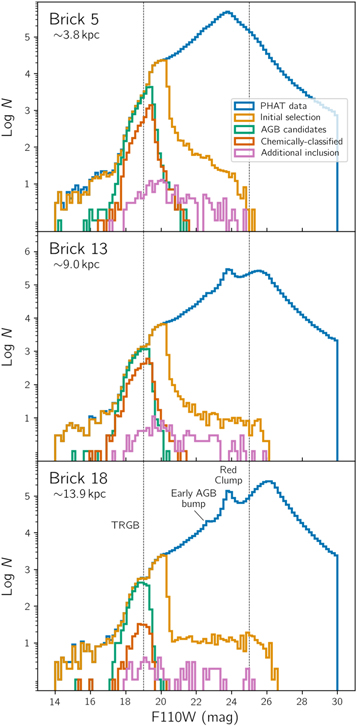
Figure 9. Luminosity functions showing the PHAT catalog, the initial selection of the PHAT catalog (discussed in Section 3.1), the AGB candidates, the chemically classified AGB candidates, and the AGB candidates classified by Spitzer (additional inclusion criteria) for three Brick regions of increasing distance from the galaxy center. For the chemically classified sources in smaller regions within the PHAT footprint, we use all sources ±1 kpc of the deprojected radius value listed below the Brick number in each panel. Also shown are the evolutionary features like the red clump and early AGB bump, and the TRGB (left dashed line). An additional dashed line at 25 mag is plotted for relative comparison.
Download figure:
Standard image High-resolution imageComparing our Spitzer IR data with that of the MCs, we can see the sensitivity limits of M31 AGB candidates more clearly. Figure 10 shows the Spitzer absolute magnitudes of the M31 sample. 10 The full M31 Spitzer catalog as well as our AGB candidates can be seen to deviate from a power law around [3.6] = 15.4 mag (M[3.6] ∼ −9 mag). The Spitzer photometry for the MCs are very near complete (Gordon et al. 2006; Meixner et al. 2006) and show a smooth bump in the luminosity function where the dustiest carbon-rich stars lie, and where we begin to lack completeness in our Spitzer photometry. The change in the shape of the luminosity function (at M[3.6] ∼ −10) is the result of our two-part photometric pipeline (see Section 2). We have fit the slope of the luminosity functions between −9 and −10 mag and extrapolated the function (dashed line) toward fainter magnitudes to estimate our completeness. We estimate a ∼90% completeness down to −8.84 and −9.12 mag for the [3.6] and [4.5] bands, respectively, which includes the majority of the dustiest AGB stars within the MCs (Riebel et al. 2010; Boyer et al. 2011). There is significant incompleteness down to M[3.6] = −6 mag; as a result, moderately dusty-AGB candidates classified with HST data may not have an associated Spitzer magnitude.
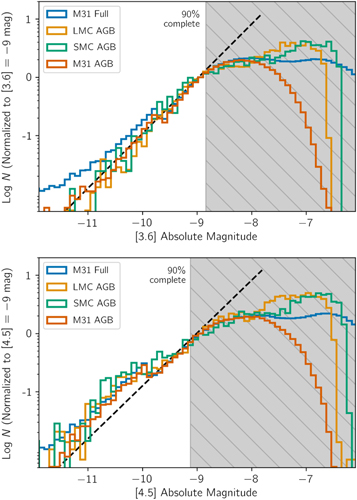
Figure 10. Luminosity functions showing the completeness of our AGB candidates in the IR. The full Spitzer IRAC [3.6] and [4.5] data for M31 (Barmby et al. 2006), the LMC (Meixner et al. 2006), and SMC (Gordon et al. 2011) are included for comparison. While the IR data in the MCs are nearly complete, the M31 IRAC data begin to lose sensitivity around −9 mag, shown in the flattening of the luminosity function. The slope of the fainter AGB sources (dashed line) has been used to estimate the completeness of the data (see Section 3.5.1).
Download figure:
Standard image High-resolution image3.5.2. CMDs
CMDs that include the AGB candidates, the chemically classified AGB candidates, and the x-AGB candidates are shown in Figure 11.
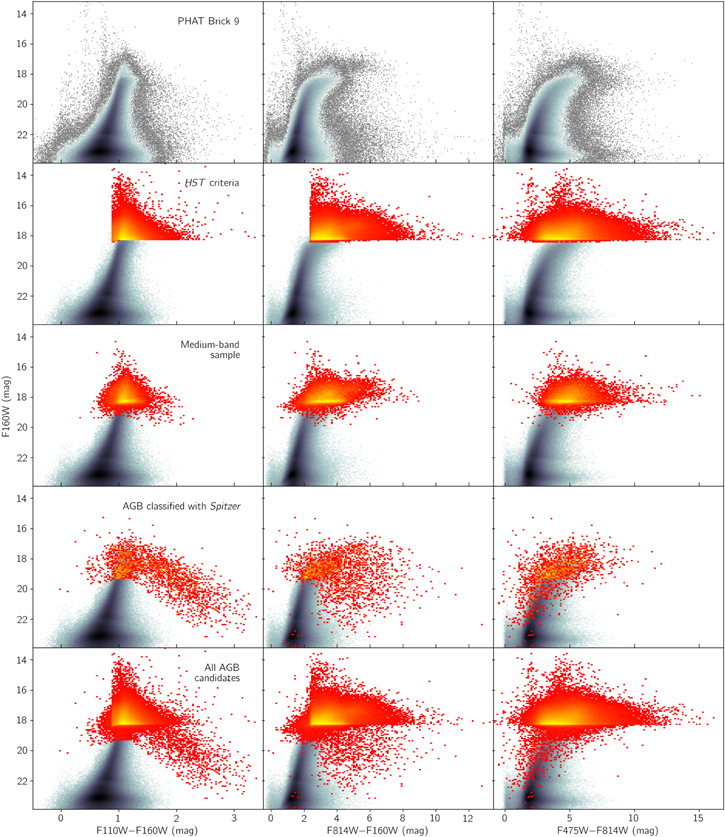
Figure 11. CMDs of all of the AGB candidates within the PHAT footprint meeting our various criteria. Shown are row 1: an example of the PHAT photometry in Brick 9; row 2: the AGB candidates classified with HST; row 3: the chemically classified subset from Boyer et al. (2019); row 4: the AGB candidates classified with Spitzer; row 5: all criteria combined. The most-yellow regions for each row starting from the HST criteria correspond to densities of around 12, 5, 2, and 12, respectively.
Download figure:
Standard image High-resolution imageFigure 12 shows the infrared CMDs of our AGB candidates, our AGB candidates recovered with Spitzer, and the cluster AGB candidates. Comparing the shapes of the CMDs to those in the MCs, we see no clear indication of separate features related to changes in chemistry. The cluster AGB candidates seem to span the same color–magnitude space as the full AGB sample, indicating that they are also representative of the full AGB sample. We see that our AGB candidates classified with Spitzer are highly reddened (falling to the right side of each panel), indicative of a high dust content. There is no noticeable change in the morphology of the CMDs with respect to deprojected radius except for sensitivity issues as a result of crowding.
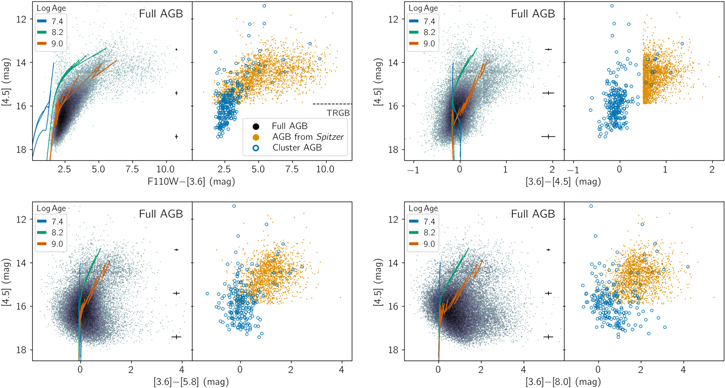
Figure 12. Spitzer infrared CMDs of the M31 AGB candidates (black), AGB candidates classified with Spitzer (orange), and cluster AGB candidates (blue). PARSEC isochrones (Marigo et al. 2017) are shown to indicate the end stage of evolution before the onset of AGB mass loss; also shown are error bars calculated using the average photometric uncertainty.
Download figure:
Standard image High-resolution image4. Catalog Properties
4.1. The x-AGB Stars
AGB stars reach a point at which their mass-loss rate exceeds the nuclear-consumption rate, known as the “superwind” phase (Renzini & Voli 1981). At this point, the timescale of evolution of the star is dictated by the mass-loss rate. Attempts to isolate stars in this short-lived phase led to the classification of extreme or x-AGB stars. While they represent a small fraction of the AGB populations (≲6%) in the MCs, they can account for up to 95% of the dust (Matsuura et al. 2009; Srinivasan et al. 2009; Boyer et al. 2012; Riebel et al. 2012). We have therefore attempted to isolate this population in M31 using the Spitzer IRAC color and magnitude cuts to study their properties separately. We will use these x-AGB candidates to estimate the global dust injection of the AGB sample. The x-AGB candidates are selected using the following criteria:
Extreme AGB candidates are as follows:
- 1.[3.6]–[4.5] > 0.25 and [4.5] < 16.4 mag.
This is a subclassification of our AGB candidate catalog, and is not a part of the AGB candidate criteria. It is similar, however, to the additional inclusion criteria listed previously ([3.6]–[4.5] > 0.5), which includes sources in our AGB catalog irrespective of the HST data.
The reason why we include AGB candidates with [4.5] <16.4 mag and [3.6]–[4.5] > 0.5 mag irrespective of their HST data, but do not for colors between 0.25 and 0.5 mag, is that we expect a high fraction of contamination from other dusty sources in this color range. If sources in this color range are also classified as AGB candidates based on the HST data, we include them in the x-AGB subset. Of the 4802 sources we classify as x-AGB stars, 2597 of these sources are included with the additional inclusion criteria.
We have identified 4802 x-AGB candidates in M31 using our IR photometry. Here we compare our sample with the AGB sample from the SAGE surveys in the MCs to study the differences in the sample properties and probe the limits of our data in isolating dusty-AGB stars. Within M31, the x-AGB population makes up 1.3% of the total AGB population. This is considerably lower than the values of 4.5% and 6% found in the LMC and SMC, respectively (Boyer et al. 2011; Riebel et al. 2012). We will examine several possible explanations for this low x-AGB fraction.
4.1.1. x-AGB Completeness
The low fraction of x-AGB stars in M31, compared to the MCs, may suggest a real trend with metallicity, but may also be related to sensitivity issues, differences in selection criteria, and the star formation history (SFH).
Sensitivity Issues. Our medium-band data suggests that we may be missing x-AGB stars due to completeness issues. In the near-IR (Figure 3), we see that the x-AGB candidates that were chemically classified by Boyer et al. (2019) scatter in the direction of increased dust and extinction. While this confirms our dusty classification using Spitzer, we lack sources that are so dusty that the dust significantly veils the water feature. With increasing dust, the veiling of the molecular features pushes these sources up and to the right of the color–color diagram in the direction of the extinction vectors. These stars follow the extinction vectors until the features are completely veiled and the molecular signature is lost. At this point, they return to the juncture of the carbon- and oxygen-rich stars, near the location of the dusty sample from the LMC (open squares). In the IR (Figure 13), we also do not see dusty sources like the carbon stars in the MCs with [3.6]−[4.5] > 2.75 mag and mass-loss rates ∼10−4 M⊙ yr−1 (Groenewegen & Sloan 2018). We expect M31 AGB stars to be producing predominantly oxygen-rich dust. While our sensitivity is only sufficient to have detected 22.4% of the dustiest carbon-rich AGB stars in the MCs, this number is 98.9% for the dustiest oxygen-rich AGB stars.
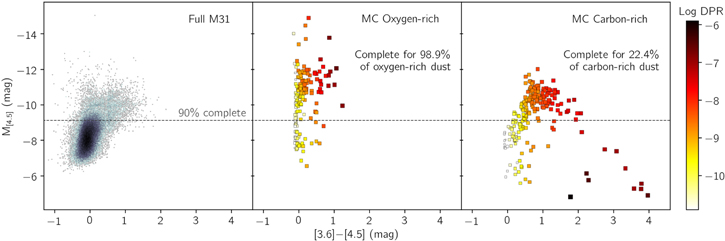
Figure 13. Spitzer CMDs showing our M31 AGB sample (left), along with the dustiest oxygen-rich (center), and carbon-rich (right) AGB stars found in the MCs (Groenewegen & Sloan 2018). The dust-production rates (DPRs) for the MC samples are shown in color (and size) and were measured using spectral energy distribution (SED) fitting. The threshold at which our Spitzer data are 90% complete (M[4.5] ∼ −9.12 mag) is shown with a dashed line, and the fraction of the dust injected by stars of that chemical subset above this limit is shown as a percentage.
Download figure:
Standard image High-resolution imageStar Formation History. A higher recent star formation would result in a higher fraction of massive dusty-AGB stars due to their shorter evolutionary timescales. Given that the LMC has had a higher relative intensity of recent star formation than M31 and the SMC, but lies in between them in terms of the x-AGB fraction, this is unlikely to explain M31's lower x-AGB fraction.
Selection Criteria. The x-AGB classification aims to select those stars producing the bulk of the AGB dust. The boundaries of this classification, however, are not based on changes in stellar structure or evolution, but are defined empirically. The x-AGB classification criteria in the MCs requires a [3.6] mag above the TRGB and J − [3.6] > 3.1 mag. To avoid misclassification as a result of mismatches between the HST and Spitzer data, our x-AGB classification is based entirely on the Spitzer data. Our slightly different TRGB requirement in the [4.5] filter and color cut in the mid-IR ([3.6] − [4.5] > 0.25 mag) may contribute to the lower x-AGB fraction in M31. The x-AGB fraction in six nearby dwarf galaxies was found to be between 2% and 6%, as opposed to our 1.3% x-AGB fraction, and these also used a Spitzer-only x-AGB criteria (Boyer et al.2017).
4.2. Cluster Statistics
Cluster AGB candidates were recently identified by Girardi et al. (2020). Here, we reidentify AGB candidates in clusters using our AGB classification criteria, which are slightly different from that used by Girardi et al. (2020). The cluster properties (age, mass, and metallicity; Johnson et al. 2015) of sources that lie within the estimated radii are listed in Table 2 and are shown in Figure 14. Metallicities were measured spectroscopically (Caldwell et al. 2011), and are primarily limited to the older, more luminous clusters.
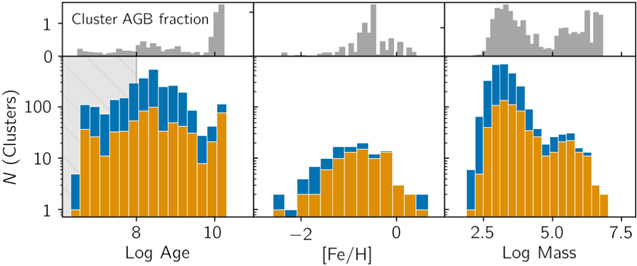
Figure 14. Histograms of the M31 clusters (blue) and their ages, masses, and metallicities, and the subset of those where we have detected AGB candidates (orange). Also shown are histograms of the fraction of individual sources within clusters, for different cluster properties. The age limit where cluster stars are not expected to have had enough time to evolve to the AGB phase is shown in the shaded region.
Download figure:
Standard image High-resolution imageWe identify 1356 cluster AGB candidates, including 96% (672/697) of the cluster AGB candidates identified in Girardi et al. (2020). Of our additional cluster AGB candidates, 74% (456/616) are located in Bricks 1 or 3 (ignored in Girardi et al. 2020), and the majority of the remainder meet our F160W magnitude criteria (F160W < 18.28 mag) but not that of the Girardi et al. (2020) catalog (F160W < 18.14 mag). A table showing the differences between our selection and that of Girardi et al. (2020) is shown in Appendix A, and the results are discussed in Section 3.3.1.
Girardi et al. (2020) showed that M31 cluster sources identified with the PHAT data are also modestly affected by crowding. The crowding parameter was calculated for each of the cluster sources in each filter, which calculates the amount of additional flux had nearby stars not been fit simultaneously during the photometry process. The crowding parameter in the near-IR filters was found to be overwhelmingly below 0.2 mag, indicating a small impact as a result of crowding.
With our chemically classified sample and by folding in the Spitzer photometry, we are also able to identify a handful of chemically classified candidates (N = 102) and x-AGB candidates (N = 17) within clusters. We show HST image cutouts of the x-AGB cluster candidates, as well as the source SEDs fit with radiative transfer models using the Dusty Evolved Star Kit (DESK; Goldman 2020) in Appendix B. These sources are likely biased toward larger fluxes in the IR as a result of the lower spatial resolution of the Spitzer data, and crowding near the cluster centers. Follow-up observations of these sources in the IR are needed to confirm that the IR excess is in fact associated with the AGB candidates.
A fraction of the cluster AGB candidates that we identify may in fact be foreground contamination or M31 field AGB stars. Girardi et al. (2020) presented an in-depth analysis of the M31 cluster AGB sample selected from PHAT. They show that, by extrapolating the field star density function down to the centers of the M31 clusters, around half of the potential AGB cluster members are likely spatially coincident field stars. They also argued that clusters with log age <8 should not host AGB stars, as their intermediate- and low-mass stars would still be in a previous evolutionary stage. Out of our 1356 cluster AGB candidates, 304 cluster sources are found coincident with these younger clusters. Additionally, while contamination from RSGs is expected to be low in our global AGB sample, the fraction of RSGs in young clusters is expected to be considerably higher.
While the M31 cluster sample shows much promise for calibrating stellar evolutionary models, a careful assessment of the candidates is required to identify true AGB cluster stars.
4.3. RHeB Stars
Within our AGB candidates, we likely have a small fraction of contamination from warmer giants and supergiants. Evolved stars fusing helium within their core (i.e., blue loop, and red supergiants) are often studied as a single population as they can be observationally indistinguishable. We have attempted to isolate these red-helium-burning (RHeB) stars using color and magnitude cuts in the optical. While we suspect that they may be in a different evolutionary phase, we include them in our AGB catalog as they are still expected to contribute to the dust budgets of galaxies.
To isolate the RHeB candidates, we have used cuts in magnitude and color space (Figure 15). We have determined these cuts visually, trying to isolate the warmer and more luminous stars. We use an optical CMD of PHAT Brick 18 to determine our cuts, as sources in the outskirts of the galaxy are less affected by crowding and completeness issues. In total we flag 2453 sources as potential RHeB candidates using the following criteria:
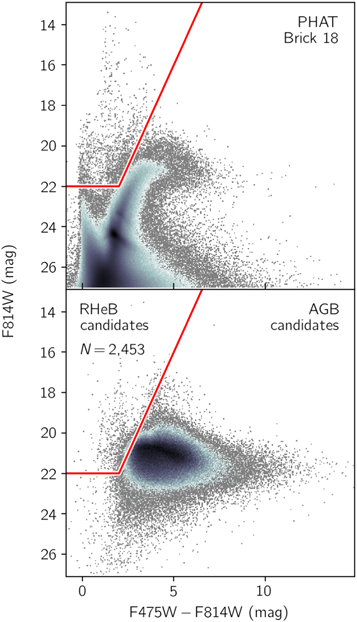
Figure 15. Optical CMDs showing the RHeB candidates and how they are selected. We used the PHAT photometry in Brick 18, where crowding is minimal, to refine our cut. These sources are flagged but included in our AGB catalog.
Download figure:
Standard image High-resolution imageRHeB candidate (both of the following):
- 1.F814W < 22 mag.
- 2.Above the line (F814W) = − 2 × (F475W − F814W) +26 mag.
Using a hand-picked and incomplete subset of 184 cluster RHeB/RSG stars in M31, 65 (35%) were included in the Girardi et al. (2020) AGB selection. Within our sample, this number drops to 14 (8%) as a result of our F814W–F160W color cut, 8 of which are flagged as RHeB candidates. This gives us confidence that we have reduced the contamination from these more massive stars.
Within the RHeB candidates are sources also classified in our other subclassifications. The RHeB sample includes 53 red supergiant candidates from Ren et al. (2021), 53 cluster AGB candidates, 88 chemically classified AGB candidates, and 90 AGB candidates included with Spitzer.
4.4. Carbon-star Luminosity Distribution
Within the small regions where AGB chemical types have been determined from medium-band HST imaging (Boyer et al. 2019), we can use our additional photometry, measurements, and classifications, to study the properties of metal-rich carbon stars in greater detail.
Current models disagree on the predicted mass limit for forming carbon stars. The ranges are expected to vary dramatically with metallicity with the largest uncertainties stemming from the unclear effect of metallicity on the efficiency of the HBB and TDU processes. Models suggest that the carbon star mass range can vary from 1.75–7 M⊙ in metal-poor environments (Z = 0.007), to 2–4.5 M⊙ at solar metallicity, and 3.25–4.0 M⊙ in metal-rich environments (Karakas 2014). Other metal-rich models predict a more-narrow carbon star mass range of 2.5–3.5 M⊙ (Ventura et al. 2020), and observations have suggested a lower and even more-narrow mass range. In the Milky Way, Marigo et al. (2020) discovered a kink in the CO white dwarf mass function attributed to a low mass boundary of carbon stars at 1.8–1.9 M⊙. We will use our more metal-rich chemically classified subsample to provide additional constraints on these critical chemical transitions.
We estimate the luminosity boundaries of the carbon-star mass function using the luminosity function of our carbon-rich AGB candidates. Previous attempts to compare the carbon-star luminosity functions across galaxies have been hampered by the use of different filters. Here, our IRAC photometry is directly comparable to the IRAC photometry for the MCs from the SAGE surveys. Using this data, we can finally make a direct empirical comparison.
The carbon-rich AGB candidates span a similar, yet more limited range in infrared magnitudes and colors (Figure 8). The luminosity function of the data shows a peak in the distribution around [3.6] ∼−9 mag, where the Spitzer data begin to lose sensitivity (Figure 16). The photometry are complete at brighter magnitudes, suggesting a real upper limit, slightly fainter that those of the MCs. The carbon star luminosity function also shows a sharp drop at M3.6 ∼ −8 mag. As our oxygen-rich stars (shown in blue) can be seen reaching magnitudes fainter that this lower limit, this suggests a real lower luminosity/mass limit unrelated to sensitivity issues. This also continues the trend of a more limited luminosity range with a decreasing average metallicity across the three galaxies. This more limited luminosity range of the M31 carbon stars (as opposed to the MCs) is consistent with the expectation and observational evidence of decreased TDU efficiency in more metal-rich environments.
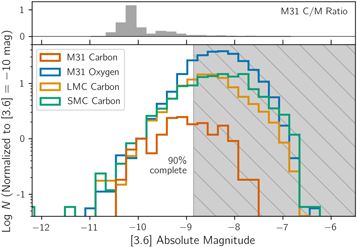
Figure 16. The distribution of IRAC [3.6] absolute magnitudes for the carbon-rich samples within M31 and the MCs (Boyer et al. 2011, 2019). Also shown is the luminosity function for the M31 oxygen-rich sample showing that our Spitzer data is able to detect oxygen-rich AGB candidates fainter than our faintest carbon stars.
Download figure:
Standard image High-resolution imageIn-falling dwarf galaxies and streams, and binary interactions (extrinsic carbon stars) are capable of producing metal-poor M31 carbon stars whose properties are not tied to TDU or these mass limits (Majewski et al. 2003; Huxor & Grebel 2015; Escala et al. 2021). Boyer et al. (2019) show, however, that the C/M ratio in M31 is lower than predictions based on other Local Group galaxies. Furthermore, they find a decrease in the C/M ratio from the disk to the bulge as expected for a metallicity gradient across the disk. They also find no evidence of spatial overdensities that would be associated with interloping carbon stars. This indicates that the M31 AGB population, including the carbon stars, is more metal-rich than those in the MCs.
4.5. Median SEDs
To better understand AGB stars in more metal-rich environment, we must study how energy at different wavelengths is transported through their atmosphere and circumstellar envelope. The SEDs of our AGB candidates peak in the mid-IR with different shapes for the carbon- and oxygen-rich candidates, due to the different molecular and dust species that they produce. Using our subsamples of AGB candidates, we have binned the SEDs of our oxygen-rich, carbon-rich, and x-AGB candidates by their IRAC [3.6] mag. We show these binned median SEDs as well as those classified in the MCs (Riebel et al. 2010; Boyer et al. 2011) in Figure 17.
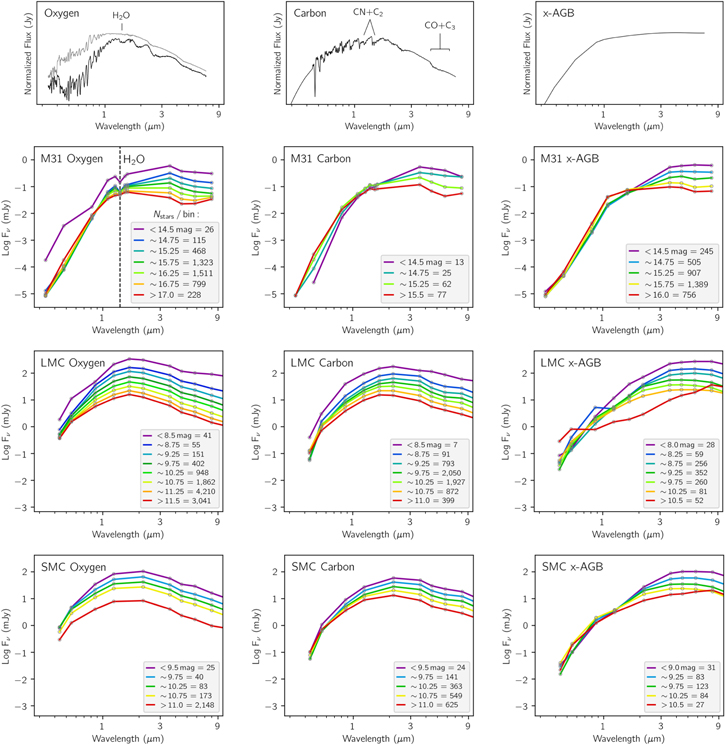
Figure 17. Median SEDs of the oxygen-rich, carbon-rich, and x-AGB candidates within the PHAT footprint of M31. We include only sources with IRAC 3.6 μm data and those outside of Brick 1, the region closest to the galaxy center. The data are binned by their absolute IRAC [3.6] magnitude, with a bin size of 0.5 mag, and the number of stars in each bin represented in corresponding color on the right of each figure. We have excluded the MIPS 24 μm mag due to the lower spatial resolution of the observations; we have also removed the medium-band HST data for the x-AGB median SED due to the low number of x-AGB sources with medium-band data. Example model spectra from the COMARCS (Aringer et al. 2009, 2016) code are shown at the top for reference, with two oxygen-rich models at 2600 K (black) and 3300 K (gray), as well as another carbon-rich model at 3400 K, all of which assume no dust. We also show a dusty model created using the DUSTY code (Elitzur & Ivezić 2001).
Download figure:
Standard image High-resolution image4.5.1. M31 Median SEDs
For our oxygen-rich AGB candidates, we can clearly see the water feature at 1.39 μm (labeled as H2O), increasing in absorption with increasing 3.6 μm flux. As far as we know, this is the first time that this has been seen photometrically. This is seen most dramatically in the most luminous oxygen-rich SEDs, which contain some foreground sources, and one possible background galaxy. As AGB stars evolve, their envelopes become more extended. This allows for cooler molecules like water to form in abundance. At the same time, material is levitated out to large radii through pulsations, where it cools and condenses into dust. Hydrostatic models have shown that with decreasing temperatures, as well as increasing mass, oxygen-rich evolved stars show stronger absorption of molecules like water, in the IR (Aringer et al. 2016). We suspect that the increase in the strength of the water feature and the increase at 3.6 μm is likely a reflection of these stars being more massive and having cooler, dustier envelopes. For our carbon-rich median spectral energy distribution (SED), we see evidence for the CO + C3 feature around 4–8 μm in our fainter bins. These features are from photospheric molecular transitions and have been detected spectroscopically in nearby carbon stars (Jørgensen et al. 2000; Zijlstra et al. 2006). In our more luminous bins, the SED shapes start to resemble the x-AGB median SEDs, which may indicate that these are dusty carbon stars.
We expect M31's x-AGB population to be dominated by oxygen-rich chemistry, unlike in the more metal-poor MCs, which are carbon-rich; we expect this for two reasons. First, the decreased efficiency of TDU events at a high metallicity shrinks the mass range over which TP-AGB stars produce carbon-rich atmospheres, and consequently the size of the carbon star population (Karakas 2010; Marigo et al. 2017). Second, oxygen-rich dust formation is expected to rely on the initial metal content to act as seed nuclei (unlike carbon stars), and we expect a high natal abundance of oxygen in metal-rich environments. As a result, we expect oxygen-rich dust to form more easily and in larger quantities in M31 as it is metal-rich. With that expectation, the fact that the x-AGB SEDs closely resemble the most-luminous carbon-rich SEDs may suggest a bias in the empirically determined x-AGB classification scheme.
4.5.2. Median SED Differences in M31 and the MCs
A key difference that we see between the median SEDs in M31 and the MCs is that the M31 IR fluxes are generally higher. This is likely related to our bias against fainter stars in the IR, below our detection threshold. It may also be affected by the lower spatial resolution with increasing wavelength, or the limited calibration of the longer-wavelength data from Khan (2017).
Comparing the carbon-rich AGB candidates in M31 with those of the MCs, we see that, in M31, the CO + C3 feature seems to increase in strength toward lower luminosity. We also see the CO + C3 feature in fainter bins. This may reflect the cleaner separation of chemical types using HST medium-band filters, as opposed to J and KS in the MCs. It is unlikely that this broad feature is related to differences in our GSC and longer-wavelength catalog from Khan (2017), as the feature is also seen in our [4.5] GSC data.
4.6. AGB Spatial Distribution
The ages, metallicities, and stellar density of stars across M31 have been well characterized by PHAT. We can leverage this information to interpret the spatial distribution of AGB stars and their subtype and luminosity classes. M31 hosts a metal-rich bulge with a decrease in density and metallicity with the radius (Dalcanton et al. 2012; Gregersen et al. 2015). Three ring features are visible within the PHAT footprint. Two faint rings at 5 and 15 kpc, and a more clear ring at 10 kpc. Star formation has been shown to vary across the disk with the most clear variation in the star forming in the 10 kpc ring, where star formation has been ongoing for 500 Myr (Lewis et al. 2015). Most of the star formation, however, occurred prior to 8 Gyr (Williams et al. 2017). We will look at the spatial distribution of the AGB candidates to determine if they show a similar picture as these studies of the galaxy’s star formation.
In Figure 1, the AGB sample in the PHAT footprint shows a concentration toward M31's bulge, and a smooth drop-off in the spatial distribution toward the outer disk. The edge of the 10 kpc ring is visible within the AGB sample indicating less star formation in the outer disk. There is also a higher density of sources in the regions previously observed by Boyer et al. (2019) due to differences in the selection criteria; this difference is discussed further in Section 3.3.1 and Appendix A.
In Figure 18, we compare the full AGB sample distribution to subsets of different IR brightness. The most luminous AGB candidates in the IR seem to follow the shape of the 10 kpc ring. This is where star formation has been occurring relatively recently, and where the SFH is consistent with the presence of massive AGB stars and RSGs. The global fraction of RSGs in M31 is expected to be much lower than that of AGB stars. As a result, we generally expect little contamination from RSG stars, but may have some in our most luminous bins. This distribution also indicates that these sources are unlikely to be foreground stars as those would follow a more uniform distribution. Moving to the fainter spatial distributions, we see a gradual increase in the smoothness of the distribution. This seems to be illustrating the migration of stars from their formation sites primarily within the 10 kpc ring, with the youngest AGB stars still near the 10 kpc ring, and the oldest AGB stars fully dispersed throughout the disk. We can also look at the spatial distribution of the x-AGB sample to better understand where these stars are producing dust.
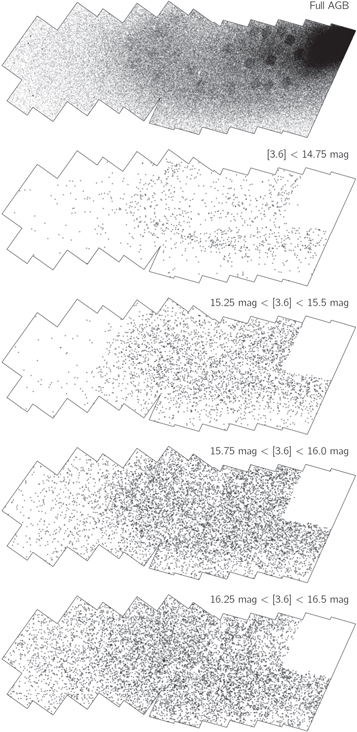
Figure 18. The spatial distribution of the full AGB candidates and distributions of AGB candidate subsets of differing IR magnitude; we omit sources within Bricks 1 and 3, which are significantly affected by crowding. Our most luminous sources are primarily located near the 10 kpc ring, a region of recent star formation. Sources classified in Boyer et al. (2019), which have additional medium-band HST photometry, are included in the AGB catalog. As a result, a higher density of AGB candidates can be seen in these regions in the first panel, shown with white squares in Figure 1.
Download figure:
Standard image High-resolution imageThe spatial distribution of the x-AGB candidates shows a clear enhancement at 10 kpc. However, while our x-AGB sample is biased toward brighter IR fluxes, we see an abundance of sources at r < 10 kpc (Figure 19). This indicates that the dust production is not limited to a subset of stellar masses (e.g., massive AGB stars) and points to a relatively smooth injection of AGB dust within the interior of the 10 kpc ring. The inclination of M31's disk may lead to an increase in the internal interstellar extinction for sources in the lower half of our spatial distribution, or near side of the galaxy. As a result, we may expect more reddened sources in the lower half of Figure 19. While there may be a hint of this, it remains unclear if the x-AGB distribution is affected by the galaxy’s inclination.
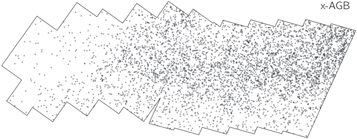
Figure 19. The spatial distribution of sources classified as x-AGB stars.
Download figure:
Standard image High-resolution image4.6.1. Probing Age with AGB Stars
Comparing the spatial distribution of M31's AGB sample with its younger populations allows us to better understand the galaxy’s features, SFH, and evolution. We will compare the AGB sample to a subset of M31's RGB stars to further probe the effect of age on the spatial distribution of these samples.
Previously, Dalcanton et al. (2012) found an overdensity of RGB stars affiliated with the 10 kpc ring, suggesting it is a longer-lived feature. Maps of M31's SFH show the 10 kpc ring is also broader for older populations (Lewis et al. 2015), suggesting a scenario in which stars form within molecular clouds, the natal clouds disperse, and most stars diffuse from loose associations into the surrounding environment (Harris & Zaritsky 1999; Bastian et al. 2009). This scenario is consistent with the binned spatial distributions of our AGB sample shown in Figure 18. Given these results, and measurements of the SFH, we expect the RGB spatial distribution to be similarly dispersed as our faintest/oldest AGB candidates.
We have defined the RGB population using a F110W–F160W color between 0.5 and 1.2 mag, and reaching one magnitude below the TRGB in either of these filters. We also remove RGB stars in Bricks 1 and 3. While not a complete sample of the RGB stars within each region, we use the samples for a relative age comparison, and avoid completeness issues by restricting the magnitudes of the RGB sample (N ∼ 1,058,694) to well above the completeness limits in PHAT. While this ratio has not been calibrated on an absolute scale, it provides us with a relative age probe.
We have used the ratio of AGB stars to RGB stars in spatial bins as a diagnostic for changes in the ages of populations (Figure 20); a similar analysis has been done in smaller regions in M31 (Hamren et al. 2015; Boyer et al. 2019). We have mapped the AGB-to-RGB ratio by spatially binning the populations in 50 bins within the PHAT footprint. Comparing this map with the M31 dust maps by Utomo et al. (2019), we see that the AGB enhancement traces the dustiest regions within the 10 kpc ring. In this view, we also see the magnitude of the full AGB sample’s enhancement at 10 kpc in relation to the fall off in density of the RGB sample toward larger radii.
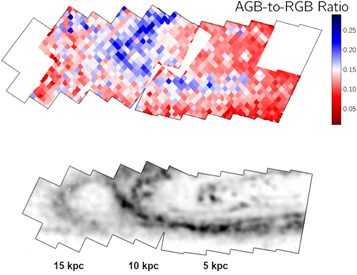
Figure 20. Top: a map of the ratio of AGB-to-RGB stars in the PHAT footprint. The red areas represent older regions dominated by RGB stars, where more massive stars have already evolved through the AGB phase. The ratio of AGB-to-RGB stars beyond the 10 kpc ring is noisier due to low source density. We have excluded Bricks 1 and 3 due to confusion, Bricks 22 and 23 due to lower source counts, and the overlapping Brick regions due to miscounted/duplicated RGB stars. Bottom: an example dust map within the PHAT-footprint region created using the dust maps by Utomo et al. (2019), shown here to illustrate the locations of the star-forming rings.
Download figure:
Standard image High-resolution imageWe have also looked at the radial distribution of the x-AGB sample to better understand where dust is being produced. Figure 21 shows the ratio of x-AGB to RGB stars with respect to the deprojected radius. The distribution of this ratio is similar to that of the full AGB sample and RGB sample, with a clear enhancement centered around 12 kpc. While we see a consistent fraction of x-AGB candidates in the interior of the ring, the peak at the slightly larger radii may suggest a small general outward migration from the 10 kpc ring.
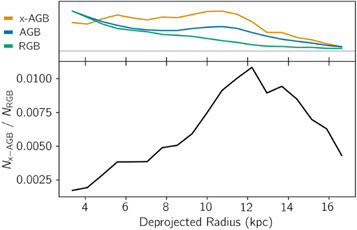
Figure 21. The ratio of x-AGB stars to RGB stars shown in Figure 20 with respect to deprojected radius. The normalized RGB, AGB, and x-AGB sample distributions are shown above in color. The x-AGB fraction peaks around 12 kpc, near the location of recent star formation within the 10 kpc ring.
Download figure:
Standard image High-resolution imageIn order to use stellar samples to probe M31, we have to consider the completeness issues associated with the RGB, AGB, and x-AGB samples and the selection criteria used. We expect that the Spitzer data, and likewise the x-AGB sample, is more severely crowding-limited near the galaxy center. We also expect that, as the RGB sample was selected using HST photometry, and the x-AGB sample was selected using the Spitzer photometry, we may be missing some of the RGB sample obscured by dust within M31's 10 kpc ring. The fact that we see a lower x-AGB fraction at larger radii where both issues of completeness are mitigated, however, may suggest a real x-AGB overdensity associated with the exterior side of the 10 kpc ring.
5. AGB Dust Production
5.1. Color–DPR Relations
To determine the level of dust injection by the M31 AGB sample, we fit and apply color–dust-production-rate relations using data from the more-complete SAGE sample. We have used the dustiest (log DPR > − 10 M⊙ yr−1) carbon- and oxygen-rich LMC AGB stars from Groenewegen & Sloan (2018) and fitted these samples separately. We fitted their [3.6]–[4.5] colors and dust-production rates (DPRs) 11 with quadratic functions of the form ax2 + bx + c; we show the best-fit results for the oxygen-rich sample (a = − 0.310, b = 2.634, c = − 9.335) and carbon-rich sample (a = −0.407, b = 2.396, c = −10.256) in Figure 22. Using these relations and assuming that all stars belong to a single spectral type (carbon- or oxygen-rich), we estimate the total AGB dust injection for all of the AGB candidates in the PHAT footprint with data in the [3.6] and [4.5] filters and not in Bricks 1 or 3; we measure the total DPR in the PHAT footprint as 1.19 × 10⁻⁵ M⊙ yr−1 and 2.13 × 10⁻⁴ M⊙ yr−1, for the carbon- and oxygen-rich relations, respectively.
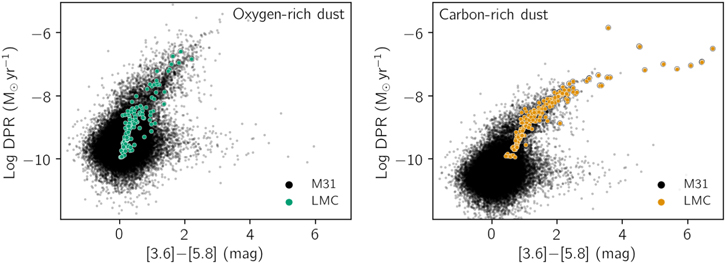
Figure 22. Preliminary DPRs for the M31 AGB candidates assuming oxygen- (left) and carbon-rich chemistry (right). The DPRs are estimated by fitting a quadratic to the [3.6]–[4.5] color vs. Log DPR data of the dustiest AGB stars from the SAGE-LMC and SAGE-SMC samples (Groenewegen & Sloan 2018), and applying the relation to our sample. We apply the color–mass-loss relations to all M31 AGB candidates with IRAC 3.6 and 4.5 μm data for the oxygen-rich and carbon-rich case.
Download figure:
Standard image High-resolution imageWe expect the M31 AGB population to be producing both carbon- and oxygen-rich dust. The fraction of either type, however, is unclear. We can estimate the chemical composition of the AGB dust being produced in M31 by using our subset of medium-band data where we have chemically classified x-AGB candidates. While our chemically classified x-AGB sample (N = 329) is 86% oxygen-rich, applying our color relations to the corresponding chemically classified x-AGB samples yields 97.8% of the dust as oxygen-rich. This is in stark contrast to the LMC where the x-AGB sample is composed of 3% oxygen-rich stars, which produce 13% of the x-AGB dust (Riebel et al. 2012).
Compared to the MCs (Riebel et al. 2012; Srinivasan et al. 2016), we expect more oxygen-rich dust production from M31 AGB stars, as a result of their more metal-rich environment. With M31's more-narrow carbon-star mass range, we also expect more dusty oxygen-rich AGB stars of moderate mass. These are likely contributing to the increase in the fraction of oxygen-rich dust. As a side-note, this also has the effect of a lower average mass (and mass-loss rate) for oxygen-rich x-AGB stars in M31. To truly understand the oxygen-rich fraction of the dust, however, we need to have the sensitivity to detect any highly obscured and dusty carbon star below the detection threshold of our IR observations (see Section 4.1).
5.2. Dust-injection Rate
The total dust mass in M31 has been measured by modeling both its extinction and emission (see Table 3). More recently, Draine et al. (2014) estimated the total dust in M31 using the Spitzer/IRAC data to be 5.4 × 10⁷ M⊙. Dalcanton et al. (2015), however, found that the dust models used in this work overpredict the extinction by a factor of ∼2.5, which suggests that the true dust mass is slightly lower. We can compare these measurements to DPRs of the AGB population to assess the impact of the AGB stars on the dust budget of M31.
Table 3. Previous Measurements of M31's Dust Mass and AGB-dust-injection Fractions Calculated for the MCs and Now M31
| M31 Dust Mass (107 M⊙) | ||
|---|---|---|
| Haas et al. (1998) | 3.8 | |
| Schmidtobreick et al. (2000) | 1.3 | |
| Montalto et al. (2009) | 7.6 | |
| Draine et al. (2014) | 5.4 | |
| Dalcanton et al. (2015) | 5.4 ÷ 2.5 (2.2) | |
| AGB-dust-injection Fraction | ||
| Matsuura et al. (2009) | LMC | ∼1.6% |
| Boyer et al. (2012) | SMC | ∼2.1% |
| Gordon et al. (2014) | LMC/SMC | ×10 (∼20%) |
| Srinivasan et al. (2016) | SMC | ×2 (∼40%) |
| Nanni et al. (2018) | SMC | ×5 (∼100%) |
| This work | M31 | 0.9%–35.5% |
Note. Dust-injection fractions are highly uncertain. This uncertainty stems primarily from the poorly constrained dust grain lifetimes. These estimates also make assumptions for expansion velocities, drift velocities, gas-to-dust ratios, geometry, and optical constants. Additionally, in smaller dwarf galaxies like the SMC, only a handful of stars can dominate the dust injection, with the possibility of incomplete sampling resulting in dramatically different results.
Download table as: ASCIITypeset image
Previous analyses of the SEDs of evolved stars in the MCs have estimated the fraction of dust created by AGB stars (Table 3). These methods, however, differ, from color–mass-loss relations (Matsuura et al. 2009), to infrared excess–mass-loss relations (Boyer et al. 2012), and DPRs calculated using SED-fitting (Riebel et al. 2012; Srinivasan et al. 2016). Additionally there are differences in the assumed properties of the circumstellar envelope and the life-cycle of dust.
We can use our AGB candidates to estimate the impact of their dust injection in M31. We are limited to around one-third of M31's disk and may be biased against the dustiest carbon stars. That being said, we have the sensitivity to detect the bulk of the oxygen-rich dust producers, expected to dominate the AGB dust injection. Scaling our PHAT DPR by the relative size of M31's full disk (∼3), we get a global DPR = 6.39 × 10⁻⁴ M⊙ yr−1. To estimate the fraction of M31's ISM dust produced by AGB stars, we must consider the lifetimes of dust grains within the ISM.
5.3. Dust Budget
Jones & Nuth (2011) have argued that the current estimates of global lifetimes of dust grains in the ISM are likely too uncertain to provide useful constraints. We have, however, provided estimates for the fraction of dust with a circumstellar origin using several scenarios for dust lifetimes. We assume a DPR that has been constant since the formation of the oldest stars within M31 (12 Gyr; Williams et al. 2017). We also assume a current dust budget of 2.16 × 10⁷ M⊙, 2.5 times lower than the value measured by Draine et al. (2014), in accordance with the findings of Dalcanton et al. (2012).
- 1.Assuming no dust destruction, the AGB population is capable of producing 35.5% (7.67 × 10⁶ M⊙) of the measured dust in M31.
- 2.
Oxygen-rich silicates are expected to live longer in the ISM than carbon-rich dust species (e.g., graphite). Grain-grain collisions are also expected to shatter larger dust grains creating smaller fragments, which could be preserved as cores capable of regrowing mantles in the ISM. The lifetimes of the cores, however, are only expected to be 3–4 times longer than the unfragmented grains (Jones et al. 1994). For our second dust lifetime scenario, this extends the upper limit to ∼3% for any AGB dust, or the remnants of AGB dust acting as a core of the dust grains.
Pre-solar dust grains have shown a nonnegligible fraction of dust with circumstellar signatures from multiple stars (Gail et al. 2009). Whether M31 dust grains are capable of retaining any characteristics of their circumstelllar origin remains unclear. In order to make more realistic estimates of the dust budget, we need a more sensitive survey of the galaxy in the mid-IR. More work on the dust-destruction rate is also needed to constrain the life-cycle of dust and estimate the fraction of dust from AGB stars.
6. Conclusions
We have completed the first comprehensive census of the AGB population in a metal-rich galaxy, and used the results to estimate the contribution of AGB stars to the dust budget of M31.
- 1.Using near-IR data from the PHAT survey, we have identified 346,623 AGB candidates across one-third of M31's disk. These results were then combined with mid-IR data from Spitzer to isolate 4802 AGB stars expected to be producing the bulk of the AGB dust in M31. Using clusters identified in M31, we identified 1356 AGB candidates within clusters, some of which have measured cluster ages and metallicities.
- 2.We match our data to AGB stars previously chemically classified (carbon or oxygen), and compare them to the more-complete samples in the MCs. The M31 AGB sample is shown to be dominated by oxygen-rich AGB stars. In the small footprints where we have chemical classifications, we find that 97.8% of the dust being produced by the largest dust producers is oxygen-rich.
- 3.Increasingly luminous and dusty AGB stars are found more frequently associated with the 10 kpc ring, a site of recent star formation. For the older AGB candidates faint in the IR, we see a uniform distribution across the PHAT footprint, consistent with a scenario of increased mixing with age.
- 4.We have used a color–dust-production-rate relation based on the oxygen-rich x-AGB sample from the LMC to estimate the M31 AGB dust injection. Using different scenarios for the dust lifetimes, we estimate that AGB stars account for 0.9%–35.5% of M31's global dust budget. More constraints on dust grain lifetimes are needed to provide more realistic estimates of the dust budget.
We thank the anonymous referee for their helpful and constructive comments. We would like to thank Cliff Johnson for the helpful discussions about the cluster sources. We would like to thank Grace Telford for the help with calculating integrated fluxes (that, ultimately, were not used). This work was supported by NASA via Astrophysics Data Analysis award 80NSSC19K0529. L.G. acknowledges support from the ERC Consolidator Grant funding scheme (project STARKEY, G.A. n. 615604). S.S. acknowledges support from UNAM-PAPIIT Programme IA104820. This research is based on archival data obtained with the NASA/ESA Hubble Space Telescope obtained from the Space Telescope Science Institute, which is operated by the Association of Universities for Research in Astronomy, Inc., under NASA contract NAS 526555. This work is based in part on archival data obtained with the Spitzer Space Telescope, which was operated by the Jet Propulsion Laboratory, California Institute of Technology under a contract with NASA. Some of the data presented in this paper were obtained from the Mikulski Archive for Space Telescopes (MAST) at the Space Telescope Science Institute. The specific observations analyzed can be accessed via 10.17909/t9-eahb-c508.
Facilities: HST - Hubble Space Telescope satellite, Spitzer - .
Software: DESK (Goldman 2020), DOLPHOT (Dolphin 2000), Astropy (Astropy Collaboration et al. 2013, 2018), Matplotlib (Hunter 2007), Scipy (Virtanen et al. 2020), Numpy (van der Walt et al. 2011; Harris et al. 2020) IPython (Perez & Granger 2007).
Appendix A: AGB Criteria Comparison
Here, we compare our AGB selection criteria with two recent AGB catalogs in the PHAT footprint. Boyer et al. (2019) surveyed 20 small footprints (Figure 1), and Girardi et al. (2020) classified AGB stars in PHAT clusters. Here, we classify stars across the entire PHAT footprint using both the HST data and Spitzer data. Table 4 summarizes the classification criteria for each of these surveys. Some of photometry are required to meet the sharpness and crowding criteria (GST), outlined in Section 2. Our classification criteria recovers 73% of the Girardi et al. (2020) cluster AGB sample, and 75% of the Boyer et al. (2019) chemically classified AGB sample. Of the Girardi et al. (2020) AGB candidates not recovered, most did not meet our F814W–F160W color requirement. This criteria was added to mitigate contamination from bluer stars (supergiants, foreground stars, etc). For the Boyer et al. (2019) AGB candidates that we did not recover, most did not meet our magnitude criteria. The Boyer et al. (2019) classification criteria required photometry above the TRGB in any of the five near-IR bands, as opposed to our two near-IR bands. This resulted in more of that sample falling below the TRGB in F110W and F160W, and being missed in our classification.
Table 4. The Cuts Used for Classifying AGB Stars in Boyer et al. (2019), Girardi et al. (2020), and This Work
| Requirements | Boyer+19 | Girardi+20 | This Work |
|---|---|---|---|
| F127M < 18.80 mag | |||
| F139M < 18.66 mag | F110W < 19.28 mag | ||
| Magnitude | F153M < 18.27 mag | F160W < 18.14 mag | or |
| F110M < 19.28 mag | F160W < 18.28 mag | ||
| F160M < 18.28 mag | |||
| (any) | |||
| F127M − F139M < 0.3 mag | F110W − F160W > 0.88 mag a | ||
| Color | and | F110W − F160W > 0.88 mag | and |
| F139M − F153M < 0.3 mag | F814W − F160W > 2.4 mag a | ||
| GST | All five filters | F110W and F160W | |
| [3.6]−[4.5] > 0.5 mag | |||
| Additional inclusion criteria | ⋯ | ⋯ | and |
| [4.5] < 16.4 mag | |||
| (or inclusion in Boyer+19) | |||
| [3.6]−[4.5] > 1.9 mag | |||
| Galaxy removal | ⋯ | ⋯ | and |
| [4.5] < 13.4 mag | |||
| F127M − F153M < 0 mag | [3.6]−[4.5] > 0.25 mag | ||
| Dusty classification | and | ⋯ | and |
| 18 mag < F153M < 20 mag | [4.5] < 16.4 mag | ||
Note. The GST criteria for HST and Spitzer is further explained in Williams et al. (2014) and Section 2.1.2, respectively. The IRAC photometric catalog only includes sources that meet the GST criteria. For sources classified only in the IR, the [3.6] and [4.5] filters would also be included in the GST requirements. We additionally removed any sources deemed duplicates or image artifacts.
a If there are data in both filters.Download table as: ASCIITypeset image
Appendix B: Cluster AGB Candidates with Additional Classifications
We have identified 17 x-AGB candidates that reside within the expected radius of clusters with measured properties (Johnson et al. 2015). These clusters give us pockets of sources with uniform metallicities and ages, quantities that are difficult to measure in individual stars. Studying these sources will allow us to isolate the effects of initial mass and metallicity on the dust production and evolution of AGB stars, critical for constraining stellar and chemical evolutionary models. Some of our x-AGB cluster sources (7/17; Table 5) have cluster ages likely too young to host AGB stars (Log Age [yr] < 8.0). This likely indicates that they are red supergiants, or field AGB candidates not associated with the cluster.
Table 5. The Cluster x-AGB Candidates, the Cluster Ages, and the Spitzer IRAC [3.6]−[4.5] Color, Indicative of Strong Dust Production
| ID | Log Age | [3.6]–[4.5] |
|---|---|---|
| (yr) | (mag) | |
| 1474474 | 6.69 | 0.27 |
| 1671652 | 7.30 | 1.11 |
| 1691755 | 7.80 | 0.39 |
| 1740537 | 10.14 | 0.41 |
| 1765755 | 8.50 | 0.77 |
| 1776677 | 9.19 | 0.70 |
| 1958200 | 10.12 | 0.60 |
| 1998948 | 6.90 | 0.76 |
| 2013089 | 6.80 | 0.58 |
| 2070778 | 9.11 | 0.28 |
| 2088165 | 8.50 | 0.70 |
| 2165440 | 7.77 | 0.75 |
| 2200851 | 8.39 | 1.35 |
| 2227653 | 8.80 | 0.57 |
| 2259397 | 8.19 | 0.35 |
| 2325716 | 8.43 | 0.68 |
| 2325752 | 6.69 | 0.82 |
Note. Several of our x-AGB candidates lie in clusters that are expected to be too young (Log age < 8.0) to host AGB stars (shown in gray). These are likely M31 field AGB stars, supergiants, or foreground stars.
Download table as: ASCIITypeset image
Figure 23 shows HST F160W image cutouts of the M31 clusters where we have identified x-AGB candidates. Also shown are the SEDs of these x-AGB candidates fit with radiative transfer models. The dimensions of the cut out images are four times the apparent cluster radius (e.g., AP 552: 14″.2 × 14″.2). We fit the SEDs with the DESK (Goldman 2020) using a grid of oxygen-rich radiative transfer models assuming dust grains from Ossenkopf et al. (1992) and a distance of 776 kpc. The HST and Spitzer data were taken at different times, and assumed variability of these sources is likely to affect the observed shape of the SED. Crowding in the well-populated clusters may also affect the IR fluxes. For all but two of the sources (shown in Figure 24), the models fit the data well. The well-fit sources have luminosities generally ∼10,000 L⊙ and gas mass-loss rates ∼7 × 10⁻⁶ M⊙ yr−1.
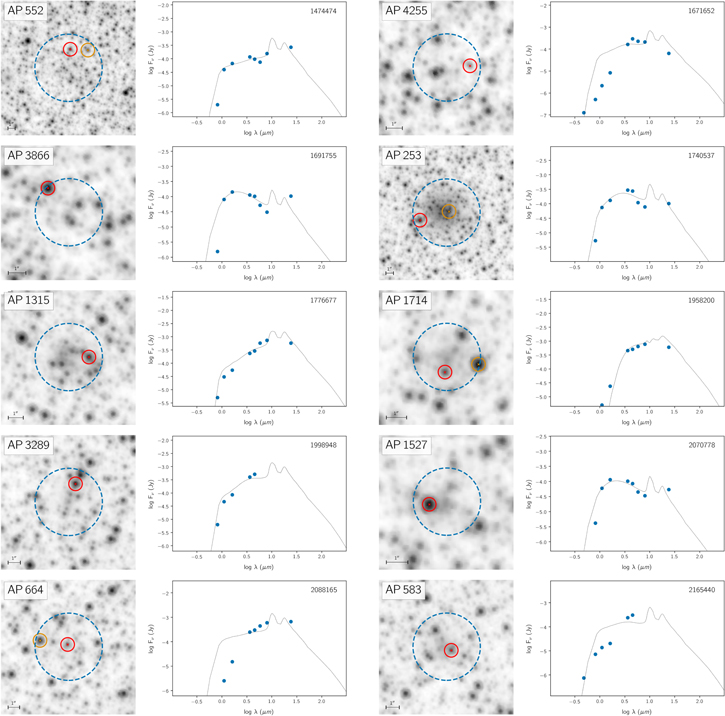
Download figure:
Standard image High-resolution image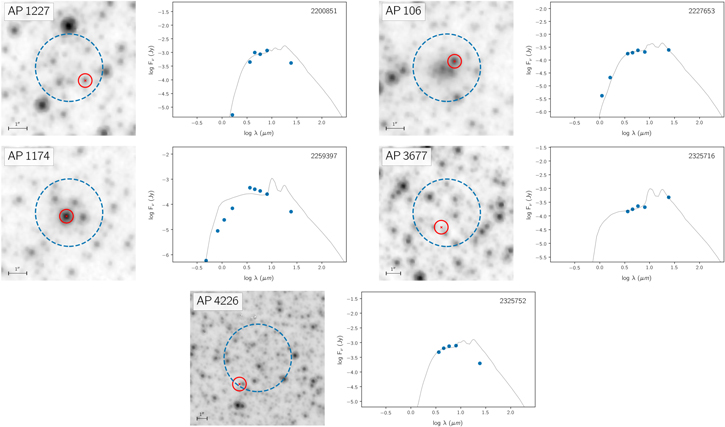
Figure 23. M31 clusters identified by Johnson et al. (2015) where we have also identified x-AGB candidates (red circles). On the left of each panel is an HST F110W image cutout with dimensions of four times the cluster apparent radius (APRAD; dashed blue circle). Additional AGB candidates that we have identified in these clusters are shown with orange circles. The right panel shows the SEDs of the dusty cluster sources (in red on the left) fit with a grid of oxygen-rich radiative transfer models using the Dusty Evolved Star Kit (Desk; Goldman 2020).
Download figure:
Standard image High-resolution image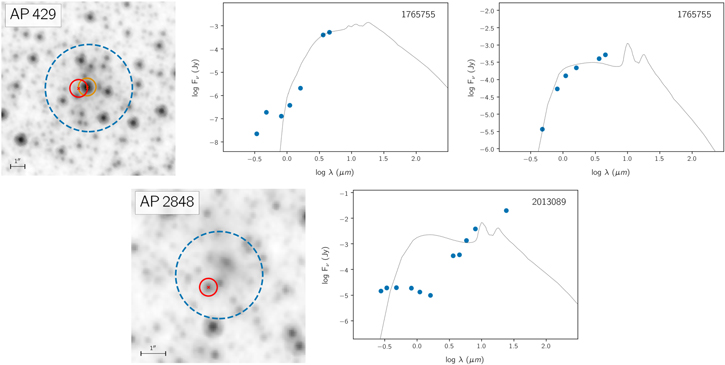
Figure 24. Same as Figure 23, but showing the mismatched cluster x-AGB candidate 1765755 (top) and a non-AGB source that we have incorrectly classified (bottom).
Download figure:
Standard image High-resolution image1740537. This is the only cluster x-AGB candidate for which we have a measured metallicity for the cluster ([Fe/H] = −1.5).
1765755. The automatic matching resulted in what appears to be a mismatch, but if we instead match the Spitzer photometry to the brightest near-IR HST cluster source (only 0″.5 away), the resulting shape of the SED is more consistent with an AGB star (center and right of the top row of Figure 25).
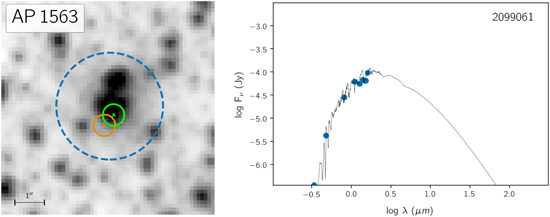
Figure 25. Same as Figure 23, but showing our carbon-rich cluster AGB candidate (green circle). The SED was fit with the carbon-rich J1000-LMC dust-growth radiative-transfer-model grid from Nanni et al. (2019) using the Desk and are shown with assumed distances of 776 kpc. The age of the cluster (Log Age [yr] = 6.9) is likely too young to host an AGB star, and is likely a spatially coincident carbon-rich field AGB star.
Download figure:
Standard image High-resolution image2013089. This source does not have a SED consistent with an AGB star. It may instead be a dusty young stellar object, a background galaxy, or spatially coincident sources superimposed.
2099061. This is our only cluster source that was previously classified by Boyer et al. (2019) as a carbon star. This source, however, lies in a young cluster (log Age = 6.9) that is likely too young to host an AGB population. If the source is associated with the cluster, it would be expected to be a high-mass evolved star with an oxygen-rich chemistry. It is more likely that the source is a lower-mass field carbon star, spatially coincident with the cluster.
Footnotes
- 7
For simplicity, we use the term AGB to refer to both thermally pulsing and early AGB stars. Ultimately, our catalog is dominated by TP-AGB stars since most early AGB stars are fainter than our selection criteria. The term RGB star is used for objects fainter than AGB stars in our catalog, though we note that these include early AGB stars and core He-burning stars as well. See Section 3 for a description of the selection criteria for these objects.
- 8
These are galaxies above the flattening of the central galaxy luminosity-halo mass relation, and generally representative of the mean luminosity of central galaxies within larger halos (Cooray & Milosavljević 2005).
- 9
The DUSTiNGS pipeline was modified to include an additional chi <4 constraint for the F127M band to limit spurious detections (Boyer et al. 2019).
- 10
- 11
Groenewegen & Sloan (2018) present total mass-loss rates calculated by measuring DPRs from SED-fitting and scaling them by a gas-to-dust ratio of 200; we use the unscaled DPRs here.