Abstract
Using the first epoch of four-band NIRCam observations obtained by the James Webb Space Telescope (JWST) Prime Extragalactic Areas for Reionization and Lensing Science Program in the Spitzer IRAC Dark Field, we search for F150W and F200W dropouts. In 14.2 arcmin2, we have found eight F150W dropouts and eight F200W dropouts, all brighter than 27.5 mag (the brightest being ∼24 mag) in the band to the red side of the break. As they are detected in multiple bands, these must be real objects. Their nature, however, is unclear, and characterizing their properties is important for realizing the full potential of JWST. If the observed color decrements are due to the Lyman break, these objects should be at z ≳ 11.7 and z ≳ 15.4, respectively. The color diagnostics show that at least four F150W dropouts are far away from the usual contaminators encountered in dropout searches (red galaxies at much lower redshifts or brown dwarf stars). While the diagnostics of the F200W dropouts are less certain due to the limited number of passbands, at least one of them is likely not a known type of contaminant, and the rest are consistent with either high-redshift galaxies with evolved stellar populations or old galaxies at z ≈ 3–8. If a significant fraction of our dropouts are indeed at z ≳ 12, we have to face the severe problem of explaining their high luminosities and number densities. Spectroscopic identifications of such objects are urgently needed.
Original content from this work may be used under the terms of the Creative Commons Attribution 4.0 licence. Any further distribution of this work must maintain attribution to the author(s) and the title of the work, journal citation and DOI.
1. Introduction
The advent of the James Webb Space Telescope (JWST) has pushed our redshift frontier to z > 11 and even possibly to z ≈ 20. This is enabled by its NIRCam instrument, which offers wavelength coverage far beyond the 1.7 μm cutoff of the Hubble Space Telescope (HST) and thus allows objects at z > 11 to be selected. The first batch of deep NIRCam data, released on 2022 July 14, immediately spurred many independent groups to search for objects at the highest possible redshifts. These data were obtained in three different fields of similar coverage, namely, the JWST Early Release Observations (ERO; Pontoppidan et al. 2022) in the SMACS J0723−73 cluster field (hereafter “SMACS0723”), the GLASS JWST Early Release Science Program (Treu et al. 2022) in the flanking field of A2744 (hereafter “GLASS”), and the Cosmic Evolution Early Release Science Survey (hereafter “CEERS”; Finkelstein et al. 2022) in the Extended Groth Strip. Within a month after these data were released, over a hundred candidate z > 11 galaxies have been reported (Adams et al. 2023; Atek et al. 2022; Castellano et al. 2022; Donnan et al. 2022; Finkelstein et al. 2022; Harikane et al. 2022; Naidu et al. 2022a; Rodighiero et al. 2023; Yan et al. 2022) using either the dropout method that identifies the Lyman break or the photometric redshift (zph) method. The largest sample, from Yan et al. (2022), contains 87 candidates up to z ≈ 20 in SMACS0723. In stark contrast, years of searches based on the HST near-infrared (NIR) data in multiple fields resulted in only one z ≈ 11 galaxy, which could be at z = 11.09 (Oesch et al. 2016) or 10.957 (Jiang et al. 2021).
While the early JWST searches are a giant leap forward, severe problems have also surfaced. Most studies of galaxy formation in the early universe did not predict such a large number of z > 11 galaxies to be found. Furthermore, most of the aforementioned z > 11 candidate samples contain some very bright objects that are difficult to reconcile with our current understanding of early galaxy formation processes. For example, the z ≈ 11–20 candidates reported by Yan et al. (2022) in SMACS0723 include five objects that are brighter than 26.5 mag in F356W. Two of the candidates reported by Atek et al. (2022) in the same field have F200W magnitudes of 25.22 and 26.35 at zph = 11.22 and 15.70, respectively. Among the candidates reported by Castellano et al. (2022), there is also a very bright object at zph = 12.3 in GLASS with F444W magnitude of 25.88. In CEERS, Donnan et al. (2023) found a candidate at zph = 16.74 that has an F200W magnitude of 26.46. All such objects, if at the high redshifts suggested, would correspond to MUV ≲ −21.5 to −24, a regime where no previous studies had suggested finding any galaxies over such a small area as a few NIRCam pointings. Gravitational lensing cannot solve the problem, as most of these objects have no evidence suggesting significant lensing. Even near the lensing cluster in the SMACS0723 field, only a couple of the z > 11 candidates could be magnified by a factor of ∼3 (Yan et al. 2022). On the other hand, it is not impossible that most of these very bright candidates are due to some novel kinds of contaminators; in this case, such objects are worth further investigation in their own right and so that JWST high-redshift studies can be put on a solid footing.
Given the tension already created by these surprising initial results, it is important to verify whether such bright z > 11 candidates are also seen in other fields. To this end, we report our initial search for dropouts in one of the “blank” fields of the Prime Extragalactic Areas for Reionization and Lensing Science program (PEARLS; Windhorst et al. 2022), which is a JWST Interdisciplinary Scientists Guaranteed Time Observation program (PI. Windhorst; PID 1176 & 2738). We describe our NIRCam data and the source extraction in Section 2. We focus on the dropouts from two NIRCam bands (F150W and F200W at ∼1.5 and ∼2.0 μm, respectively), which are presented in Section 3. We conclude with a discussion in Section 4. All magnitudes are in the AB system, and we adopt a flat ΛCDM cosmology with parameters H0 = 71 km s−1 Mpc−1, ΩM = 0.27, and ΩΛ = 0.73.
2. Observations and Data Reduction
The PEARLS NIRCam data used in this study are in the central portion of the Spitzer IRAC Dark Field (IDF; Krick et al. 2009; Yan et al. 2018), dubbed the “JWIDF” (Yan et al. 2022b, in preparation). This field is in the JWST continuous viewing zone and has deep prior observations from the IRAC camera on the Spitzer Space Telescope for 16.2 yr. This PEARLS field was chosen primarily for the IR time-domain science and has three planned epochs of four-band NIRCam observations in F150W, F200W, F356W, and F444W.
The current work is based on the first epoch of observations, which were executed on 2022 July 8 UT. NIRCam operates in the “short wavelength” (SW) and “long wavelength” (LW) channels simultaneously, and we paired observations in the F150W band with F444W and the F200W band with F356W. To cover the gaps between detectors, we used FULLBOX dithers with the 6TIGHT pattern, which results in a ∼59 × 2
4 rectangle area covered by six dithered exposures. The dithered positions are determined by the STANDARD subpixel dither to optimally sample the point-spread functions (PSFs). For each exposure, the SHALLOW4 readout pattern was adopted with “up-the-ramp” fitting to determine the count rate. We used one integration per exposure with 10 groups per integration, giving a uniform exposure time of 3157 s in each band. The native NIRCam pixel scales are 0
031 pix−1 for F150W and F200W (both in SW) and 0
063 pix−1 for F356W and F444W (both in LW).
The data were retrieved from the Mikulski Archive for Space Telescopes (MAST). Reduction started from the so-called Stage 1 “uncal” products, which are the single exposures from the standard JWST data reduction pipeline after Level 1b processing. The JWST data reduction pipeline has been quickly evolving, and we used the version 1.6.1dev3+gad99335d in the context of jwst_0944.pmap,
27
which takes the latest NIRCam flux calibrations (as of 2022 August 20) into account. A few changes and augmentations were made to the pipeline to improve the reduction quality; most importantly, these included enabling the use of an external reference catalog for image alignment and implementing a better background estimate for the final stacking. Removal of the so-called “1/f” patterns in the SW bands was also integrated in the process. The single exposures in each band were stacked and were projected onto the same astrometric grid with a pixel scale of 006 (hereafter the “60 mas” version). This choice of scale sacrifices some angular resolution in the SW bands in favor of better detection of faint sources. The mosaics are in surface brightness units of MJy sr−1. For the 0
06 pixel scale, this translates to a magnitude zero-point of 26.581. In addition, we also created another version of mosaics at a pixel scale of 0
03 (hereafter the “30mas” version), which were used to study the sizes of the selected candidates.
We carried out source extraction and photometry using SExtractor (Bertin & Arnouts 1996) in dual-image mode. Following Yan et al. (2022), we used the F356W image for detection and adopted MAG_ISO magnitudes for color measurements. The F356W image is the deepest, and its PSF is comparable to that in F444W but is almost twice as large as those in the two SW bands. The sources of interest are small enough that the F356W MAG_ISO apertures include nearly all the source flux while minimizing the background noise. Hereafter we denote the magnitudes in the four bands as m150, m200, m356, and m444, respectively. To minimize false detections, we kept only the sources that have a signal-to-noise ratio (S/N) ≥ 5.0 and ISOAREA_IMAGE ≥ 10 pixels in F356W.
3. Dropout Selection
The dropout method has been widely accepted as a robust technique of selecting Lyman-break galaxy candidates even when only limited bands are available. Our motivation was to select z > 11 candidates, and we followed the standard procedures. However, we caution that the resulting dropouts should be treated as nothing more than candidates. Our goal was to verify whether we could find similar, bright z > 11 candidates seen in other fields, some of which were found using different methods.
3.1. Ancillary HST Data
In addition to the JWST NIRCam data, we also made use of the archival HST data taken by the Advanced Camera for Surveys (ACS), which were obtained in 2006 November 27 UT (PI. Surace; HST PID 10521) in the IDF. These observations were done in F814W (∼0.806 μm) at two-orbit depth (effective exposure time ∼5176 s). While they are not as deep as the NIRcam data, these ACS images are still useful in rejecting the brightest contaminants. We created a mosaic covering the JWIDF footprint, which was registered to the same grid as the 60 mas NIRCam mosaics. The nominal 2σ depth within 02 radius aperture is 28.47 mag.
3.2. Selection Overview
The color criteria for F150W dropouts and F200W dropouts were chosen following the methodology of Yan et al. (2022). A flat spectrum (in fν ) is typical for Lyman-break galaxies at high redshifts. If such a spectrum is truncated at the midpoint of a passband (the “dropout band”), the color decrement between that band and a redder one is 0.75 mag. We therefore adopted a simple color threshold of 0.8 mag, i.e., m200 − m356 ≥ 0.8 mag, to select F200W dropouts. A further requirement for F200W dropouts was that the source must have S/N ≤ 2 in the “veto band” (F150W). When selecting F150W dropouts, we do not have a bluer NIRCam band to serve as a veto, and therefore we required m150 − m200 ≥ 1.2 mag to reduce the chance of contamination. This threshold is equivalent to detecting a sharp break when it moves >2/3 out of the dropout band. If the break is the Lyman break, these criteria correspond to z ≳ 11.7 for F150W dropouts and z ≳ 15.4 for F200W dropouts. When calculating the color decrements, we replaced any S/N ≤ 2 detections in the dropout band with the 2σ depths as measured in the MAG_ISO apertures defined on the F356W image. A legitimate dropout should also be detected at S/N ≥ 5 in the band to the red side of the break (the “drop-in” band) and a null detection in the ACS F814W image. After the initial selections, we visually inspected the images of these candidates in all bands to reject contaminators due to spurious detections around bright objects, image defects, noise spikes mistakenly included as sources, etc. Due to photometric errors, some SExtractor nondetections (below 2σ) in the veto band (for F200W dropouts) are in fact visible; such contaminants were removed in this visual inspection step as well.
Secondary color criteria involving a redder band are often applied in the dropout selections at lower redshifts (e.g., at z ≈ 6) to help remove possible contaminants such as galaxies with old stellar populations and Galactic brown dwarfs. The former have prominent 4000 Å breaks, and the latter have strong molecular absorption bands, both of which could mimic a Lyman-break signature. As Yan et al. (2022), we did not use any such secondary criteria (but see below for diagnostics). The age of the universe at such a high redshift is short enough that activities of short timescales are not averaged out, and therefore galaxies could have a wide range of colors. This is illustrated by the model spectra in the top panel of Figure 1, which were generated based on the population synthesis models of Bruzual & Charlot (2003, hereafter BC03) using the initial mass function (IMF) of Chabrier (2003) and solar metallicity. Three models are shown. One is a very young (age of 10 Myr) galaxy with nearly constant star formation (hereafter the “young” model galaxy), which represents the bluest population that one can get from BC03. The opposite is a “maximally old” template, which is a single burst (“simple stellar population” or SSP) whose age is as old as the age of the universe at the redshift under discussion (hereafter the “maximally old” model), e.g., the age of 0.5 Gyr (0.3 Gyr) at z = 11 (z = 15). Such a template has the reddest color among the BC03 models. To make it even redder, we consider a third template, which is a dusty, maximally old template with AV = 2.0 mag and reddened according to the extinction law of Calzetti (2001; hereafter the “dusty maximally old” model).
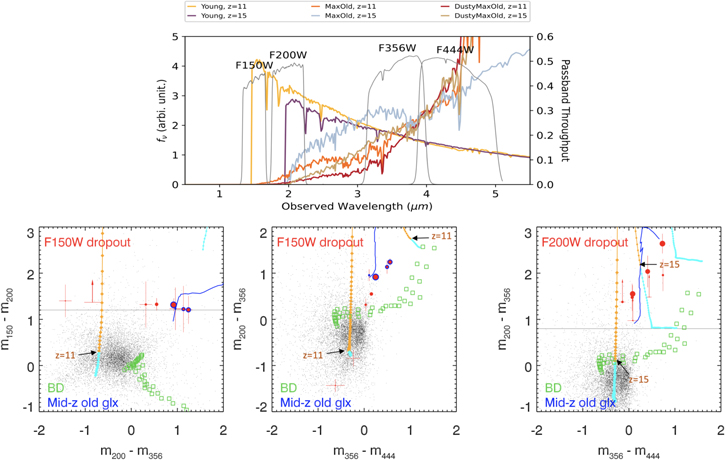
Figure 1. (Top) Passbands of the JWIDF observations with superposed Bruzual & Charlot (2003) templates (all with Chabrier 2003 initial mass functions and solar metallicities). Gold and dark brown show 10 Myr templates at z = 11 and z = 15, respectively. Red and cyan show maximally old (i.e., as old as the age of the universe) galaxies at the same redshifts, and dark red and orange the same maximally old templates with AV = 2.0 mag (Calzetti 2001 extinction law). (Bottom) Diagnostic color–color diagrams for dropout selections. The left and middle panels are for F150W dropouts, and the right panel shows the F200W dropouts. The filled red circles with error bars or limits represent the selected dropouts, with symbol sizes corresponding to m200 (left and middle) or m356 (right). Black dots show field objects. Colored lines with dots show the color tracks from z = 10 to 30 of the three model templates in the top panel. The nearly vertical track is the young template, and cyan and orange indicate respectively z < 11, z > 11 in the left and middle panels and z < 15, z > 15 in the right panel. The tracks of the old templates are shown similarly, but the tracks are mostly outside the plotted color ranges. The blue curve is the color track of mid-z maximally old galaxies from z = 2.6 to 8.0. This track is shown in its entirety in the right panel but is only partially inside the left and middle panels. Four dropouts in the left and middle panels marked with blue circles are near these tracks and are likely mid-z contaminants. The green squares show the colors of brown dwarfs (labeled by “BD”) based on Burrows et al. (2006).
Download figure:
Standard image High-resolution imageWe still considered a posteriori the possible impact of the two types of aforementioned contaminators. For brown dwarfs, we used a set of model spectra of Burrows et al. (2006), which cover L and T brown dwarfs with effective temperatures ranging from 2300 to 700 K. For old galaxies, we used a series of BC03 models redshifted to z = 2.6–8.0 at a step size of 0.1. These models are SSPs with solar metallicity and are “maximally old,” i.e., their ages are as old as the ages of the universe at their redshifts. The population of so-called “HST-dark” or “H-band dropout” galaxies that have been discussed in the past few years are thought to contain such very old components and could have similar NIR colors as our dropouts (e.g., Barrufet et al. 2022, and references therein). We compare our candidates to all such possible contaminators in the color space.
3.3. F150W Dropouts
Our final sample contains eight F150W dropouts. Figure 1 shows their colors and compares them to the synthesized colors using the model spectra in the upper panel as well as those of the two types of possible contaminators (mid-z old galaxies and brown dwarfs). In the primary selection diagram, m150 − m200 versus m200 − m356, most of the F150W dropouts are far away from the contamination regions. Brown dwarfs are blue in m150 − m200 and will never show up as F150W dropouts. These eight dropouts form three groups in m200 − m356 color. Two dropouts (F150D_H11 and F150D_H19) are >0.5 mag bluer than the young template, which cannot be caused by contaminators but could be explained by a more top-heavy IMF than the adopted Chabrier IMF. Two dropouts (F150D_H12 and H13) have 0.25 < m200 − m356 ≤ 0.55 mag, which could be explained by high-z models with a range of ages. Finally, four dropouts (F150D_H14, H17, H07, and E01) are close to the track of mid-z old galaxies (z = 2.6–8), suggesting that they could be contaminants. Their locations in the secondary diagnostic diagram, m200 − m356 versus m356 − m444, are consistent with this interpretation. However, this still cannot rule out with certainty their being old galaxies at z > 11.
Figure 2 shows five-band stamp images of seven F150W dropouts. The eighth of them is special and is discussed in Section 3.5. Their morphologies range from compact to diffuse. We fit 2D Gaussian profiles to the 30 mas F356W images of the three compact ones (F150D_H12, H14 and H02), and these best-fit profiles are also shown. F150D_H14 has full-width at half-maximum of 014 in both dimensions and is consistent with being a point source. F150D_JWIDF_H13 appears to be arc-like and could be gravitationally lensed by a foreground galaxy that is only 1
2 away, although we cannot rule out that it is in fact part of this bright neighbor.
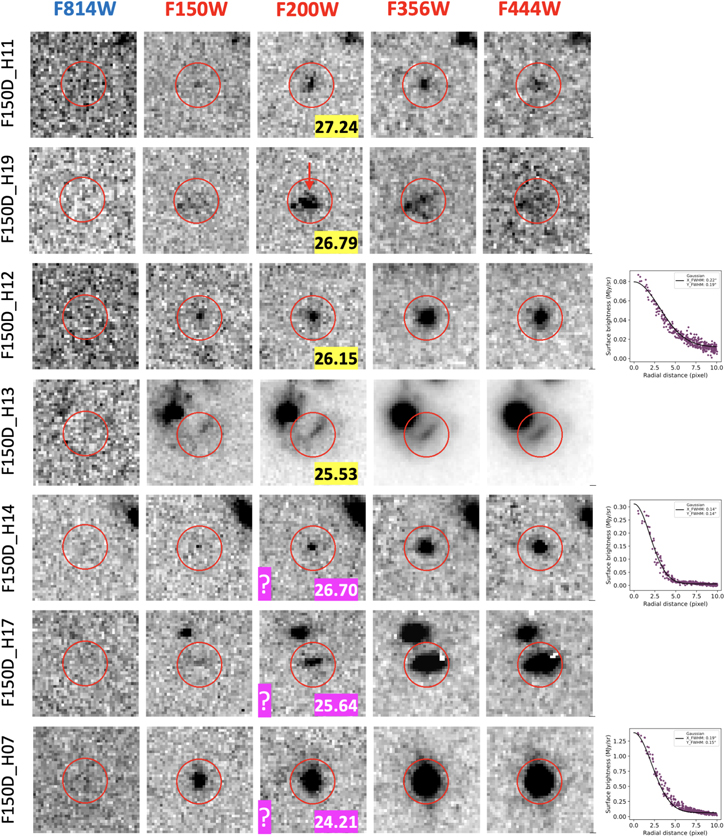
Figure 2. Image stamps of seven of the eight F150W dropouts (with short IDs noted) in the HST ACS F814W and four JWST NIRCam bands (from left to right). The eighth is shown in Figure 5. The images are 24 × 2
4 in size, have 60 mas pixels, and are oriented north-up and east-left. The dropouts are centered on the images and are indicated by red circles (0
5 radius). F150D_H19 has a close neighbor that is unrelated, and an arrow is used to indicate the dropout to avoid confusion. The numbers shown on the F200W images are their magnitudes in this band (m200). The last three objects are among the four that are close to the mid-z old galaxy tracks in Figure 1, and the question marks are to indicate that they might be contaminants by these diagnostics. F150D_H12, H14, and H07 are compact, and the last panels show the 2D Gaussian profile fits to their light distributions in F356W. H14 is consistent with being a point source.
Download figure:
Standard image High-resolution image3.4. F200W Dropouts
There are eight F200W dropouts. The lower-right panel of Figure 1 shows their colors. The F200W dropout colors are far from the region occupied by brown dwarfs as well. What makes diagnostics difficult with our limited number of passbands is that the color track of mid-z old galaxies are between the tracks of the young and old models at high redshift. Nevertheless, at least one F200W dropout (F200D_H06) is too blue in m356 − m444 to be a mid-z contaminant.
Four of the F200W dropouts are shown in Figure 3. The other four are special and are discussed in Section 3.5. Among the four shown in Figure 3, two are compact (F200D_H11 and H02). Their 30 mas F356W images are fitted using 2D Gaussian profiles, which are also shown. One of them, F200D_H11, has FWHM of 014 in both dimensions and is consistent with being a point source.
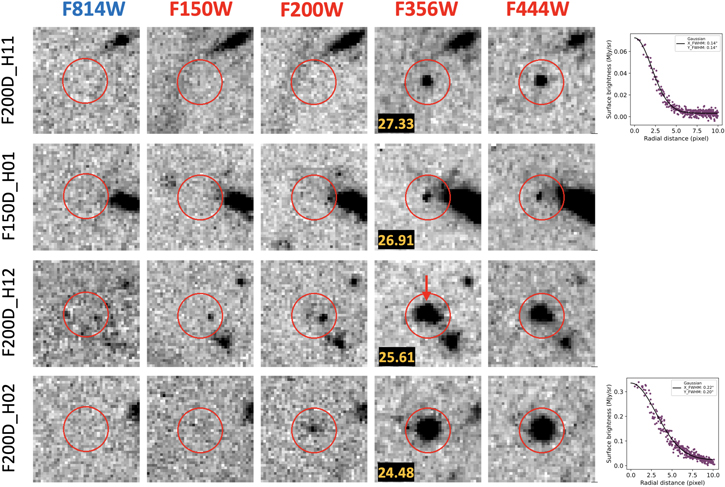
Figure 3. Similar to Figure 2 but for four of the eight F200W dropouts. The other four are shown in Figure 5. The numbers shown on the F356W images are their magnitudes in this band (m356). F200D_H11 is consistent with being a point source.
Download figure:
Standard image High-resolution imageF200D_H12, M03, and M05 have close neighbors. Our photometry was done after subtracting the neighbors, as shown in Figure 4.
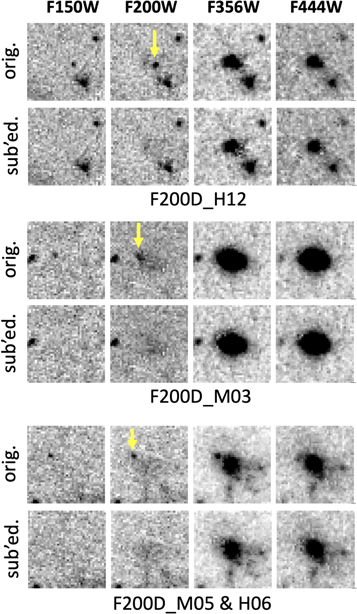
Figure 4. Subtraction of close neighbors for three F200W dropouts that have unrelated companions. Each object’s short ID is below that object's images, and the passbands are labeled at top. Stamps are 24 × 2
4 in size with 60 mas pixels. For each object, the top row shows the original NIRCam negative images, and the bottom row shows images that have the neighbor (indicated by the yellow arrow in the F200W image) subtracted.
Download figure:
Standard image High-resolution image3.5. Dropouts of Special Interest
Four F200W dropouts and one F150W dropout are so peculiar that they are discussed here separately. Figure 5 shows their images.
- 1.F200D_JWIDF_M03. This object was originally selected as an F150W dropout. Visual inspection shows that it is invisible in F150W and is only barely detected in F200W and that it has a close neighbor. After subtracting off this neighbor (see Figure 4), its photometry is consistent with being an F200W dropout. It reaches m356 = 24.05 and m444 = 23.25 and is the second-brightest object in our entire dropout sample. Its location in color space (Figure 1) is consistent with either the mid-z old galaxy track at z ≈ 8 or the dusty maximally old track at z ≈ 11.
- 2.F200D_JWIDF_M05 and H06. These two objects are separated by only 0
88 but differ in brightness and color. H06 is bright, with m356 = 26.17 and m444 = 26.31. M05 is even brighter, with m356 = 24.03 and m444 = 23.95. Similar to F200D_JWIDF_M03, M05 was originally selected as an F150W dropout, and it also has a close neighbor. After the subtraction of the neighbor (see Figure 4), it qualifies as an F200W dropout. The location of H06 in color space is closest to the track of the young model at high z, while that of M05 is in the ambiguous region where it can be consistent with either high z or mid z.
- 3.F150D_JWIDF_E01 and F200D_JWIDF_H08. These two sources are the strangest because one is an F150W dropout and the other is an F200W dropout, and yet they are very close to each other. In the F356W image, this is a system of four blended objects; our source extraction identifies the upper two objects as a single source, which is F150D_JWIDF_E01, and the lower two objects as another single source, which is F200D_JWIDF_H08. The former is the brightest among the entire dropout sample but is close to the mid-z old galaxy contamination region in both diagnostic color–color diagrams. If it is indeed due to this kind of contamination, it is most likely at z ≈ 3. The latter source, however, is not compatible with such a redshift, which makes their apparent association puzzling. This system is similar to the “chain of five” system reported by Yan et al. (2022).
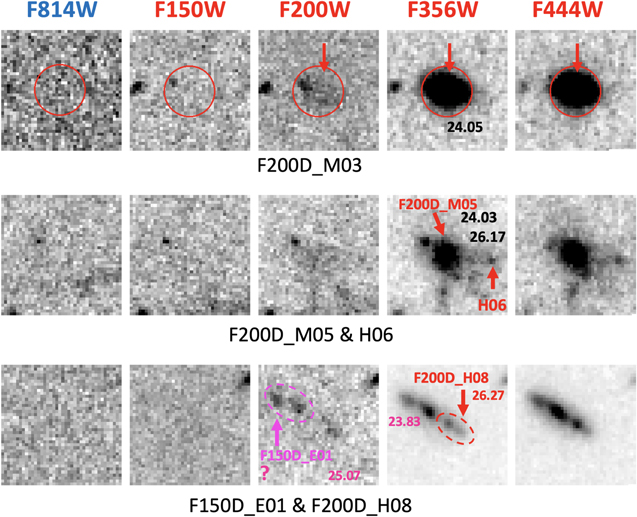
Figure 5. Image stamps (24 × 2
4 in size, 60 mas pixels) of five peculiar dropouts. Four of them are F200W dropouts while one is an F150W dropout. Their IDs are labeled. The labeled magnitudes in F200W or F356W are those in the corresponding bands. The one in the top row is the second-brightest in the entire sample, and has a close neighbor that is at a low redshift (see also Figure 4). The middle row shows two F200W dropouts that are very close neighbors but are very different in brightness and color. The bottom row shows a bright system that is made of an F150W dropout and an F200W dropout.
Download figure:
Standard image High-resolution image4. Discussion
The NIRCam F150W and F200W dropouts presented here were selected by applying the conventional dropout method to z > 11. In other words, our result is to say that the JWIDF contains bright z > 11 galaxy candidates similar to those recently reported in other fields. The new data make the plethora of such objects a more acute problem because the JWIDF includes even more bright candidates. The faintest F150W dropout has m200 = 27.24, and the faintest F200W dropout has m356 = 27.33. These magnitudes are already bright if the sources are indeed at z > 11. For the sake of simplicity, let us use 26.5 mag as the fiducial threshold of being “very bright” in this discussion. Five of our F150W dropouts have m200 < 26.5, and five of our F200W dropouts have m356 < 26.5. This implies a cumulative surface density of ∼0.7 arcmin−2 at 26.5 mag. Only one dropout (F150D_JWIDF_H13 with m200 = 25.53) could potentially be magnified by gravitational lensing. The brightest four dropouts have m356 ≲ 24.0. For reference, m200 (m356) of 24.0 corresponds to MUV = −23.7 (−24.12) at z = 11 (z = 15), which is in the luminosity range of quasars. Two of the dropouts (F150D_H14 and F200D_H11) are point-like, which is indeed consistent with quasar morphology. However, if they are quasars, the inferred number density would be orders of magnitude higher than the quasar number density at z ≈ 7 (Mortlock et al. 2011; Bañados et al. 2018; Wang et al. 2018, 2021; Matsuoka et al. 2019; Yang et al. 2019, 2020). Furthermore, most of these bright objects are extended objects and thus cannot be quasars.
It is questionable whether known contaminants can explain these dropouts. As discussed in Section 3, the color diagnostics for the F200W are ambiguous due to the limited passbands. Diagnostics for the F150W dropouts are based on two different projections of the color space and are better constrained but still not conclusive. The results suggest that four F150W dropouts (F150D_H14, H17, H07, and E01) have colors that are also consistent with being contaminants of old galaxies at z ≈ 2.6–8. Interestingly, these four objects (and only these four) also satisfy the usual color criterion (approximately m150 − m444 ≥ 2.3) for the “H-band dropout” galaxies in the literature (see Section 3.1). Our field also has deep (∼1 μJy rms) Jansky Very Large Array 3 GHz data (Gim et al. 2022, in preparation), which provide some indirect diagnostics. Among all our 16 dropouts, only two (F150D_H17 and E01) are detected. They have S3 GHz = 24.4 ± 3.7 and 15.2 ± 2.3 μJy, respectively, typical of z ≈ 3 star-forming galaxies, and both are among the aforementioned possible contaminants. In short, the conservative estimate is that four of our eight F150W dropouts could be known mid-z contaminants. However, these account for only three of the five that have m200 < 26.5. If we attribute the brightness of F150D_H13 to gravitational lensing, we are still left with F150D_H12 to explain.
One might argue that some or even all of the dropouts could have been “vetoed” had a bluer NIRCam band been observed. To test this hypothesis, we used a different PEARLS field that has eight NIRCam bands to mimic the F150W and F200W dropout selection in the IDF. We first used only the same four NIRCam bands and an ACS band, and applied the same selection criteria to select dropouts. We then added the other four NIRCam bands to see how many dropouts thus selected would survive. The details are given in Appendix B. Based on this test, 40% and 67% of the F150W and F200W dropouts in the IDF would survive, respectively, if we had eight NIRCam bands available.
One might also argue that there could be some new kinds of contaminants that we do not consider. Recently, Zavala et al. (2022) presented a case where a z < 6 dusty starburst mimics the color of an F200W dropout. However, such a dropout-like color is mainly due to its old stellar population (∼700 Myr old as these authors derived) rather than its being dusty or star-forming. Our color diagnostics have already considered such mid-z, old-age contaminators. Objects with strong nebular emission lines (e.g., Wilkins et al. 2022) might also be suggested as possible contaminators (e.g., Naidu et al. 2022b). However, such objects cannot create dropout-like colors in our color space. For example, no strong emission lines can conspire to land in F200W, F356W, and F444W at the same time to mimic an F150W dropout. This is also demonstrated in Appendix B, which shows the SED-fitting results of the surviving “mimicked” dropouts using the eight-band NIRCam data. Two different SED-fitting tools were utilized, one of which uses a set of templates including nebular emission lines. The surviving F150W dropouts have preferred solutions at high z, and at least half of the surviving F200W dropouts also have preferred solutions at high z.
In summary, the very bright F150W and F200W dropouts pose a problem that we must solve to advance high-z studies with JWST. Either these objects are due to previously unknown contaminators at z < 11, or our existing picture of early galaxy formation needs to be revised. The goal of this work is to present these troubling and yet interesting objects. Lacking further data, we are not able to provide more definite interpretations at this time. As the JWIDF will have two more epochs of NIRCam observations in Cycle 1, variability study using the multiple-epoch data might offer some clues. However, the most definitive answer will be from spectroscopy. Given their brightness, these objects are ideal targets for JWST NIRSpec, and obtaining such observations is imperative.
The NIRCam data presented in this paper can be accessed via doi:10.17909/dh0r-qf34 after the proprietary period.
This project is based on observations made with the NASA/ESA/CSA James Webb Space Telescope and obtained from the Mikulski Archive for Space Telescopes, which is a collaboration between the Space Telescope Science Institute (STScI/NASA), the Space Telescope European Coordinating Facility (ST-ECF/ESA), and the Canadian Astronomy Data Centre (CADC/NRC/CSA). We thank our Program Coordinator, Tony Roman, for his expert help scheduling this complex program.
H.Y. and C.L. acknowledge the partial support from the University of Missouri Research Council Grant URC-21-005. S.H.C., R.A.W. and R.A.J. acknowledge support from NASA JWST Interdisciplinary Scientist grants NAG5-12460, NNX14AN10G, and 80NSSC18K0200 from GSFC. Z.M. is supported in part by the National Science Foundation, grant #1636621. C.C. is supported by the National Natural Science Foundation of China, Nos. 11803044, 12173045. C.N.A.W. acknowledges funding from the JWST/NIRCam contract NASS-0215 to the University of Arizona. J.F.B. acknowledges support from NSF grant No. PHY-2012955. A.Z. acknowledges support by grant No. 2020750 from the United States-Israel Binational Science Foundation (BSF) and grant No. 2109066 from the United States National Science Foundation (NSF), and by the Ministry of Science & Technology, Israel.
Appendix A: Dropout Catalog
Table 1 presents the full list of dropouts selected in this work. The last four F150W dropouts have colors consistent with being old galaxies at 3 ≲ z ≲ 8.
Table 1. Catalog of F150W and F200W Dropouts in JWIDF
| ID | R.A. | Decl. | m150 | m200 | m356 | m444 |
|---|---|---|---|---|---|---|
| F150D_JWIDF_H11 | 265.007627 | 68.982685 | >28.61 | 27.24 ± 0.14 | 28.09 ± 0.10 | 28.32 ± 0.11 |
| F150D_JWIDF_H19 | 265.094238 | 68.994877 | 28.19 ± 0.34 | 26.79 ± 0.09 | 28.22 ± 0.10 | 28.85 ± 0.17 |
| F150D_JWIDF_H12 | 264.943505 | 68.982637 | 27.47 ± 0.48 | 26.15 ± 0.13 | 25.84 ± 0.03 | 25.80 ± 0.03 |
| F150D_JWIDF_H13 | 264.943329 | 68.983269 | 26.86 ± 0.13 | 25.53 ± 0.04 | 24.99 ± 0.01 | 24.83 ± 0.01 |
| F150D_JWIDF_H14 | 265.007586 | 68.983668 | 27.92 ± 0.44 | 26.70 ± 0.13 | 25.74 ± 0.02 | 25.63 ± 0.01 |
| F150D_JWIDF_H17 | 265.008881 | 68.990580 | 26.86 ± 0.48 | 25.64 ± 0.14 | 24.51 ± 0.02 | 24.01 ± 0.01 |
| F150D_JWIDF_H07 | 265.068612 | 68.975125 | 25.52 ± 0.13 | 24.21 ± 0.04 | 23.29 ± 0.00 | 23.04 ± 0.00 |
| F150D_JWIDF_E01 | 264.958298 | 68.985423 | 26.28 ± 0.29 | 25.07 ± 0.08 | 23.83 ± 0.01 | 23.27 ± 0.01 |
| F200D_JWIDF_H11 | 265.078543 | 68.994657 | >28.71 | >28.81 | 27.33 ± 0.04 | 26.89 ± 0.03 |
| F200D_JWIDF_H01 | 265.040813 | 68.956838 | >27.76 | >27.89 | 26.91 ± 0.09 | 26.83 ± 0.08 |
| F200D_JWIDF_H12 | 265.087790 | 68.997920 | >27.63 | 27.07 ± 0.29 | 25.60 ± 0.02 | 25.52 ± 0.02 |
| F200D_JWIDF_H02 | 265.045779 | 68.957299 | >26.87 | 26.52 ± 0.34 | 24.48 ± 0.02 | 24.07 ± 0.01 |
| F200D_JWIDF_M05 | 265.146314 | 68.967207 | >26.61 | 25.58 ± 0.19 | 24.03 ± 0.01 | 23.95 ± 0.01 |
| F200D_JWIDF_H06 | 265.145650 | 68.967187 | >27.45 | >27.55 | 26.17 ± 0.05 | 26.31 ± 0.05 |
| F200D_JWIDF_M03 | 264.982466 | 68.962893 | >27.45 | 26.55 ± 0.21 | 24.05 ± 0.01 | 23.26 ± 0.00 |
| F200D_JWIDF_H08 | 264.957925 | 68.985341 | >28.61 | 28.23 ± 0.35 | 26.27 ± 0.02 | 25.53 ± 0.01 |
Note. The coordinates are given in units of degrees and are for J2000. The magnitudes are SExtractor MAG_ISO magnitudes, and the limits are 2σ limits as measured in the MAG_ISO aperture as defined in the F356W image.
Download table as: ASCIITypeset image
Appendix B: Contamination Due to Limited NIRCam Bands
As we only have four NIRCam bands and one (less-sensitive) ACS band in this field, the interpretation of our F150W and F200W dropouts is more difficult than for other studies mentioned in Section 1. To better understand our sample, we used another PEARLS “blank” field, the “NEP Time-domain Field” (hereafter the “TDF”), which has eight NIRCam bands reaching comparable depths as the IDF (Windhorst et al. 2023). In addition to F150W, F200W, F356W, and F444W that the IDF has, the TDF also has F090W, F115W, F277W, and F410M. These NIRCam data in the first epoch of the TDF (∼16 arcmin2 in size) are public. The TDF does not have the ACS F814W band as the IDF does, but it has the ACS F435W and F606W bands. We therefore used F606W (deeper of the two) as the optical veto band in the dropout selection.
To test the IDF dropout selection process, we mimicked it in the TDF, using the same four bands as in the IDF and applying the same color criteria, including use of F606W as a veto in the visible wavelength, to select F150W and F200W dropouts. Then we examined the other four NIRCam bands to check how many “IDF-mimicked” dropouts would be rejected. Details of the TDF dropouts will be given in a future paper, and here we only present the results relevant to this test.
The initial selection produced five F150W dropouts, and three of them were rejected by the formal S/N ≥ 2 detections in F115W and/or F090W or by possible weak detections judged by eye. Similarly, there were nine F200W dropouts selected initially, and three were rejected after using F115W and F090W. This implies that the contamination rates due to limited NIRCam bands are 60% and 33% for the initial F150W and F200W dropouts, respectively. Image stamps of all 14 objects are shown in Figures B1 and B2.
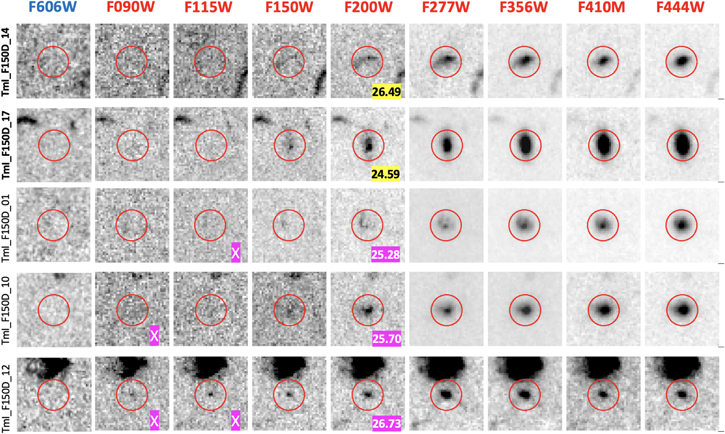
Figure B1. Nine-band image stamps of the five F150W dropout candidates selected in the TDF. The images are 24 × 2
4 in size and are oriented north-up and east-left. The candidates are centered on the images and are indicated by red circles with radii 0
5. These F150W candidates were selected using only the same four NIRCam bands as in the IDF plus the HST ACS F606W band. (Short IDs of sources are “TmI” for “TDF mimicking IDF.”) The numbers shown on the F200W images are their magnitudes in this band. The two dropouts that survive after incorporating the other four NIRCam bands (especially F090W and F115W as the veto bands) are in the top two rows. The bottom three rows show sources rejected by their formal S/N ≥ 2 detections in F115W and/or F090W or by the visual inspection in these two bands (marked by “X”).
Download figure:
Standard image High-resolution image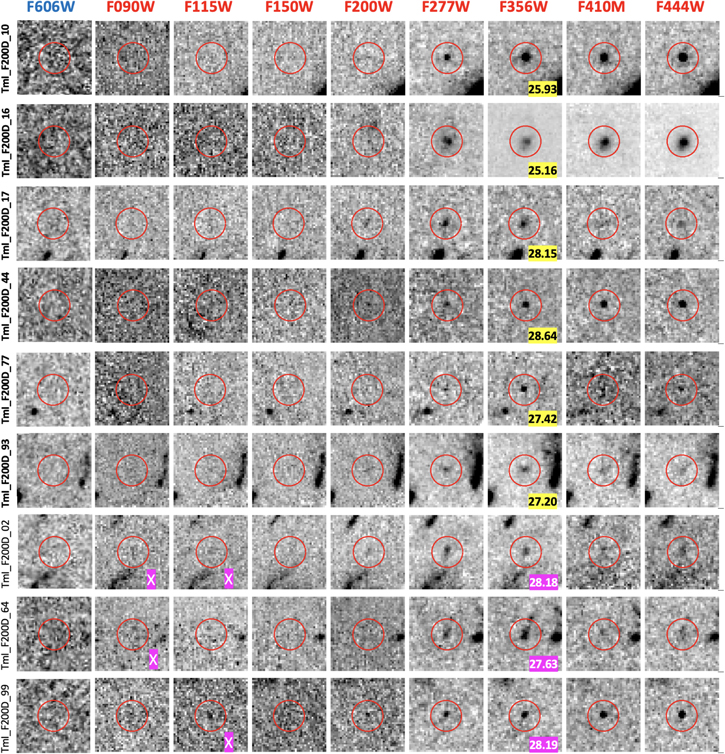
Figure B2. Similar to Figure B1 but for the nine TmI F200W candidates. The numbers shown on the F356W images are their magnitudes in this band. After incorporating the other four NIRCam bands, the objects in the top six rows survive, and those in the bottom three rows are rejected by images marked with “X.”
Download figure:
Standard image High-resolution imageTo further study whether the surviving dropouts are consistent with being at high z, we fitted their SEDs to derive their photometric redshifts (zph). However, we caution that zph > 11 for a particular dropout should not be taken as a confirmation of its being at high z. This is because of the statistical nature of zph. “Catastrophic failures” of zph are always possible. By the same token, zph < 11 for a particular dropout should not necessarily exclude it from the sample. Dropout selection and zph selection of high-z candidates are two different methods, and one is not superior to the other. Nevertheless, the likelihood of a candidate being at high z increases if it passes the selection of both methods.
As SED fitting depends on both the adopted templates and the method used, we took two different approaches. One was using Le Phare (Arnouts et al. 1999; Ilbert et al. 2006) to fit our dropouts to galaxy templates based on the BC03 models. The templates were constructed assuming exponentially declining star formation histories in the form of star formation rate (SFR) ∝e−t/τ , where τ ranged from 0 to 13 Gyr (0 for SSP and 13 Gyr to approximate constant star formation). These models use the Chabrier IMF (Chabrier 2003). We adopted the Calzetti extinction law, with E(B − V) ranging from 0 to 1.0 mag. The other approach was using EAZY-py, 28 which is the latest implementation of EAZY (Brammer et al. 2008). We adopted the “FSPS 12” template set, which include nebular emission. We modified the code to use flux density upper limits.
The results are shown in Figure B3. For the two surviving F150W dropouts, both methods give the best solutions at zph > 10: one has best-fit zph > 13, while the other has best-fit zph = 10.4 and 11.9 by Le Phare and EAZY, respectively. The probability distribution functions (PDFs) are all narrow and prefer high-z solutions. For the six surviving F200W dropouts, both methods give best-fit zph ≳ 20 for three objects and zph ≲ 9 for the other three. In general, the PDFs are rather broad and span both the high-z and low-z ranges, especially in the EAZY results. A conservative statement is that neither method can rule out high-z solutions for at least three of the six surviving F200W dropouts.
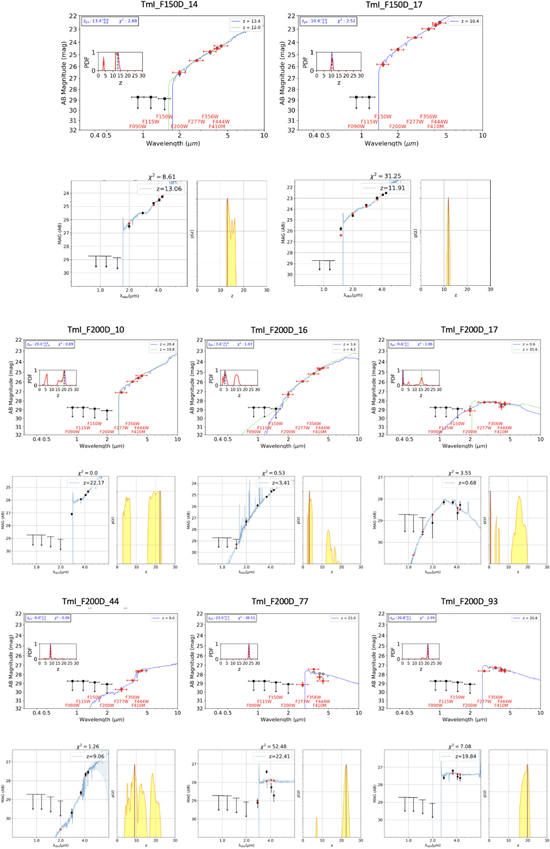
Figure B3. SED-fitting results of the surviving TmI F150W and F200W dropouts. The first two rows show the two F150W dropouts with the Le Phare results above and the EAZY results below. Source names are above each Le Phare panel. The remaining rows show the six F200W dropouts in the same arrangement. The derived photometric redshifts and χ2 values are given near the top of each panel. The χ2 values are the raw values, i.e., not the reduced χ2. In each Le Phare panel, red circles and black upper limits show the data. Blue curves are the best-fit models corresponding to the first peak of the redshift PDFs. The PDFs themselves are shown as insets. The green curves, when present, are the best-fit model corresponding to the second peak of the PDF. In the panels showing the EAZY results, the black symbols show the data, and the curves show the best-fit models. The red circles mark the synthesized magnitudes based on the best-fit models. The PDFs are shown (with yellow fill) next to the model fits.
Download figure:
Standard image High-resolution imageThrough the aforementioned assessment, we conclude that at least a significant fraction (>33%) of the F150W and F200W dropouts selected in the IDF are legitimate high-z candidates. The other dropouts might not be at high z but should be further studied to understand the contaminating population(s) for high-z selection in the JWST era.
Footnotes
- 27
Explanation of JWST calibration versions is at https://jwst-docs.stsci.edu/jwst-calibration-pipeline-caveats.
- 28