Abstract
We measure the orbital properties of halo stars using seven-dimensional information provided by Gaia and the Sloan Digital Sky Survey. A metal-rich population of stars, present in both local main sequence stars and more distant blue horizontal branch stars, have very radial orbits (eccentricity ∼0.9) and apocenters that coincide with the stellar halo “break radius” at galactocentric distance r ∼ 20 kpc. Previous work has shown that the stellar halo density falls off much more rapidly beyond this break radius. We argue that the correspondence between the apocenters of high metallicity, high-eccentricity stars, and the broken density profile is caused by the build-up of stars at the apocenter of a common dwarf progenitor. Although the radially biased stars are likely present down to metallicities of [Fe/H] ∼ −2, the increasing dominance at higher metallicities suggests a massive dwarf progenitor, which is at least as massive as the Fornax and Sagittarius dwarf galaxies, and is likely the dominant progenitor of the inner stellar halo.
1. Introduction
Stars on elliptical orbits move rapidly through their point of closest approach and slow down at their furthest extent. This continual speed-up/slow-down cycle is akin to cars on a highway speeding through the open road, and turning on the brakes at the onset of traffic. Naturally, as cars behave in heavy traffic, the inevitable slow-down leads to a “pile-up” of stars at apocenter. This phenomenon can lead to striking features in galaxy stellar halos, which are formed from the continual digestion of smaller mass dwarf galaxies. Stars stripped from dwarfs on very radial orbits can appear as shell-type features, which are a build-up of stars at apocenter (e.g., Johnston et al. 2008; Cooper et al. 2011). Thanks to the very long dynamical times in the halo, these features can persist over several Gyr and, like their stellar stream counterparts, display a visible memory of the galaxy’s accretion history.
In recent years, it has been recognized that the halo star counts in the Milky Way display a peculiar feature. Namely, instead of following a simple power-law density distribution, the halo density profile exhibits a “break” at galactocentric distances of r ∼ 20 kpc, whereby the star counts fall off much more rapidly beyond the break radius (e.g., Watkins et al. 2009; Deason et al. 2011; Sesar et al. 2011; Pila-Díez et al. 2015; Xue et al. 2015). While the details of the density profiles vary, these works find shallower power-law slopes (α ∼ 2.5) inside the break radius, and steeper power laws (α ∼ 3.7–5) beyond it. In Deason et al. (2013) we used a suite of simulated stellar halos (Bullock & Johnston 2005) to argue that these broken halo profiles are due to a build-up of stars at apocenters—either due to the accretion of a small group of dwarfs at similar times, or the accretion of one massive dwarf. Evidence for the latter scenario has rapidly been growing (e.g., Deason et al. 2015; Fiorentino et al. 2015; Belokurov et al. 2018a; Lancaster et al. 2018). Belokurov et al. (2018b) recently showed that ∼2/3 of the material in the inner stellar halo exhibits extreme radial anisotropy, making it appear “sausage-like” in velocity space—this, they argue, is a consequence of the accretion of a massive dwarf galaxy on a highly eccentric orbit. Fast on the heels of the second Gaia data release (DR2) Myeong et al. (2018) found that N = 8 of the Milky Way globular clusters are likely related to this markedly radial accretion event. Indeed, the association of a large number of globular clusters provides further evidence that the “sausage” is related to a massive halo progenitor. These findings are in good agreement with Kruijssen et al. (2018), who used the age–metallicity distribution of Galactic globular clusters to infer the halo’s assembly history.
In this Letter, we use Gaia DR2 proper motions to derive the apocenter and pericenter distributions of halo stars in the Milky Way. Now with Gaia we can, for the first time, relate the orbital properties of halo stars to the broken density profile feature that was discovered almost 10 years ago.
2. Halo Stars in 7D
We construct samples of halo stars with 6D phase-space and metallicity (“7th dimension”) measurements. These comprise a local (D ≲ 5 kpc) sample of main sequence stars, and a more distant sample of blue horizontal branch (BHB) stars. In both cases, spectroscopic measurements are derived from the Sloan Digital Sky Survey (SDSS), and astrometry is taken from the newly released Gaia DR2 catalog (Gaia Collaboration et al. 2016, 2018).
2.1. Local Main Sequence Stars
We select main sequence stars from the SDSS DR9 spectroscopic catalog (Ahn et al. 2012) by applying the following cuts on color, surface gravity, and effective temperature: 0.2 < g − i < 2, 0.2 < g − r < 0.8, 3.5 < log(g) < 5, 4500 < Teff/K < 8000. We exclude from our sample stars with low signal-to-noise spectra (S/N < 10), large line-of-sight velocity errors (σRV > 50 km s−1), and high extinction (Ag > 0.5). We also restrict to Galactic latitudes  and relatively low metallicities [Fe/H] < −1 to minimize the presence of disk stars in the sample. Finally, we limit our sample to magnitudes g < 17 to ensure that we have accurate spectroscopic and astrometric measurements. The sample is cross-matched with the Gaia DR2 source catalog, resulting in N = 18,185 main sequence stars with proper motion measurements.
We estimate the stars’ distances using the relations given in Ivezić et al. (2008; their Equations (A2), (A3), and (A7)). In Figure 1 we compare these photometric parallaxes to distance estimates based on astrometric parallaxes from Gaia. Instead of simply inverting the parallax, we use the probabilistically inferred astrometric distances derived by Bailer-Jones et al. (2018). Please note that a more self-consistent, but not immediately available, approach would involve using the method described in Bailer-Jones et al. (2018) to estimate distance moduli from Gaia’s parallaxes. We find a small offset (−0.08 dex) in distance modulus between the astrometric and photometric distance estimates, and a scatter of 0.33 dex. The offset could be due to small biases in the astrometric parallaxes themselves, so we do not attempt to correct for this bias. However, it is reassuring that the photometric parallaxes can be used to measure distances to 15% with little dependence on metallicity (middle panel) or color (right panel).
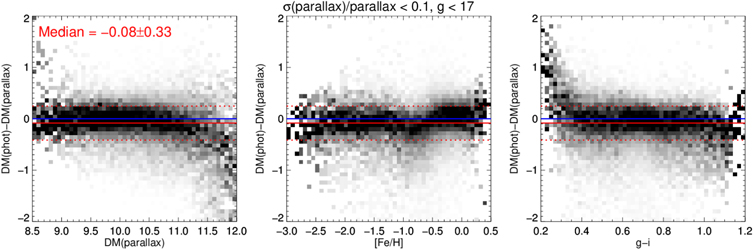
Figure 1. Distance modulus of main sequence stars estimated using photometric parallax (Ivezić et al. 2008) and Gaia astrometric parallax. Here we use the distances provided by Bailer-Jones et al. (2018), and only consider bright stars with accurate parallax measurements (≤10%). We compare the derived distance measurements as a function of distance modulus (left), metallicity (middle), and g − i color (right). Note that the density plots are column normalized. The photometric estimates agree well with the astrometric parallax estimates. There is a small offset (−0.08 dex) and 0.33 dex scatter, with little variation with distance, metallicity, or color. This comparison shows that the photometric parallax can be used to measure main sequence star distances to ∼15% accuracy.
Download figure:
Standard image High-resolution image2.2. Distant BHB Stars
To probe to further distances in the halo, we utilize the SDSS/Sloan Extension for Galactic Understanding and Exploration (SEGUE) BHB sample compiled by Xue et al. (2011). Here, we consider relatively bright (g < 17) stars in the sample, which go out to ∼20 kpc. We apply the color and metallicity dependent absolute magnitude relation derived by Fermani & Schönrich (2013) to estimate distances to the stars. We assume the distance calibration for BHBs is accurate to 5% (cf. Deason et al. 2011; Fermani & Schönrich 2013). As this calibration was only applied to stars redder than g − r > −0.4, we exclude the (small number of) very blue stars with g − r < −0.4. After cross-matching with the Gaia source catalog we obtain N = 2700 BHB stars with 7D measurements.
In Figure 2 we show the spatial distribution of our halo star samples. In what follows we assume a circular velocity of Vc = 235 km s−1 at the position of the Sun (R⊙ = 8.3 kpc), and solar peculiar motion (U⊙, V⊙, W⊙) = (11.1, 12.24, 7.25) (Schönrich et al. 2010; Reid et al. 2014).
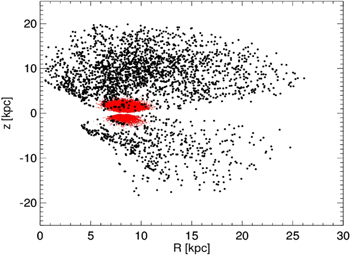
Figure 2. Spatial distribution of the main sequence (red) and BHB (black) stars in cylindrical (R, z) coordinates. Here, the Sun is located at (R, z) = (8.3, 0) kpc.
Download figure:
Standard image High-resolution image3. Orbital Properties
In this section, we derive the apocenter and pericenter distributions of our 7D halo samples. The orbits are calculated using the galpy6 software package developed by Bovy (2015). We adopt the MWPotential2014 gravitational potential, which is described in Table 1 in Bovy (2015). However, we find that our results are not significantly changed if we adopt other potentials commonly used in the literature (e.g., McMillan 2017). To propagate errors in proper motion (including covariances), line-of-sight velocity, and distance in to orbital parameters we use Monte Carlo sampling. We typically find that the apocenters and pericenters of our halo stars have uncertainties of ∼0.5 kpc and ∼1 kpc for the local and distant samples, respectively.
In Figure 3 we show the apocenter and pericenter distributions for the main sequence stars (top panels) and BHB stars (bottom panels). In the left panels we show metal-rich stars ([Fe/H] > −1.5), the middle panels show metal-poor stars ([Fe/H] < −2), and the right panels show the difference between the metal-rich and metal-poor distributions (metal-rich minus metal-poor). Here, black indicates an excess of metal-rich stars, and white indicates an excess of metal-poor stars. The comparison between metal-rich and metal-poor stars clearly shows two residuals in the metal-rich stars: (1) a disk population with eccentricity e ∼ 0, and (2) a component with high eccentricity (e ∼ 0.9). Remarkably, the latter “sausage-like” stars are seen in both the local sample of main sequence stars (cf. Belokurov et al. 2018b) and in the more distant BHB sample. Moreover, we find that the apocenters of this population are coincident with the break radius of the stellar halo.
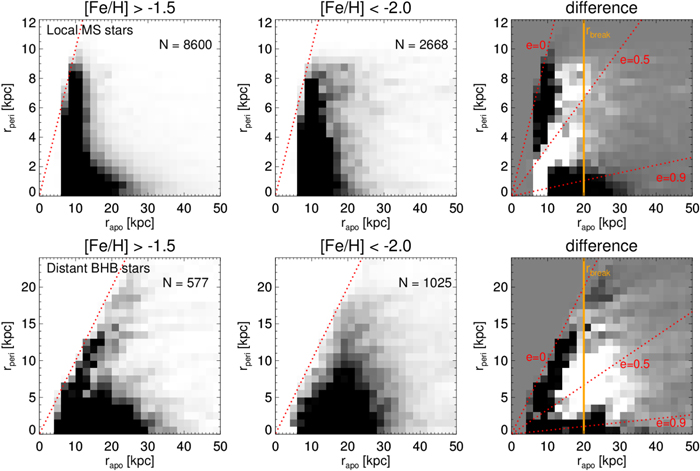
Figure 3. Apocenter and pericenter distributions of the local main sequence stars (top panels) and distant BHB stars (bottom panels). We show the 2D distributions for metal-rich ([Fe/H] > −1.5) and metal-poor ([Fe/H] < −2) stars in the left and middle panels. The metal-rich minus metal-poor difference is shown in the right panels. Here, gray indicates no difference, black is an excess of metal-rich stars, and white is an excess of metal-poor stars. Tracks of constant eccentricity (e = 0, 0.5, 0.9) are shown with the dotted red lines, and the vertical orange lines indicated the approximate break radius of the stellar halo (Deason et al. 2011). In both the local and distant samples two clear residuals stand out in the metal-rich stars: (1) the disk population with e ∼ 0 (for the BHB sample, the “disk” population is likely supplied by a small number of contaminating blue stragglers), and (2) a population with very high eccentricity (e ∼ 0.9) and apocenters coincident with the break radius—the “sausage” stars.
Download figure:
Standard image High-resolution imageThe range of apocenters ( ) of the high-eccentricity (“sausage”) stars seen in Figure 3 is related to the spread in energy of their dwarf progenitor, and the number of orbits since infall. We note that a narrow range of apocenters would suggest a very recent and/or relatively low-mass accretion event, which does not appear to be the case here (see below). In Deason et al. (2013) we show that the break radii in the Bullock & Johnston stellar halo simulations approximately correspond to the average apocenter of the stars stripped from the same progenitor (see Figure 2 of the paper). The truncation at r ∼ 25–30 kpc signifies the outermost apocenter of the debris, which have the highest energy orbits.
The average apocenter for the high-eccentricity (e > 0.9), metal-rich ([Fe/H] > −1.5) stars is 16 ± 6 kpc and 20 ± 7 kpc for the main sequence and BHB stars, respectively. Note, here the error bars give the standard deviation about the average. These average apocenters are in excellent agreement with measurements of the break radius of the Milky Way stellar halo, and thus confirm the predictions made by Deason et al. (2013).
We show examples of the orbits of the main sequence and BHB stars in Figure 4. Here, we give cases of metal-poor (blue lines) and metal-rich (red lines) stars. The local high [Fe/H] main sequence stars on highly radial orbits are very similar to the distant BHB stars—they are just at different points in the orbit. Indeed, the common apocenters shared between the more distant sample and the local sample suggest that they originate from the same progenitor.
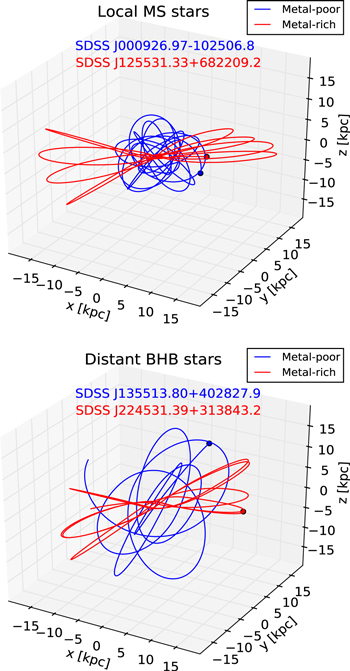
Figure 4. Example orbits in 3D (x, y, z), where the Galactic center is at (x, y, z) = (0, 0, 0). The red lines show example orbits of metal-rich stars on radial orbits, and the blue lines show metal-poor stars on more isotropic orbits.
Download figure:
Standard image High-resolution imageIn the left panel of Figure 5 we show the fraction of “sausage” stars as a function of metallicity. Here, we only use the main sequence sample, which has larger numbers and more reliable metallicity measurements. To select stars in this very radial component, we pick stars with high eccentricity (e > 0.9) and with apocenters in the range 10 <rapo/kpc < 25. When calculating the fractions, we only consider stars with eccentricity e > 0.5 in order to minimize the contribution from disk stars. Thus, we define the fraction of “sausage” stars as

Note that these fractions should not be taken as absolute as we are likely including field halo stars in the selection and, moreover, we are excluding stars belonging to the same progenitor with slightly different eccentricity. For comparison, we show these fractions for toy models with the same spatial distribution as the main sequence sample, but with an isotropic (σϕ = σθ = σr = 120 km s−1) and radially biased ( ) velocity ellipsoid.
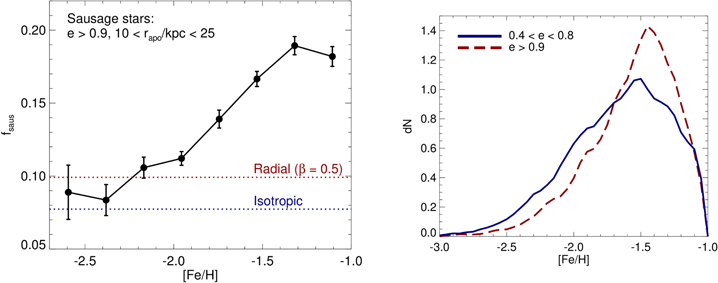
Figure 5. Left panel: fraction of main sequence stars on radial orbits (e > 0.9) with apocenters in the range 10 < rapo/kpc < 25 as a function of metallicity. Here, we only consider stars with eccentricity e > 0.5 in order to exclude disk stars. The navy blue and dark red dotted lines gives the fractions for toy models with isotropic and radial (β = 0.5) orbits, respectively. The “sausage stars” are discernible down to [Fe/H] ∼ −2, but they become more evident at higher metallicity. Right panel: metallicity distribution of high-eccentricity (e > 0.9) stars (dashed dark red line). For comparison, we show the distribution for stars with eccentricity 0.4 < e < 0.8 (solid navy blue line). The “sausage” progenitor has higher median metallicity than the average halo population ([Fe/H] = −1.5), and is likely at least as massive as the Sagittarius dSph (Mstar ≳ 108 M⊙).
Download figure:
Standard image High-resolution imageThe right panel of Figure 5 shows the metallicity distribution for high-eccentricity stars (e > 0.9), with apocenters in the range  . For comparison, the distribution for stars with 0.4 < e < 0.8 is shown with the solid blue line.
Figure 5 shows that the stars belonging to the “sausage” are discernible down to [Fe/H] ∼ −2, but they dominate at higher metallicity. This increase with metallicity indicates that the progenitor has higher [Fe/H] than the average halo ([Fe/H ∼ −1.5, e.g., An et al. 2013), which implies that it is at least as massive as the Fornax or Sagittarius dwarf spheroidals ( see e.g., Kirby et al. 2013; Gibbons et al. 2017).
4. Discussion and Conclusions
We have used Gaia DR2 proper motions and SDSS spectroscopy to measure orbital properties of stars in the stellar halo. In particular, we focus on the apocenter and pericenter distributions of the halo stars. We find that both local samples of main sequence stars and more distant samples of BHB stars have a relatively metal-rich component on very radial (e ∼ 0.9) orbits. Moreover, this “sausage-like” component has apocenters that coincide with the measured break radius of the Milky Way stellar halo.
The break radius in the Milky Way halo, beyond which the halo star counts fall off significantly more rapidly, could relate to a transition between two halo populations with different origins (e.g., Carollo et al. 2007, 2010). However, in Deason et al. (2013) we argued that this broken profile signifies the build-up of stars at apocenters, potentially deposited by a group of dwarfs at similar times or by one massive dwarf. This latter scenario has recently gained traction. In particular, Belokurov et al. (2018b) found a strongly radially biased metal-rich population in nearby main sequence stars, which they argue has been deposited by a massive dwarf galaxy. Here, we show that not only is this “sausage” population present in more distant halo samples, but their apocenters directly coincide with the stellar halo break radius. Thus, thanks to the exquisite proper motions provided by Gaia, we are able to, for the first time, directly show that the break radius is indeed the location of an apocenter pile-up. The high metallicity of this accretion event, and the influence of its apocenter on the stellar halo density profile, suggests that we have detected the most dominant progenitor of the inner stellar halo.
A.D. is supported by a Royal Society University Research Fellowship. A.D. also acknowledges the support from the STFC grant ST/P000541/1. The research leading to these results has received funding from the European Research Council under the European Union’s Seventh Framework Programme (FP/2007–2013) / ERC Grant Agreement No. 308024.
This work has made use of data from the European Space Agency (ESA) mission Gaia (https://www.cosmos.esa.int/gaia), processed by the Gaia Data Processing and Analysis Consortium (DPAC, https://www.cosmos.esa.int/web/gaia/dpac/consortium). Funding for the DPAC has been provided by national institutions, in particular the institutions participating in the Gaia Multilateral Agreement.