Abstract
PKS 1725+123 is a flat-spectrum radio quasar (FSRQ) with a redshift of z = 0.586. The detection of this object in the TeV band was reported by the MAGIC telescopes and High Energy Stereoscopic System in 2025 August. Subsequently, we promptly initiated target-of-opportunity observations using the Space-based multi-band astronomical Variable Objects Monitor (SVOM) satellite. By analyzing the observational optical data from the SVOM Visible Telescope and comprehensively examining the Fermi-LAT and Swift-XRT observational data, it was found that the source is in a high-flux state across the optical, X-ray, and GeV γ-ray bands around the time of the TeV detections. Its optical flux reaches a historically unprecedented high level and shows significant variability on timescale as short as minutes. The variability is accompanied by changes in the color index, exhibiting a bluer-when-brighter behavior during the high-flux state. Based on the simultaneous multiwavelength data, we construct the broadband spectral energy distribution (SED) of the source in the high-flux state. PKS 1725+123 demonstrates a remarkably high synchrotron peak frequency, which is distinctly different from that of other FSRQs. We propose a two-zone spine–sheath jet model to reproduce this SED. The optical–X-ray emission is generated by the synchrotron process of the relativistic electrons within a compact zone. The inverse Compton (IC) scattering processes of the same electron population contribute to the low-energy end of the Fermi-LAT spectrum, while the high-energy end of the Fermi-LAT spectrum is ascribed to the IC scattering of the synchrotron photons within the compact zone by the higher-energy electrons in an extended region.
Original content from this work may be used under the terms of the Creative Commons Attribution 4.0 licence. Any further distribution of this work must maintain attribution to the author(s) and the title of the work, journal citation and DOI.
1. Introduction
Blazars are a subclass of radio-loud active galactic nuclei (AGNs) in which the jets are nearly aligned with the line of sight (C. M. Urry & P. Padovani 1995). Blazars are further divided into flat-spectrum radio quasars (FSRQs) and BL Lacertae objects (BL Lac objects) according to the presence or absence of prominent optical emission lines (M. Stickel et al. 1991; J. T. Stocke et al. 1991). The emission of blazars, which spans the entire electromagnetic spectrum from radio to γ-ray bands, is dominated by their relativistic jets. The broadband spectral energy distributions (SEDs) of blazars usually exhibit a bimodal pattern. The low-energy hump is produced by the synchrotron radiation of relativistic electrons in the jets, while the high-energy hump is generally attributed to the inverse Compton (IC) scattering of relativistic electrons (L. Maraschi et al. 1992; C. D. Dermer & R. Schlickeiser 1993; G. Ghisellini & P. Madau 1996; M. Sikora et al. 2009; J. Zhang et al. 2012, 2014, 2015).
Blazars are characterized by violent variability in multiple wavelengths. The timescales of flux variations for blazars range from minutes to years (M.-H. Ulrich et al. 1997; M. Böttcher 2007; G. Fossati et al. 2008). In the most extreme cases, the variability timescales at γ-ray bands can be as short as a few minutes, such as in Mrk 421 (J. A. Gaidos et al. 1996), Mrk 501 (J. Albert et al. 2007), PKS 2155–304 (F. Aharonian et al. 2007), BL Lacertae (T. Arlen et al. 2013), and FSRQ PKS 1222+21 (J. Aleksić et al. 2011). Rapid and violent flux variations indicate a small and dense radiation region and particle acceleration or energy injection in extreme physical processes. The flux variations are commonly accompanied by the spectral evolutions (e.g., R.-Q. Huang et al. 2026), and the different spectral variation features may indicate distinctly dominant particle acceleration mechanisms (e.g., F. Massaro et al. 2008; A. Tramacere et al. 2011). Blazars are the confirmed primary extragalactic γ-ray-emitting objects in the GeV–TeV bands. More than 3900 blazars and blazar candidates have been reported as γ-ray-emitting sources in the 14 yr Fermi-LAT catalog (4FGL-DR4; J. Ballet et al. 2023). In particular, the majority of the detected TeV extragalactic objects are blazars; there are approximately 90 blazars in the TeVCat catalog.15 However, among these TeV blazars, fewer than 10 are FSRQs, while the remainder are BL Lac objects.
PKS 1725+123 is a γ-ray-emitting FSRQ located at a redshift of z = 0.586 (M. S. Shaw et al. 2013). On 2025 August 19, it was reported that PKS 1725+123 was detected in the very high energy (VHE) TeV band by the Major Atmospheric Gamma-ray Imaging Cherenkov (MAGIC) telescopes (D. Paneque et al. 2025). Subsequently, it was also reported to have been detected by the High Energy Stereoscopic System (H.E.S.S.; S. Wagner & H. E. S. S. Collaboration 2025). The Space-based multi-band astronomical Variable Objects Monitor (SVOM; J. Wei et al. 2016; B. Cordier et al. 2026) promptly conducted follow-up target-of-opportunity (ToO) observations. In this Letter, Section 2 describes the SVOM observations and data analysis for PKS 1725+123. Section 3 presents the SVOM observation results, together with the simultaneous observation results of Swift-XRT and Fermi-LAT. Based on the simultaneous multiwavelength observation data, Section 4 constructs and fits the broadband SED of PKS 1725+123. Section 5 provides discussion and conclusions.
2. SVOM Observations and Data Analysis
There are four detectors on board the SVOM, namely, the Gamma-Ray Burst Monitor (GRM), the ECLAIRs hard X-ray coded-mask telescope, the Multi-channel X-ray telescope (MXT), and the Visible Telescope (VT). We carried out ToO observations of PKS 1725+123 using SVOM from 2025 August 20 to 2025 September 8, before the source became inaccessible due to solar constraints. ToO observations are conducted in the framework of the SVOM observatory science program, which dedicates part of the non-Gamma-Ray Burst observation time of SVOM to the monitoring of blazars (A. Coleiro et al. 2026; A. Foisseau et al. 2026; Y.-L. Qiu et al. 2026). The SVOM-VT detector features two bands, the R band (VT_R, λ = 6500 Å, FWHM = 1300 Å) and the B band (VT_B, λ = 4500 Å, FWHM = 1000 Å), where λ = 6500 Å and λ = 4500 Å are the central wavelengths. The MXT detector (D. Götz et al. 2023) is a soft X-ray (0.3–10 keV) “lobster-eye” telescope on board the SVOM, while ECLAIRs (O. Godet et al. 2026) covers the 4–150 keV energy range.
The detailed observational orbital parameters are listed in Table 1. The target was monitored for approximately 45 minutes during each satellite orbit. The exposure time was set to 50 s for each individual image of the SVOM-VT observations. We used the Level 2 data provided by the SVOM-VT science team, which had been corrected for overscan, bias, dark current, and flat-field effects (X.-h. Han et al. 2026; Z.-H. Yao et al. 2026). All images were processed individually, and images with a median background level exceeding 300 photons pixel–1 were excluded. Aperture photometry was performed using Photutils v2.3.0 (L. Bradley et al. 2025), an Astropy package designed for the detection and photometric measurement of astronomical sources. Using an aperture-growth method, we selected the aperture radius that maximized the signal-to-noise ratio as the photometric aperture, yielding a radius of about 2.0 pixels. Given that the aperture radius employed for photometry is insufficient to encompass the total flux of sources, aperture correction was considered and derived using a 10 pixel radius aperture. For each image, all isolated sources brighter than 18 mag were measured using both aperture radii, and the mean correction was determined via an iterative process. The aperture-corrected fluxes were converted into magnitudes by employing photometric zero-points of 23.02 and 23.10 mag for the VT_R and VT_B bands, respectively. The photometric uncertainties and aperture-correction errors were propagated to estimate the final magnitudes and their uncertainties (H.-L. Li et al. 2026). Throughout this Letter, all magnitudes have been corrected for Galactic extinction. The Galactic extinction values were obtained from the NASA/IPAC Extragalactic Database16 (NED) (NASA/IPAC Extragalactic Database (NED) 2019), with values of 0.378 mag for the VT_R band and 0.632 mag for the VT_B band.
Table 1. Results of the SVOM Observations for PKS 1725+123
| VT | ||||||||
|---|---|---|---|---|---|---|---|---|
| Orbits | Start Time | End Time | Magnitudea | σb | Detailsc | |||
| (YYYY-MM-DD hh:mm) | (YYYY-MM-DD hh:mm) | R | B | R | B | R | B | |
| 1 | 2025-08-20 20:22 | 2025-08-20 21:29 | 13.661 ± 0.003 | 14.077 ± 0.003 | 2.4 | 3.9 | 7/29 | 7/28 |
| 2 | 2025-08-20 22:04 | 2025-08-20 23:06 | 13.668 ± 0.003 | 14.076 ± 0.002 | <2 | 5.6 | 7/30 | 7/30 |
| 3 | 2025-08-20 23:41 | 2025-08-21 00:43 | 13.645 ± 0.004 | 14.038 ± 0.003 | <2 | <2 | 9/31 | 9/31 |
| 4 | 2025-08-21 01:19 | 2025-08-21 02:20 | 13.713 ± 0.004 | 14.119 ± 0.003 | 3.7 | 10.1 | 7/30 | 7/30 |
| 5 | 2025-08-21 22:14 | 2025-08-21 23:22 | 14.119 ± 0.003 | 14.612 ± 0.003 | <2 | <2 | 8/43 | 8/41 |
| 6 | 2025-08-22 21:00 | 2025-08-22 22:01 | 14.409 ± 0.005 | 14.921 ± 0.003 | <2 | <2 | 8/31 | 8/31 |
| 7 | 2025-08-22 22:36 | 2025-08-22 23:38 | 14.428 ± 0.005 | 14.928 ± 0.003 | <2 | <2 | 8/29 | 8/29 |
| 8 | 2025-08-23 00:13 | 2025-08-23 01:15 | 14.453 ± 0.004 | 14.936 ± 0.003 | <2 | <2 | 7/29 | 7/28 |
| 9 | 2025-08-23 01:59 | 2025-08-23 02:52 | 14.483 ± 0.004 | 14.970 ± 0.004 | <2 | <2 | 8/28 | 8/27 |
| 10 | 2025-08-23 03:28 | 2025-08-23 04:28 | 14.507 ± 0.005 | 14.993 ± 0.004 | <2 | <2 | 7/26 | 7/27 |
| 11 | 2025-08-23 05:05 | 2025-08-23 06:05 | 14.479 ± 0.005 | 14.963 ± 0.003 | <2 | <2 | 7/30 | 7/29 |
| 12 | 2025-08-24 08:39 | 2025-08-24 09:36 | 14.274 ± 0.003 | 14.807 ± 0.003 | <2 | <2 | 9/41 | 9/41 |
| 13 | 2025-09-04 08:15 | 2025-09-04 09:18 | 14.019 ± 0.003 | 14.620 ± 0.003 | <2 | <2 | 8/41 | 8/37 |
| 14 | 2025-09-04 09:54 | 2025-09-04 10:56 | 14.044 ± 0.004 | 14.640 ± 0.003 | <2 | <2 | 9/44 | 8/41 |
| 15 | 2025-09-05 16:37 | 2025-09-05 17:39 | 13.974 ± 0.003 | 14.606 ± 0.002 | <2 | 2.6 | 9/43 | 9/44 |
| 16 | 2025-09-05 18:15 | 2025-09-05 19:17 | 13.982 ± 0.004 | 14.589 ± 0.002 | <2 | <2 | 8/45 | 8/44 |
| 17 | 2025-09-06 13:41 | 2025-09-06 14:42 | 14.112 ± 0.005 | 14.719 ± 0.003 | <2 | <2 | 8/40 | 8/41 |
| 18 | 2025-09-06 15:17 | 2025-09-06 16:19 | 14.133 ± 0.004 | 14.728 ± 0.003 | <2 | <2 | 8/42 | 8/42 |
| 19 | 2025-09-07 21:18 | 2025-09-07 22:02 | 14.190 ± 0.012 | 14.751 ± 0.014 | <2 | <2 | 6/21 | 5/18 |
| 20 | 2025-09-08 17:26 | 2025-09-08 18:27 | 14.380 ± 0.005 | 14.990 ± 0.003 | <2 | <2 | 8/44 | 8/44 |
| 1–20d | 2025-08-20 20:22 | 2025-09-08 18:27 | 14.040 ± 0.001 | 14.607 ± 0.001 | 219.8 | 282.3 | ⋯ | ⋯ |
| 1–4d | 2025-08-20 20:22 | 2025-08-21 02:20 | 13.669 ± 0.001 | 14.078 ± 0.001 | 12.5 | 20.6 | ⋯ | ⋯ |
| 6–11d | 2025-08-22 21:00 | 2025-08-23 06:05 | 14.460 ± 0.002 | 14.950 ± 0.001 | 13.1 | 14.3 | ⋯ | ⋯ |
| MXT and ECLAIRs | ||||||||
| ObsID | Start Time | End Time | Exposure | Flux | ||||
| (YYYY-MM-DD hh:mm) | (YYYY-MM-DD hh:mm) | MXT | ECLAIRs | MXTe | ECLAIRsf | |||
| (s) | (10−12 erg cm−2 s−1) | |||||||
| 1426069493 | 2025-08-20 20:50 | 2025-08-21 02:56 | 9443 | 2687 | <3.57 | <780.7 | ||
| 1140856858 | 2025-08-21 22:21 | 2025-08-21 23:58 | 2353 | 921 | <7.20 | <1155.9 | ||
| 1426069534 | 2025-08-22 21:01 | 2025-08-23 06:43 | 13914 | 4723 | <2.82 | <410.5 | ||
| 1140856867 | 2025-08-24 08:37 | 2025-08-24 10:15 | 2337 | 1321 | <7.29 | <779.2 | ||
| 1140856959 | 2025-09-04 08:18 | 2025-09-04 11:32 | 4741 | 2235 | <5.48 | <570.5 | ||
| 1140856964 | 2025-09-05 16:39 | 2025-09-05 19:53 | 4752 | 4922 | <5.26 | <450.3 | ||
| 1140856967 | 2025-09-06 13:41 | 2025-09-06 16:55 | 4753 | 4225 | <5.91 | <392.2 | ||
| 1140856972 | 2025-09-07 20:26 | 2025-09-07 22:03 | 2375 | 1046 | <7.28 | <1800.2 | ||
| 1140856974 | 2025-09-08 17:28 | 2025-09-08 19:05 | 2373 | 2116 | <7.53 | <662.2 | ||
Notes. aThe weighted-mean magnitudes and errors for each orbit, which have been corrected for Galactic extinction, specifically 0.378 mag in the R band and 0.632 mag in the B band. The data analysis uses a time bin of 5 minutes. bThe significance level of variability for each orbit's observational data. cThe left numbers indicate the number of detection points with a time bin of 5 minutes, while the right numbers indicate the number of valid images for that orbit observation. d“1–20” corresponds to all the SVOM-VT observation data in Figure 1, while “1–4” and “6–11” correspond to the consecutive four-orbit and six-orbit observations in Figure 2, respectively. eThe 3σ upper limit of the MXT flux in the 0.3–10 keV energy band. fThe 3σ upper limit of the ECLAIRs flux in the 4–150 keV energy band.
Download table as: ASCIITypeset image
The MXT observed PKS 1725+123 a total of nine times from 2025 August 20 to 2025 September 8. Intervals affected by stray light, Earth occultations, and passages of the satellite through the South Atlantic Anomaly were excluded, and the net exposure times for each observation are listed in Table 1. The event-mode data were processed with the MXT pipeline v1.13 (P. Maggi et al. 2026).
The information regarding the ECLAIRs observations is also presented in Table 1. The reduction and analysis of ECLAIRs data for PKS 1725+123 were performed using the ECLAIRs pipeline (A. Goldwurm et al. 2026), which enables both imaging and spectroscopic analysis from event data. As a first step, good time intervals (GTIs) were selected based on satellite attitude stability and instrumental conditions. Calibrated detector-plane images were then generated in a series of energy bins between 4 and 30 keV. Detector images in several broad energy bins were spatially deconvolved using the coded-mask pattern to produce sky images. A point-source extraction algorithm was subsequently applied to the sky images to fit the positions of all sources within the field of view.
3. Results
3.1. SVOM-VT
We produced the SVOM-VT light curves of PKS 1725+123 in both the VT_R and VT_B bands with a time bin of 5 minutes, as shown in Figure 1. The source exhibits significant variability on daily timescales during the SVOM-VT observations. The brightness of PKS 1725+123 in both the VT_R and VT_B bands declines significantly from 2025 August 20 to August 23, then increases, and subsequently decreases again on 2025 September 5. The brightest magnitude is 13.62 ± 0.01 mag in the VT_R band and 14.02 ± 0.02 mag in the VT_B band observed on 2025 August 20. The brightness variation of the source is approximately 0.89 mag in the VT_R band and approximately 0.98 mag in the VT_B band from August 20 to August 23.
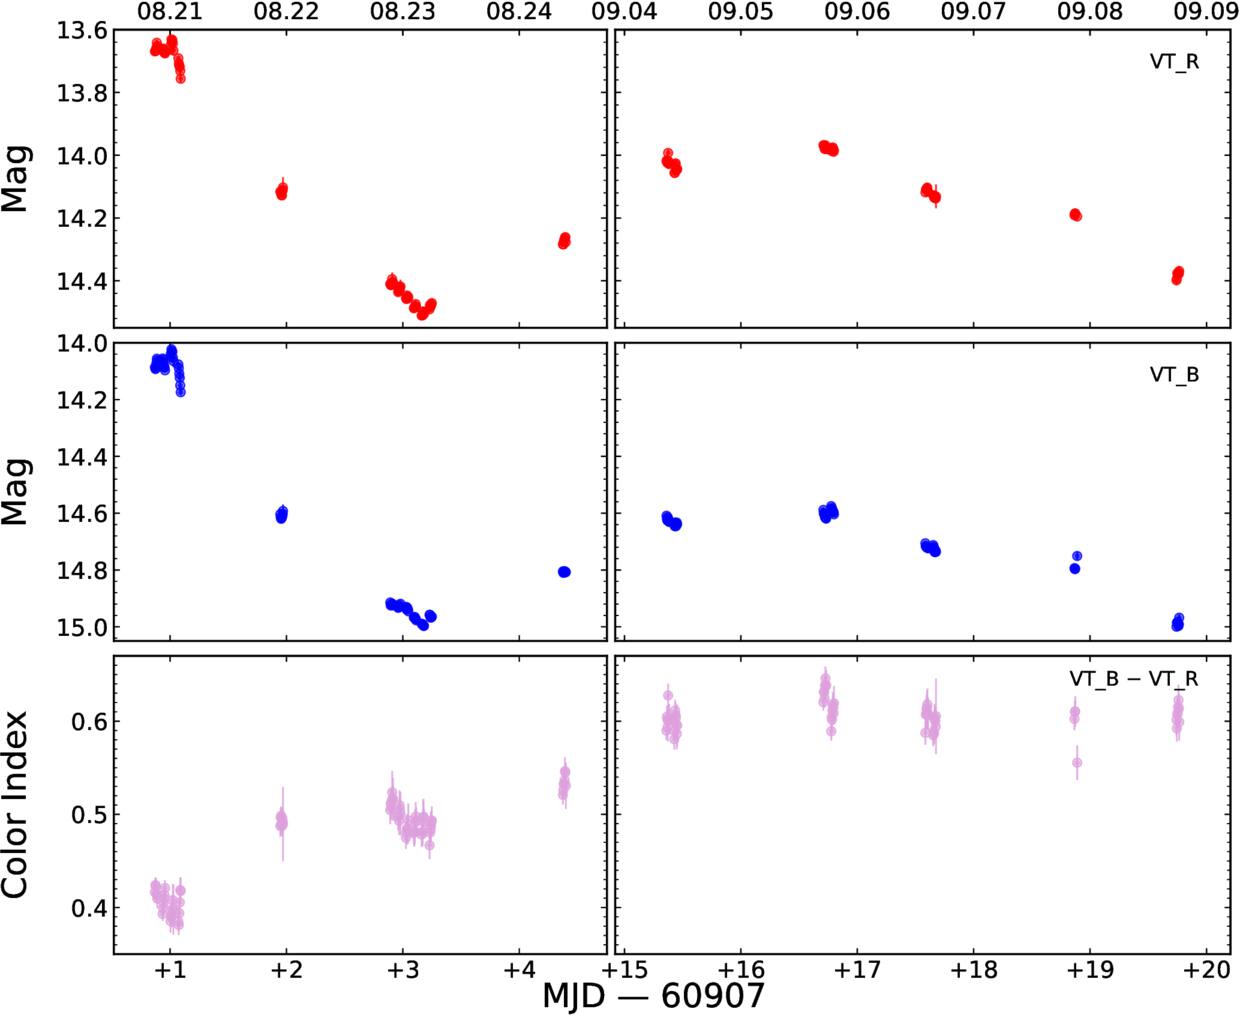
Figure 1. Light curves of magnitudes observed by SVOM-VT in the VT_R (top panel) and VT_B (middle panel) bands for PKS 1725+123, along with the color index curve (bottom panel). The data analysis for each orbit observation uses a 5 minute time bin. The first SVOM-VT observation for the source was carried out on 2025 August 20 (MJD 60907).
Download figure:
Standard image High-resolution imageTo quantify the significance of variability, a weighted mean flux 〈F〉 is estimated using (M. A. McLaughlin et al. 1996)

where N is the number of data points and Fi and σi are the flux and its error for the ith data point. We assume a constant flux of 〈F〉 and subsequently calculate the χ2 value by

and the associated probability p(χ2) = 1 − p(>χ2). The results indicate that the significance of the variability in both the VT_R and VT_B bands far exceeds the 5σ confidence level, with the estimated values of p(>χ2) being considerably lower than 5.7 × 10⁻⁷.
To investigate whether PKS 1725+123 exhibits significant variability on hourly timescales, we reproduce the VT light curves obtained from several consecutive orbital observations conducted within a 24 hr period. As shown in Figure 2, there are two observation epochs: consecutive four-orbit observations from August 20 to August 21 and consecutive six-orbit observations from August 22 to August 23. The data analysis uses a time bin of 5 minutes. Using Equations (1) and (2), we estimate the significance of variability for these light curves. The results indicate that the source exhibits significant variability on hourly timescales during both observation epochs in both the VT_R and VT_B bands, with a confidence level far exceeding 5σ. The weighted mean flux 〈F〉 for each observation epoch is also presented as dashed lines in Figure 2.
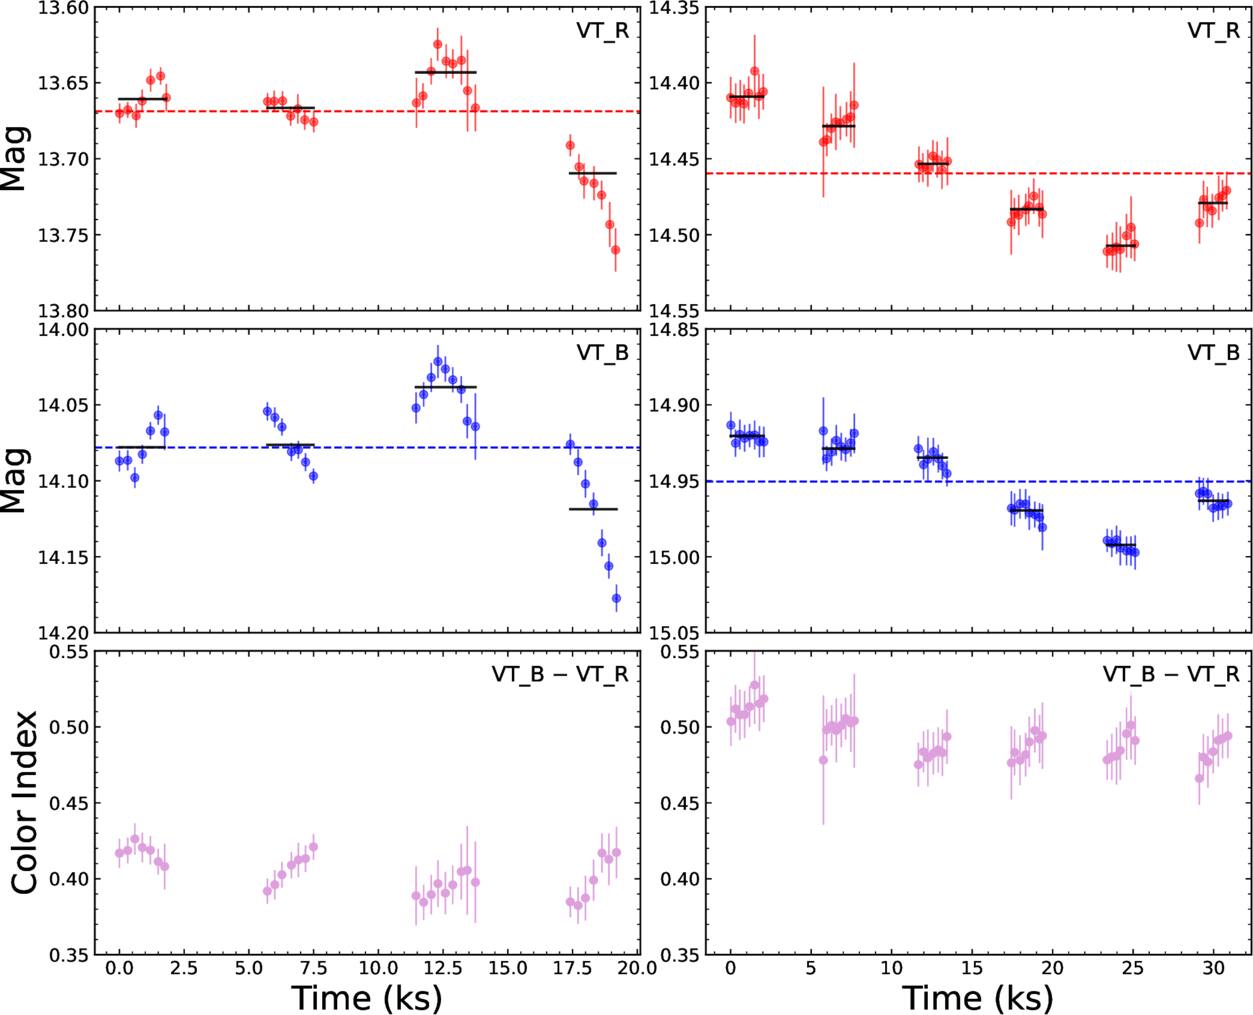
Figure 2. The partial zoom-out of Figure 1. Only the data from the consecutive four-orbit observations conducted on 2025 August 20–21 (left panels) and the consecutive six-orbit observations conducted on 2025 August 22–23 (right panels) are presented. The time bin of the data points is also 5 minutes, the same as in Figure 1. The horizontal dashed lines indicate the weighted-mean magnitude for the consecutive four-orbit (and six-orbit) observations, derived using Equation (1). The horizontal black solid lines denote the weighted-mean magnitude for each individual orbit observation.
Download figure:
Standard image High-resolution imageWe further assess the significance of variability for each orbit observation, as presented in Table 1. The data analysis also uses a time bin of 5 minutes. The results suggest that the source shows significant variability with a confidence level exceeding 5σ in the VT_B band during the second and fourth orbit observations on August 20–21, as displayed in Figure 2. In contrast, there is no variability during the second orbit observation and variability with a 3.5σ confidence level during the fourth orbit observation in the VT_R band. Evidently, the variability of PKS 1725+123 in the optical band can be as short as several minutes. Nevertheless, no significant (>5σ) variability is observed for the remaining orbit observations.
The time evolution of the color index is also presented in Figures 1 and 2, where the color index is defined as the magnitude in the VT_B band minus that in the VT_R band. It can be observed that the color index, which accompanies the magnitude variation, also exhibits evident variation on daily timescales (Figure 1), with a confidence level exceeding 5σ. Subsequently, we plot the color index versus the magnitudes in both the VT_R and VT_B bands for all the observational data, as displayed in Figures 3(a) and (b). It appears that the data are distributed into two different clusters. Considering the uncertainties associated with both the color index and the magnitude, we use the bootstrap method (B. Efron 1979) to estimate the correlation coefficient (r) between the color index and the magnitude. We obtain r = −0.78 ± 0.05 and r = 0.10 ± 0.17 when the VT_R magnitude values are higher (fainter) and lower (brighter) than 13.8 mag, respectively. Similarly, we obtain r = −0.61 ± 0.08 and r = 0.45 ± 0.11 when the VT_B magnitude values are higher (fainter) and lower (brighter) than 14.2 mag, respectively. These results likely indicate a redder-when-brighter (RWB) trend for the source if it is fainter than 13.8 mag in the VT_R band (or 14.2 mag in the VT_B band).
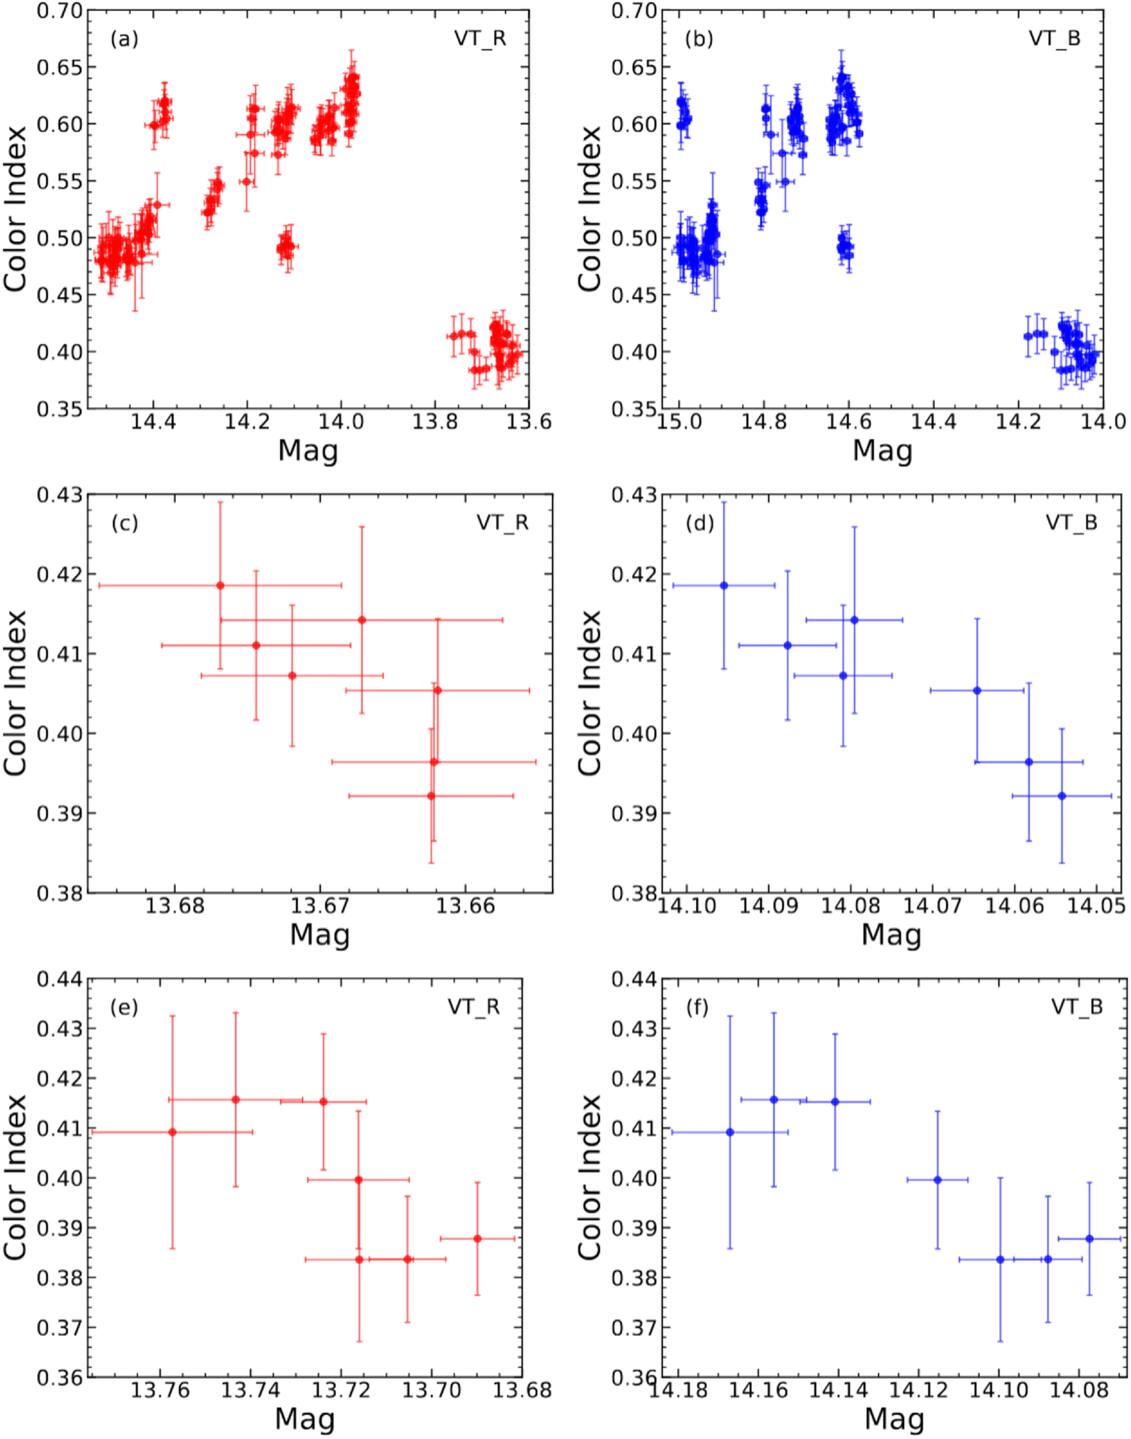
Figure 3. Color index versus magnitude in both the VT_R (left panels) and VT_B (right panels) bands for PKS 1725+123. Panels (a) and (b) show all the SVOM-VT observational data, identical to those in Figure 1. Panels (c) and (d) present the observational data from the second orbit of the consecutive four-orbit observations conducted on 2025 August 20–21. Panels (e) and (f) illustrate the observational data from the fourth orbit of the consecutive four-orbit observations conducted on 2025 August 20–21.
Download figure:
Standard image High-resolution imageNote that the points with magnitudes brighter than 13.8 mag in the VT_R band (or 14.2 mag in the VT_B band) in Figure 3(a) (or Figure 3(b)) correspond to the data from the first four orbit observations shown in Figure 1 (and to the left panels in Figure 2). Therefore, we further estimate the correlation coefficient between the color index and the magnitude for each of the four orbit observation datasets. The bootstrap analysis yields r = 0.78 ± 0.18 (r = 0.93 ± 0.09 for VT_B) and r = 0.74 ± 0.18 (r = 0.90 ± 0.14 for VT_B) for the VT_R observation data of the second (Figures 3(c) and (d)) and fourth (Figures 3(e) and (f)) orbits, whereas no correlation is observed for the remaining two orbit observations. Clearly, the source exhibits a bluer-when-brighter (BWB) behavior during the second and fourth orbital observations.
3.2. SVOM-MXT and SVOM-ECLAIRs
The source was not significantly detected in the SVOM-MXT observations. We thus assume an absorbed power-law (PL) spectrum with a Galactic column density of NH = 8.64 ×1020 cm−2 (HI4PI Collaboration et al. 2016) and a photon index of ΓX = 2.0 to compute the 3σ upper limits of the flux in the 0.3–10 keV energy band. To provide a representative constraint across all pointings, we calculated a weighted-average upper limit of 4.7 × 10⁻¹² erg cm−2 s−1, where the weighting accounts for the exposure time of each observation.
No significant emission was detected by SVOM-ECLAIRs during the observational campaign. Therefore, the 3σ upper limits of the flux were calculated for each individual observation using the variance maps produced by the ECLAIRs pipeline. A 3σ weighted-average upper limit of the flux in the 4–150 keV energy band, which accounts for the exposure duration of each pointing, was finally computed as 5.8 × 10⁻¹⁰ erg cm−2 s−1, assuming an E−2 PL spectrum.
3.3. Swift-XRT
We also conduct an analysis of the X-ray observational data of the source from Swift-XRT. The data reduction procedure of the Swift-XRT observations is described in Appendix A.1. We derive the X-ray light curves of PKS 1725+123 in the 0.3–2 keV (F0.3−2), 2–10 keV (F2−10), and 0.3–10 keV (F0.3−10) bands, along with the temporal curves of the photon index (ΓX) and hardness ratio (HR; i.e.,  ), as displayed in Figure 4.
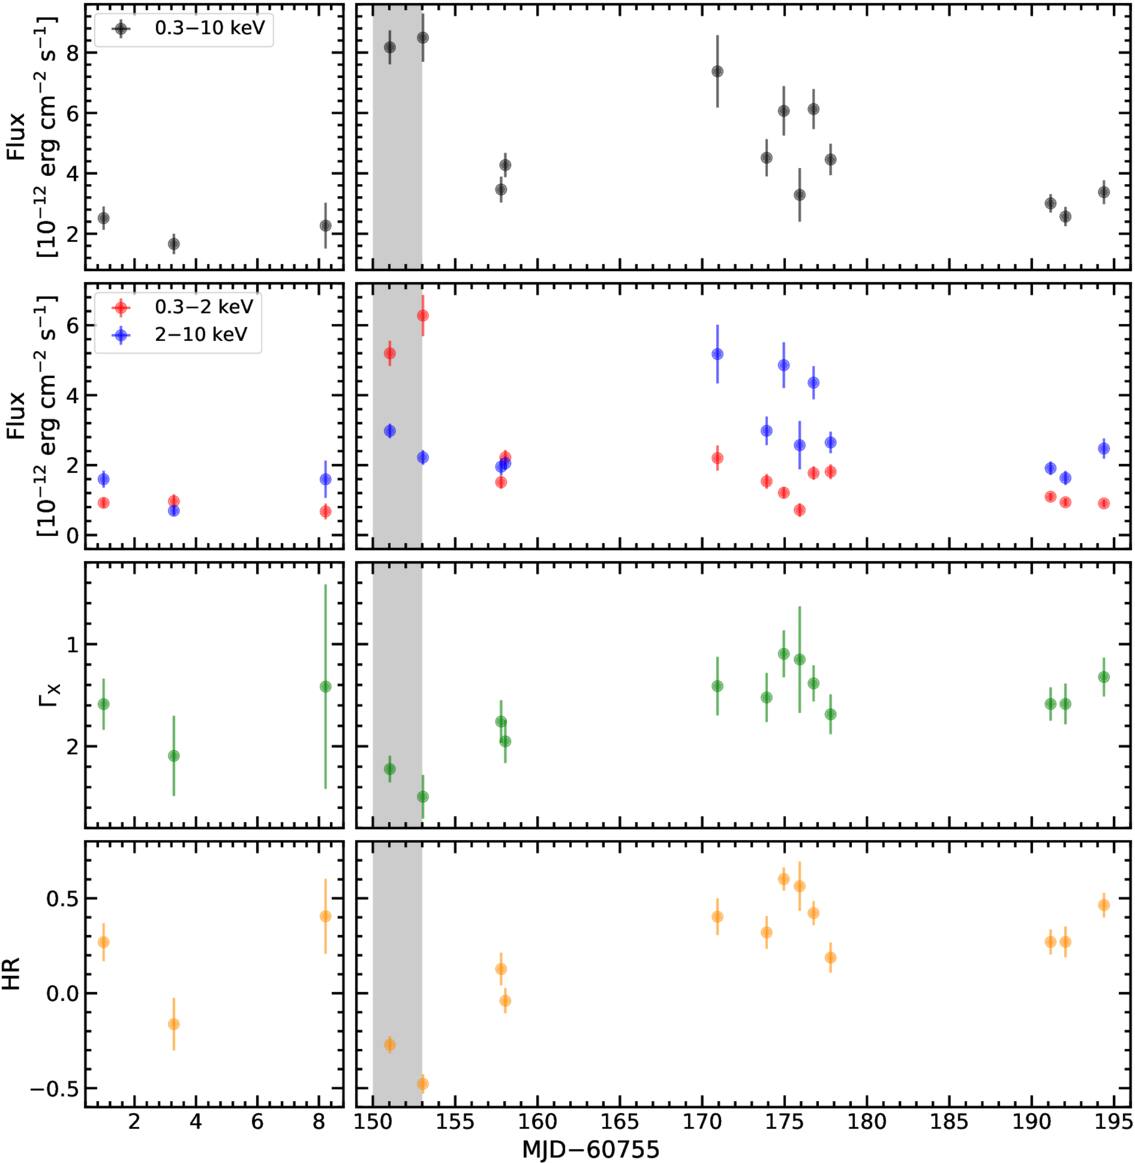
Figure 4. Swift-XRT observations for PKS 1725+123. Light curves of F0.3−10 (black points in the first panels), F0.3−2 (red points in the second panels), F2−10 (blue points in the second panels), Γγ (green points in the third panels), and the HR (orange points in the fourth panels) are respectively depicted. The gray shaded area indicates the quasi-simultaneous observations (on August 19 and 21) corresponding to the TeV detections. The left panels show the three historical Swift-XRT observations, while the right panels display the Swift-XRT follow-up observations of the TeV detection for the source. MJD 60755 corresponds to 2025 March 21.
Download figure:
Standard image High-resolution imageThe light curves of F0.3−2, F2−10, and F0.3−10 for PKS 1725+123 exhibit significant variability at a confidence level exceeding 5σ. It should be noted that, based on the Swift-XRT observations, the source on 2025 August 19 and August 21 (two data points within the shaded region) is in a historically high-flux state. This state coincides with the VHE detections and the highest SVOM-VT flux observations.
It is noteworthy that the value of F0.3−10 seems to increase from 2025 August 19 to 21 (two data points within the shaded region). In contrast, the spectrum becomes softer. Five days later, on 2025 August 25 and 26, the flux declines to approximately half of that on 2025 August 21 but with a harder spectral index. Notably, for almost all observations, the flux in the 0.3–10 keV band is predominantly determined by the value of F2−10, with the exception of the two observations that are concurrent with the VHE detections, as shown in the second panel from the top of Figure 4. In other words, the observed decrease in flux from 2025 August 21 to August 25 is mainly attributed to the decline in flux in the soft 0.3–2 kev energy band.
3.4. Fermi-LAT
The FSRQ PKS 1725+123 has been detected in the GeV γ-ray band by Fermi-LAT, and it is associated with the γ-ray source 4FGL J1728.0+1216 (J. Ballet et al. 2023). Therefore, we conduct an analysis of the 17 yr Fermi-LAT observational data for this source. The data reduction procedure is described in Appendix A.2.
The 17 yr integrated spectrum of PKS 1725+123 in the 0.1–1000 GeV band requires a log-parabola (LP) model for adequate explanation, with a photon spectral index of Γγ =2.16 ± 0.03 and a curvature parameter of β = 0.05 ± 0.01, as presented in Figure 5. We generate the 17 yr Fermi-LAT light curve in the 0.1–1000 GeV band with a time bin of 30 days, as shown in Figure 7(a) in Appendix A.2. The γ-ray emission of the source remains nearly in a low and stable flux state prior to MJD 60353 (2025 February 12), after which the γ-ray flux increases, particularly during 2025 August. To further explore the flux state and the variability features in the GeV band before and after the TeV detection, we produce the light curve with a time bin of 1 day from 2025 July 6 (MJD 60862) to 2025 October 1 (MJD 60949), as shown in Figure 7(b) in Appendix A.2. Nevertheless, no significant variability is detected in the 3 month light curve despite the source being in a high-flux state.
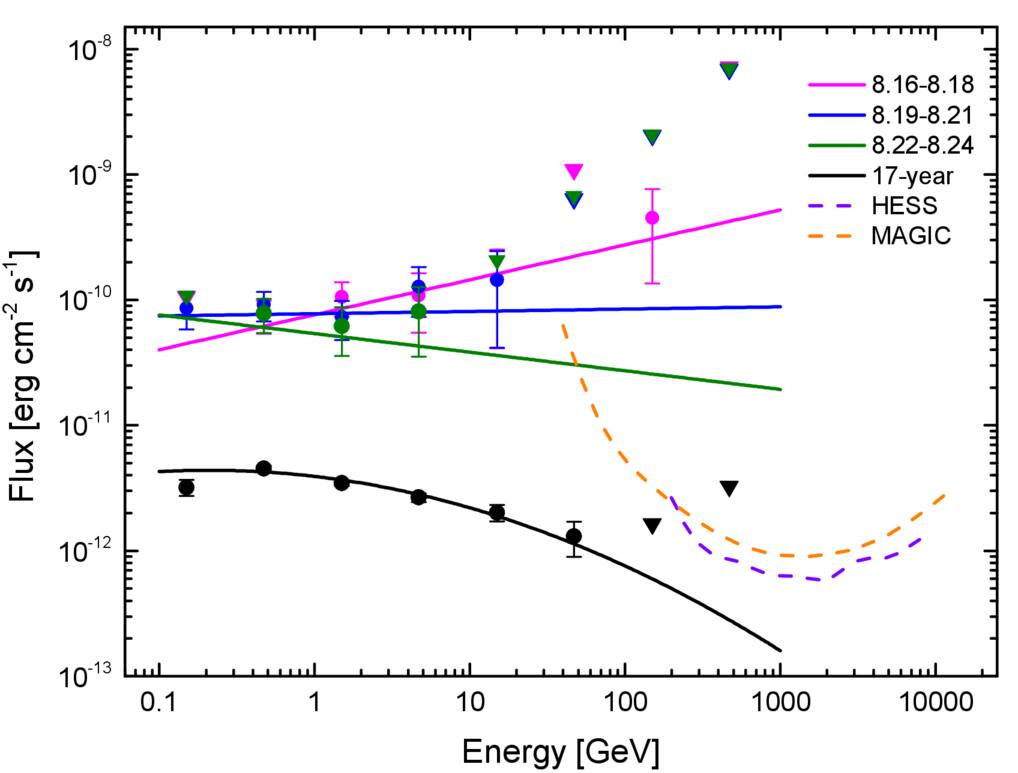
Figure 5. Spectra observed by Fermi-LAT for PKS 1725+123, including the 17 yr integrated spectrum (black symbols) and the three time-resolved spectra in the following time intervals: 2025 August 16–18 (magenta symbols), August 19–21 (blue symbols), and August 22–24 (green symbols). The corresponding colored solid lines represent the fitting results. If TS < 4, an upper limit (denoted by inverted triangles) is given for that energy bin. The sensitivity curves of the MAGIC telescopes (orange dashed line; 50 hr) and H.E.S.S. (purple dashed line; 50 hr) are also given in the figure.
Download figure:
Standard image High-resolution imageUsing the gtsrcprob tool, we estimated the maximum energy of photons detected during the entire 17 yr Fermi-LAT observation. The maximum energy of the detected photons is 103 GeV, detected on 2025 August 17 (MJD 60904), with a probability exceeding 99%. To investigate the spectral variation feature of PKS 1725+123 in the GeV band during the high-flux state in the optical band, we perform a time-resolved spectral analysis for the Fermi-LAT observational data in the following time intervals: 2025 August 16–18 (MJD 60903–60905), August 19–21 (MJD 60906–60908), and August 22–24 (MJD 60909–60911). The results of the spectral analysis are also presented in Figure 5. The three time-resolved spectra can be well modeled by a simple PL function with a flatter photon spectral index than that of the 17 yr integrated spectrum. As illustrated in Figure 5, minor flux variations are observed at the high-energy end among the three time-resolved spectra, and the spectrum appears to soften from August 16 to August 24. Specifically, the flux is (2.45 ± 1.77) × 10−9 erg cm−2 s−1 with Γγ = 1.72 ± 0.12 during August 16–18, (7.47 ± 2.97) × 10−10 erg cm−2 s−1 with Γγ = 1.98 ± 0.14 during August 19–21, and (6.10 ± 1.77) ×10−10 erg cm−2 s−1 with Γγ = 2.15 ± 0.50 during August 22–24. It seems that PKS 1725+123 demonstrates a harder-when-brighter trend in the GeV band.
4. SED Constructing and Modeling
As stated in Section 3.4, a hard Fermi-LAT spectrum is observed for PKS 1725+123 during the TeV detection. Moreover, a high-energy photon of 103 GeV is detected on 2025 August 17 (MJD 60904). We present the sensitivity curves of the MAGIC telescopes (50 hr) and H.E.S.S. (50 hr) in Figure 5. The sensitivity curves are taken from J. Aleksić et al. (2016) and M. Holler et al. (2015), respectively. The high-energy end of the time-resolved spectrum during August 16–18 exceeds the sensitivity curves of the MAGIC telescopes and H.E.S.S. To further investigate the γ-ray emission property and radiation mechanisms of PKS 1725+123 in multiple wavelengths, we construct its broadband SED in the high-flux state, as illustrated in Figure 6. The average flux in both the VT_R and VT_B bands, observed by SVOM-VT on 2025 August 20–21 (the first consecutive four-orbit observations); the average spectrum of two Swift-XRT observations on 2025 August 19 and 21; and the time-resolved Fermi-LAT spectrum on 2025 August 16–18 are considered as the data for the high-flux state. The data in the low-energy band from the NED, the average spectrum of the first three Swift-XRT observations (left panels in Figure 4), and the 17 yr Fermi-LAT average spectrum are also presented in Figure 6 for comparison. It should be noted that the broadband SED of the source in the high-flux state exhibits significant differences from that of the average-flux state (gray symbols in Figure 6), showing obvious variability and spectral variation in multiple wavelengths.
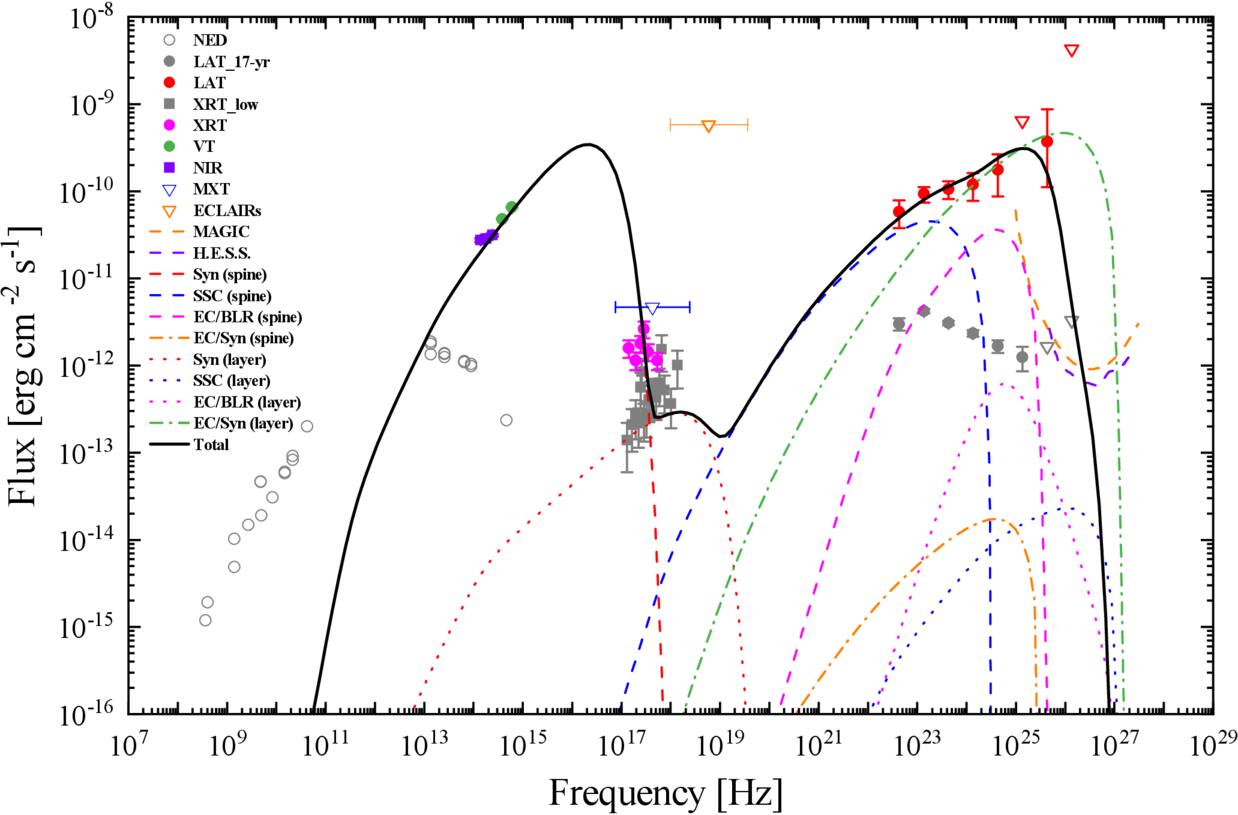
Figure 6. Observed SED with model fitting for PKS 1725+123 in the high-flux state. The three near-infrared points (purple filled squares) taken from L. Carrasco et al. (2025), the average flux (two green filled circles) from the consecutive four-orbit SVOM-VT observations on 2025 August 20–21, the average spectrum from two Swift-XRT observations (magenta filled circles) on 2025 August 19 and 21 (shaded region in Figure 4), the weighted-average 3σ upper limit of the flux observed by SVOM-MXT (blue open inverted triangle) and SVOM-ECLAIRs (orange open inverted triangle), and the Fermi-LAT time-resolved spectrum (red filled circles and open inverted triangle) from 2025 August 16–18 collectively constitute the SED of the source in the high-flux state. The black solid line (including EBL absorption) represents the total emission model, including synchrotron radiation (red lines), the SSC process (blue lines), and the EC/BLR process (magenta lines), where the dashed and dotted lines denote emission from the spine and sheath regions, respectively. The green dashed–dotted line indicates the IC component (without EBL absorption) of the synchrotron photons in the spine zone by the relativistic electrons in the sheath region, while the flux contribution from the opposite process is depicted as the orange dashed–dotted line. For comparison, the NED archived radio–optical data (gray open circles), the average spectrum (gray filled squares) from the first three Swift-XRT observations (left panels in Figure 4), and the 17 yr Fermi-LAT integrated spectrum (gray filled circles and open inverted triangles) are presented. The sensitivity curves of the MAGIC telescopes (orange dashed line; 50 hr) and H.E.S.S. (purple dashed line; 50 hr) are also given in the figure.
Download figure:
Standard image High-resolution imageA two-zone leptonic model is used to reproduce the broadband SED of PKS 1725+123. This model bears a resemblance to the morphology model of Mrk 421 presented by MAGIC Collaboration et al. (2025), in which the Doppler factor (δ) for both the extended and compact zones is fixed at 60. Nevertheless, it more closely resembles a structured spine–sheath jet model (e.g., G. Ghisellini et al. 2005; F. Tavecchio & G. Ghisellini 2008a). Specifically, a compact zone with a large bulk Lorentz factor (Γ) is situated at the center of an extended region with a small value of Γ. Due to plasma instability, magnetic reconnection may occur to accelerate the electrons within the compact zone (e.g., K. Nalewajko et al. 2011; D. Giannios 2013; M. Petropoulou et al. 2016), leading to high flux with rapid variability. Meanwhile, the relativistic electrons within the compact region propagate outward and traverse the jet shear layer, which is the transitional zone between the spine and the sheath. Here, the relativistic electrons are accelerated once again by the shear acceleration process (e.g., R.-Y. Liu et al. 2017; F. M. Rieger 2019; L. Sironi et al. 2021). It is assumed that both zones are located within the broad-line regions (BLRs), yet they are in proximity to the outer boundary of the BLRs. Therefore, the synchrotron, synchrotron self-Compton (SSC), and external Compton (EC) scattering of the photons from BLR (EC/BLR) processes of the relativistic electrons in both regions are taken into account to reproduce the broadband SED of the source. Given that the two regions overlap, the interaction between the two zones results in additional emission as they provide an extra target photon field for IC scattering for each other, the contribution of which is also considered. For more details regarding the model assumptions and parameter sets, please refer to Appendix B.1.
The fitting result is presented in Figure 6. The synchrotron radiation of relativistic electrons within the compact zone produces the optical–X-ray emission, which is also consistent with the short-timescale variability observed by SVOM-VT and the absence of high-energy photons during the Swift-XRT observations. The low-energy end of the Fermi-LAT spectrum is attributed to the SSC+EC/BLR processes of this electron population, whereas the high-energy end of the Fermi-LAT spectrum results from the IC scattering of synchrotron photons from the compact zone by relativistic electrons within the extended region. It can be observed that the intrinsic spectrum in the γ-ray band is very hard (represented by the green dashed–dotted line) and significantly surpasses the sensitivity curves of the H.E.S.S. and MAGIC telescopes. After accounting for the extragalactic background light (EBL) absorption (J. D. Finke et al. 2022), the model-predicted flux (represented by the black solid line) at the VHE band still exceeds the sensitivity curves of the H.E.S.S. and MAGIC telescopes, which is consistent with the MAGIC and H.E.S.S. detections (D. Paneque et al. 2025; S. Wagner & H. E. S. S. Collaboration 2025). Additionally, the SVOM-VT data, in combination with the Swift-XRT spectrum, suggest a very high synchrotron peak frequency for PKS 1725+123, which is distinctly different from that of previously γ-ray-detected FSRQs (e.g., J. Zhang et al. 2014, 2015; M. Petropoulou & S. Dimitrakoudis 2015; S. Maurya et al. 2025; A. K. Mohana et al. 2025).
5. Discussion and Conclusions
It was reported that FSRQ PKS 1725+123 was detected for the first time in the VHE band by the MAGIC and LST-1 telescopes on the night of 2025 August 18–19 (D. Paneque et al. 2025) and by H.E.S.S. on the night of 2025 August 19–20 (S. Wagner & H. E. S. S. Collaboration 2025). Following these reports, SVOM performed a ToO monitoring campaign of the source from 2025 August 20 to 2025 September 8. SVOM-VT observations indicate that the source brightness reaches 13.62 ± 0.01 mag in the VT_R band and 14.02 ± 0.02 mag in the VT_B band on 2025 August 20. This may represent a historical optical light maximum and is brighter than the value of R = 14.21 ± 0.02 mag (perhaps without accounting for Galactic extinction) on 2025 August 19, reported by S. Guziy et al. (2025). Moreover, significant variability is observed on a timescale of less than 1 hr, on the order of several minutes. Considering the rapid and intense variability, along with the follow-up very high optical polarization measurement (∼35% in the R band) on 2025 September 15 (R. Bachev 2025), the observed optical flux of the source should be dominated by jet radiation rather than its host galaxy.
As presented in Figure 3, the variation in optical brightness is accompanied by the change of the color index. Both the RWB and BWB trends are a prevalent phenomenon in some FSRQs (e.g., M. Villata et al. 2006; C. M. Raiteri et al. 2017; O. Vince et al. 2025). In low-flux states, sources generally display the RWB trend, which is interpreted as the increasing relative contribution from the accretion disk thermal emission when the jet radiation fades. In contrast, when the sources are in high-flux states, they exhibit an obvious BWB trend, which is also a commonly observed behavior in numerous BL Lac objects (A. Wierzcholska et al. 2015). This phenomenon is typically attributed to the dominant emission from the relativistic jets. Fundamentally, it may be related to the injection or reacceleration of electrons within the jets (e.g., J. G. Kirk et al. 1998; M. Sikora et al. 2001; A. Mastichiadis & J. G. Kirk 2002; O. Vince et al. 2025). The FSRQ PKS 1725+123 exhibits strongly chromatic short-timescale changes and significant BWB behavior in the high-flux state during the SVOM-VT monitoring, as presented in Figures 2 and 3. This phenomenon is due to energetic processes occurring in the jet (e.g., O. Vince et al. 2025).
Based on Swift-XRT observations, the X-ray emission of the source is also in a high-flux state (Figure 4) during its optical high-flux state. However, different from the chromatic behavior of BWB in the optical band, the simultaneously observed X-ray emission of PKS 1725+123 displays a softer-when-brighter trend, as shown in Figure 4. This characteristic is also entirely different from the observed X-ray features in high-synchrotron-peaked BL Lac objects. These sources generally exhibit the harder-when-brighter behavior in the X-ray band, such as Mrk 421 (A. Tramacere et al. 2009; L. Di Gesu et al. 2022), PKS 2155–304 (X.-K. Hu et al. 2024a), Mrk 501 (X.-K. Hu et al. 2024b), and H1426+428 (X.-K. Hu et al. 2025), which is usually interpreted as the injection of high-energy electrons into the emission region (J. G. Kirk et al. 1998; L. Di Gesu et al. 2022; H.-Q. Zhang et al. 2024). Within the framework of the leptonic jet radiation model, the X-ray emission of FSRQs is generally ascribed to the IC scattering process (e.g., J. Zhang et al. 2014, 2015). It should be noted that the X-ray emission from PKS 1725+123 observed on 2025 August 19–21 is in a high-flux state with a soft spectrum, as illustrated in Figure 4. The soft X-ray spectrum of the source may be due to the synchrotron tail extending into the soft X-ray band during a flare, resulting in a softer spectrum as the source brightens.
Although the γ-ray emission of PKS 1725+123 is in a high-flux state during 2025 August, no significant variability is observed on a daily timescale, as depicted in Figure 7(b) in Appendix A.2. A high-energy photon of 103 GeV is detected on 2025 August 17 by Fermi-LAT. Given the limited sensitivity to resolve the spectrum of PKS 1725+123 below daily timescales and the low variability in this wave band, we generated the 3 day interval spectra around the TeV detection time, including three time intervals: 2025 August 16–18 (MJD 60903–60905), August 19–21 (MJD 60906–60908), and August 22–24 (MJD 60909–60911), as presented in Figure 5. A harder-when-brighter trend in the GeV band is displayed during the observations of the three time intervals. This spectral evolution characteristic in the γ-ray band has been observed in some FSRQs (e.g., A. A. Abdo et al. 2010; H.-M. Zhang et al. 2018, 2020a). According to the fitting results of the three time-resolved spectra, we extrapolate the flux into the VHE band, which exceeds the sensitivity curves of the H.E.S.S. and MAGIC telescopes. This is consistent with the reported TeV detections (D. Paneque et al. 2025; S. Wagner & H. E. S. S. Collaboration 2025).
Although we are unable to quantify the potential correlation of variability among the optical, X-ray, and GeV γ-ray bands due to the lack of simultaneous and continuous monitoring data in multiple wavelengths, these results suggest that the radiations of PKS 1725+123 in the optical, X-ray, and GeV γ-ray bands are likely correlated. Based on these factors, we construct the broadband SED of PKS 1725+123 in the high-flux state and model it using a two-zone spine–sheath jet model. We hypothesize that the electrons may be accelerated by magnetic reconnection within a compact zone (e.g., K. Nalewajko et al. 2011; D. Giannios 2013; M. Petropoulou et al. 2016), resulting in the high flux and rapid variability observed in the optical band. This is also consistent with the flat electron spectral index of p = 1.4 and the high ratio of UB/Ue, which are derived by SED fitting (Table 3 in Appendix B.1).
Meanwhile, the relativistic electrons within the compact region propagate outward and traverse the jet shear layer, where they are effectively accelerated again via the shear acceleration process (e.g., R.-Y. Liu et al. 2017; F. M. Rieger 2019; L. Sironi et al. 2021). In this framework, the synchrotron radiation of the relativistic electrons within the compact zone produces the optical–X-ray emission. The IC scattering processes of this electron population contribute to the low-energy end of the Fermi-LAT spectrum, while the high-energy end of the Fermi-LAT spectrum is attributed to the IC scattering of the synchrotron photons within the compact zone by the higher-energy electrons in the extended region.
As depicted in Figure 6, the FSRQ PKS 1725+123 in the high-flux state demonstrates a remarkably high synchrotron peak frequency, which is notably distinct from other γ-ray-emitting FSRQs. In contrast, its broadband SED in the average-flux state (gray symbols in Figure 6) is similar to that of typical γ-ray-emitting FSRQs (e.g., J. Zhang et al. 2014, 2015; M. Petropoulou & S. Dimitrakoudis 2015; S. Maurya et al. 2025; A. K. Mohana et al. 2025). To further investigate the jet properties of PKS 1725+123, we calculate its jet powers and the powers of each jet component for both the compact and extended regions based on the SED fitting parameters (for more details, refer to Appendix B.3). We compare the jet powers and the powers of each jet component of PKS 1725+123 with a γ-ray emission FSRQ sample from A. Celotti & G. Ghisellini (2008) and J. Zhang et al. (2020b), as illustrated in Figure 8 in Appendix B.3. On average, PKS 1725+123 exhibits a low jet power and radiation efficiency but a highly magnetized jet when compared with other γ-ray emission FSRQs. Evidently, the simultaneous multiwavelength observations during the high-flux state of the source offer more constraints for radiation mechanism models and, concurrently, pose new challenges to the traditional radiation models.
Acknowledgments
The Space-based multi-band astronomical Variable Objects Monitor (SVOM) is a joint Chinese–French mission led by the Chinese National Space Administration (CNSA), the French Space Agency (CNES), and the Chinese Academy of Sciences (CAS). We gratefully acknowledge the unwavering support of NSSC, IAMCAS, XIOPM, NAOC, IHEP, CNES, CEA, and CNRS. This work is supported by the National Key R&D Program of China (grants 2024YFA161171 and 2024YFA1611700) and the National Natural Science Foundation of China (grants 12022305 and 11973050).
Appendix A: Multiwavelength Observations and Data Analysis
A.1. Swift-XRT
Swift-XRT has conducted a total of 18 observations of PKS 1725+123. In this work, the X-ray spectral analysis of PKS 1725+123 is mainly based on 16 observations. The data from two observations (ObsIDs 00019638007 and 00019638009) were not utilized because the exposures were insufficient to acquire an adequate number of photons for spectral fitting. The data were processed using the XRT Data Analysis Software (XRTDAS, v.3.7.0) within the HEASoft package (v.6.34). The raw event files were calibrated using the calibration files from Swift-XRT CALDB (v.20241028) through the xrtpipeline task. Spectra of source and background photons were extracted using the xselect task. We defined the source region as a circle with a radius of 47″ and an annulus with inner and outer radii of 71″ and 142″, respectively, both centered on the coordinates of PKS 1725+123 provided in M. H. Xu et al. (2019). Ancillary response files, incorporating cumulative exposure maps to account for point-spread function losses and CCD defects, were generated using the xrtmkarf task.
The spectra of PKS 1725+123 for different Swift-XRT observations were individually fitted with an absorbed PL model within Xspec (v.12.14.1; K. Arnaud et al. 1999), specifically, TBABS×POWERLAW. The PL model is described as follows:

where N0 is the PL normalization, E0 = 1 keV is the scale parameter of photon energy, and ΓX is the photon spectral index. In this model, the TBABS component accounts for the Galactic photoelectric absorption. During the spectral fitting process, the column density (NH) was fixed at the Galactic value (NH = 8.64 × 1020 cm−2; HI4PI Collaboration et al. 2016) since the data quality of Swift-XRT is inadequate to constrain the intrinsic absorption. To improve the quality of the spectral fitting, the grppha task was utilized to rebin the spectra, ensuring a minimum of 3 counts to guarantee the validity of the C-statistic during the spectral fitting. Moreover, a minimum of 20 counts was applied to use the χ2 statistic during the spectral fitting for the observation with sufficient photon counts. The best-fit parameters are summarized in Table 2.
Table 2. Swift-XRT Spectral Analysis Results for PKS 1725+123
| ObsID | Date | Exposure | N0 | ΓX | Fit Statistic | F0.3−10 | F0.3−2 | F2−10 |
|---|---|---|---|---|---|---|---|---|
| (YYYY-MM-DD) | (s) | (10−4 ph cm−2 s−1 keV−1) | (10−12 erg cm−2 s−1) | |||||
| 00019638001 | 2025-03-21 | 1296 |

| 1.59 ± 0.25 | 10/13 |

| 0.92 ± 0.14 |

|
| 00019638002 | 2025-03-24 | 1486 |

|

| 10/7 |

|

|

|
| 00019638004 | 2025-03-29 | 438 |

|

| 4/1 |

|

|

|
| 00019638005 | 2025-08-19 | 1509 |

| 2.22 ± 0.13 | 5/9a |

|

|

|
| 00019638006 | 2025-08-21 | 837 |

|

| 4/4a |

|

|

|
| 00019638010 | 2025-08-25 | 1294 |

| 1.76 ± 0.21 | 20/22 |

|

|

|
| 00019638011 | 2025-08-26 | 2202 |

|

| 3/4a |

|

|

|
| 00019638012 | 2025-09-07 | 411 |

|

| 8/11 |

|

|

|
| 00019638013 | 2025-09-10 | 870 |

| 1.52 ± 0.24 | 15/16 |

|

|

|
| 00019638014 | 2025-09-11 | 865 |

| 1.09 ± 0.23 | 14/16 |

|

|

|
| 00019638015 | 2025-09-12 | 992 |

|

| 4/4 |

|

|

|
| 00019638016 | 2025-09-13 | 1075 |

| 1.38 ± 0.18 | 38/27 |

|

|

|
| 00019638017 | 2025-09-14 | 1075 |

|

| 19/23 |

| 1.81 ± 0.21 |

|
| 00019638018 | 2025-09-28 | 2316 |

| 1.59 ± 0.16 | 36/32 |

| 1.10 ± 0.11 | 1.91 ± 0.19 |
| 00019638019 | 2025-09-29 | 1810 |

| 1.59 ± 0.20 | 36/21 |

|

|

|
| 00019638020 | 2025-10-01 | 1725 |

| 1.32 ± 0.19 | 18/24 |

|

|

|
Note. aThe χ2 statistic was employed during the spectral fits of these observations.
Download table as: ASCIITypeset image
A.2. Fermi-LAT
In the Fermi-LAT 14 yr Source Catalog (4FGL-DR4; S. Abdollahi et al. 2022
; J. Ballet et al. 2023
), PKS 1725+123 is associated with γ-ray source 4FGL J1728.0+1216. We selected the Pass 8 data within the 0.1–1000 GeV band from a 15∘ region of interest (ROI) centered on the position of PKS 1725+123 (R.A. = 262 029, decl. = 12
 261). The data cover the period from 2008 August 4 to 2025 October 1 (MJD 54682–60949). The binned maximum-likelihood analysis was conducted using the publicly available software fermitools (ver. 2.2.0; Fermi Science Support Development Team 2019) and the P8R3_SOURCE_V3 instrument response function (IRF), with a bin size of 0
 1. Photons with zenith angles exceeding 90∘ were excluded to minimize the contamination of γ-ray emission from the Earth limb. All sources within the ROI were included in the model. The spectral parameters of the sources located within a circle with a radius of 6∘ were left free, while the other parameters were fixed at their 4FGL-DR4 values. The background emission was modeled using the diffuse Galactic interstellar emission (“gll_iem_v07. fits”) and isotropic emission (“iso_P8R3_SOURCE_V3_V1. txt”), and only their normalization parameters were kept free.
We use the maximum test statistic (TS) to evaluate the significance of the γ-ray signals of a source, where  , where
  and
and  are the likelihood values for the background with and without a source. The threshold is set at TS = 25 (corresponding to 5σ). The appearance of new sources in the ROI may affect the γ-ray spectrum and light curve of the research source. To eliminate the influence of new sources, we searched for possible new γ-ray sources within a 5∘ field of view and found no new sources beyond those listed in the 4FGL-DR4.
Through maximum-likelihood fitting, the value of TS=2495.5 was obtained for 4FGL J1728.0+1216. The 17 yr average γ-ray spectrum can be well explained in the LP form (E. Massaro et al. 2004), specifically,

where N(E) is the photon distribution as a function of energy, Γγ is the photon spectral index, Eb is the scale parameter of photon energy, and β is the curvature parameter. An average spectrum with Γγ = 2.16 ± 0.03 and β = 0.05 ± 0.01 was obtained, and the 17 yr average flux is F0.1−1000 GeV =(2.12 ± 0.10) × 10−11 erg cm−2 s−1. These results are roughly consistent with those of 4FGL-DR4.
Using the same method, we obtained the time-resolved spectra for the three time intervals: 2025 August 16–18 (MJD 60903–60905), August 19–21 (MJD 60906–60908), and August 22–24 (MJD 60909–60911). Different from the 17 yr integrated spectrum, the three time-resolved spectra can be well modeled by a simple PL function with a flatter photon spectral index.
We generated the 17 yr long-term light curve using a time bin of 30 days, as displayed in Figure 7(a). During the construction of the light curves, only the parameters of the target source and two background files were released, while the other parameters were fixed at the optimal fitting values. If TS < 9, an upper limit of flux was provided for that time bin. We fixed the target source in the form of a PL function with a photon spectral index of 2 to calculate the upper-limit value. Using the same method, we also generated the 3 month (2025 July 6 to 2025 October 1) light curve using a time bin of 1 day, as depicted in Figure 7(b).
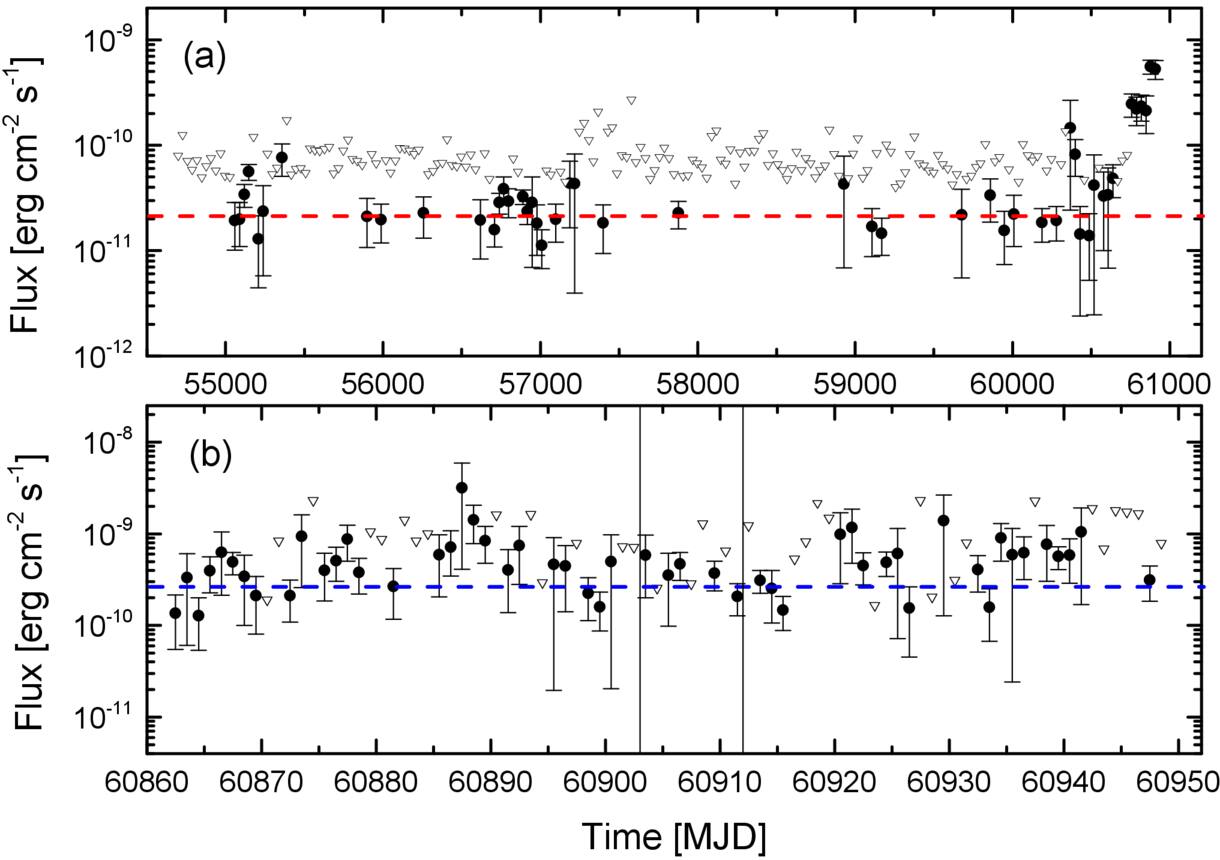
Figure 7. Light curves of PKS 1725+123 observed by Fermi-LAT in the 0.1–1000 GeV band. If TS < 9, an upper limit (represented by open inverted triangles) is provided for that time bin. Panel (a): the 17 yr long-term light curve, derived with a time bin of 30 days. The red horizontal dashed line denotes the ∼17 yr average flux, i.e., F0.1−1000 GeV = (2.12 ± 0.10) × 10−11 erg cm−2 s−1. Panel (b): the 3 month light curve with a time bin of 1 day, covering the period from 2025 July 6 to 2025 October 1. The blue horizontal dashed line denotes the weighted average flux of 2.65 × 10⁻¹⁰ erg cm−2 s−1, which is derived using Equation (1). The two black vertical lines represent the capture time interval of the three time-resolved spectra in Figure 5.
Download figure:
Standard image High-resolution imageAppendix B: SED Modeling
B.1. Model
As described in Section 3.1, SVOM-VT has observed the optical variability of PKS 1725+123 with a timescale of less than 1 hr, which suggests a small size of the emission region. Meanwhile, the hard optical spectrum, in combination with a soft X-ray spectrum, indicates a very high synchrotron peak frequency. Further considering a very hard Fermi-LAT spectrum and a high redshift, a typical one-zone leptonic model fails to provide an adequate explanation for the broadband SED of PKS 1725+123. Nevertheless, during the optical flare state observed by SVOM-VT, the emission in the X-ray and γ-ray bands also demonstrates a high-flux state, indicating that the emission among the three bands has some kind of connection. In other words, neither the model with two independent zones nor the hadronic model is suitable (e.g., S. C. Chaudhary et al. 2026). Additionally, the detection of VHE emission require extremely high-energy electrons to produce it. It is noted that both radio observations and numerical simulations have indicated that the jets possess a spine–sheath velocity stratification structure (e.g., P. Rossi et al. 2008; A. Chhotray et al. 2017; R. C. Walker et al. 2018). When electrons pass through the shear layers associated with velocity gradients, the shear acceleration process, a Fermi-type mechanism similar to shock or stochastic acceleration, can produce a population of higher-energy electrons (F. M. Rieger & P. Duffy 2004; F. M. Rieger et al. 2007; R.-Y. Liu et al. 2017; F. M. Rieger 2019). Therefore, a two-zone leptonic model, as described in Section 4, is proposed.
The electron distribution in both emission regions is taken as a PL, characterized by an electron number density parameter N0, a spectral index p, and a minimum ( ) and a maximum (
 ) Lorentz factor of electrons. Both radiation regions are assumed to be spherical with a radius R, a magnetic field strength B, and a Doppler boosting factor δ, where
  , and Γ and θ are the bulk Lorenz factor and viewing angle of the emission region. The value of R is constrained by the variability timescale, specifically, R = Δtcδ/(1 + z). As displayed in Figure 2, a continuous decrease in flux was observed during the fourth orbit observation (a similar phenomenon was also presented in the VT_B band of the second orbit observation), with a duration of 30 minutes from the first to the last data points. Therefore, a Δt value of 30 minutes is adopted for the compact region, and it is assumed that δ = Γ. For the extended region, a Δt value of 1 day is adopted, and the same viewing angle as that of the compact region is assumed. Given that the VHE γ-rays are detected during this high-flux state, it is assumed that the emission region is not located deep within the BLRs, as this would result in strong attenuation through γγ annihilation (e.g., H. T. Liu & J. M. Bai 2006; J. Poutanen & B. Stern 2010). Therefore, the energy density of the BLR is fixed at 0.5 times the typical value of 2.73 ×10⁻² Γ2 erg cm−3, and the spectrum of the BLR can be approximated by a blackbody with a peak at 2 × 10¹⁵ Γ Hz in the comoving frame (e.g., F. Tavecchio & G. Ghisellini 2008b; S.-J. Kang et al. 2014). The electron radiative processes have incorporated synchrotron self-absorption (G. B. Rybicki & A. P. Lightman 1979
), the Klein–Nishina effect (F. Tavecchio et al. 1998), and EBL absorption (J. D. Finke et al. 2022).
, and Γ and θ are the bulk Lorenz factor and viewing angle of the emission region. The value of R is constrained by the variability timescale, specifically, R = Δtcδ/(1 + z). As displayed in Figure 2, a continuous decrease in flux was observed during the fourth orbit observation (a similar phenomenon was also presented in the VT_B band of the second orbit observation), with a duration of 30 minutes from the first to the last data points. Therefore, a Δt value of 30 minutes is adopted for the compact region, and it is assumed that δ = Γ. For the extended region, a Δt value of 1 day is adopted, and the same viewing angle as that of the compact region is assumed. Given that the VHE γ-rays are detected during this high-flux state, it is assumed that the emission region is not located deep within the BLRs, as this would result in strong attenuation through γγ annihilation (e.g., H. T. Liu & J. M. Bai 2006; J. Poutanen & B. Stern 2010). Therefore, the energy density of the BLR is fixed at 0.5 times the typical value of 2.73 ×10⁻² Γ2 erg cm−3, and the spectrum of the BLR can be approximated by a blackbody with a peak at 2 × 10¹⁵ Γ Hz in the comoving frame (e.g., F. Tavecchio & G. Ghisellini 2008b; S.-J. Kang et al. 2014). The electron radiative processes have incorporated synchrotron self-absorption (G. B. Rybicki & A. P. Lightman 1979
), the Klein–Nishina effect (F. Tavecchio et al. 1998), and EBL absorption (J. D. Finke et al. 2022).
Since it is assumed that the two regions overlap, the code also incorporates the emission resulting from the interaction of the two zones. The synchrotron radiation from the two regions provides an additional target photon field for each other for the IC scattering. Moreover, due to the relative motion between the compact region and the extended region, the energy density of the seed photons will be amplified (G. Ghisellini et al. 2005; Z.-R. Wang et al. 2024). However, the radiation contribution from the interaction of the two zones is mainly attributed to the synchrotron photons from the compact region undergoing IC scattering by the relativistic electrons within the extended region. In contrast, the flux contribution from the opposite process can be disregarded.
The fitting results are presented in Figure 6, and the fitting parameters are given in Table 3. It should be noted that the derived parameter values are based on visual assessments, and the model parameters cannot be fully constrained by the current observational data.
Table 3. Parameters of SED Fitting and Jet Powers
| Parameter | Symbol | Compact Zone | Extended Zone |
|---|---|---|---|
| Electron density parameter | N0 [cm−3] | 6 × 10² | 1 × 10² |
| Electron spectral index | p | 1.4 | 2 |
| Minimum Lorentz factor for electrons |

| 1 × 10² | 3 × 10³ |
| Maximum Lorentz factor for electrons |

| 4.5 × 10³ | 5 × 10⁵ |
| Radius of emission region | R [cm] | 1.2 × 10¹⁵ | 1.9 × 10¹⁶ |
| Bulk Lorentz factor | Γ | 35 | 5.9 |
| Doppler factor | δ | 35 | 11.4 |
| Magnetic field | B [G] | 24 | 1 |
| Energy density of BLR | UBLR [erg cm−3] | 1.36 × 10⁻² | 1.36 × 10⁻² |
| Equipartition ratio | UB/Ue | 2 × 10² | 9.5 × 101 |
| Radiative power | Pr [erg s−1] | 8.58 × 1041 | 3.02 × 1043 |
| Nonthermal electron power | Pe [erg s−1] | 1.87 × 1043 | 1.77 × 1042 |
| Magnetic field power | PB [erg s−1] | 3.75 × 1045 | 1.69 × 1044 |
| Jet power | Pjet [erg s−1] | 3.77 × 1045 | 2.01 × 1044 |
Download table as: ASCIITypeset image
B.2. Cooling and Acceleration Timescales of Electrons
Given the rapid variability observed in the optical band, it was assumed that there is a compact emission region during the SED modeling. The synchrotron frequency (νs), of an electron with a Lorentz factor of  is (γe) is
  (G. B. Rybicki & A. P. Lightman 1979; F. Tavecchio et al. 1998). The cooling timescale of electrons through the synchrotron process is estimated by
  (G. B. Rybicki & A. P. Lightman 1979; M. Chiaberge & G. Ghisellini 1999), where me is the electron mass and σT is the Thomson cross section. For the contribution to the optical emission, the cooling timescale of electrons is about 46 minutes in the comoving frame and several minutes in the observer frame.
We also estimate the shear-acceleration timescale of electrons in the extended zone under the strong-scattering regime. The acceleration timescale is given by the following equations (R.-Y. Liu et al. 2017):




where Γjet = Γ = 35 denotes the bulk Lorentz factor of the jet, βjet represents the speed of the jet in units of c, and rg is the gyroradius of electrons. In this scenario, we adopt ξ ∼ 0.1, which represents the ratio of turbulent to ordered magnetic field energy density. We employ the Kolmogorov turbulence model (q = 5/3; A. Kolmogorov 1941) and assume an acceleration region width Δr ∼ 1015 cm with  . Then, we obtain tacc ∼ 4 × 10³ s.
It should be noted that the estimation results for the cooling and acceleration timescales of electrons are consistent with the observations.
B.3. Jet Power
By assuming that the the jet power is carried by relativistic electrons (Pe), magnetic fields (PB), and radiation (Pr), i.e., Pjet = πR2Γ2 c(Ue + UB + Ur), and using the SED fitting parameters, we calculate the jet power and the powers of each component for both the compact and extended regions. Ue, UB, and Ur are the energy densities of relativistic electrons, magnetic fields, and radiation in the comoving frame, respectively, which are given by the following equations (e.g., A. Celotti & G. Ghisellini 2008; G. Ghisellini et al. 2010):



where Lbol is the bolometric luminosity.
The derived jet power and the powers of each component for the compact and extended regions are presented in Table 3. It is found that for the compact zone, PB/Pjet ∼ 0.995 and Pr/Pjet ∼ 0.0002, and for the extended zone, PB/Pjet ∼ 0.841 and Pr/Pjet ∼ 0.150. These results suggest that both zones are highly magnetized; however, the compact zone exhibits low radiation efficiency, while the extended zone demonstrates high radiation efficiency. We compare the derived jet powers of PKS 1725+123 with a γ-ray emission FSRQ sample from A. Celotti & G. Ghisellini (2008) and J. Zhang et al. (2020b), and we plot Pe, PB, and Pr as functions of Pjet in Figure 8. We combine the compact (red filled square) and extended (blue filled square) zones as a single jet emission region of PKS 1725+123, which is marked as a green filled star in Figure 8. Comparing with other γ-ray emission FSRQs, on average, PKS 1725+123 exhibits a low jet power and radiation efficiency but a highly magnetized jet.
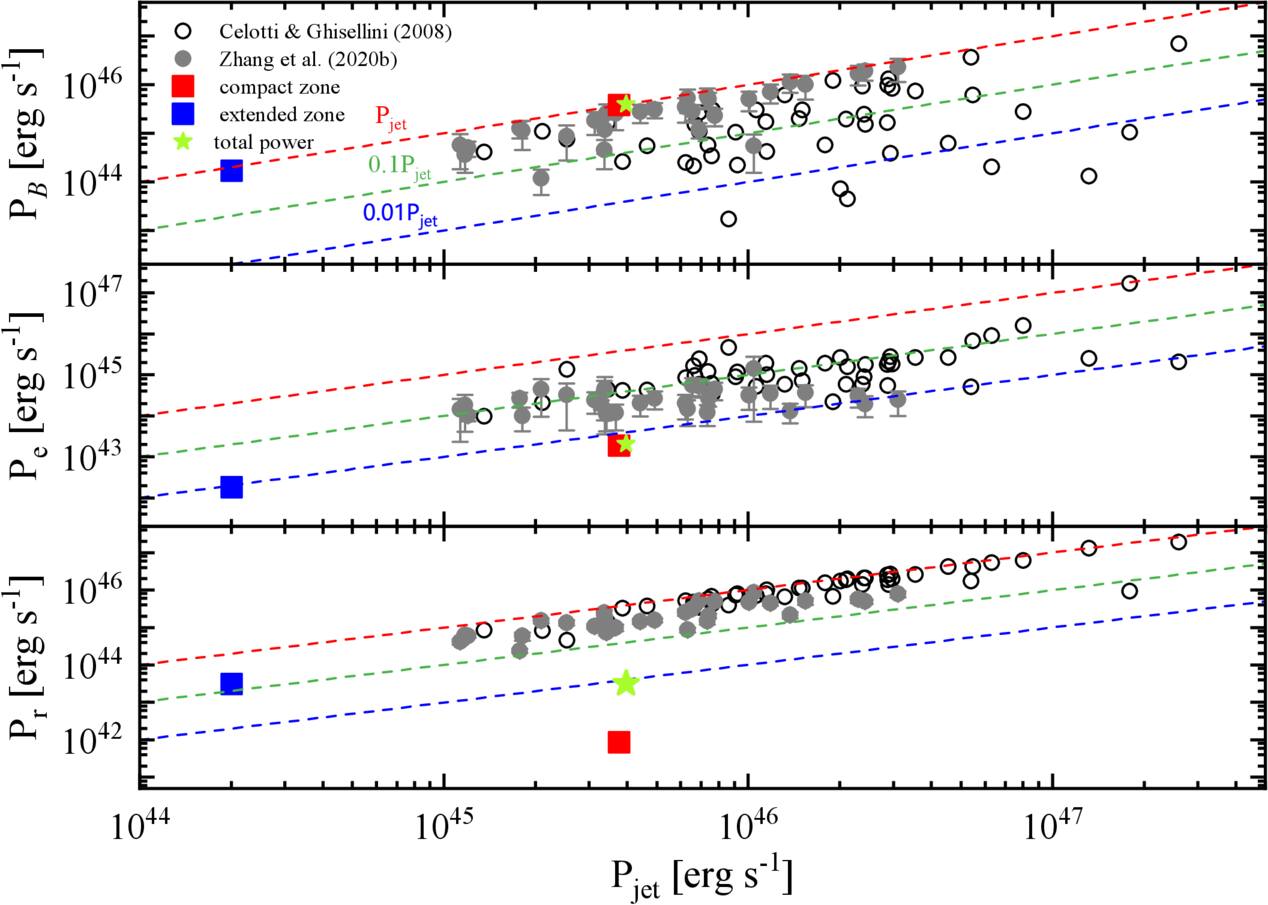
Figure 8. PB, Pe, and Pr as functions of Pjet. The red and blue filled squares denote the values for the compact and extended zones of PKS 1725+123, respectively; meanwhile, the green filled star represents the power sum of the two zones. The black open circles and gray filled circles represent the data of a γ-ray emission FSRQ sample from A. Celotti & G. Ghisellini (2008) and J. Zhang et al. (2020b), respectively.
Download figure:
Standard image High-resolution image