Abstract
We report the first identification of molecular clumps directly associated with the rebrightening regions of the large-scale X-ray jets of SS 433, based on 12CO (J = 1–0) observations with the Nobeyama 45 m Radio Telescope. Multiple clumps are detected toward the eastern and western jet heads, showing clear spatial correlation with the X-ray emission. The X-ray emission peaks immediately downstream of the molecular clumps, while the hardness ratio is enhanced at their surfaces, indicating that the observed structures cannot be explained by absorption effects. These results provide direct evidence for shock–cloud interactions between the jets and the surrounding interstellar medium. We suggest that turbulence generated at the jet–cloud interface amplifies magnetic fields, producing the observed nonthermal X-ray emission. Our findings highlight the importance of jet–interstellar medium interactions in shaping the X-ray properties of microquasar jets.
Original content from this work may be used under the terms of the Creative Commons Attribution 4.0 licence. Any further distribution of this work must maintain attribution to the author(s) and the title of the work, journal citation and DOI.
1. Introduction
SS 433 is one of the most active microquasars in our Galaxy, consisting of a compact object and an A-type supergiant in a binary system (G. O. Abell & B. Margon1979; B. Margon 1984; D. R. Gies et al. 2002; S. Fabrika2004; T. C. Hillwig & D. R. Gies 2008; K. Kubota et al. 2010). Jets are observed from radio to X-ray wavelengths within arcsecond scales of the source; however, the X-ray emission was previously thought to fade within ∼2″ from the binary (S. Migliari et al. 2002, 2005; K. M. Blundell et al. 2018; J. Martí et al. 2018; Y. Sakai et al. 2025).
At larger distances, bright X-ray jets are detected at ∼ 17′ east and west of SS 433. These structures, first identified with ROSAT and later observed with multiple X-ray observatories, trace relics of past jet activity (W. Brinkmann et al. 1996, 2007; S. Safi-Harb & H. Ögelman 1997; S. Safi-Harb & R. Petre1999; A. Moldowan et al. 2005; S. Safi-Harb et al. 2022; R. Sunyaev et al. 2026). The base regions of these structures, previously referred to as e0 and w1, are hereafter called the eastern and western heads. These regions provide key diagnostics of the jet history, including possible quiescent phases. Further downstream, the jets exhibit knot-like structures, referred to as the lenticular feature in the eastern jet and w1.5 and w2 in the western jet (see K. Kayama et al. 2025 for more details).
The head regions exhibit (i) sharply bounded X-ray morphologies and (ii) spectra dominated by nonthermal emission. Photon indices Γ of 1.54 and 1.64 in the 1.0–7.0 keV band have been reported for the eastern and western heads, respectively (K. Kayama et al. 2022, 2025), suggesting rebrightening due to recollimation shocks that accelerate high-energy electrons via diffusive shock acceleration (DSA; S. S. Komissarov & S. A. E. G. Falle 1997). This interpretation is broadly consistent with recent detections of very-high-energy gamma-rays by H.E.S.S. and LHAASO, including a downstream softening trend indicative of an electron origin (H. E. S. S. Collaboration et al. 2024; Lhaaso Collaboration et al. 2025).
However, recollimation shocks are not the only mechanism that can account for the rebrightening of the X-ray emission. Alternatively, magnetic field amplification driven by turbulence induced by interactions between the jet and the interstellar medium (ISM) can also explain the observed X-ray emission. Such a mechanism has also been reported in supernova remnants (SNRs), where shock–cloud interactions lead to enhanced synchrotron X-ray emission (Y. Fukui et al. 2003; H. Sano et al. 2010; Y. Fukui et al. 2012; T. Inoue et al. 2012; H. Sano et al. 2020). A similar process may operate in the X-ray jets of SS 433.
Jet–ISM interactions have also been discussed in several other Galactic microquasars and X-ray binaries (P. Atri et al. 2025; I. Mariani et al. 2025; S. E. Motta et al. 2025; N. Grollimund et al. 2026). In particular, molecular-line studies of such systems have revealed spatial associations between dense molecular gas and radio jet relics or lobes (A. J. Tetarenko et al. 2018, 2020; P. Bosch-Cabot et al. 2026). In SS 433 itself, previous studies of interstellar material have mainly focused on the outer radio shell W50, where molecular clouds possibly associated with the shell have been reported (H. Yamamoto et al. 2008, 2022, 2024; Y. Su et al. 2018; Q.-C. Liu et al. 2020; H. Sakemi et al. 2023; T. Oka et al. 2026). However, no direct association between molecular gas and the X-ray jet heads has been established. The molecular cloud N4 reported by H. Yamamoto et al. (2008, 2022, 2024) overlaps with the western jet in projection, but it is offset from the western head region, and no corresponding molecular counterpart has been identified toward the eastern head.
In this Letter, we report 12CO (J = 1–0) observations of the eastern and western head regions obtained with the Nobeyama 45 m Radio Telescope. We detect molecular cloud clumps spatially associated with the X-ray heads, providing evidence that shock–cloud interactions, rather than recollimation shocks, may be responsible for the rebrightening of the X-ray emission. Section 2 describes the observations, Section 3 presents the molecular cloud properties and their spatial relationship with the X-ray jets, Section 4 discusses the implications, and Section 5 summarizes our conclusions.
2. Observations and Data Reduction
We obtained the 12CO (J = 1–0) data with the 45 m telescope of the Nobeyama Radio Observatory (NRO), with observations conducted between 2022 November and 2025 December. We scanned target areas in on-the-fly mapping mode (T. Sawada et al. 2008). We scanned in the R.A. and decl. directions to suppress the scanning effect. The four-beam receiver FOREST (T. Minamidani et al. 2016) and the autocorrelation spectrometer SAM45 (N. Kuno et al. 2011) were used. The standard data reduction was carried out using NOSTAR. The pointing accuracy was checked every 2 hr by observing R Aquilae (αJ2000, δJ2000) = (19h06m22 25, +8
 ) with the frontend H40 or Z45 (F. Nakamura et al. 2015). All observations were conducted in equatorial coordinates. We used a chopper wheel to obtain the antenna temperature
  (M. L. Kutner & B. L. Ulich 1981). We observed W51 as a standard source to fix gain variations. The spectral intensity was calibrated and converted to the TMB scale by applying a main beam efficiency ηMB corresponding to each polarization, frequency, and observing season provided by the observatory. To improve the sensitivity, the spatial resolution was smoothed, resulting in a final spatial resolution of 30″. The spatial and velocity grids had sizes of 8
 5 and 0.2 km s−1, respectively. The velocity coverage was from −45 to 113 km s−1. The rms noise levels in TMB were ∼0.18 and ∼0.15 K at 115 GHz for eastern and western regions, respectively.
3. Results
Figure 1 shows the integrated intensity map of 12CO (J = 1–0) overlaid on a two-color composite X-ray image in the 0.5–7 keV band obtained with Chandra (N. Tsuji et al. 2025). The velocity ranges used for integration are 46.5–58.3 km s−1 for the eastern side and 51.7–56.5 km s−1 for the western side. Molecular clouds are clearly detected within similar velocity ranges toward the head regions of both the eastern and western jets.
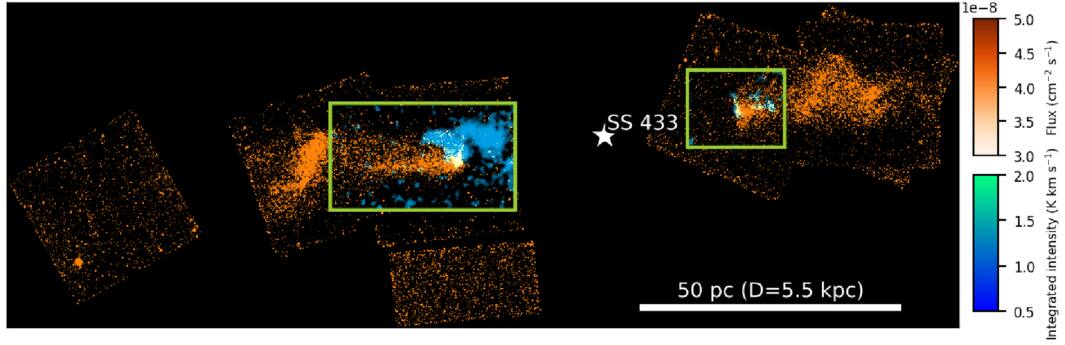
Figure 1. Two-color composite image of the integrated intensity of 12CO (J = 1–0) (cyan) and the X-ray photon flux in the 0.5–7 keV band observed with Chandra (orange; N. Tsuji et al. 2025). The velocity ranges used for the CO integration are 46.5–58.3 km s−1 for the eastern side and 51.7–56.5 km s−1 for the western side. The position of SS 433 is indicated by a white star. The scale bar at the lower right assumes a distance of 5.5 kpc (K. M. Blundell & M. G. Bowler 2004). The light green boxes indicate the regions shown in Figure 2, corresponding to the areas observed with the Nobeyama 45 m Radio Telescope in this study.
Download figure:
Standard image High-resolution imageFigure 2 presents zoomed-in views of the boxed regions in Figure 1, showing the integrated intensity maps of 12CO (J = 1–0) over the same velocity ranges. Multiple molecular clumps are identified in the head regions of both jets. Assuming a distance of 5.5 kpc (K. M. Blundell & M. G. Bowler 2004), their typical sizes are ∼2 pc. In particular, the clumps located at (αJ2000, δJ2000) = (19h12m57 04, +4
 ) in the eastern jet and (αJ2000, δJ2000) = (19h10m46
 11, +5
 ) in the western jet exhibit elongated morphologies along the north–south direction, aligned with the jet heads.
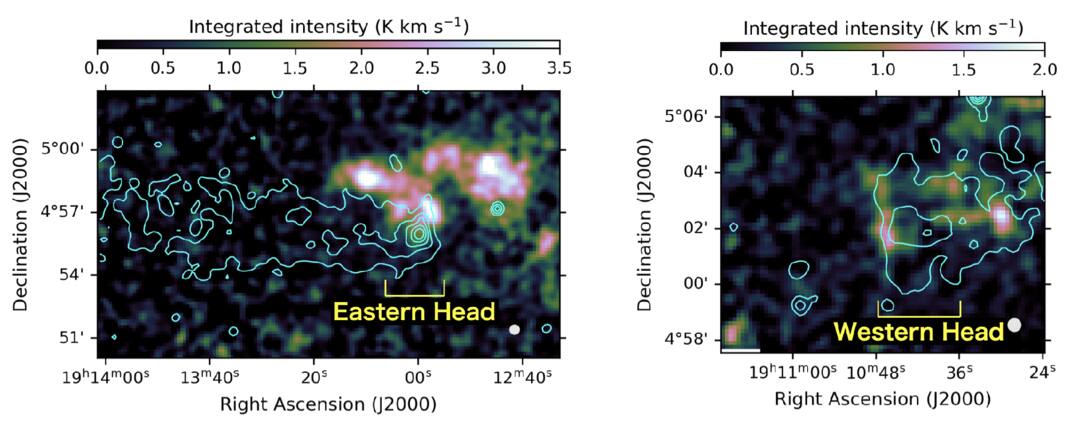
Figure 2. Integrated intensity maps of 12CO (J = 1–0). The left and right panels show the eastern and western jet head regions, respectively. The velocity ranges are the same as those in Figure 1. The beam size after smoothing (30″) is shown in the lower right. Cyan contours indicate the X-ray photon flux shown in Figure 1, with five levels ranging from 3.0 × 10⁻⁸ to 1.2 × 10⁻⁷ cm−1 s−1.
Download figure:
Standard image High-resolution imageFigure 3 shows the spatial relationship between the CO emission and the X-ray jets. The left and right panels correspond to the eastern and western jets, respectively. The top panels show X-ray images in the 0.5–10 keV band observed with the XMM-Newton (K. Kayama et al. 2022, 2025), while the middle panels show the integrated intensity of 12CO (J = 1–0). The slices indicated in the top and middle panels have a width of 17″ (corresponding to ∼ 0.45 pc at 5.5 kpc). The bottom panels plot the peak surface brightness of the X-ray and the peak integrated intensity of the CO emission within each slice. The horizontal axis represents the distance (pc) from the slice labeled 0 in the top and middle panels; note that the distance increases from west to east for the eastern jet, and from east to west for the western jet.
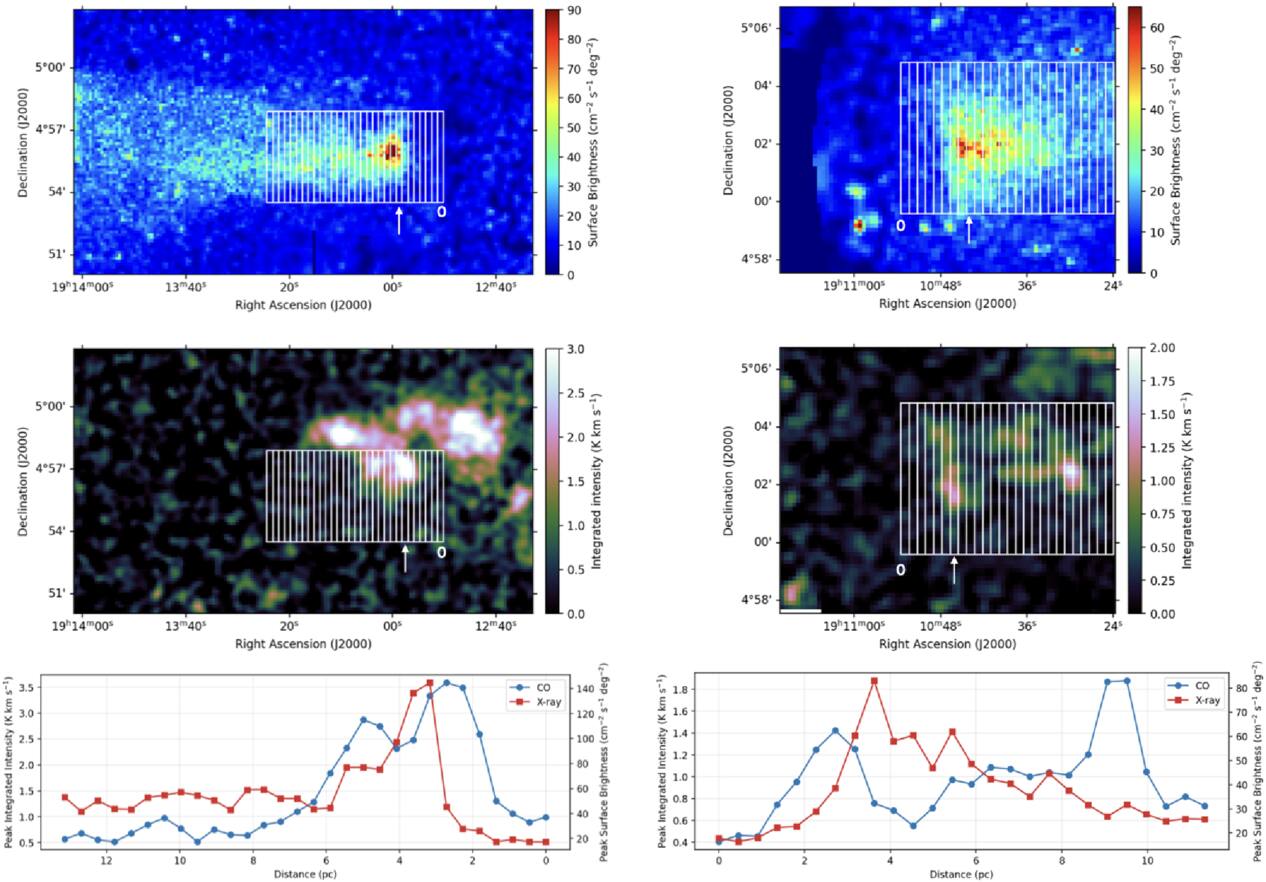
Figure 3. Comparison of the spatial distributions of the X-ray surface brightness in the 0.5–10 keV band observed with XMM-Newton (K. Kayama et al. 2022, 2025) and the integrated intensity of 12CO (J = 1–0). The X-ray images are regridded to match the spatial grid of the CO data. The left and right columns correspond to the eastern and western jets, respectively. The top panels show the X-ray surface brightness, and the middle panels show the CO integrated intensity over the same velocity ranges as in Figure 1. The slices shown in the top and middle panels have a width of 17″, corresponding to ∼0.45 pc at a distance of 5.5 kpc. The white arrows indicate the slices where the first peak appears downstream from the X-ray jet head regions. The bottom panels plot the peak values of the CO integrated intensity and X-ray surface brightness within each slice. The horizontal axis represents the distance (pc) from the slice labeled 0 in the top and middle panels.
Download figure:
Standard image High-resolution imageAs clearly seen in the bottom panels, the X-ray emission peaks immediately downstream of the molecular clump peaks. This demonstrates a clear spatial correlation between the X-ray jets and the molecular clumps. This is the first identification of interstellar material that shows a direct spatial correlation with the X-ray jets.
Figure 4 shows the hardness ratio map between the 0.5–1.5 keV and 2.0–7.0 keV bands observed with XMM-Newton (K. Kayama et al. 2022, 2025). The hardness ratio is defined as HR = (H − S)/(H + S), where H and S represent the surface brightnesses in the 2.0–7.0 keV and 0.5–1.5 keV bands, respectively. The contours represent the integrated intensity of 12CO (J = 1–0). In the head regions of both jets, a large fraction of the area exhibits hardness ratios exceeding 0.5, indicating that hard, nonthermal X-ray emission dominates, consistent with previous studies. Notably, the peaks of the molecular clump emission are spatially offset from the regions with high hardness ratios by ∼0.5–1 pc. If the high hardness ratio regions coincided with the molecular clump peaks, the enhancement could be attributed to absorption of soft X-rays by the molecular gas. However, the observed spatial offset clearly indicates a different origin. This interpretation is discussed in Section 4.
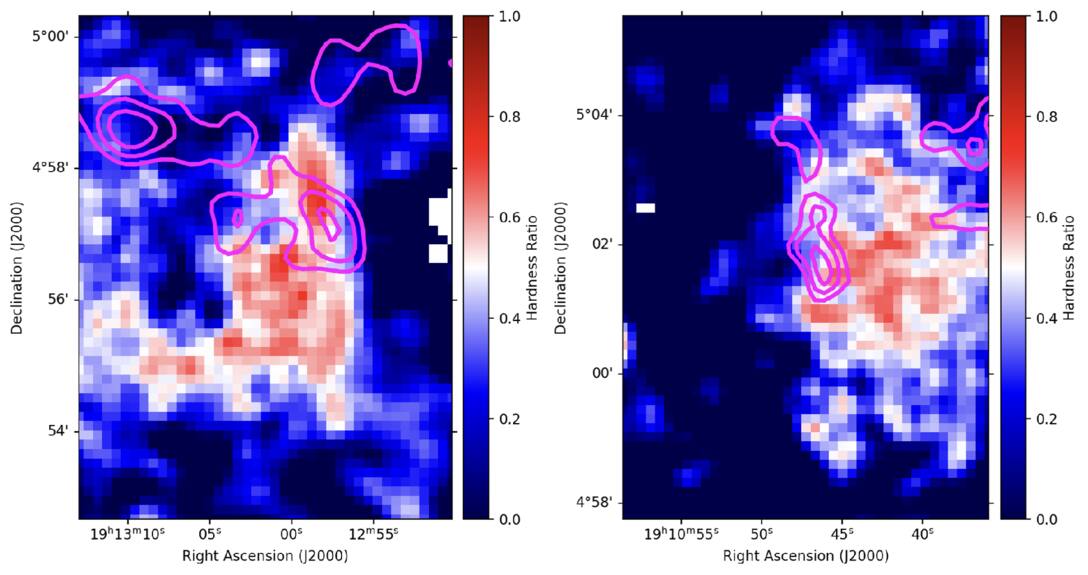
Figure 4. Hardness ratio map between the 0.5–1.5 keV and 2.0–7.0 keV bands observed with XMM-Newton (K. Kayama et al. 2022, 2025). The images are regridded to match the spatial grid of the 12CO (J = 1–0) data, as in Figure 3. Magenta contours represent the CO integrated intensity over the same velocity ranges as in Figure 1. For the eastern side, three contour levels are shown from 2.1 to 3.5 K km s−1, while for the western side, six levels are shown from 0.8 to 2.0 K km s−1.
Download figure:
Standard image High-resolution image4. Discussion
S. Safi-Harb et al. (2022) estimated that the equipartition magnetic field strength in the eastern X-ray jet head is at least ∼12 μG. They also derived a required energy of 2.4 × 1044 erg to accelerate electrons up to X-ray-emitting energies and a radiative cooling timescale of ∼103 yr. Since this timescale is much shorter than the system age (∼104–105 yr), continuous or repeated particle reacceleration in the head region is required. However, the photon indices observed in the head regions of the eastern and western X-ray jets, Γ = 1.54 and 1.64, are significantly harder than those typically observed in shock regions of SNRs. In the case of SNRs, ideal DSA predicts Γ = 1.5, whereas observed values are typically in the range of Γ = 2–3 (S. P. Reynolds 2008). This discrepancy is generally attributed to synchrotron cooling and nonlinear effects operating in realistic acceleration environments. Therefore, explaining the unusually hard photon indices in the X-ray jet head regions requires invoking mechanisms that can overcome these effects.
We report the first identification of molecular clumps that are highly likely to be directly interacting with the X-ray jets of SS 433. Two key observational features are found: (i) spatial offsets between the peaks of the 12CO (J = 1–0) emission and the X-ray emission, and (ii) offsets between the CO peaks and regions of high hardness ratio, with the latter preferentially enhanced at the surfaces of the molecular clumps. These characteristics can be naturally explained by a shock–cloud interaction scenario as shown in Figure 5 (e.g., T. Inoue et al. 2012). A similar interpretation has been successfully applied to the SNR RX J1713.7-3946, where spatial offsets between X-ray and CO emission are observed (H. Sano et al. 2010; Y. Fukui et al. 2012; H. Sano et al. 2020).
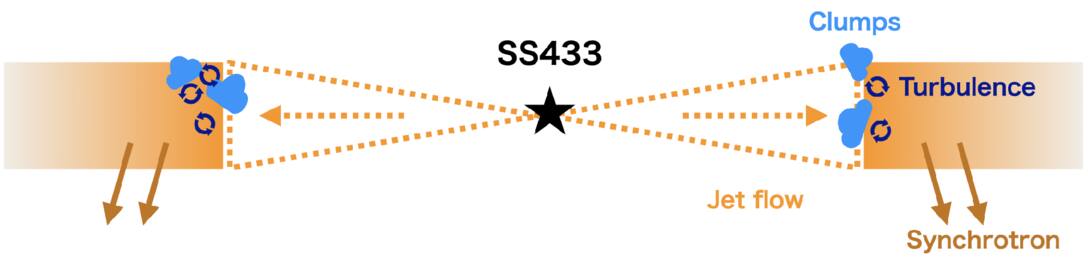
Figure 5. Schematic illustration of the shock–cloud interaction occurring in the head regions of the X-ray jets of SS 433.
Download figure:
Standard image High-resolution imageIn this scenario, molecular clouds with relatively high densities (∼103 cm−3) preexist in the head regions of both jets. As the jet propagates outward from SS 433, it collides with these clouds. The lower-density outer layers of the clouds are expected to be stripped by the jet, while the dense clumps can survive the interaction. In this picture, the CO emission traces the dense molecular clumps that survive the jet impact, whereas the synchrotron X-ray emission is enhanced primarily in the turbulent interaction layers around the clumps. Since magnetic-field amplification occurs at the clump surfaces or in the surrounding shear layers, rather than in the densest CO-bright cores themselves, the X-ray and CO peaks are not expected to coincide exactly. The observed offsets between the CO peaks, X-ray peaks, and high-hardness-ratio regions can therefore be naturally interpreted as a consequence of jet-driven turbulence and magnetic-field amplification around dense clumps. This scenario suggests that the rebrightening of the X-ray jets may arise from a mechanism distinct from recollimation shocks. A similar spatial relationship has been reported in the supernova remnant RX J1713.7-3946, where parsec-scale molecular clouds show offsets with respect to the X-ray structures. At subparsec resolution, however, a more pronounced spatial anticorrelation between the X-ray emission and molecular clouds is observed (H. Sano et al. 2020). The molecular clumps identified in the head regions of the SS 433 X-ray jets may exhibit a similar trend when observed at higher spatial resolution.
Here, we examine whether preexisting molecular clouds with densities of ∼103 cm−3 can survive continuous interactions with the jet over timescales comparable to the jet age. Using Equation (A5) of T. Inoue et al. (2012), and assuming a jet velocity of 0.26c, a jet kinetic power of 1039 erg s−1, a jet radius of 10 pc, and a molecular cloud density of 103 cm−3, the shock velocity propagating within the cloud during a shock–cloud interaction is estimated to be vsh∼ 3 km s−1. For a typical molecular clump size of Rcl ∼ 2 pc, the timescale required for the shock to traverse and disrupt the clump is given by tc ∼ Rcl/vsh ∼ 0.7 Myr. Since this is significantly longer than the system age (∼104–105 yr), the survival of molecular clumps in the jet head regions is not unexpected.
K. Kayama et al. (2025) interpret the spectral properties of the X-ray jets based on the scenario proposed by T. Sudoh et al. (2020). In this framework, cosmic-ray electrons are accelerated in the head regions of the X-ray jets and subsequently lose energy via synchrotron cooling as they propagate downstream. In addition, localized regions with enhanced magnetic fields—such as the lenticular feature in the eastern jet and the w2 region in the western jet—are considered to exhibit enhanced synchrotron emissivity, where reacceleration of electrons may occur. They constructed jet models that reproduce the observed spectra by adopting an electron injection spectral index of 2.08, a cutoff energy of the injection spectrum of 1.5 PeV, and jet velocities of 0.26c, 0.1c, and 0.065c (i.e., one quarter of 0.26c; see also S. S. Kimura et al. 2020). In these models, magnetic field strengths of 16 (9), 9 (7), and 7 (5) μG for the eastern (western) jet provide good agreement with the observed spectra in the head regions. Motivated by these results, we examine whether a shock–cloud interaction scenario can account for the observed extent of the X-ray jets dominated by synchrotron emission. As discussed in T. Inoue et al. (2012), shock–cloud interactions are capable of amplifying magnetic fields up to the mG level depending on the conditions. However, such strongly amplified fields are expected to be highly localized, and the synchrotron cooling timescales in these regions are correspondingly short (e.g., Y. Uchiyama et al. 2007). This implies that the average magnetic field strength is likely to be significantly lower. According to S. S. Kimura et al. (2020), using Equation (17) and assuming a jet kinetic power of ∼1039 erg s−1, the magnetic field strength is estimated to be ∼15 μG, which is comparable to the values adopted in K. Kayama et al. (2025). Assuming that the magnetic fields in the head regions are amplified to the values derived by K. Kayama et al. (2025), and adopting the corresponding jet velocities, we estimate the propagation distance of cosmic-ray electrons responsible for the 2–7 keV emission observed with XMM-Newton, taking synchrotron cooling into account. We find that, in all cases considered, electrons emitting at 7 keV can propagate over distances comparable to or exceeding the size of the eastern and western X-ray jets (∼41 pc) on synchrotron cooling timescales of ∼103 yr. In some cases, the estimated propagation distances exceed the observed extent of the X-ray jets. This discrepancy can be naturally explained by additional dissipation processes beyond simple synchrotron cooling, such as particle escape or enhanced synchrotron losses in localized regions of strong magnetic fields (e.g., the lenticular feature and the w1.5 and w2 regions). Therefore, the shock–cloud interaction scenario can naturally explain the large-scale structure of the X-ray jets dominated by synchrotron emission.
As noted above, very-high-energy (VHE) gamma-rays have been detected from the X-ray jets of SS 433 by H.E.S.S. and LHAASO (H. E. S. S. Collaboration et al. 2024; Lhaaso Collaboration et al. 2025). These emissions are likely of leptonic origin. The extent to which local magnetic field amplification in the head regions driven by shock–cloud interactions contributes to the acceleration of cosmic-ray electrons responsible for the VHE gamma-ray emission is not yet clear and is beyond the scope of this paper. Numerical simulations that incorporate turbulence driven by jet–cloud interactions, together with particle acceleration processes such as DSA, will be required to fully understand the origin of the high-energy emission.
On the observational side, high-resolution molecular-line studies with Atacama Large Millimeter/submillimeter Array will be crucial for resolving the morphology and spatial extent of the molecular clumps. Observations of multiple molecular transitions, including optically thinner tracers, will also help constrain the physical conditions of the clumps and clarify the relationship between the CO-bright cores and the X-ray-emitting interaction layers.
5. Conclusion
We report the first identification of molecular clumps likely associated with the rebrightening regions of the X-ray jets of SS 433, based on observations with the Nobeyama 45 m Radio Telescope. These clumps exhibit a clear spatial correlation with the X-ray emission, and the hardness ratio is enhanced at their surfaces. These results indicate that the rebrightening of the X-ray jets is likely caused by magnetic field amplification due to jet–cloud interactions, which leads to enhanced synchrotron emission. Future high-resolution molecular-line observations will be essential for resolving the detailed morphology and physical conditions of the clumps and for further testing their physical association with the X-ray jets.
Acknowledgments
We are grateful to Dr. Naomi Tsuji for providing the Chandra datasets. We thank the anonymous referee for useful comments and constructive suggestions. This study was supported by JSPS KAKENHI grant Nos. Haruka Sakemi: 22K20386, 23K13148, and 26K17195; Hidetoshi Sano: 24H00246; Yasuo Fukui: 21H00040 and 22H00152; Mami Machida: 22H01272, 23K22543, and 24K00672; Shigeo S.Kimura: 23H04899, 26K00733, and 26K00696; Masato I.N. Kobayashi: 22K14080; Kengo Tachihara: 20H01945 and 23K20238. Shigeo S.Kimura acknowledges the support by the Tohoku Initiative for Fostering Global Researchers for Interdisciplinary Sciences (TI-FRIS) of MEXT’s Strategic Professional Development Program for Young Researchers. The Nobeyama 45 m radio telescope is operated by Nobeyama Radio Observatory, a branch of National Astronomical Observatory of Japan.