Abstract
We present near-infrared spectroscopy of Nova Herculis 2021 (V1674 Her), obtained over the first 70 days of its evolution. This fastest nova on record displays a rich emission line spectrum, including strong coronal line emission with complex structures. The hydrogen line fluxes, combined with a distance of  kpc, give an upper limit to the hydrogen ejected mass of
  M⊙. The coronal lines appeared at day 11.5, the earliest onset yet observed for any classical nova, before there was an obvious source of ionizing radiation. We argue that the gas cannot be photoionized, at least in the earliest phase, and must be shocked. Its temperature is estimated to be 105.57±0.05 K on day 11.5. Tentative analysis indicates a solar abundance of aluminum and an underabundance of calcium, relative to silicon, with respect to solar values in the ejecta. Further, we show that the vexing problem of whether collisional ionization or photoionization is responsible for coronal emission in classical novae can be resolved by correlating the temporal sequence in which the X-ray supersoft phase and the near-infrared coronal line emission appear.
Original content from this work may be used under the terms of the Creative Commons Attribution 4.0 licence. Any further distribution of this work must maintain attribution to the author(s) and the title of the work, journal citation and DOI.
1. Introduction
Classical nova (CN) systems consist of a semidetached binary containing a white dwarf (WD) and a Roche-lobe-filling secondary star, usually a late-type dwarf. Material from the secondary spills on to the surface of the WD through the inner Lagrangian point, via an accretion disk. The material at the base of the accreted envelope becomes degenerate, triggering a thermonuclear runaway (TNR; for a review see Bode & Evans 2012; Starrfield et al. 2020). Consequently, some 10−5−10−4 M⊙ of material, enriched in C, N, O, Al, and Mg following the TNR, is ejected explosively, at several hundred to several thousand km s−1.
CNe are characterized by the “speed class,” the time t2 (t3) taken for the visual light curve to decline by 2 (3) magnitudes from maximum brightness (Warner 2012). There are empirical relationships between speed class and the energetics of the CN eruption: faster novae have the highest maximum bolometric luminosities, largest outburst amplitudes, and fastest ejecta. Indeed there is a relation between the absolute magnitude at maximum and the rate of the light curve decline, the MMRD relation (see Della Valle & Izzo 2020, and references therein). These relationships are likely a consequence of the mass of the WD on which the TNR occurred (Starrfield et al. 2020).
2. Nova Her 2021 (V1674 Her)
2.1. The Nova
Nova V1674 Her (TCP J18573095+1653396) was discovered by Seidji Ueda on 2021 June 12.5484 UT, at an apparent visual magnitude of 8.4; it attained a peak brightness of V ∼ 6 mag (Munari et al. 2021; Quimby et al. 2021). V1674 Her has been intensely observed since discovery, with optical spectroscopy at high cadence (Woodward et al. 2021c, and references therein), near-infrared (NIR) spectroscopy (Woodward et al. 2021a, and references therein), and ultraviolet photometry and spectroscopy (Kuin et al. 2021). First detected in X-rays on June 14.41 UT, V1674 Her began to show supersoft (SS) X-ray emission near July 1 (Page et al. 2021). Drake et al. (2021) give a detailed discussion of its early X-ray evolution. Radio observations reveal nonthermal emission (Paragi et al. 2021; Sokolovsky et al. 2021). V1674 Her is also a γ-ray source (Maccarone et al. 2021; Li 2021b, and references therein). NICER and Chandra X-ray observations (Pei et al. 2021), as well as pre-outburst archival r-band photometry (Mroz et al. 2021), reveal a ∼501 s oscillation period that is interpreted to be the spin period of a WD in an intermediate polar system.
V1674 Her is distinctive in many ways. Classification-based optical spectra obtained within days of outburst (Woodward et al. 2021c, and references therein) indicate that V1674 Her is of the Fe ii class (Williams 1992; 2012), with several Fe ii lines appearing, most prominent of which was the Fe ii(42) multiplet (however, the possibility of a hybrid Fe iib classification based on a Fe ii to He/N transition around ∼day 5.5 may be noted; Woodward et al. 2021b). At this early epoch the peak of the Hα profile was corrugated, comprising around 9–10 distinct subpeaks separated from each other in velocity by amounts ranging from 180 to 770 km s−1, while exhibiting an overall FWHM ≃ 5850 km s−1. The OI 8446 Å line, dominantly excited by Lyman-β fluorescence, was also prominent, having a FWHM of 5650 km s−1. V1674 Her also showed coronal line emission remarkably early. The detection of coronal lines at 11 days past maximum light is possibly the earliest reported detection of such lines in a nova (see Benjamin & Dinerstein 1990).
On day 28, Wagner et al. (2021) report the detection of broad [Ne v] 3426 Å, as well as [Ne iv] at 4714 Å, and 4724 Å arguing that the presence of these strong neon emission lines is likely attributable to overabundances of neon. If substantiated, V1674 Her would be a member of the “neon nova” class that includes QU Vul, V838 Her, and V1974 Cyg among others.
Here we discuss the exceptionally rapid near-infrared (NIR) spectral evolution of V1674 Her during the first ∼70 days post-eruption, focusing our analyses on the very strong coronal emission that provides direct measures of gas temperatures, ejecta abundances, and insight into the TNR process in novae.
2.2. Light Curve
From the AAVSO database (Kafka 2021), peak brightness was reached on MJD 59,377.9605 (UTC 2021 June 12.96) at V = 6.14, in agreement with Munari et al. (2021), who find V = 6.18 on June 12.90 UT. We adopt June 12.96 UT (MJD 59,377.96) as our time origin, t0, and V = 6.14 at maximum. Based on this t0, and the AAVSO light curve in Figure 1, t2, t3, and t6 are 1 day, 2.2 days, and 14 days, respectively.
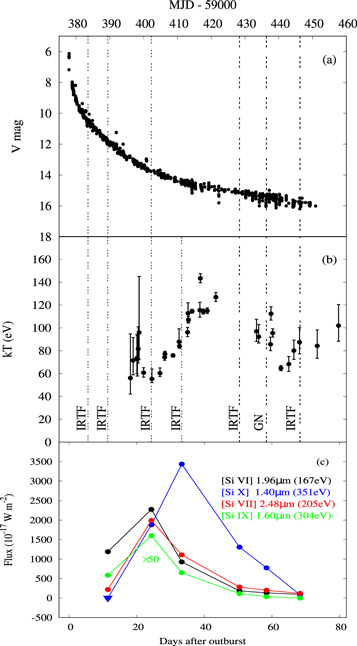
Figure 1. (a) AAVSO V-band light curve with the dates (see Table 1) of the NIR spectroscopy marked. (b) Temperature of the SS X-ray source as determined by fitting a blackbody to Swift data (Drake et al. 2021). (c) Time dependence of selected coronal line fluxes. Energies are IPs from Table 2. Data for [Si ix] 1.60 μm have been multiplied by 50. See the text for details.
Download figure:
Standard image High-resolution imageWhen the t2 and t3 times are considered together, V1674 Her is again remarkable. It is the fastest Galactic nova known to date, of all the compiled, detailed light curves (Strope et al. 2010) surpassing V838 Her (t2 = 1.0, t3 = 3.0) and the recurrent nova U Sco (t2 = 1.0, t3 = 4.0). Optical (Wagner et al. 2021; Woodward et al. 2021c) and NIR (Woodward et al. 2021a) spectroscopy bear this out, with emission line widths and P Cygni profiles indicating ejection velocities ∼6000 km s−1. Such extreme eruptions are characteristic of a TNR that occurred on a WD with a mass very close to the Chandrasekhar limit (Starrfield et al. 2020).
2.3. Reddening and Distance Estimate
The reddening, EB−V , is in the range 0.52–0.58 based on the 6613 Å diffuse interstellar band feature, clearly seen in the high-resolution (R = 220K) optical spectra (Woodward et al. 2021c). From these high-resolution spectra, the interstellar resonance K i line at 7699 Å is measured to have an equivalent width of 0.1349 Å, which gives a reddening EB−V = 0.52 using the calibration by Munari & Zwitter (1997). Munari et al. (2021), from the K i 7699 Å line, measure EB−V = 0.55. The observed color of B–V = 0.72 and 0.55 at t0 and t2, respectively, when compared with the intrinsic colors of novae expected at these early evolutionary times (van den Bergh & Younger 1987), yields EB−V values in the range 0.49–0.57. We adopt EB−V = 0.55.
Adopting the method described in Banerjee et al. (2018, and references therein), an independent estimate of the reddening, together with a distance estimate, can simultaneously be obtained from the intersection of the extinction versus distance curve in the direction to the nova (Marshall et al. 2006), and the curve defined by

where mv = 6.14 at maximum and MV = −9.05 ± 0.5 (for t2 = 1 d derived from the MMRD relation of Della Valle & Livio 1995). The intersection of these two curves yields a distance of  kpc and visual extinction AV
= 1.82 ± 0.33, or EB−V
= 0.59±0.11, assuming that the total-to-selective extinction is 3.10. As a cross-check, applying this method to a similarly fast nova V838 Her (t2 = 2 d), gives distance and AV
estimates of 3.83 kpc and 1.40 magnitudes, respectively, consistent with other compiled measurements (Harrison & Stringfellow 1994). Gaia estimates for the distance to V1674 Her (Bailer-Jones et al. 2021, 2018) have large uncertainties (the parallax measurements are at the limit of usefulness), but the central values are consistent with the latter
kpc and visual extinction AV
= 1.82 ± 0.33, or EB−V
= 0.59±0.11, assuming that the total-to-selective extinction is 3.10. As a cross-check, applying this method to a similarly fast nova V838 Her (t2 = 2 d), gives distance and AV
estimates of 3.83 kpc and 1.40 magnitudes, respectively, consistent with other compiled measurements (Harrison & Stringfellow 1994). Gaia estimates for the distance to V1674 Her (Bailer-Jones et al. 2021, 2018) have large uncertainties (the parallax measurements are at the limit of usefulness), but the central values are consistent with the latter  kpc estimate.
The spectral energy distribution (SED) at maximum, constructed using BV RI values (Munari et al. 2021) dereddened by EB−V = 0.55, yield a blackbody fit with T = 9900 K. The outburst luminosity, assuming d = 4.7 kpc, is Lout = 3.7 × 10⁵ L⊙, which is ∼9 times the Eddington luminosity of a 1.3 M⊙ WD.
3. Observations and Data Reduction
Spectra of V1674 Her were obtained with SpeX (Rayner et al. 2003) on the 3.2 m NASA IRTF. These data were reduced with corrections for telluric absorption(s) using the SpexTool pipeline (Cushing et al. 2004). The spectra were flux calibrated using an A0 standard star observed at a comparable airmass ΔAM ≤ 0.14. The IRTF flux calibrations are accurate to ±10%. The observational log is presented in Table 1, and the spectra are shown in Figure 2. The times of the observations in relation to the visual light curve are shown in the top panel of Figure 1.
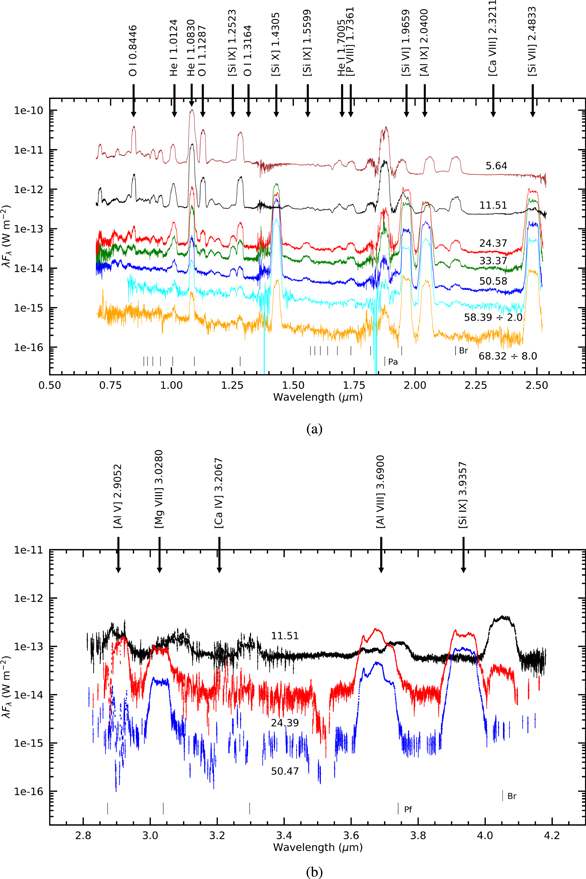
Figure 2. Observed near-infrared spectra of V1674 Her at different epochs (Table 1). The spectral points are clipped with a signal-to-noise ratio threshold of ≥ 2.5. Coronal lines (see Table 2), and representative He and O lines are identified. The small ticks in the bottom of each panel indicate the wavelength of various hydrogen emission line series (Brackett, Paschen, and Pfund). (a) 0.7–2.5 μm range; data for day 58.39 and 68.32 have been divided by factors of 2 and 8, respectively, for clarity. (b) 2.7–4.3 μm range (SpeX LXD mode thermal wavelengths). The spectrum on day 68.32 in panel (a) and spectra on days 24.39 and 50.42 in panel (b) have been smoothed using a Savitzky–Golay filter using an SG window = 7.5 and degree = 2 (for a description see Cushing et al. 2004). The observed spectra are available as data behind the figure.(The data used to create this figure are available.)
Download figure:
Standard image High-resolution imageTable 1. Observational Log V1674 Her a
| Date | Mean MJD | Day b | SpeX | IT d | Average | Standard |
|---|---|---|---|---|---|---|
| (2021 UT) | (−59,000) | Mode c | (s) | Airmass | ||
| Jun 18.54 | 383.544 | 5.64 | SXD | 356 | 1.08 | HD165029 |
| Jun 24.42 | 389.409 | 11.51 | SXD | 356 | 1.06 | HD165029 |
| Jun 24.42 | 389.424 | 11.52 | LXD | 445 | 1.03 | ⋯ |
| Jul 07.27 | 402.274 | 24.37 | SXD | 657 | 1.65 | HD165029 |
| Jul 07.29 | 402.291 | 24.39 | LXD | 834 | 1.47 | ⋯ |
| Jul 16.27 | 411.268 | 33.37 | SXD | 956 | 1.46 | HD177724 |
| Aug 2.34 | 428.341 | 50.38 | SXD | 1977 | 1.01 | HD165029 |
| Aug 2.37 | 428.373 | 50.47 | LXD | 890 | 1.01 | ⋯ |
| Aug 10.35 | 436.353 | 58.39 | GNIRS e | 720 | 1.01 | HIP91118 |
| Aug 20.28 | 446.284 | 68.32 | SXD | 478 | 1.01 | HD165029 |
Notes.
a Reduced spectra are provided as metadata behind the figures. b Day to = June 12.96 UT (MJD 59,377.96). c All SpeX spectra were obtained with a 0Download table as: ASCIITypeset image
JH K photometry also was obtained with the SpeX guider imager using a 10 point dither with 14.93 s exposure time at each position, and at an average airmass of 1.13. Data reduction used standard infrared techniques. Instrumental magnitudes obtained through aperture photometry were calibrated against several 2MASS field stars. The JH K magnitudes were J = 12.74 ± 0.10, H = 12.48 ± 0.12, K = 10.58 ± 0.05 (2021 July 16.33) and J = 13.81 ± 0.05, H = 13.59 ± 0.03, K = 11.59 ± 0.14 (2021 August 2.44).
A single 0.82–2.52 μm spectrum of V1674 Her was obtained on UT 2021 August 10 at the Frederick C. Gillett Gemini North 8 m Telescope, with the facility spectrometer GNIRS (Elias et al. 2006) for program GN-2021B-FT-101 (see Table 1). Data reduction utilized IRAF 9 and Figaro commands and produced the spectrum shown in Figure 2. The GNIRS observations were obtained in poor seeing and through thin but variable clouds; consequently, the flux calibration is uncertain by ∼30%.
4. Results and Discussion
The spectra are shown in Figure 2, the two panels covering the wavelength ranges 0.7–2.5 μm and 1.8–4.1 μm, corresponding to the SpeX short-cross dispersed (SXD) and long-cross dispersed (LXD) wavelength ranges, respectively. Here, the discussion focuses mainly on the coronal lines; a more detailed discussion of the SEDs is deferred to a later paper.
4.1. Ejecta Mass Estimate
Using the dereddened fluxes of Pa-β and Br-γ, we ascertain that their relative strengths follow Case B predictions on day 11.51, within the parameter space expected to represent the ejecta, viz. T = 5000–20,000 K, and electron density ne ∼ 106–109 cm−3. Other H lines could not be used because of blending with neighboring lines, leading to inaccurate line flux estimates. We assume the ejecta density on day 11.51 to be ne = 106.6 cm−3 since the [Al vi] 3.66 μm line, which has a critical density of ne = 106.6 cm−3 at T = 10,000 K (Greenhouse et al. 1993), is detected on this day.
The ejecta mass is given by

where f is the dereddened flux in an H line in W m−2, is the emissivity in the line in erg s−1 cm3 (Storey & Hummer 1995), and ne
is the electron density per cm3. Using the Pa-β and Br-γ lines, and assuming
 kpc and a pure H composition, the ejecta mass is
  M⊙, wherein the upper limit on the mass is obtained by choosing ne
= 106.6 cm−3.
M⊙, wherein the upper limit on the mass is obtained by choosing ne
= 106.6 cm−3.
4.2. The Coronal Lines
The profiles of four nebular lines (two H i and two He i) on day 5.64 are shown in Figure 3(a) to illustrate the complexities of the line profiles. The similarities of the details in each of these profiles are remarkable. In particular, there are identifiable features at radial velocities –2480, –1820, –60, 730, 1140, 1530, and 2310 km s−1, each with an uncertainty of ±100 km s−1. The velocity structure seen at an epoch (day 50.43) when the coronal lines are strong, Figure 3b, is similar.
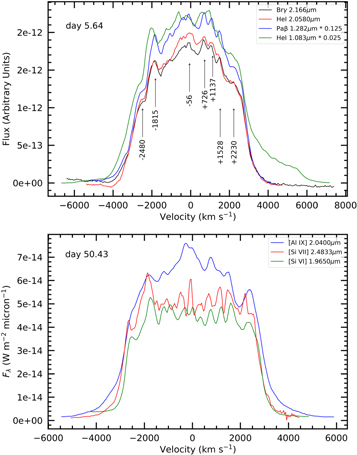
Figure 3. Velocity profiles of the emission lines. (a) Two H recombination lines and two He i lines on day 5.64 in velocity space. (b) Coronal lines on day 50.43.
Download figure:
Standard image High-resolution imageThe coronal line fluxes are listed in Table 2. Uncertainties in the flux determinations are estimated to be ≤ ±20% for the stronger lines, and as much as ±40% for the weaker. The table also lists the ionization potential (IP) of the lower ion (thus, the entry for [S ix] gives the IP of S viii). The parameter kT* denotes the temperature T* at which half the photons emitted by the corresponding blackbody can ionize the lower ion; we take this to imply the temperature of the ionizing source that is capable of producing the requisite ion.
Table 2. V1674 Her Coronal Line Dereddended Fluxes
| Ion | λ | Transition | IP | kT* | Ψ | Line Fluxes ( × 10−17 W m−2) | |||||||
|---|---|---|---|---|---|---|---|---|---|---|---|---|---|
| (μm) | u − ℓ | (eV) | (eV) | 11.51d | 24.38d | 33.37d | 50.43d | 58.39d | 68.32d | ||||
| [S ix] a | 1.2523 | 3P1 − 3P2 | 329 | 137 | — | 1736 | 98 | 49 | 9.2 | 5.0 | 1.7 | ||
| [Si x] | 1.4305 |
2P P P
| 351 | 146 | — | <2.3 | 1878 | 3437 | 1307 | 774 | 82 | ||
| [Si ix] | 1.5599 | 3P2 − 3P0 | 304 | 127 | — | 11.7 | 32 | 13 | 2.3 | 0.7 | < | ||
| [P viii] b | 1.7361 | 3P1 − 3P2 | 264 | 110 | — | 231 | 32 | 15 | 2.1 | 1.4 | < | ||
| [Si xi] | 1.9320 |
3P Po
1 Po
1
| 401 | 167 | — | <8.5 | <1.8 | < 0.2 | |||||
| [Si vi] | 1.9650 |
2P P P
| 167 | 70 | 0.423 | 1190 | 2274 | 927 | 185 | 133 | 95 | ||
| [Al ix] c | 2.0400 |
2P P P
| 285 | 119 | — | <4 | 1035 | 1004 | 296 | 216 | 72 | ||
| [Ca viii] | 2.3211 |
2P P P
| 127 | 53 | <5.88 | 5.1 | 1.25 | <0.6 | < 0.1 | ||||
| [Si vii] | 2.4833 | 3P1 − 3P2 | 205 | 86 | 0.695 | 218 | 1990 | 1107 | 283 | 200 | 121 | ||
| [Al v] | 2.9052 |
2P P P
| 120 | 50 | 0.456 | 51 | 287 | — | — | — | |||
| [Mg viii] | 3.0280 |
2P P P
| 225 | 94 | — | <5 | 288 | — | 103 | — | — | ||
| [Ca iv] d | 3.2067 |
2P P P
| 51 | 21 | — | — | — | — | |||||
| [Al vi] | 3.6597 | 3P1 − 3P2 | 154 | 64 | 1.365 | 47 | — | — | — | ||||
| [Al viii] | 3.6900 | 3P2 − 3P1 | 242 | 101 | — | — | — | — | |||||
| [Si ix] | 3.9357 | 3P1 − 3P0 | 304 | 127 | — | <1.5 | 614 | — | 468 | — | — | ||
Notes. Upper limits are 1σ. IP is the ionization potential of the lower ionization state. See the text for explanation of kT*. Table entry with “—” indicates that the observation did not cover the wavelength range.
a Heavily blended with He i 1.253 μm. b Blended with H i 10–4 1.737 μm. c Blended with He i 2.058 μm. d Not strictly coronal according to the definition of Greenhouse et al. (1990). The effective collision strengths (Ψ) are the collisional strengths Ω averaged over a thermal electron distribution and are taken from the IRON Project (Hummer et al. 1993; Badnell et al. 2006) online database (http://cdsweb.u-strasbg.fr/tipbase/home.html) interpolated to a temperature of 105.57±0.05.Download table as: ASCIITypeset image
The time dependence of the silicon coronal lines, among the strongest and best recorded coronal lines in the spectrum, is shown in Figure 1. It is clear from Table 2 and Figure 1 that coronal line emission was first unambiguously detected, via the [Si vi] 1.96 μm, [Si vii] 2.48 μm, and the [Al vi] 3.66 μm lines, on June 24 (day 11.51), well before the SS phase began (Page et al. 2021; Drake et al. 2021). In this respect V1674 Her is again a record breaker. Both V1500 Cyg and V838 Her, two of the fastest novae with t2 times of 2 and 1 day(s) respectively, were first detected to show coronal emission at 29 and 17 days, respectively, past maximum light (Chandrasekhar et al. 1993; Benjamin & Dinerstein 1990).
The presence of coronal lines so early in the evolution implies that, despite the presence of a hot central WD remnant, the initial coronal emission could not have been caused by photoionization. For example, [Si vii] 2.48 μm is present on day 11.51 even though the ionization of Si vi requires 205 eV, far exceeding the temperature of the ionizing source (kT* = 86 eV) that would emit sufficient photons, and is well in excess of the source temperature as measured by The Neil Gehrels Swift Observatory (see Figure 1).
We therefore conclude that the coronal emission arose from collisional ionization by particles that gained sufficient energy from shock heating. This contradicts the commonly assumed view that, when the central source is sufficiently hot, photoionization is the principal mechanism for coronal line generation (see Benjamin & Dinerstein 1990). Plausible support for shocks comes from the multipeaked line profiles shown in Figure 3, which were even more clearly resolved into a large number of substructures in very high resolution (R = 220,000) spectra (Woodward et al. 2021c). This points to parcels of gas in the ejecta having widely different velocities. Collisions between such parcels would not only lead to shock heating, but might also account for the gamma-ray emission seen in the early stages of V1674 Her (Li 2021a).
To make estimates, we suppose that the ejecta initially are fully ionized and have a temperature ∼104 K, typical for CNe. For a gas of solar composition, the rms ion speed is Vrms ∼ 20 km s−1. Figure 3 suggests that there must exist in the ejecta parcels of gas with relative speed Vrel ∼ 1000 km s−1. Thus, Vrel/Vrms ∼ 50, implying that the gas is shocked, and that the shock is strong.
Under these circumstances, the temperature of the shocked gas could be as high as

which is ∼14 × 106 K, or kTshock ∼ 1200 eV. This is more than sufficient to account for the early presence of coronal lines.
However, photoionization may still have a role in the coronal line emission. As the SS phase commences, an additional hard ionizing source of radiation becomes available (in addition to shock heating). The impact of this source is considerable, especially in the case of V1674 Her since it has been shown to have the hottest galactic SS source of all well-documented SS sources (see Page & Osborne 2014). As the bottom panel of Figure 1 shows, the degree of ionization for the Si ion slowly increases with time as the SS source becomes hotter. The strength of the [Si x] 1.43 μm line (IP = 351 eV), the strongest coronal line in the spectrum, likely reflects the extreme high temperature of the central WD surface. The overall picture that emerges is that both collisional ionization and photoionization are operational, but the key result from this work is that collisional ionization preceded photoionization, since coronal lines were seen about a week before the SS phase was detected. Thus, a problem that is hard to resolve, whether collisional ionization or photoionization is responsible for coronal emission in CNe, can be resolved as has been done here by correlating the temporal sequence in which the X-ray SS phase and the NIR coronal emission appear.
4.3. Temperature of the Coronal Gas
The coronal lines were first detected on day 11.51, and likely the coronal emission was entirely the result of collisions. We can, therefore, estimate the gas temperature using the fluxes of the various silicon lines at this time. We estimate the relative proportions of Si ions as a function of temperature using the prescription of Greenhouse et al. (1990), the ionization equilibrium data in Arnaud & Rothenflug (1985), and the effective collisional strength values Ψ listed in Table 2. We find the gas temperature Tgas ≃ 105.57±0.05 K, (kTgas ∼ 27 keV). This value is consistent with the upper limit on the flux in the [Si x] 1.43 μm line, which requires that Tgas be less than 105.7 K. This value of Tgas is similar to that found in the shock-excited gas around the recurrent nova RS Oph, in which the ejected material runs into, and shocks, the secondary wind (Evans et al. 2007; Banerjee et al. 2009). We assume Tgas ≃ 105.5 K in what follows.
4.4. Abundance Estimate
Greenhouse et al. (1990, 1993) describe a method for estimating the abundance ratios for selected species. For the present work we use dereddened fluxes from Table 2 for lines where there are no blends. Using the [Al v] 2.90 μm line, we find that n(Al)/n(Si) = 0.17 using the [Si vii] line, and = 0.14 derived from the [Si vi] line. A value of n(Al)/n(Si) = 4.5 × 10⁻² is derived from the [Al vi] and [Si vi] lines. Hence the mean n(Al)/n(Si) is ≃0.11. Using the [Ca viii] line, we get a more consistent result, viz. n(Ca)/n(Si) = 2.6 × 10⁻³ from the [Si vi] line, and = 2.2 × 10⁻³ from the [Si vii] line. The latter values represent lower limits as collision strengths were not explicitly computed at the assumed temperature for the [Ca viii] line. The solar values are 0.081 (Al/Si) and 0.062 (Ca/Si), respectively (Asplund et al. 2021). We tentatively conclude that aluminum is near solar abundance, and calcium is underabundant relative to silicon, with respect to solar values. A more detailed abundance determination awaits future modeling efforts.
Synoptic multiwavelength studies of this remarkable nova continue as the system returns to quiescence.
The authors appreciate extensive scientific discussions with A. Evans. The authors also thank the anonymous referee for suggestions that improved the manuscript. This Letter is based on observations obtained under IRTF program 2021A012, and 2021B996. It is also based on observations obtained for program GN-2021B-FT-101 at the international Gemini Observatory, a program of NSF’s NOIRLab, which is managed by the Association of Universities for Research in Astronomy (AURA) under a cooperative agreement with the National Science Foundation on behalf of the Gemini Observatory partnership: the National Science Foundation (United States), National Research Council (Canada), Agencia Nacional de Investigación y Desarrollo (Chile), Ministerio de Ciencia, Tecnología e Innovación (Argentina), Ministério da Ciência, Tecnologia, Inovações e Comunicações (Brazil), and Korea Astronomy and Space Science Institute (Republic of Korea). D.P.K.B. is supported by a CSIR Emeritus Scientist grant-in-aid, which is being hosted by the Physical Research Laboratory, Ahmedabad. K.L.P. acknowledges support from the UK Space Agency. C.E.W. acknowledges partial support from NASA PAST 80NSSC19K0868 that enabled our observations. We acknowledge with thanks the variable star observations from the AAVSO International Database contributed by observers worldwide and used in this research.
Facilities: IRTF (SpeX - , Guidedog) - , Gemini North (GNIRS) - , Swift - , AAVSO - , Gaia. -
Software: Figaro, IRAF (Tody 1993), Starlink (Currie et al. 2014), Astropy (Astropy Collaboration et al. 2018).
Footnotes
- 9
IRAF is distributed by the National Optical Astronomy Observatories, which are operated by the Association of Universities for Research in Astronomy, Inc., under cooperative agreement with the National Science Foundation.