Abstract
We report the discovery of SCGG-z5 (nicknamed the Shirui Group), a compact galaxy protogroup at z = 4.97 in the MACS0416 field, identified from the SAPPHIRES Early Data Release. Six members are spectroscopically confirmed via Hα emission, spanning 4.96 ≤ zspec ≤ 4.98 within a projected diameter of ∼16 pkpc. Spectral energy distribution fitting yields individual stellar masses  , a total group stellar mass of
  ; three of the six members lie above or on the star-forming main sequence at z ∼ 5, by up to 0.5 dex. Pixel-by-pixel analysis reveals diverse resolved radial star formation profiles; three members show declining specific star formation rate (sSFR) radial profiles and outward-rising stellar age gradients, consistent with inside-out stellar mass growth, while the most massive member shows a tentative inverted sSFR profile suggestive of reduced central star formation. The line-of-sight velocity dispersion over all six members is
  km s−1. The projected mass estimator yields
  , consistent with a dark-matter-dominated group halo. EAGLE simulations of structurally similar groups predict full coalescence by z ∼ 3–4, with the merged remnant reaching
  by z ∼ 1, consistent with SCGG-z5 representing a rare pre-coalescence phase of early massive galaxy formation, possibly tracing the assembly of a future brightest group or cluster galaxy.
Original content from this work may be used under the terms of the Creative Commons Attribution 4.0 licence. Any further distribution of this work must maintain attribution to the author(s) and the title of the work, journal citation and DOI.
1. Introduction
Understanding the formation of the most massive galaxies (with a stellar mass of M∗ ≳ 1011 M⊙) is a central goal of modern observational cosmology. In the ΛCDM framework, these systems grow hierarchically; their dark-matter haloes assemble through the successive merging of lower-mass subhaloes, with the most rapid stellar mass growth occurring at z > 2 through a combination of in situ star formation and the accretion of low-mass satellite galaxies (e.g., P. F. Hopkins et al. 2009; L. Oser et al. 2010; M. Hirschmann et al. 2012). Galaxy overdensities, protoclusters and protogroups, trace the peaks of the primordial density field and are the preferred sites of this accelerated assembly. These structures are subject to downsizing, whereby galaxies in the densest environments, especially at the center of the overdensity, evolve more rapidly than the field population (e.g., R. A. Overzier 2016; Y.-K. Chiang et al. 2017; D. P. Marrone et al. 2018). Within such environments, frequent gravitational interactions are expected to trigger starbursts, drive morphological transformations, and ultimately lead to group-scale coalescence into a single massive system (e.g., C. Mendes de Oliveira & P. Hickson 1994; M. E. Cluver et al. 2013).
Among high-redshift overdensities, compact galaxy groups (physically associated systems spanning only tens of kiloparsecs) represent a particularly short-lived and physically extreme phase. Dense, previrialized configurations enable efficient tidal torquing that strips angular momentum from the interstellar gas, driving massive inflows toward galaxy centers and triggering compaction, the rapid formation of ultradense, star-forming cores (A. Dekel & A. Burkert 2014; S. Tacchella et al. 2016). Frequent mergers simultaneously remove gas from the outskirts and can fuel nuclear activity, accelerating gas consumption and potentially triggering quenching (e.g., S. L. Ellison et al. 2011; P. F. Hopkins et al. 2011). This fast-track evolutionary pathway makes compact groups plausible progenitors of the dense, quiescent systems observed at later cosmic epochs (e.g., M. Ando et al. 2022; S. Jin et al. 2024; N. S. Haryana et al. 2025). Yet state-of-the-art cosmological simulations continue to underpredict the abundance of massive quiescent galaxies at z > 4 (e.g., G. Girelli et al. 2019; A. C. Carnall et al. 2023; F. Valentino et al. 2023; W. M. Baker et al. 2025), in part because direct observational constraints on the precoalescence merging phase remain elusive; imaging member galaxies before they merge requires both the sensitivity to detect low-mass, high-redshift systems and spectroscopic confirmation to establish genuine physical associations.
JWST has revealed a growing population of extreme galaxy overdensities and protocluster candidates spanning z ∼ 5–8 (e.g., J. M. Helton et al. 2024a, 2024b; F. Sun et al. 2024; T. Morishita et al. 2025a; R. Laishram et al. 2026a), demonstrating that dense large-scale environments were already shaping galaxy evolution within the first Gyr of cosmic history. Several compact multigalaxy structures have been identified at high redshift (e.g., T. Díaz-Santos et al. 2018; N. B. Sillassen et al. 2022; S. Jin et al. 2023; S. Arribas et al. 2024; N. B. Sillassen et al. 2024; Y. Fudamoto et al. 2025; W. Hu et al. 2025; T. Morishita et al. 2025b), and JWST has now enabled their systematic study. CGG-z4 at z = 4.3 (M. Brinch et al. 2025) is spectroscopically confirmed with gas depletion times of ≲100 Myr, indicating imminent quenching. CGG-z5 at z ∼ 5.2 (S. Jin et al. 2023) comprises six candidate members within ∼10 × 20 kpc2, but membership rests on photometric redshifts alone. CGG-z7 at z ∼ 7.04 (X. Wei et al. 2026) extends this family to the epoch of reionization as a previrialized structure near its first gravitational crossing. A related system at z = 4.91 (T. S. Tanaka et al. 2024), with a clumpy morphology and central active galactic nuclei (AGN), may represent a later stage in this evolutionary sequence as members begin to coalesce. Together, these systems suggest that compact, dynamically active multigalaxy structures may be a recurring feature of massive galaxy assembly, yet the physical conditions governing their evolution at z ∼ 5 are observationally largely unexplored.
In this Letter, we report the discovery of SCGG-z5 (SAPPHIRES Compact Galaxy Group at z ∼ 5, also referred to as the Shirui Group11 ), a compact galaxy group at z = 4.97 identified in the SAPPHIRES Early Data Release (EDR; F. Sun et al. 2025). Six members are spectroscopically confirmed via Hα emission in JWST/NIRCam wide-field slitless spectroscopy (WFSS), making this a rare compact group at z ∼ 5 with all members confirmed, within a projected diameter of ∼16 pkpc. The depth and 13-band photometric coverage of SAPPHIRES further enable pixel-by-pixel spectral energy distribution (SED) fitting of individual members, revealing a diversity of evolutionary stages within this single ∼16 pkpc environment. The group dynamics are consistent with an early, dynamically assembling stage.
Throughout this work, we adopt a flat ΛCDM cosmology with H0 = 70 km s−1 Mpc−1, Ωm = 0.3, and ΩΛ = 0.7. All magnitudes are in the AB system.
2. Data and Methods
2.1. SAPPHIRES Early Data Release
This work uses data from the SAPPHIRES EDR (F. Sun et al. 2025), a JWST Cycle-3 Treasury program (GO-6434; PI: Egami, E.) obtaining NIRCam imaging and WFSS in pure parallel, with a total dual-channel exposure time of 47.2 hr in the MACS J0416 field.
NIRCam imaging covers 13 broad- and medium-band filters spanning 0.6–5.0 μm (F070W, F090W, F115W, F140M, F150W, F182M, F200W, F210M, F277W, F335M, F356W, F410M, F444W), reaching 5σ point-source depths of ∼28.4–29.8 AB mag (F. Sun et al. 2025). WFSS observations in F356W and F444W Grism-C provide spectral coverage at 3.1–5.0 μm; the median 5σ line sensitivity is ∼6 × 10⁻¹⁹ erg s−1 cm−2 at 3.7 μm (F. Sun et al. 2025). All images were reduced and drizzled to  pix−1 (F. Sun et al. 2025).
Source detection and spectroscopic redshift measurement are described fully in F. Sun et al. (2025); here we summarize the aspects relevant to our sample. The photometric catalog contains 22,107 sources, of which 1060 have confirmed spectroscopic redshifts at z ≃ 0–8.5. Redshift confidence levels (zconf) follow a 1–6 scale. zconf ≥ 4 indicates ≥2 emission lines detected; zconf ≤3 indicates a single line.
2.2. SED Fitting
We derive physical properties for all six members (Section 3.1) by fitting their 13-band NIRCam photometry with Bagpipes (A. C. Carnall et al. 2018), adopting the same configuration as the SAPPHIRES EDR (F. Sun et al. 2025); we refer the reader there for full details. Briefly, we use BPASS v2.2.1 binary stellar templates (E. R. Stanway & J. J. Eldridge 2018) with a P. Kroupa et al. (1993) initial mass function (IMF), a delayed-τ star formation history (SFH), D. Calzetti et al. (2000) dust attenuation with birth-cloud factor η = 2 for stars younger than 10 Myr (F. Sun et al. 2025), and free stellar metallicity and nebular ionization parameter (T. Y.-Y. Hsiao et al. 2023). All parameters adopt uniform priors: stellar age t ∈ [0.001, 2.0] Gyr, e-folding timescale τ ∈ [0.01, 10.0] Gyr, metallicity Z ∈ [0.0005, 2.0] Z⊙, ionization parameter ![$\mathrm{log}U\in [-4,-1]$](https://content.cld.iop.org/journals/2041-8205/1007/2/L35/revision1/apjlae88ffieqn7.gif) , and dust attenuation AV ∈ [0, 8] mag. We adopt KRON apertures and apply point-source aperture corrections to determine total fluxes, with a 5% photometric error floor (F. Sun et al. 2025). Spectroscopic redshifts are held fixed (Table 1). Posteriors are sampled with Nautilus (J. U. Lange 2023); all quantities are 50th-percentile values with 16th/84th uncertainties. Star formation rates are averaged over the last 100 Myr of the best-fit SFH.
, and dust attenuation AV ∈ [0, 8] mag. We adopt KRON apertures and apply point-source aperture corrections to determine total fluxes, with a 5% photometric error floor (F. Sun et al. 2025). Spectroscopic redshifts are held fixed (Table 1). Posteriors are sampled with Nautilus (J. U. Lange 2023); all quantities are 50th-percentile values with 16th/84th uncertainties. Star formation rates are averaged over the last 100 Myr of the best-fit SFH.
Table 1. Properties of the Six Spectroscopically Confirmed Members of SCGG-z5
| ID | zspec |

| SFRHα,corr | SFRSED | AV | Age | r1/2 | n |
|---|---|---|---|---|---|---|---|---|
| (M⊙ yr−1) | (M⊙ yr−1) | (mag) | (Gyr) | (kpc) | ||||
| 14666 (SCGGa) | 4.971 |

|

|

|

|

|

| 0.72 ± 0.05 |
| 37276 (SCGGb) | 4.972 |

|

|

|

|

|

| 0.77 ± 0.10 |
| 14728 (SCGGc) | 4.970 |

|

|

|

|

| 1.21b± 0.11 | 0.81 ± 0.13 |
| 14658 (SCGGd) | 4.958 |

|

|

|

|

| 0.57 ± 0.02 | 0.70 ± 0.04 |
| 14511 (SCGGe) | 4.979 |

|

|

|

|

| 0.61 ± 0.03 | 1.85 ± 0.18 |
| 14543 (SCGGf) | 4.977 |

|

|

|

|

| 0.57a± 0.08 |

|
Notes. Source IDs from F. Sun et al. (2025); coordinates (R.A., decl.) available therein. Stellar masses, AV, and ages: Bagpipes SED fitting (Section 2); 50th-percentile posteriors with 16th/84th uncertainties; age is the SFH onset time (delayed-τ model). SFRHα,corr: R. L. Theios et al. (2019) calibration with AHα = 0.822 AV (D. Calzetti et al. 2000); lower limits (Section 3.1). SFRSED: Bagpipes SFR from the delayed-τ SED fit; 16th/84th-percentile uncertainties. r1/2 and n: PySersic (I. Pasha & T. B. Miller 2023) MCMC Sérsic fitting in F200W (Section 3.2); primary component unless otherwise noted; 16th/84th-percentile uncertainties. aSCGGf: r1/2 and n refer to the secondary component (1.44 kpc projected offset from the primary). bSCGGc: single-component parameters retained; two-component fit yields degenerate posteriors.
Download table as: ASCIITypeset image
For the spatially resolved analysis, NIRCam imaging in all 13 bands was point-source function (PSF)-matched to the F444W resolution ( ) and adaptively binned per galaxy using piXedfit (Abdurro’uf et al. 2021), requiring a signal-to-noise ratio (S/N) ≥ 3 per bin in F444W. The same Bagpipes model configuration as the integrated fits was adopted, with spectroscopic redshifts held fixed. Given the extreme compactness of the group (minimum pair separation
  , corresponding to 16.9 pixels at the drizzled scale of
  pix−1), bins are assigned strictly within each galaxy’s segmentation footprint; those near adjacent members should be interpreted with caution. Azimuthally averaged radial profiles were derived by computing the projected distance of each pixel from the SAPPHIRES EDR photometric catalog position of each galaxy, converted to pixel coordinates via the WCS of the per-galaxy flux-map stamp; galaxy pixels are isolated using the piXedfitGALAXY_REGION segmentation mask, ensuring each pixel contributes to at most one member’s profile. Pixels are binned into eight equal-width circular annuli from zero to the maximum segmentation radius, with each bin reporting the median and 16th/84th-percentile values; bins containing fewer than five pixels are discarded. As a robustness check, profiles rederived using the PySersic primary-component centroid positions in place of the catalog coordinates yield consistent gradient classifications. To test whether the derived gradients are affected by low S/N in the outskirts, this spatially resolved analysis was additionally repeated with S/N ≥ 5 per bin; the outcome is presented alongside the radial profiles in Section 3.3.
3. Results
3.1. Spectroscopic Confirmation and Physical Properties of SCGG-z5
We report SCGG-z5, a compact galaxy group at z ≈ 4.97 in the MACS0416 field, identified through a systematic search for spectroscopic overdensities in the SAPPHIRES catalog. A one-sided Poisson test applied to the 1D redshift distribution of Hα emitters at 4.89 ≤ z ≤ 5.05 yields Nobs = 58 versus  expected from the background rate measured over 3.9 ≤ z ≤ 6.6 (excluding the spike window), corresponding to a significance of 7.1σ (one-sided Poisson p-value p = 6.8 × 10⁻¹³). The 1D redshift distribution illustrating this overdensity spike is shown in the top-right panel of Figure 1.
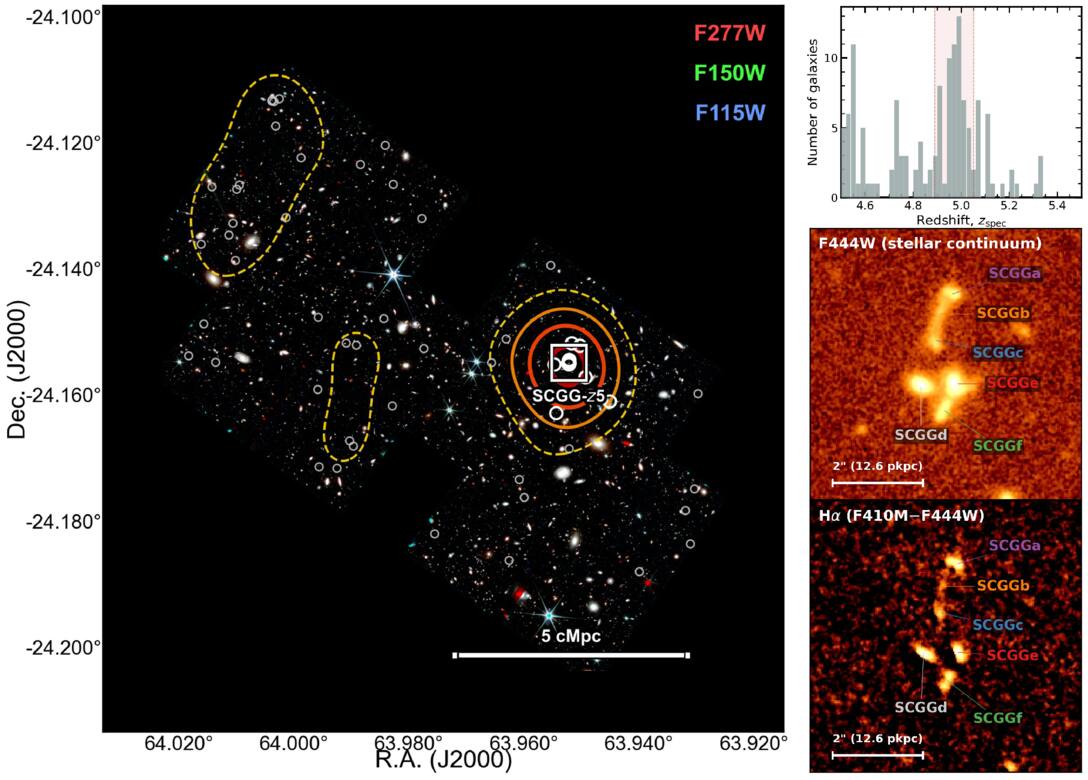
Figure 1. Left panel: wide-field JWST NIRCam RGB image (F277W/F150W/F115W). Overlaid contours show the 2D Gaussian KDE overdensity δ = (ρ/〈ρ〉) − 1 of Hα emitters at 4.89 ≤ z ≤ 5.05, with levels at δ = 1 (gold dashed), 2 (orange), 3 (red), and 4 (dark red), computed with a fixed smoothing scale of σKDE = 1 cMpc. Open gray circles mark the 58 spectroscopic Hα emitters in the redshift slice; filled white circles indicate members within the δ ≥ 2 region. The white box marks the SCGG-z5 compact group. Top-right panel: spectroscopic redshift distribution of SAPPHIRES Hα emitters at 4.5 ≤ zspec ≤ 5.5; dashed lines and shading mark the overdensity spike window 4.89 ≤ z ≤ 5.05 (Nobs = 58, 7.1σ). Middle-right panel: F444W continuum (stellar continuum). Bottom-right panel: Hα emission map from the F410M−F444W band difference. In all right panels, confirmed members are labeled by their SCGG designation (Table 1).
Download figure:
Standard image High-resolution imageTo characterize the projected spatial distribution, we apply a 2D Gaussian kernel density estimate (KDE) to the positions of the 58 members, adopting a fixed smoothing scale of σKDE = 1 cMpc (≈167 pkpc at z ≈ 4.97), which is a factor of ∼21 larger than the maximum projected diameter of the compact group (≈16 pkpc); this scale is chosen to trace large-scale structure and is not comparable to the group size. The KDE surface density field reaches 5.0σ above the field mean (〈Σ〉 = 0.14 gal cMpc−2; σ denotes the standard deviation of the KDE density field) at its peak, with peak overdensity δpeak ≡ (ρ/〈ρ〉) − 1 = 4.3. As an independent, kernel-free verification, a Poisson test within a circular aperture of radius R = 1 cMpc centered on the KDE peak yields Nobs = 11 versus  (7.0σ, p = 1.6 × 10⁻¹²). Here
  , where Σfield is the background Hα surface density derived by dividing the expected background count from the 1D test above by the survey footprint area. This confirms that the overdensity significance is insensitive to the KDE smoothing scale. The KDE map is used solely to visualize the projected overdensity structure; all quoted significances are derived from the kernel-free Poisson tests above, which are independent of the KDE smoothing scale and not subject to KDE boundary effects. Tests with R = 0.5 cMpc (Nobs = 8,
  ; 7.2σ) and R = 2.0 cMpc (Nobs = 15,
  ; 6.1σ) demonstrate that the significance exceeds 6σ for all aperture radii tested.
The KDE density peak is located at R.A. =  , decl. =
  , and the galaxy surface density within 1 cMpc of this position is ∼26 times the field average. We selected all sources with spectroscopic redshifts in the range 4.89 ≤ zspec ≤ 5.05 within a projected radius of 3″ from this density peak; the unweighted geometric centroid of the six confirmed members, adopted as the group center throughout, is R.A. =
  , decl. =
  . Six galaxies satisfy both criteria (Table 1). Beyond the compact core, we identify one additional spectroscopically confirmed source within the group redshift range: ID 14344 (z = 4.975, zconf =6, two emission lines) at a projected separation of
  (≈52 pkpc) from the group centroid and Δv ≈ 255 km s−1 from the group mean redshift. Together with the eleven galaxies within 1 cMpc of the KDE density peak that constitute the connected overdensity region, this suggests that the compact group is embedded within a broader large-scale structure at z ≈ 4.97.
Figure 1 presents the wide-field environment of SCGG-z5 overlaid with the KDE overdensity map (left panel), together with close-up imaging of the six members (right panels: spectroscopic redshift distribution, F444W continuum, and Hα emission map). The NIRCam grism spectrum of each member is shown in Figure 2. The six members span spectroscopic redshifts 4.958 ≤ zspec ≤ 4.979, corresponding to a line-of-sight velocity range of ∼1073 km s−1 and a maximum projected separation of  (∼16.1 pkpc).
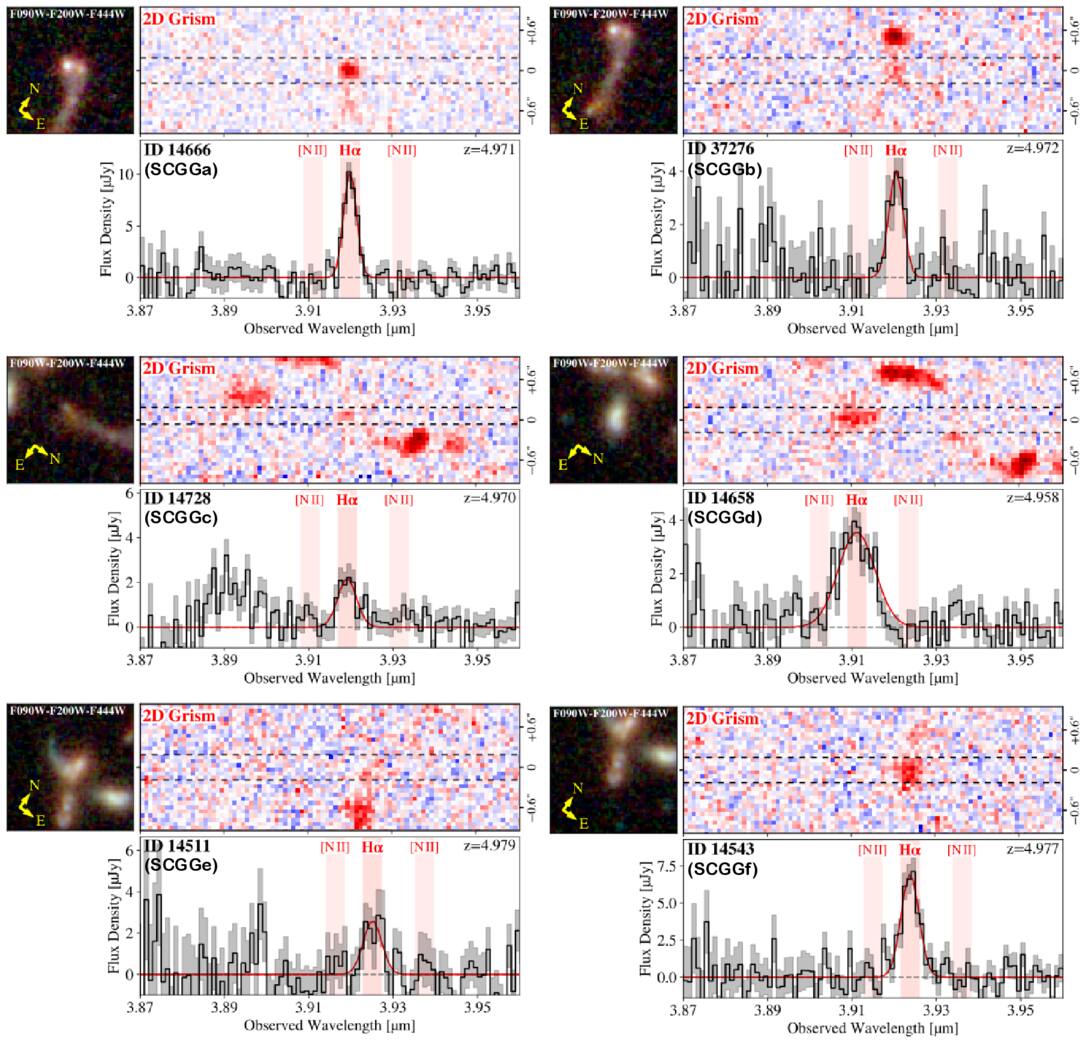
Figure 2. NIRCam grism spectra of the six SCGG-z5 members, ordered as in Table 1. For each source, the top-left panel shows the RGB image (F090W/F200W/F444W), and the top-right panel shows the continuum-subtracted 2D grism spectrum. The bottom panel presents the extracted 1D spectrum (black), the best-fit Hα Gaussian (red), and the 1σ noise (gray). Pink bands indicate Hα (detections) and [N ii]λλ6548,6583 (expected wavelengths). All six members show Hα with 3.7 ≤ S/N ≤ 15.0.
Download figure:
Standard image High-resolution imageAt z ∼ 5, Hα falls at λobs ≈ 3.93 μm within the F356W and F444W grism bandpass, while Hβ and [O iii] fall outside the covered wavelength range. SCGGb (zconf =5) shows two emission lines (Hα and [S ii]), satisfying the two-line criterion of the SAPPHIRES redshift confidence scale (see F. Sun et al. 2025). The [S ii]λ6731 line is detected at λobs = 4.020 μm, consistent with z = 4.972. The remaining members are confirmed via single Hα detections (zconf =1–2), all with S/N ≥ 3 across the available grism-filter combinations. Given the proximity in both sky position and line centroid, we interpret these six sources as members of a single compact galaxy group.
The SAPPHIRES F444W imaging (5σ depth 29.1 AB mag; F. Sun et al. 2025) is complete to  at z ∼ 5, estimated following L. Pozzetti et al. (2010), as adopted by L. Paquereau et al. (2025). From Bagpipes SED fitting (Section 2), stellar masses span
  , with a total group stellar mass M*,tot = 10(10.07±0.04) M⊙; all six members lie above the stellar mass completeness limit. Hα-based SFRs were computed using the R. L. Theios et al. (2019) low-metallicity calibration (
 , adopted by C. Di Cesare et al. 2026) for a P. Kroupa et al. (1993) IMF, with dust corrections from the SED-derived AV via the D. Calzetti et al. (2000) attenuation law (AHα = 0.822 AV). Since Balmer decrement measurements are unavailable at z ∼ 5, the nebular excess attenuation (D. Calzetti 2001) is not applied; the quoted SFRs are lower limits, as is standard for Hα-based estimates at this redshift. Placed on the C. Di Cesare et al. (2026) Hα-based SFMS at z ∼ 4–5 (Figure 3; intrinsic scatter σint ≈ 0.32 dex), three of the six members lie above or on the relation center. SCGGa (ΔMS =+0.47 dex) lies above the 1σint band; SCGGf (ΔMS =+0.15 dex) and SCGGd (ΔMS = +0.06 dex) are consistent with the main sequence. SCGGe (ΔMS = −0.78 dex) lies significantly below the main sequence (∼2.4 σint below the relation). SCGGc (ΔMS = −0.28 dex) and SCGGb (ΔMS = −0.21 dex) lie below the relation center but within the intrinsic scatter (∣ΔMS∣ < σint).
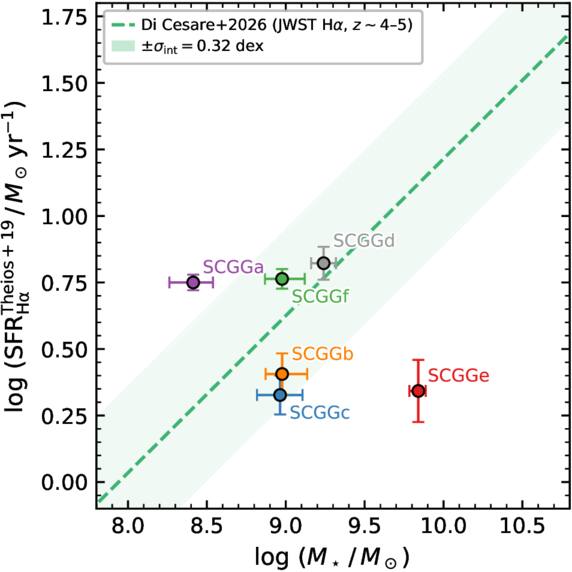
Figure 3. Hα-based SFRs (dust-corrected, R. L. Theios et al. 2019 calibration, Kroupa IMF) for the six protogroup members placed on the C. Di Cesare et al. (2026) Hα-based SFMS at z ∼ 4–5 (dashed green line; same calibration as our SFRs). The shaded green band shows the intrinsic scatter (±σint ≈ 0.32 dex) of the C. Di Cesare et al. (2026) relation. Points are color coded by galaxy ID. SFRs are lower limits as no Balmer decrement is available (Section 3.1).
Download figure:
Standard image High-resolution image3.2. Morphology
We modeled all six members using PySersic (I. Pasha & T. B. Miller 2023) with Markov Chain Monte Carlo (MCMC) sampling and empirical PSF (ePSF) models in the F200W band (rest-frame ≈3350 Å at z ≈ 4.97). Four members (SCGGe, SCGGd, SCGGf, and SCGGa) required multiple Sérsic components; SCGGe and SCGGf were each fitted with three components, and SCGGd and SCGGa with two components each. SCGGb was additionally fitted with two Sérsic components to model its elongated, asymmetric F200W light distribution, with updated parameters listed in Table 1. SCGGc was modeled with a single component; a two-component fit yields degenerate posteriors with overlapping effective radii and unconstrained Sérsic indices (Table 1, footnote b). Results are shown in Figure 4 (panel (a)).
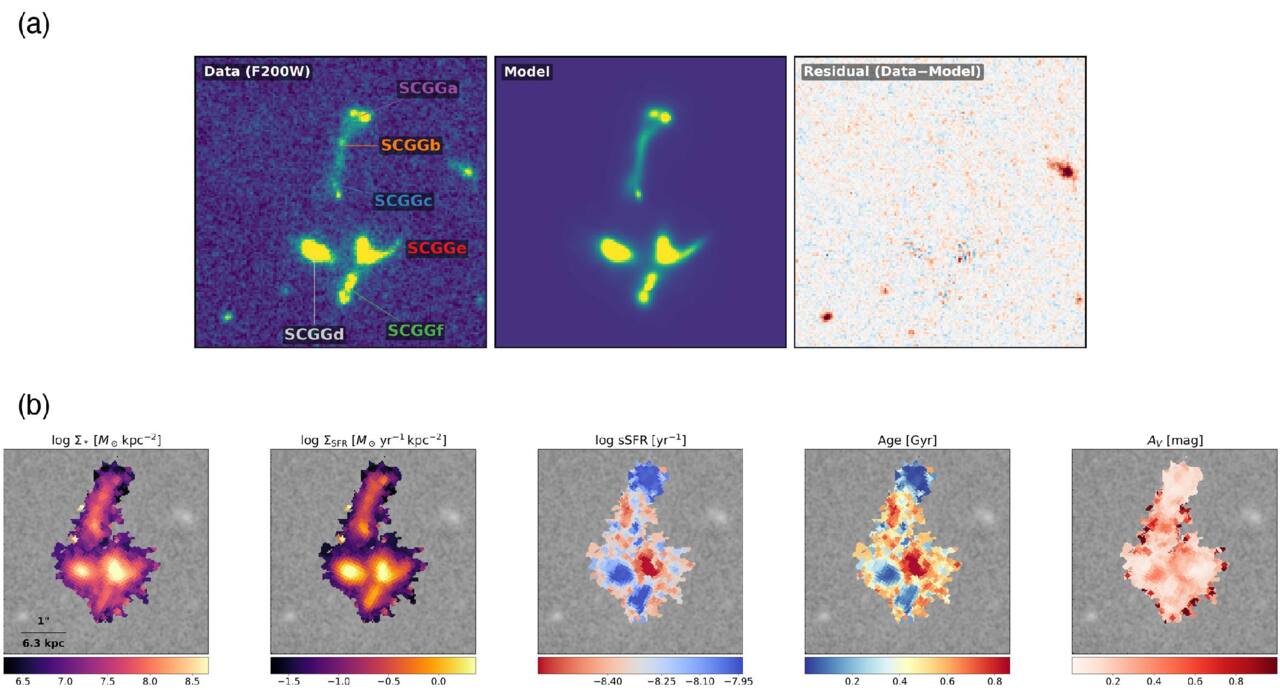
Figure 4. (a) Morphological decomposition via multicomponent Sérsic fitting in F200W. From left to right: science image, best-fit model, and normalized residual. Residual structure and bipolar patterns in three of the six members are suggestive of tidal perturbations; the outer-dominated residuals common to all members are suggestive of group-scale tidal perturbations. (b) Resolved stellar properties from pixel-by-pixel SED fitting. From left to right: stellar mass surface density ( , M⊙ kpc−2), SFR surface density (
 , M⊙ yr−1 kpc−2), sSFR (
 , yr−1), mass-weighted age (Gyr), and dust attenuation (AV, mag). Most members show centrally concentrated star formation with older stellar populations in the outskirts; SCGGe is the exception, with tentatively suppressed central sSFR suggestive of reduced central star formation (T. J. Looser et al. 2025).
Download figure:
Standard image High-resolution imageAll six members are resolved, with primary effective radii r1/2 = 0.57–1.93 kpc (1.6–5.4 × the F200W ePSF FWHM of  kpc). The primary Sérsic indices span n = 0.68–1.85, consistent with disklike or irregular morphologies typical of star-forming galaxies at z ∼ 5. The multicomponent fits reveal physically motivated substructure; in SCGGe, the three-component fit reveals a prominent arc-like structure extending to the west of the main body and a fainter secondary component to the south–southwest, together consistent with tidal disturbance or stripped material; in SCGGf, photutils source detection independently confirms three distinct flux peaks within the galaxy, with the two secondary nuclei separated by 0.97 and 1.19 kpc from the primary, consistent with a triple-nucleus system; in SCGGd, two components separated by 0.78 kpc reveal a compact double-component morphology; in SCGGa, two compact nuclei are resolved; and in SCGGb, the two-component decomposition models its elongated, asymmetric stellar distribution. The best-fit Sérsic parameters for all six members are listed in Table 1.
Three of the six members (SCGGe, SCGGc, and SCGGd) show low-amplitude bipolar residual patterns within 1 r1/2, suggestive of tidal perturbations. In all six members, the residual signal is stronger in the outer annulus (r > r1/2) than within the half-light radius, plausibly associated with interactions in the compact-group environment.
3.3. Resolved Stellar Mass and Star Formation Maps
Building on the morphological picture above, we performed pixel-by-pixel SED fitting to characterize the internal distribution of star formation within each member, following the procedure described in Section 2.2.
Resolved maps of  ,
,  ,
,  , mass-weighted age, and AV are shown in Figure 4 (panel (b)); azimuthally averaged radial profiles are presented in Figure 5. The maps reveal spatially distinct star-forming regions associated with individual members across the ∼16 pkpc extent of the group. The most massive member, SCGGe, dominates the
  map yet shows lower central
  than the surrounding members and the oldest mass-weighted stellar age among the group, suggesting that differential SFHs are already operating within this compact system.
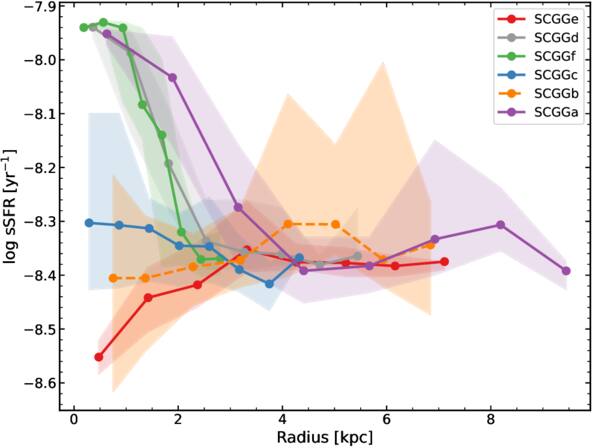
Figure 5. Azimuthally averaged  radial profiles for the six protogroup members, derived from pixel-by-pixel Bagpipes SED fitting. Each galaxy is shown with a distinct color (see legend); shaded bands indicate the 1σ bin-to-bin uncertainty. SCGGb (dashed line) has truncated central bins (r < 0.85 kpc) due to its disturbed morphology. Three members (SCGGf, SCGGd, SCGGa) show clearly declining sSFR with radius (Spearman ρ = −0.76 to −0.98, p < 0.05); SCGGc shows a statistically significant but low-amplitude monotonic decline (Spearman ρ = −0.929, p = 0.0009;
  dex); SCGGb is flat. SCGGe (red) shows a tentative inverted profile, with lower sSFR in the center than in the outskirts, suggestive of reduced central star formation (see also T. J. Looser et al. 2025).
Download figure:
Standard image High-resolution imageThree members (SCGGf, SCGGd, and SCGGa) show  declining with radius, confirmed by the Spearman rank correlation test (ρ = −0.76 to −0.98; p < 0.05 in all cases), with the innermost radial bin specific star formation rate (sSFR) exceeding the outermost by
  –0.44 dex. Their mass-weighted stellar age profiles rise outward (younger centers, older outskirts; slopes +0.05 to +0.21 dex kpc−1), consistent with inside-out stellar mass growth. SCGGc shows a statistically significant but low-amplitude declining sSFR profile (Spearman ρ = −0.929, p = 0.0009;
  dex), approximately 6 times smaller in amplitude than the three members above; its integrated SFR is consistent with the SFMS within the intrinsic scatter (ΔMS = −0.28 dex, ∣ΔMS∣ < σint), but the weak radial gradient amplitude does not constitute evidence for the pronounced centrally concentrated inside-out growth seen in SCGGf, SCGGd, and SCGGa. SCGGb shows a flat profile (Spearman ρ = +0.68, p = 0.09), consistent with its disturbed morphology (Section 3.2).
SCGGe, the most massive member ( ), shows a tentative inverted sSFR profile (Spearman ρ = + 0.667, p = 0.07; not statistically significant); the central bin (r < 1 kpc) has
  , lower than the outer mean of
  (
( dex). It also hosts the highest central stellar mass surface density in the group (
 within r < 1 kpc), and its dust attenuation increases outward (+0.056 ± 0.015 mag kpc−1, p = 0.010), suggesting the central region has lower dust content than the outer disk. Together, these radial signatures are suggestive of reduced central star formation in the most massive group member, consistent with a reduced cold-gas supply or a (mini-)quenching episode in the core (T. J. Looser et al. 2025), while the outskirts remain active.
These radial trends are robust to the binning threshold; repeating the analysis with S/N ≥ 5 per bin (Section 2.2) yields consistent gradient classifications. The declining sSFR profiles of SCGGf, SCGGd, and SCGGa retain statistical significance (Spearman p < 0.05 in all three cases), and SCGGb remains flat, confirming that the inside-out growth signatures are not driven by low-S/N outskirt bins; SCGGe’s tentative profile (p = 0.07 at S/N ≥ 3) yields p = 0.30 at S/N ≥ 5, consistent with its marginal significance at the fiducial threshold.
3.4. Group Dynamics
The six spectroscopically confirmed members span a line-of-sight velocity range of Δvtot = 1073 km s−1 relative to the group mean redshift  , from Δv = −672 km s−1 (SCGGd) to Δv = +400 km s−1 (SCGGe). The velocity dispersion, computed as the unweighted standard deviation with N − 1 degrees of freedom over all six members, is
  km s−1, where the asymmetric uncertainties are the 16th and 84th percentiles from 104 bootstrap resamplings with replacement. The wide confidence interval reflects the small sample size and is expected for N = 6; the large downward excursion is driven by bootstrapped subsamples that do not include the most kinematically extreme member.
The maximum projected pair separation is  (SCGGf to SCGGa), corresponding to 16.1 pkpc at z ≈ 4.97. The minimum separation is 3.19 pkpc (SCGGb and SCGGa). The group half-projected radius, defined as the median projected separation of all six members from the unweighted geometric centroid, is R1/2 = 5.4 pkpc. The dynamical crossing time is tcross ≈ 14.1 Myr, only ∼1.2 per cent of the cosmic age at this epoch (tage(z = 4.97) ≈ 1.16 Gyr), indicating that the group members can complete multiple mutual passages within the current cosmic age.
We estimated the dynamical mass using the projected mass estimator of J. Heisler et al. (1985) (their Equation (11)):

where vi is the line-of-sight velocity of the ith member relative to the group mean, Ri is its projected separation from the unweighted geometric centroid, G is the gravitational constant, N = 6, fPM is a constant of proportionality that depends on the distribution of orbits (J. Heisler et al. 1985), and α = 1.5 is the correction for the offset between the arithmetic centroid of the tracers and the true center of mass (J. Heisler et al. 1985). We adopted fPM = 32/π for isotropic orbits, the value that J. Heisler et al. (1985) recommend as giving the best agreement with numerical experiments. This yields MPM = 2.0 × 10¹² M⊙ ( ; range ≈12.05–12.60). Assuming purely radial orbits (fPM = 64/π) gives MPM = 3.9 × 10¹² M⊙ (
 ), which we treat as a conservative upper bound. To complement this with a lower bound, we use the N-body calibration of J. Heisler et al. (1985), who show that the projected mass estimator has an interquartile range of ≈0.5 dex for groups of N ≈ 5–10 tracers; the statistical lower quartile is
  , giving a full confidence interval of
  –12.60.
The total stellar mass from Bagpipes SED fitting (Section 2) is M*,tot = 1.2 × 10¹⁰ M⊙ ( ), giving a stellar-to-dynamical mass fraction of f∗ = M*,tot/MPM ≈ 0.57 per cent (
 dex; the uncertainty is dominated by the J. Heisler et al. 1985 statistical scatter on MPM, ±0.25 dex, while the propagated stellar mass uncertainty contributes only ∼0.04 dex in quadrature). This is consistent with the group being heavily dark-matter-dominated; we discuss the comparison with the P. Behroozi et al. (2019) stellar-to-halo-mass relation in Section 4.1.
4. Discussion
4.1. A Dynamically Young, Compact System
The kinematic and structural properties of SCGG-z5 are consistent with a compact, dynamically assembling system residing in a common dark-matter-dominated halo. With tcross ≈ 14.1 Myr (Section 3.4), the system is dynamically young, with members capable of completing multiple mutual passages within the current cosmic age. The stellar fraction f∗ ≈ 0.57 per cent implies that the vast majority of the group mass resides in dark matter, with only a small fraction yet assembled into stars. We note that with N = 6 tracers, both σv and the projected mass estimator carry substantial statistical uncertainty (bootstrap:  km s−1; isotropic-to-radial range:
  –12.60); the physical conclusions are consistent across this range.
Beyond the statistical uncertainty, we note a systematic caveat. The projected mass estimator of J. Heisler et al. (1985) was derived from the stellar hydrodynamic equation and calibrated on self-consistent equilibrium models; it therefore assumes the system is in a dynamical steady state. For a compact group at z ≈ 5 that is still in an active assembly phase (as suggested by the evolutionary context discussed in this section), this assumption cannot be verified from photometric data alone. The values of MPM and σv should therefore be interpreted as characteristic of a dynamically assembling system rather than as equilibrium quantities; without spatially resolved kinematic data for all members, the direction and magnitude of any resulting bias cannot be determined.
The P. Behroozi et al. (2019) stellar-to-halo-mass relation at z ≈ 5 predicts  for a single galaxy with
  . The M. Shuntov et al. (2025) SHMR from COSMOS-Web abundance matching in the 4.5 < z < 5.5 bin similarly predicts
  for the same combined stellar mass, reflecting the elevated star formation efficiency at z > 3.5 found in that study. Our directly measured MPM = 2.0 × 10¹² M⊙ (
 ; range ≈12.05–12.60) exceeds both estimates by ≈0.3–0.45 dex. Both relations characterize the typical halo of a single field galaxy, whereas the dynamical mass of SCGG-z5 reflects the collective group halo enclosing six member galaxies; the excess is therefore consistent with SCGG-z5 occupying a genuine group-scale dark-matter halo rather than representing an anomalously overmassive single system.
As a cross-check under a virialization assumption, we apply the dark-matter velocity dispersion–mass scaling of A. E. Evrard et al. (2008) (their Equation 6), ![${\sigma }_{{\rm{DM}}}\,=1082.9\,{[h(z)\,{M}_{200}/1{0}^{15}\,{M}_{\odot }]}^{0.3361}\,{\rm{km}}\,{{\rm{s}}}^{-1}$](https://content.cld.iop.org/journals/2041-8205/1007/2/L35/revision1/apjlae88ffieqn93.gif) , with h(z = 4.97) =5.62. Treating σv as a proxy for σDM (velocity bias bv ≈ 1.00 ± 0.05; A. E. Evrard et al. 2008) and inverting for σv = 375 km s−1 yields Mvir ≈ 7.6 × 10¹² M⊙ (
, with h(z = 4.97) =5.62. Treating σv as a proxy for σDM (velocity bias bv ≈ 1.00 ± 0.05; A. E. Evrard et al. 2008) and inverting for σv = 375 km s−1 yields Mvir ≈ 7.6 × 10¹² M⊙ ( ), a factor of ≈4 above MPM. Equivalently, evaluating this relation at MPM predicts σDM ≈ 240 km s−1, a factor of ≈1.6 below the observed σv. The A. E. Evrard et al. (2008) scaling is demonstrated to hold self-similarly over 1010–1015 h−1 M⊙ (their Figure 6); the offset between Mvir,Evrard and MPM is therefore consistent with σv being elevated above the equilibrium expectation in a dynamically assembling system in which the kinetic energy has not yet settled to its virial value.
Comparable compact groups at similar and earlier epochs are discussed in Section 4.3; here we focus on the dynamical implications of the SCGG-z5 measurements themselves. The relatively high velocity dispersion of SCGG-z5 is consistent with a dynamically active, multipassage assembly stage rather than a first-crossing configuration.
By analogy with EAGLE hydrodynamical simulations of CGG-z5-like compact groups (S. Jin et al. 2023), such structures are expected to coalesce into a single galaxy by z ∼ 3–4, continuing to grow to  by z ∼ 1. If SCGG-z5 follows a similar evolutionary path, these observations are consistent with catching a short-lived, precoalescence phase of massive galaxy formation (S. Jin et al. 2023). The mean stellar age of the six members from Bagpipes SED fitting, 〈tgal〉 ≈ 0.39 Gyr, indicates that star formation in this system began at z ≳ 7. Adding the ∼400 Myr merger timescale from the EAGLE analog structures (S. Jin et al. 2023) suggests an indicative assembly timescale from star formation onset to coalescence of 〈tgal〉 + tmerger ≈ 0.8 Gyr, consistent with SCGG-z5 being observed in the early formation phase of a system that will appear as a massive galaxy by z ∼ 3–4 (F. Valentino et al. 2020). We note that stellar ages from a parametric delayed-τ SFH carry model-dependent systematic uncertainties arising from age, metallicity, and dust degeneracies that are not captured by the posterior errors; stellar masses are substantially more robust to the assumed SFH. The inference that star formation began at z ≳ 7 is derived from the Bagpipes best-fit SFH onset age 〈tgal〉 ≈ 0.39 Gyr, but the exact epoch and the assembly timescale above should be treated as indicative.
4.2. Morphological Interactions and Resolved Star Formation
The morphological and resolved star formation analysis presented in Sections 3.2 and 3.3 reveals a system in which gravitational interactions and mass-dependent evolution are already operating simultaneously at z ≈ 5.
The morphological disturbances quantified in Section 3.2 are suggestive of tidal interactions within the group. Three of the six members show bipolar residual patterns within 1 r1/2, and the outer-dominated residual signal is common to all six, suggesting that tidal perturbations are pervasive across the group. Observational evidence for tidal gas stripping on group scales comes from Atacama Large Millimeter/submillimeter Array (ALMA) [C II] observations of a compact merging system at z ∼ 4.57 (M. Ginolfi et al. 2020), in which ∼50% of the total [C II] luminosity resides in a circumgalactic envelope extending to ∼30 pkpc, attributed to gas stripped by strong gravitational interactions. At such small projected separations (≲16 pkpc), the compact configuration may enable efficient tidal torquing; angular momentum is stripped from the interstellar gas, driving inflows toward galaxy centers and potentially triggering compaction (the formation of ultradense, star-forming cores; A. Dekel & A. Burkert 2014; S. Tacchella et al. 2016).
Three members (SCGGf, SCGGd, and SCGGa) show declining sSFR radial profiles, with their central regions forming stars at higher specific rates than their outskirts (Section 3.3). This inside-out growth pattern is consistent with the compaction scenario, where tidal torques funnel cold gas toward galaxy centers, building concentrated stellar cores at early epochs (e.g., S. Tacchella et al. 2016, 2018). Observational support comes from integral-field spectroscopy (IFS) studies of nearby interacting galaxies, which find a factor of ∼2–3 enhancement of central specific star formation relative to noninteracting controls, attributed to tidally induced gas inflows (J. K. Barrera-Ballesteros et al. 2015). The simultaneous occurrence of this signature in three of the six group members suggests that the compact environment has, in these galaxies, enhanced centrally concentrated star formation rather than disrupting it; each of these members appears to be in an active central mass-assembly phase plausibly linked to interaction-driven gas inflow. SCGGc also shows a Spearman-significant monotonically declining profile (ρ = −0.929, p = 0.0009), but its amplitude is only  dex (approximately 6 times smaller than the three members above), and its integrated SFR is consistent with the SFMS within the intrinsic scatter (ΔMS = −0.28 dex, ∣ΔMS∣ < σint); we therefore interpret its radial gradient as physically marginal and do not include it in the inside-out growth population.
The most massive member, SCGGe ( ), presents a qualitatively different picture; its tentative inverted sSFR radial profile (Section 3.3) shows central star formation suppressed relative to the outer disk (
 , within ≲0.5 dex of the SFMS). We caution that this does not unambiguously indicate long-term quenching; at
  and z ≈ 5, such suppression is consistent with a transient (mini-)quenching episode driven by a temporary disruption of cold-gas inflow (T. J. Looser et al. 2025), or with inside-out stellar mass growth reducing the central gas fraction (S. Tacchella et al. 2016). In the compaction scenario, the nuclear stellar concentration exhausts the central gas supply while the outer disk remains temporarily active; direct observational evidence for this mode has been found in compact star-forming galaxies at z ∼ 2 (J. S. Spilker et al. 2019). A similar qualitative pattern has also been seen in spatially resolved studies of massive protocluster galaxies at lower redshift, where the inferred radial structure is consistent with inside-out quenching, although SCGG-z5 probes a much earlier and more compact precoalescence stage (R. Laishram et al. 2026b). The high central stellar mass surface density (
 ) and outwardly increasing dust attenuation (+0.056 ± 0.015 mag kpc−1) of SCGGe (Section 3.3) are consistent with a centrally depleted, dust-poor inner region and a still star-forming, dust-enriched outer disk. A caveat applies to SCGGe; if the western arc-like structure and south–southwest secondary component identified in the Sérsic decomposition (Section 3.2) represent a physically distinct merging satellite rather than tidal material associated with the primary galaxy, the measured radial profile may reflect a superposition of two stellar populations rather than an internal gradient within a single system. The inverted sSFR profile of SCGGe should therefore be interpreted as tentative, especially given its marginal Spearman significance (p = 0.07).
SCGGb, the most extended group member ( kpc; Section 3.2), shows a flat sSFR radial profile (Spearman ρ = + 0.68, p = 0.09; Section 3.3), with no evidence of centrally concentrated star formation. Its disklike primary profile (n = 0.77 ± 0.10) and elongated, asymmetric stellar distribution (two-component Sérsic fit; Table 1) suggest that its stellar light distribution is being reshaped by tidal forces from its close neighbors (SCGGc at 3.68 pkpc; SCGGa at 3.19 pkpc). The flat, extended sSFR distribution of SCGGb may reflect an interaction-driven redistribution of star-forming gas across a wider physical area, consistent with its morphologically disturbed appearance.
The group members thus display a diversity of resolved star formation modes within a single ∼16 pkpc system at z ≈ 5: inside-out growth in three members, a tentative centrally suppressed mode in the most massive member, and tidally disturbed extended star formation in SCGGb. This suggests that the group environment is already differentiating the evolutionary trajectories of its members well before the system coalesces.
4.3. Comparison to Known Analogs
The most directly comparable system at a similar cosmic epoch is CGG-z5 at z ∼ 5.2 (S. Jin et al. 2023), with six candidate members within a projected area of ∼10 × 20 kpc2 in the EGS field. Its stellar mass range (most massive member  , satellites
  –9.2) closely matches SCGG-z5. A critical distinction is that CGG-z5 is identified from photometric redshifts alone (5.0 < zphot < 5.3), whereas all six members of SCGG-z5 are spectroscopically confirmed via Hα emission. Within CGG-z5, high-resolution NIRCam imaging resolves the most massive member (CGG-z5.a) into three subcomponents, and a second member (CGG-z5.d) into two, providing morphological evidence for ongoing mergers analogous to the tidal features and multicomponent structure we identify in SCGG-z5. Given the comparable stellar mass range and projected scale of SCGG-z5, we expect a similar evolutionary outcome based on EAGLE simulations (Section 4.1).
CGG-z7 at z ∼ 7.04 (X. Wei et al. 2026), observed ∼0.4 Gyr earlier, provides an earlier snapshot of a spectroscopically confirmed compact group, with four of six candidate members confirmed via [O iii] and Hβ emission. The group spans 7.8 × 5.7 kpc2, with σv = 93.7 ± 31.7 km s−1. As X. Wei et al. (2026) note, the virial mass estimator is biased low because the system is not in dynamical equilibrium; CGG-z7 is interpreted as a previrialized structure near apocenter, and the apparent stellar-to-dynamical mass ratio (M∗/Mvir ≈ 0.15, a factor of ∼3 above typical virialized values) reflects nonvirialized kinematics rather than a true equilibrium ratio. The much higher velocity dispersion of SCGG-z5 ( km s−1) is consistent with a more dynamically evolved system in which multiple mutual passages have increased the internal kinetic energy. The central galaxy of CGG-z7 harbors a likely obscured AGN ([O iii]λ5007/Hβ ≈ 18; X. Wei et al. 2026), an outcome consistent with gas inflows driven by tidal interactions in compact-group environments (S. L. Ellison et al. 2011). No AGN activity is identified within the compact core of SCGG-z5; the nearest broad-line AGN (ID 11166; FWHM =2051 ±133 km s−1; F. Sun et al. 2025) lies ≈30″ (≈190 pkpc; Δv ≈ − 383 km s−1 from the group mean) to the south, embedded within the same large-scale overdensity at z ≈ 4.97 but well outside the group core, consistent with the tendency for AGN at z ∼ 4–5 to preferentially trace overdense environments (X. Lin et al. 2024). In SCGG-z5, the ratio SFRHα/SFRSED varies widely across members (0.1–1.9). The most massive member, SCGGe, shows SFRHα≈0.1 × SFRSED, consistent with its tentatively reduced central star formation and tentative inverted sSFR profile (Section 3.3). SCGGa shows SFRHα≈1.9 × SFRSED, possibly reflecting a recent star formation episode not captured by the smooth delayed-τ SFH. The Bagpipes SED fitting further shows that SCGGe hosts the most evolved stellar population in the group; its best-fit SFH onset age of
  Myr is more than an order of magnitude older than the youngest actively star-forming members (SCGGd:
  Myr; SCGGa:
  Myr), consistent with an earlier onset of star formation in the most massive group member.
At a later epoch, CGG-z4 at z = 4.3 (M. Brinch et al. 2025) may represent a more advanced compact-group stage, with a combined IR star formation rate of ∼2100 M⊙ yr−1 and gas depletion times of ≲100 Myr for its two spectroscopically confirmed members, consistent with rapid consumption of the available gas reservoir. In this sense, SCGG-z5 may occupy an earlier evolutionary stage than CGG-z4, before the system reaches such extreme gas-rich, near-depletion conditions. Taken together, these systems suggest a plausible evolutionary progression from previrial first crossing (CGG-z7, z ∼ 7), through dynamically active multipassage group assembly (SCGG-z5, z ≈ 5), to near-exhaustion of the star-forming gas reservoir (CGG-z4, z ≈ 4.3).
A direct observational precedent for interaction-driven star formation diversity in a compact group is provided by the A2744-Quintet at z = 7.9 (Y. Fudamoto et al. 2025), a compact system of five merging galaxies within ∼10 kpc in the core of the spectroscopically confirmed protocluster A2744-z7p9OD (T. Morishita et al. 2023). Through JWST and ALMA [C ii] 158 μm observations, Y. Fudamoto et al. (2025) directly trace tidal gas bridges connecting the merging members; galaxies stripped of their neutral gas reservoir show recent quenching, while those receiving the redistributed gas undergo starbursts, all on timescales of ≲50 Myr. SCGG-z5 similarly exhibits a coexistence of suppressed star formation in its most massive member and actively star-forming companions spanning projected separations of ∼5–13 pkpc, though the detailed configuration of SFH differentiation differs between the two systems. Future ALMA [C ii] observations of SCGG-z5 would directly test whether analogous merger-driven gas redistribution is responsible for the diversity of SFHs observed within the group.
Together, these systems illustrate that JWST is uncovering compact galaxy groups and overdensities already in place across a wide range of cosmic epochs (e.g., J. M. Helton et al. 2024b). T. Morishita et al. (2025a) identified two overdensities at z ∼ 5.7 in the A2744 field with an elevated fraction of evolved, weakly star-forming galaxies, pointing to an early onset of environmental effects on star formation. At z ∼ 6.9, JWST/NIRSpec IFS of SPT0311-58 (S. Arribas et al. 2024) revealed 12 galaxies within ∼17 × 17 kpc2 spanning diverse evolutionary stages and metallicities, providing a further example of compact multigalaxy assembly in a dense protocluster core. Using the same SAPPHIRES EDR data, Y. Fudamoto et al. (2025) discovered a protocluster candidate at z = 8.47 in the MACS0416 parallel field (nine spectroscopically confirmed members; δ ∼ 6–8 times the field average), further demonstrating that dense environments are already shaping galaxy evolution at the earliest cosmic epochs.
A complementary view of a more advanced assembly stage is offered by the “Crimson Behemoth” CID-931 at z = 4.91 (T. S. Tanaka et al. 2024), a dusty AGN host surrounded by ≥8 massive star-forming clumps ( –10 each) within ∼10 kpc. T. S. Tanaka et al. (2024) interpret this morphology as either a complex merger of multiple massive galaxies or violent disk instability. Pixel-by-pixel SED fitting of CID-931 recovers significant spatial variation between clumps, with circumnuclear regions younger and more bursty than the central body, providing a resolved comparison to our Bagpipes analysis. If SCGG-z5 represents the precoalescence stage at which individual members are still spectroscopically distinguishable, CID-931 may illustrate the subsequent interpenetrating phase once members begin to merge; the interaction-triggered AGN at its center is consistent with gas inflows expected from compact, gas-rich pairs at small projected separations (S. L. Ellison et al. 2011).
5. Summary
We have discovered and characterized SCGG-z5 (the Shirui Group), a compact galaxy protogroup at z ≈ 4.97 in the MACS0416 field, using data from the SAPPHIRES EDR (F. Sun et al. 2025).
- 1.Six galaxies are spectroscopically confirmed as group members via Hα emission, spanning 4.958 ≤ zspec ≤ 4.979 within a projected diameter of ∼16.1 pkpc. The overdensity corresponds to a 7.1σ spike in the field Hα-emitter distribution (Poisson p = 6.8 × 10⁻¹³).
- 2.
- 3.All six members show disturbed morphologies in F200W, with multicomponent substructure identified in Sérsic fitting (an arc-like feature in SCGGe consistent with tidal disturbance; compact two-component structure in SCGGd and SCGGa; an elongated, asymmetric stellar distribution in SCGGb) and bipolar residual patterns in three of the six members. The residual signal is outer-dominated across the full group, suggestive of group-wide tidal perturbations. Pixel-by-pixel SED fitting is consistent with inside-out stellar mass growth in three members (SCGGf, SCGGd, SCGGa;
 –0.44 dex); SCGGc shows a statistically significant but much weaker gradient ( dex) with an integrated SFR within the intrinsic scatter of the SFMS (ΔMS = −0.28 dex, ∣ΔMS∣ < σint); the weak gradient amplitude is inconsistent with the pronounced inside-out growth seen in SCGGf, SCGGd, and SCGGa. The most massive member (SCGGe, ) shows a tentative inverted sSFR profile suggestive of reduced central star formation (T. J. Looser et al. 2025).
 - 4.The velocity dispersion over all six members is km s−1, with a dynamical crossing time tcross ≈ 14.1 Myr (∼1.2 per cent of the cosmic age at this epoch). The projected mass estimator yields MPM =2.0 × 10¹² M⊙ (), with a stellar fraction of ≈0.57%, consistent with a dark-matter-dominated group halo.
- 5.By analogy with EAGLE simulations of similar structures (S. Jin et al. 2023), SCGG-z5 is likely to coalesce into a single galaxy by z ∼ 3–4 and assemble by z ∼ 1, consistent with a short-lived, precoalescence phase of massive galaxy formation.








SCGG-z5 is a rare example of a spectroscopically confirmed compact galaxy protogroup at z > 4, offering direct observational constraints on early group assembly during the first Gyr of cosmic history. The diversity of SFHs and morphological disturbance observed across its six members, embedded within a 7.1σ galaxy overdensity, is consistent with environmental effects already differentiating the evolutionary trajectories of member galaxies well within the first Gyr of cosmic time. Future JWST/NIRSpec IFS would simultaneously map the spatially resolved Hα and [O iii] λλ4959,5007 kinematics, gas-phase metallicity, and ionized-gas diagnostics across all six members, directly probing the dynamical state of the group and the role of tidal interactions in driving the inside-out star formation identified here. Complementary ALMA observations of the [C ii] 158 μm line and dust continuum would further constrain the cold-gas distribution, total gas reservoir, and dust-obscured star formation across the group, providing a more complete view of its baryonic content at this early epoch.
Acknowledgments
We thank the anonymous referee for a thorough and constructive review that improved the manuscript. This work was supported by JSPS KAKENHI grant Nos. 23H01219 and 26H02070, and JSPS Core-to-Core Program (grant Nos.: JPJSCCA2021003 and JPJSCCA20260002). H.K. acknowledges support from JSPS KAKENHI grant Nos. 23KJ2148 and 25K17444. T.K. and Y.K. acknowledge financial support from JSPS KAKENHI grant Nos 24H00002 (Specially Promoted Research by T. Kodama et al.), 22K21349 (International Leading Research by S. Miyazaki et al.).
This work is based on observations made with the NASA/ESA/CSA James Webb Space Telescope. The data were obtained from the Mikulski Archive for Space Telescopes at the Space Telescope Science Institute, which is operated by the Association of Universities for Research in Astronomy, Inc., under NASA contract NAS 5-03127 for JWST. These observations are associated with program #6434. Support for program #6434 was provided by NASA through a grant from the Space Telescope Science Institute, which is operated by the Association of Universities for Research in Astronomy, Inc., under NASA contract NAS 5-03127.
Data Availability
The specific JWST data presented in this article were obtained from the Mikulski Archive for Space Telescopes (MAST) at the Space Telescope Science Institute. The specific observations analyzed can be accessed via doi: 10.17909/0w8h-jt25. The reduced data are also publicly available via the SAPPHIRES survey website at https://jwst-sapphires.github.io.
Footnotes
- 11
Named after the Shirui Lily (Lilium mackliniae), a rare flower found only in the Shirui Hills of Ukhrul District in Manipur, India.