Abstract
We analyze the positional and morphological properties of about 3600 unique fast radio burst (FRB) sources reported in the second FRB catalog generated by the Canadian Hydrogen Intensity Mapping Experiment (CHIME) telescope. We find a two-dimensional dependence of FRB detections on sky position and identify a significant absence of detections in a roughly circular region centered at Galactic coordinates (77 7, 0
7, 0 9), spanning an area of 213.6 deg2. This detection gap spatially coincides with the Cygnus X region—a plasma-rich star-forming region in the Milky Way. This feature is most likely the result of increased sky temperature and strong multipath scattering by turbulent ionized plasma, which broadens the FRB signals beyond detectability in the CHIME band. Our simulations yield a mean of six expected FRB detections within the gap when accounting for the elevated sky temperature in the direction of the detection gap. We infer that a lower limit of the maximum scattering timescale τsc, 1 GHz ≥ 5.59 ms, obtained without assuming a model of the Galactic electron distribution, is sufficient to suppress the brightness of all coincident FRBs. A similar suppression is seen in Catalog 2 along other high emission measure (EM) sight lines (i.e., EM ≥ 2900 pc cm−6), further supporting a broader trend of suppression due to Galactic scattering. Future very long baseline interferometry measurements of scattering disks with CHIME Outriggers can help confirm our interpretation. Our work highlights the notion that FRBs can serve as new, model-independent tracers of the warm ionized medium within our Galaxy.
Original content from this work may be used under the terms of the Creative Commons Attribution 4.0 licence. Any further distribution of this work must maintain attribution to the author(s) and the title of the work, journal citation and DOI.
1. Introduction
Fast radio bursts (FRBs) are bright and brief extragalactic bursts of energy emitted in the radio spectrum (D. R. Lorimer et al. 2007; see also E. Petroff et al. 2022 for a recent overview). While their origins remain unclear, there are a growing number of observations that support models based on compact objects, such as highly magnetized neutron stars (e.g., C. D. Bochenek et al. 2020; CHIME/FRB Collaboration et al. 2020; see E. Platts et al. 2019 for a collection of proposed models). Regardless of their origins, FRBs undergo the same dispersive and scatter-broadening effects regularly observed in Galactic radio pulsars (S. K. Ocker et al. 2022), with scattering arising from dense ionized regions in near-source environments within their host galaxies and/or the Milky Way. Scattering often needs to be modeled with one or more distinct scattering screens—a framework developed for pulsars (I. P. Williamson 1972) and subsequently applied to FRBs. In this sense, FRBs can be used as powerful probes of the electron density fluctuations in the interstellar medium (ISM) along their lines of sight (LOSs).
Along a given LOS, the scattering timescale (τsc) characterizes the time delay caused by multipath propagation through the warm ionized medium (WIM) of the Milky Way. Propagation through ionized plasma also results in a frequency-dependent dispersive delay that is proportional to the integrated column density of free electrons along the LOS. This integrated quantity is known as the dispersion measure (DM). Based on the DM and τsc predictions from the NE2001 Galactic electron density model, J. M. Cordes & T. J. W. Lazio (2002) and S. K. Ocker et al. (2022) postulated a “zone of avoidance” to span over a range of Galactic longitudes ∣l∣ ≤ 50° and latitudes ∣b∣ ≤ 4 1 at 0.4 GHz for FRBs. J.-P. Macquart & S. Johnston (2015) proposed that diffractive scintillation enhances FRB detectability at higher Galactic latitudes by boosting some bursts above the detection threshold, particularly in the presence of a steep luminosity distribution. Strong scattering in the Galactic plane can suppress scintillation and broaden the pulse, reducing the likelihood of such boosts.
FRBs are therefore understood to encode information about the WIM through measurements of τsc, serving as “backlights” to the foreground that is the Milky Way. A large sample of τsc measured from FRBs observed across a large fraction of the sky are expected to provide the means for constraining structural information of the WIM (e.g., J.-P. Macquart & S. Johnston 2015). However, past studies of the FRB sky distribution have been limited by the small number of detections and the challenges associated with combining data from different instruments, each with differing sensitivities, instrumental uncertainties, and selection functions. The FRB sky distribution can greatly vary based on the observing frequency. As a result, the scope of such studies so far has been limited to probing only the Galactic latitude dependence (E. Petroff et al. 2019). Using data acquired with the Canadian Hydrogen Intensity Mapping Experiment (CHIME) Fast Radio Burst project (hereafter CHIME/FRB), A. Josephy et al. (2021) reported no significant dependence of FRB detections on Galactic latitude in CHIME/FRB Catalog 1 (CHIME/FRB Collaboration et al. 2021), containing 536 FRBs.
The forthcoming second catalog of CHIME/FRB (hereafter Catalog 2) represents a significant advancement, reporting the largest number of unique FRBs detected by a single instrument (CHIME/FRB Collaboration et al. 2025). An updated map of the FRB sky positions in Catalog 2 reveals a striking and visually discernible gap in FRB detections. For the first time, we clearly identify a Galactic scattering zone of avoidance (hereafter referred to as the “detection gap”) in FRB detections, which spans Galactic longitudes 70° < l < 90° and latitudes −7° < b < 11° in the CHIME observing band (400–800 MHz). This detection gap coincides with the Cygnus X region—a massive star-forming region in the Galaxy, known to contain dense ionized gas and strong degrees of turbulence (J. H. Piddington & H. C. Minnett 1952; H. J. Wendker et al. 1991; N. Schneider et al. 2006). The alignment with known Galactic structure suggests a strong link between plasma propagation effects and the suppression of FRB detectability in the CHIME/FRB experiment.
This study reports a detailed analysis of the detection gap, investigates the extent to which propagation effects contribute to it, and identifies associated patterns in scattering and detectability. The structure of the Letter is as follows: In Section 2, we describe the observational dataset, including post-detection selection criteria and classification of FRBs based on morphology. In Section 3, we present evidence for a significant detection gap observed in the sky distribution of CHIME/FRB Catalog 2. In Section 4, we explore potential observational and astrophysical explanations for the detection gap and derive an empirical lower bound on τsc responsible for it. The role of Galactic scattering in shaping FRB detectability across the full Catalog 2 sample is discussed in Section 5. Our conclusions are summarized in Section 6.
2. Observations
In this work, we analyze data products generated by the CHIME/FRB back end for Catalog 2 (CHIME/FRB Collaboration et al. 2025). Full descriptions of the CHIME telescope and its radio transient back ends are provided in other works (CHIME/FRB Collaboration et al. 2018; CHIME/Pulsar Collaboration et al. 2021; CHIME Collaboration et al. 2022). We nonetheless summarize aspects of CHIME and the Catalog 2 data products relevant to our study in this section.
2.1. The CHIME Telescope and Instrumentation
The CHIME telescope is a compact radio interferometer that consists of 1024 dual-polarization antennas operating in the 400–800 MHz range. These antennas are distributed across four half-cylindrical reflectors that collectively span 80 × 100 m. The CHIME/FRB back end receives up to 1024 streams of beamformed, total-intensity data with time and frequency resolutions of tsamp ≈ 0.983 ms and Δνchan ≈ 24.4 kHz, respectively (CHIME/FRB Collaboration et al. 2018), and enacts a series of real-time pipelines to identify and preserve astrophysical signals for further analysis. The CHIME/FRB detection pipeline uses a cutoff of signal-to-noise ratio (S/N) (≥(S/N)thresh = 8) for filtering FRB candidates (CHIME/FRB Collaboration et al. 2025).
2.2. FRB Celestial Positions
The celestial position of each FRB is computed from total-intensity data using the procedure described by CHIME/FRB Collaboration et al. (2019). This procedure uses two pieces of information—the real-time metadata corresponding to the detecting beam, and an analytic model of the beam shape and FRB dynamic spectrum—to estimate a position and its statistical uncertainty. These localizations have typical uncertainties of  . We caution that O(1%) of bright Catalog 2 FRBs may be incorrectly localized to the near sidelobes, which can cause a position offset of 0
 5–2°. This localization error does not have a significant impact on our analysis of the detection gap, as the error magnitude is much smaller than the angular extent of the gap. However, this could impact the classification of H ii intersections described in Section 5.2. We encourage a follow-up of this work using more accurate localizations.
2.3. Model-dependent Classification of FRBs
Statistically significant signals detected by the CHIME/FRB back end are classified as “Galactic,” “ambiguous,” or “extragalactic,” based on the source position and DM estimated by the real-time bonsai tree dedispersion algorithm (CHIME/FRB Collaboration et al. 2018). Single pulses from Galactic radio pulsars are identified through coincidences in both position and DM and for the purposes of Catalog 2 are excluded from subsequent analysis. Our signals of interest are those deemed extragalactic (i.e., FRBs), which are classified as such if their DMs exceed both of the predicted maximum values from the NE2001 (J. M. Cordes & T. J. W. Lazio 2002) and YMW16 (J. M. Yao et al. 2017) electron density models for their LOSs; these predictions are made assuming a distance of 25 kpc between the observer and the edge of the Milky Way disk. No aspects of scatter broadening are considered for the real-time classification of FRBs.
2.4. Best-fit Models of FRB Morphology
In order to characterize the effects of the WIM on burst morphology in Catalog 2, we use spectrotemporal measurements of FRB morphology estimated with fitburst (E. Fonseca et al. 2024). The fitburst modeling framework assumes that each pulsed feature undergoes cold-plasma dispersion and, in the absence of scatter broadening, has a Gaussian shape of intrinsic temporal width (σ). If relevant, the shape of the burst is instead assumed to be the pulse broadening function of a Gaussian profile (e.g., M. M. McKinnon 2014) that depends on σ and τsc.
All Catalog 2 fitburst measurements assume that τsc scales with electromagnetic frequency (ν) such that τsc ∝ ν−4. The Catalog 2 values for τsc are originally reported referenced to ν = 400.195 MHz (CHIME/FRB Collaboration et al. 2026); however, for the present study we scale τsc to be referenced at ν = 1 GHz using τsc,ν ∝ ν−4 (N. D. R. Bhat et al. 2004), as is typically done for related studies on radio pulsars and FRBs. Additionally, for detectability discussions, we reference τsc to CHIME frequencies whenever relevant—explicitly denoting it as τsc, 600 MHz. We used τsc, 1 GHz > 0.13 ms as a threshold for determining which FRBs have “well-measured” scatter broadening; this threshold value was obtained through comparisons of fitburst fits between total-intensity and microsecond-resolution baseband (voltage) data of the same detections (K. R. Sand et al. 2025).
2.5. Post-detection Selection Criteria for Catalog 2 FRBs
We adopted the initial data quality flags outlined in the Catalog 2 methodology (CHIME/FRB Collaboration et al. 2026). In addition, we required that the event have successful fits from the header_localization and fitburst pipelines. We excluded FRBs detected in the sidelobes of the primary beam, since these are more complicated to localize accurately (H.-H. Lin et al. 2024). The above selection criteria resulted in 4429 FRBs. To obtain the full set of unique sight lines from Catalog 2, we retain only the burst with the highest S/N for each repeating source. The final sample utilized in this study consists of 3542 FRBs—comprising 3459 nonrepeaters and 83 unique sight lines from repeating FRBs. Of those, 1105 FRBs meet the criterion for well-measured τsc, 1 GHz described in Section 2.4.
3. Statistical Significance of the Detection Gap
Figure 1 presents the spatial distribution of FRBs in Catalog 2, with the detection gap region highlighted by a cyan dashed enclosure. The high density of FRB detections near the north celestial pole is due to CHIME’s declination-dependent sensitivity and exposure. A magnified view of the detection gap region is presented in Figure 2. To delineate its shape and extent, we applied geometric methods based on the Delaunay triangulation and its dual, the Voronoi diagram using the scipy.spatial module (P. Virtanen et al. 2020). Using the Voronoi diagram, we identified the largest empty circle (LEC) within the detection gap by locating the Voronoi vertices farthest from any FRB. We estimate the center of the LEC within the detection gap to be at (l, b) = (77 7, 0
7, 0 9), with a radius of RLEC = 7
 7. The triangulation partitions FRB positions into nonoverlapping triangles such that no point is inside the circumcircle of any triangle. We identified the triangles for which the distance between their circumcenters and the center of the gap fell within the radius. The convex hull obtained from connecting the outer boundary of these triangles is the polygon that encloses the sky with zero FRB detections in Figure 2, with an area of 213.6 deg2.
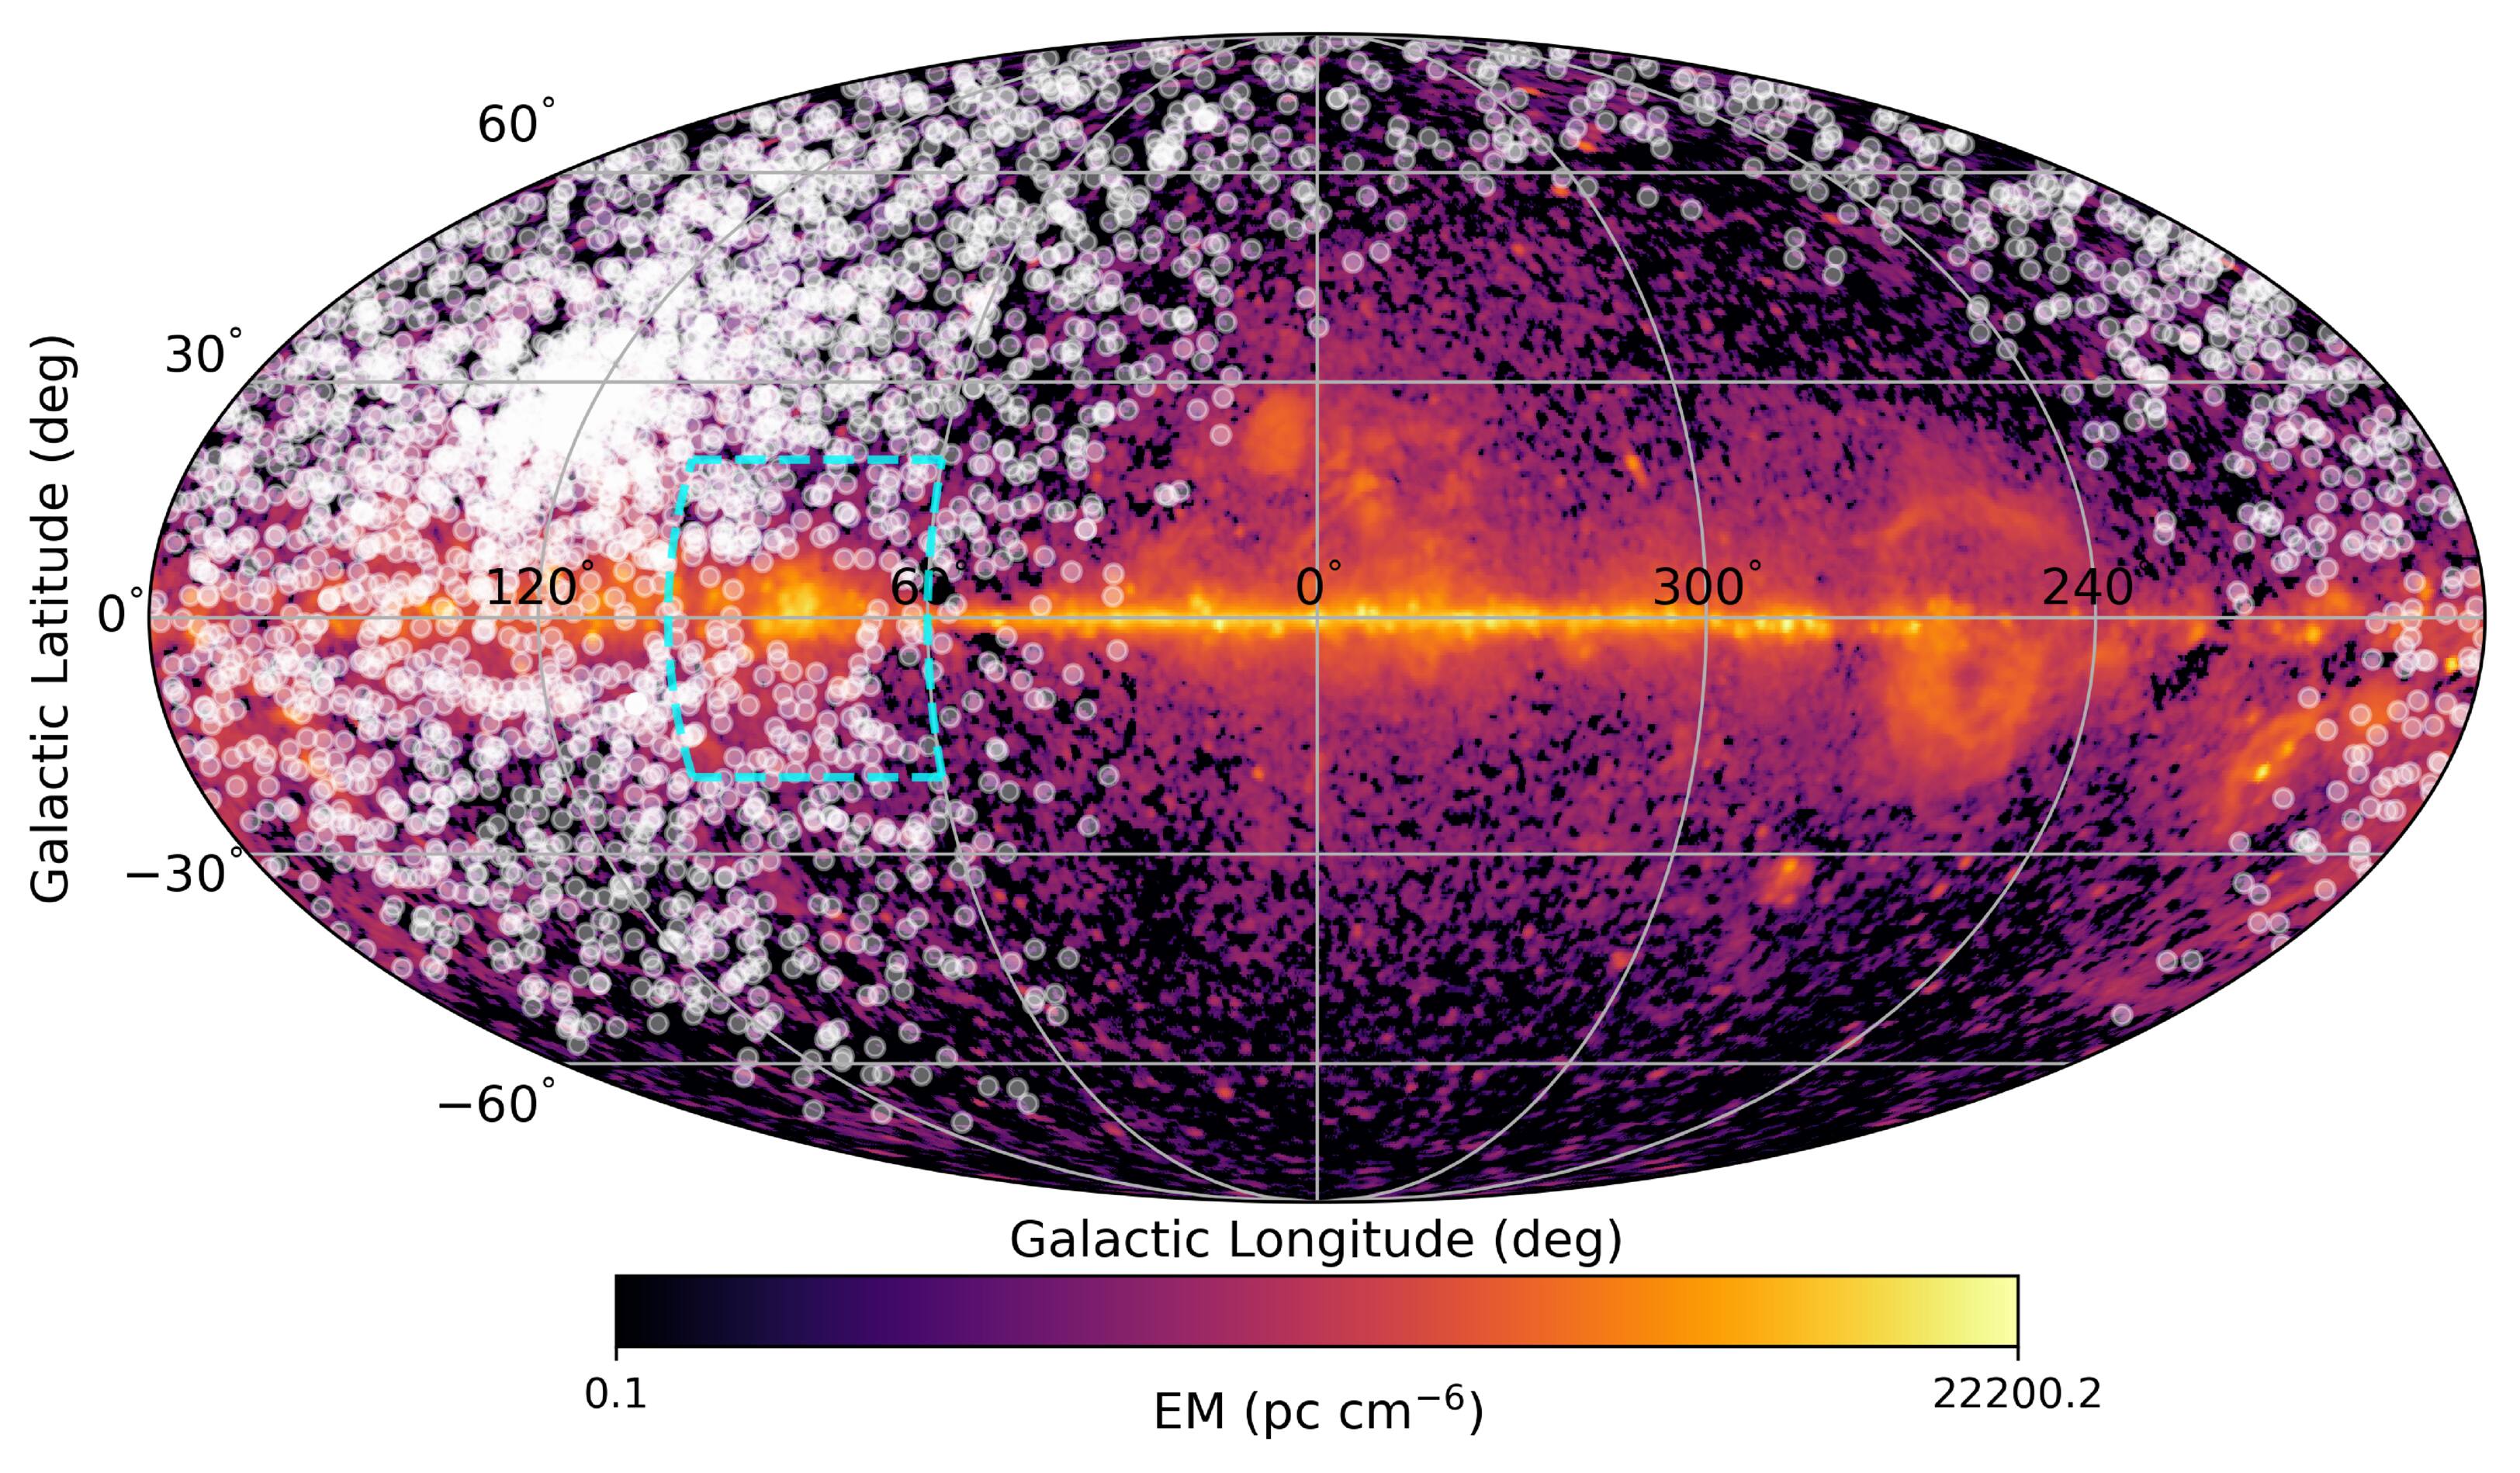
Figure 1. Positions of 3542 FRBs in our sample overlaid with the Planck EM map (Planck Collaboration et al. 2016). We qualitatively see an anticorrelation between FRB detections and regions of high EM. The detection gap is highlighted with dashed cyan lines. A zoomed-in view of this region is presented in Figure 2.
Download figure:
Standard image High-resolution imageAt 600 MHz, the effective gain of CHIME along the detection gap LOS is G ≈ 1.02 K Jy−1 with system temperature Tsys ≈ 50 K (CHIME/FRB Collaboration et al. 2018). Thus, the system equivalent flux density is roughly Tsys/G ≈ 48.78 Jy. The single-pulse radiometer equation gives a minimum detectable flux density of ∼0.5 Jy for narrow pulses (∼1 ms broadened width) and ∼0.1 Jy for pulses with broadened width larger than 10 ms along this LOS. In the following discussion, we assess whether the apparent detection gap can be explained by instrumental sensitivity and statistical noise effects, or whether it points to suppression in detectability due to scattering caused by ionized Galactic structures.
We use two methods to evaluate the significance of the lack of detections. For the first method, we estimate the probability of obtaining detection gaps with sizes RLEC ≥ 7 7 assuming that no “foreground” process produces such gaps. We determine this probability by first using Catalog 2 astrometric data to derive a two-dimensional probability density distribution of FRB detections across the CHIME sky through Gaussian kernel density estimation. We then resample this distribution to simulate a catalog of a size equal to that of Catalog 2. We then execute the Delaunay triangulation algorithm described above on the subset of simulated FRBs within the range −30∘ < b < 30 and 50∘ < l < 200∘ to find gaps in this realization. We repeat this process
  times in order to estimate a “realization-averaged” distribution of RLEC, which is shown in Figure 3. Using this approach, we find that the probability of obtaining detection gaps with sizes RLEC ≥ 7
 7 due to statistical fluctuations in our measurements is p ≈ 1.3 × 10⁻⁶.
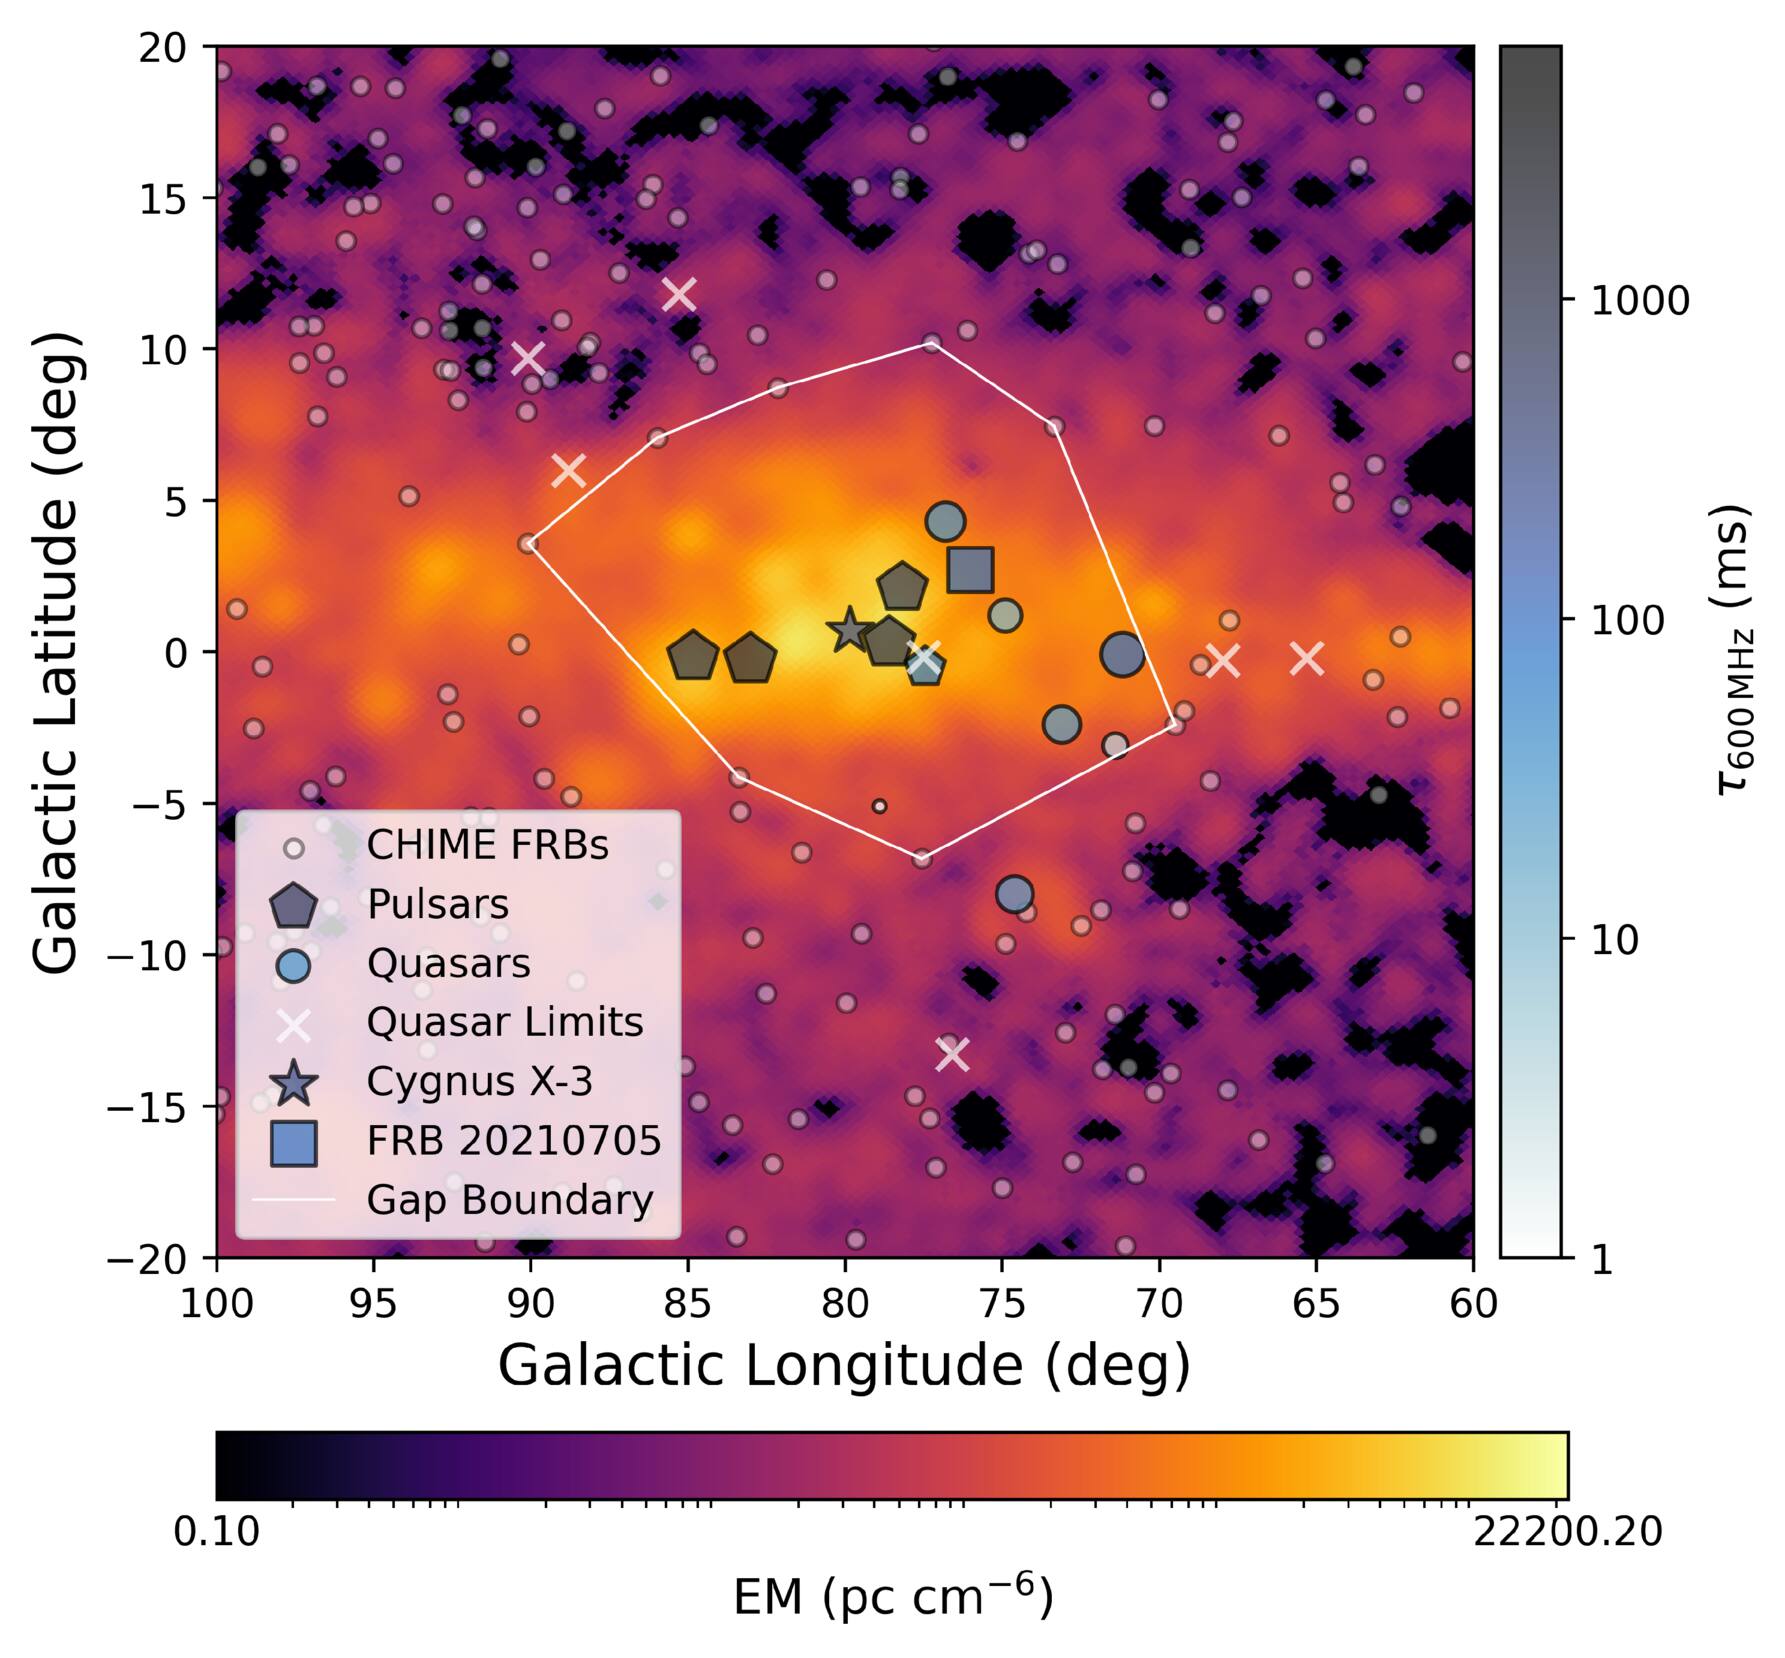
Figure 2. A comparison of literature values of scattering in and surrounding the Cygnus X region, as described in Section 4.1, overlaid on the Planck EM map (Planck Collaboration et al. 2016). The angular broadening measurements for quasars and Cygnus X-3 have been converted to scattering timescales using Equation (5) and scaled to 600 MHz using θ ∝ ν−2. Scattering measurements for pulsars and FRB 20210705 are extrapolated to 600 MHz using τ ∝ ν−4. This shows that sight lines through the Cygnus X region can produce ∼10–1000 ms of temporal scattering in CHIME’s observing band, which would hinder detection of an FRB (see Section 4.5). A white polygon encloses the area with zero FRB detections, formed by Delaunay triangulation as described in Section 3.
Download figure:
Standard image High-resolution imageFor the second method, we compute the probability of detecting zero FRBs within a circle of radius RLEC or larger anywhere on the sky surveyed by CHIME/FRB assuming a nonhomogeneous Poisson process model for its detections. The nonhomogeneous Poisson process is described by a position-dependent intensity function λ(α, δ), which here represents the expected density of detected FRBs and scales with the instrument’s exposure and sensitivity. It is convenient to work in the equatorial coordinate system (α, δ), as the CHIME/FRB gain varies primarily with δ. Moreover, the cosine dependence of an isotropic universal distribution of FRBs on the celestial sphere cancels out with the inverse-cosine dependence of the exposure in declination.
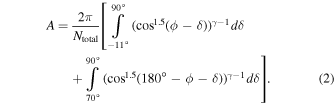
As reported by CHIME/FRB Collaboration et al. (2021), we note reduced exposure between 27° < δ < 34° as shown in Figure C1 in Appendix C and Figure 5 of CHIME/FRB Collaboration et al. (2021). This is due to a time-limited failure of one of the four CPU nodes covering these declinations. The patch of reduced exposure overlaps with only 7% of the total sky area of the detection gap. Omitting the reduced exposure patch, we fit a polynomial to the logarithm of the exposure from Catalog 2 versus δ and find that the observed exposure in this region is ≈18% lower than expected. At δ > 70°, sources are circumpolar from CHIME’s latitude and cross the telescope’s meridian twice daily. These “upper” and “lower” transits therefore yield higher effective exposure at δ > 70°. Using the CHIME/FRB sensitivity approximation parameterized by A. M. Cook et al. (2024) and accounting for exposure as described above, we can write

where H(x) is the Heaviside step function, γ = 1.5 is the Euclidean power-law index for a flux-limited survey representing the FRB luminosity function, ϕ = 49 32 is the geographic latitude of the CHIME telescope (CHIME/FRB Collaboration et al. 2018), and A is the following normalization constant such that the intensity equals Ntotal, the total number of FRBs in the sample, when integrated over CHIME/FRB’s sky:
The probability of detecting zero bursts within a circle of the observed radius RLEC or larger anywhere on the sky can then be written as
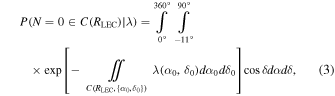
where C(RLEC, {α, δ}) denotes the circle of radius RLEC centered at {α, δ}. This probability serves as our one-sided p-value. We find that the nondetection of bursts in a region of this radius is statistically significant at the 4.2σ level obtained by converting p ≈ 1.3 × 10⁻⁵ using the inverse survival function of the standard normal distribution.
4. Assessing Possible Origins for the Detection Gap
Cygnus X is one of the most massive star-forming complexes in the Milky Way, rich in ionized gas. While it is possible that the spatial gap occurs by chance from the increased sky temperature, additional plasma processes are likely at play. Nominally, NE2001 predicts that the maximum DM through the region is ≈500 pc cm−3, and the maximum scattering timescale in CHIME’s observing band is τsc,600 MHz ≈ 1.4 ms, comparable to the time sampling. These values are too small to cause appreciable DM smearing, or reduced S/N from scattering. However, angular broadening measurements of background sources and recent DM and scattering measurements of pulsars and a background FRB support a view in which Cygnus X is far more plasma-rich than in existing Galactic electron models; in this section we cover the existing literature and investigate the gap in the context of other observations through Cygnus X.
4.1. Background on the Cygnus X Region
While Cygnus X is composed of many distinct star-forming regions, studies of molecular line observations have argued that they are associated, and at a similar distance dCyg (N. Schneider et al. 2006). This association was later supported using parallax measurements with masers (K. L. J. Rygl et al. 2012) and with Gaia (S. R. Berlanas et al. 2019), finding distance measurements spanning a range 1.3 kpc < dCyg < 1.7 kpc. We adopt a value of dCyg = 1.5 kpc throughout our work (following the discussion of F. Comerón et al. 2020), but we emphasize that it does not strongly affect our analysis. At dCyg = 1.5 kpc, the ∼18° angular diameter of the spatial gap corresponds to ∼250 pc. Additionally, the electron temperature Te is a function of Galactocentric radius Rgal, fit by C. Quireza et al. (2006) as Te(K) = (5780 ± 350) + (287 ± 46)RGal. We adopt Te = 8000 K throughout for the Cygnus X region, appropriate for RGal ≈ 8 kpc.
4.1.1. Emission Measure
From the Planck emission measure (EM) map (Planck Collaboration et al. 2016), which traces the free–free emission from ionized gas and has a resolution of  pc, the maximum EM of the Cygnus X region is 9400 pc cm−6. On smaller angular scales, the Cygnus X region contains many thin filamentary structures, which are overdense and overpressured compared to the average properties of their surroundings (K. L. Emig et al. 2022). The filaments reach a maximum EM of 105 pc cm−6, and electron densities of ne≈ 10−400 cm−3, compared to their respective medians of 5200 pc cm−6 and ne ≈ 35 cm−3. The density of the volume-filling ionized gas in the region is ne ≈ 35 cm−3, which itself is far above the volume-averaged plasma density in the WIM of ne ≈ 0.03 cm−3 (P. O. Mezger 1978; K. L. Emig et al. 2022).
The observables  and
and  are physically related quantities, where ne(l) is the free electron density (in cm−3) at a distance l (in pc) along the LOS, and L is the total path length through the ionized medium (in pc). Following S. K. Ocker et al. (2024), we assume that a path length L with volume-average electron density ne is filled with dense cloudlets with a volume filling factor f ≤ 1 and internal density ne,i, such that ne = fne,i. The other parameters are the variance of electron density within a cloudlet
  and that between cloudlets
  . Following this prescription, the DM and EM are related as

The prefactor  is always ≤1, forming an upper limit on the DM.
Based on the above, a source seen through Cygnus X at the maximum EM ≈ 104 pc cm−6 (from the Planck map) with path length L ≈ 500 pc could accrue DM ≲ 2200 pc cm−3. As will be described in Sections 4.1.3 and 4.1.4, this estimate is in line with the highest DMs of pulsars in the region and that of the background FRB 20210705 discovered at L band with the Five-hundred-meter Aperture Spherical radio Telescope (FAST). As discussed in Section 4.1.1, the peak EM in filaments reaches 105 pc cm−6, although most filaments have thickness on the order of a few parsecs (K. L. Emig et al. 2022). A sight line could, in principle, accumulate a larger DM if it is seen directly through the long axis of a filament, but this is unlikely and not representative of an average LOS through the Cygnus X region.
4.1.2. Angular Broadening
Background quasars, if intrinsically compact enough, can show signs of angular broadening when observed through multifrequency very long baseline interferometry (VLBI), characterized by broadening θ ∝ να, scaling with α ≈ −2. Early VLBI observations of background quasars show angular broadening with full width at half-maximum (FWHM) of θFWHM ≈ 10–200 mas referenced to 1 GHz within Galactic longitudes 60° ≲ l ≲ 80°, greater than the surroundings (A. L. Fey et al. 1989, 1991). Observations of Cygnus X-3 (not associated with but background to the Cygnus X region) show scatter broadening of 220–250 mas at 1 GHz (L. A. Molnar et al. 1995). Many additional VLBI studies of quasars through Cygnus X (e.g., K. M. Desai & A. L. Fey 2001; T. J. W. Lazio & A. L. Fey 2001; K. É. Gabányi et al. 2006) show angular broadening of a similar order, as well as extreme-scattering-event-like structures seen in the light curve of quasar B2005+403, implying ∼0.7 au plasma structures (T. A. Koryukova et al. 2023).
Angular broadening, combined with the known distance to Cygnus X, can be used to predict the scattering time delay. For a scatter-broadened image with θFWHM, the scattering timescale τsc, defined as the 1/e timescale for a decaying exponential, is related to θFWHM as (e.g., J. M. Cordes & S. Chatterjee 2019)

where  for a scattering screen at distance dscr from the observer and source at distance D. For an extragalactic source and a thin screen near the observer, dscr ≪ (D − dscr) and deff ≈ dscr.
This equation is exact for an angular intensity distribution following a Gaussian and can differ by a factor of ≈0.6–2 depending on the exact form of the scatter-broadened image. Scattering timescales derived for background radio sources using Equation (5) with dscr = dCyg are listed in Table 1.
4.1.3. Pulsars
There are >90 known pulsars within our detection gap (R. N. Manchester et al. 2005). With surveys from more sensitive telescopes, many newly discovered pulsars in this region have DMs greater than the full expected Milky Way contribution from Galactic-ne models (J. L. Han et al. 2025), as the abundance of plasma within Cygnus X is not properly accounted for. Without a reliable ne model along these sight lines, and with few independent distance measurements, it is difficult to know which pulsars are foreground or background to the star-forming complex. As the complex itself is likely the cause of the discrepancy, the sources with DMs far exceeding model predictions can be assumed to be within or behind Cygnus X.
The FAST telescope recently measured scattering of 17 pulsars within our detection gap, spanning a range of τsc, 1 GHz ≈ 1–300 ms, and DMs 200–950 pc cm−3 (W. C. Jing et al. 2025). Other pulsars with scattering measurements include PSR J2108+5001, discovered by the CHIME All-sky Multi-day Pulsar Stacking Search (C. Andrade et al. 2025) and located just outside of our detection gap boundary, and nine pulsars discovered with the Green Bank Telescope at 820 MHz (A. E. McEwen et al. 2024).
The maximum DM predicted by NE2001 and YMW16 at the center of the detection gap is ∼500 pc cm−3. Pulsars with DMs exceeding this value are almost certainly located within or behind Cygnus X. Their scattering timescales can therefore provide an estimate of the propagation effects experienced by background sources, including FRBs intersecting this region. A list of the literature scattering measurements for DM > 500 pc cm−3 pulsars across the Cygnus X region is compiled in Table 1 and in Figure 2 (including J2108+5001 (482 pc cm−3), which falls just below this threshold but as a CHIME-detected pulsar is relevant to the context of CHIME’s observing capabilities).
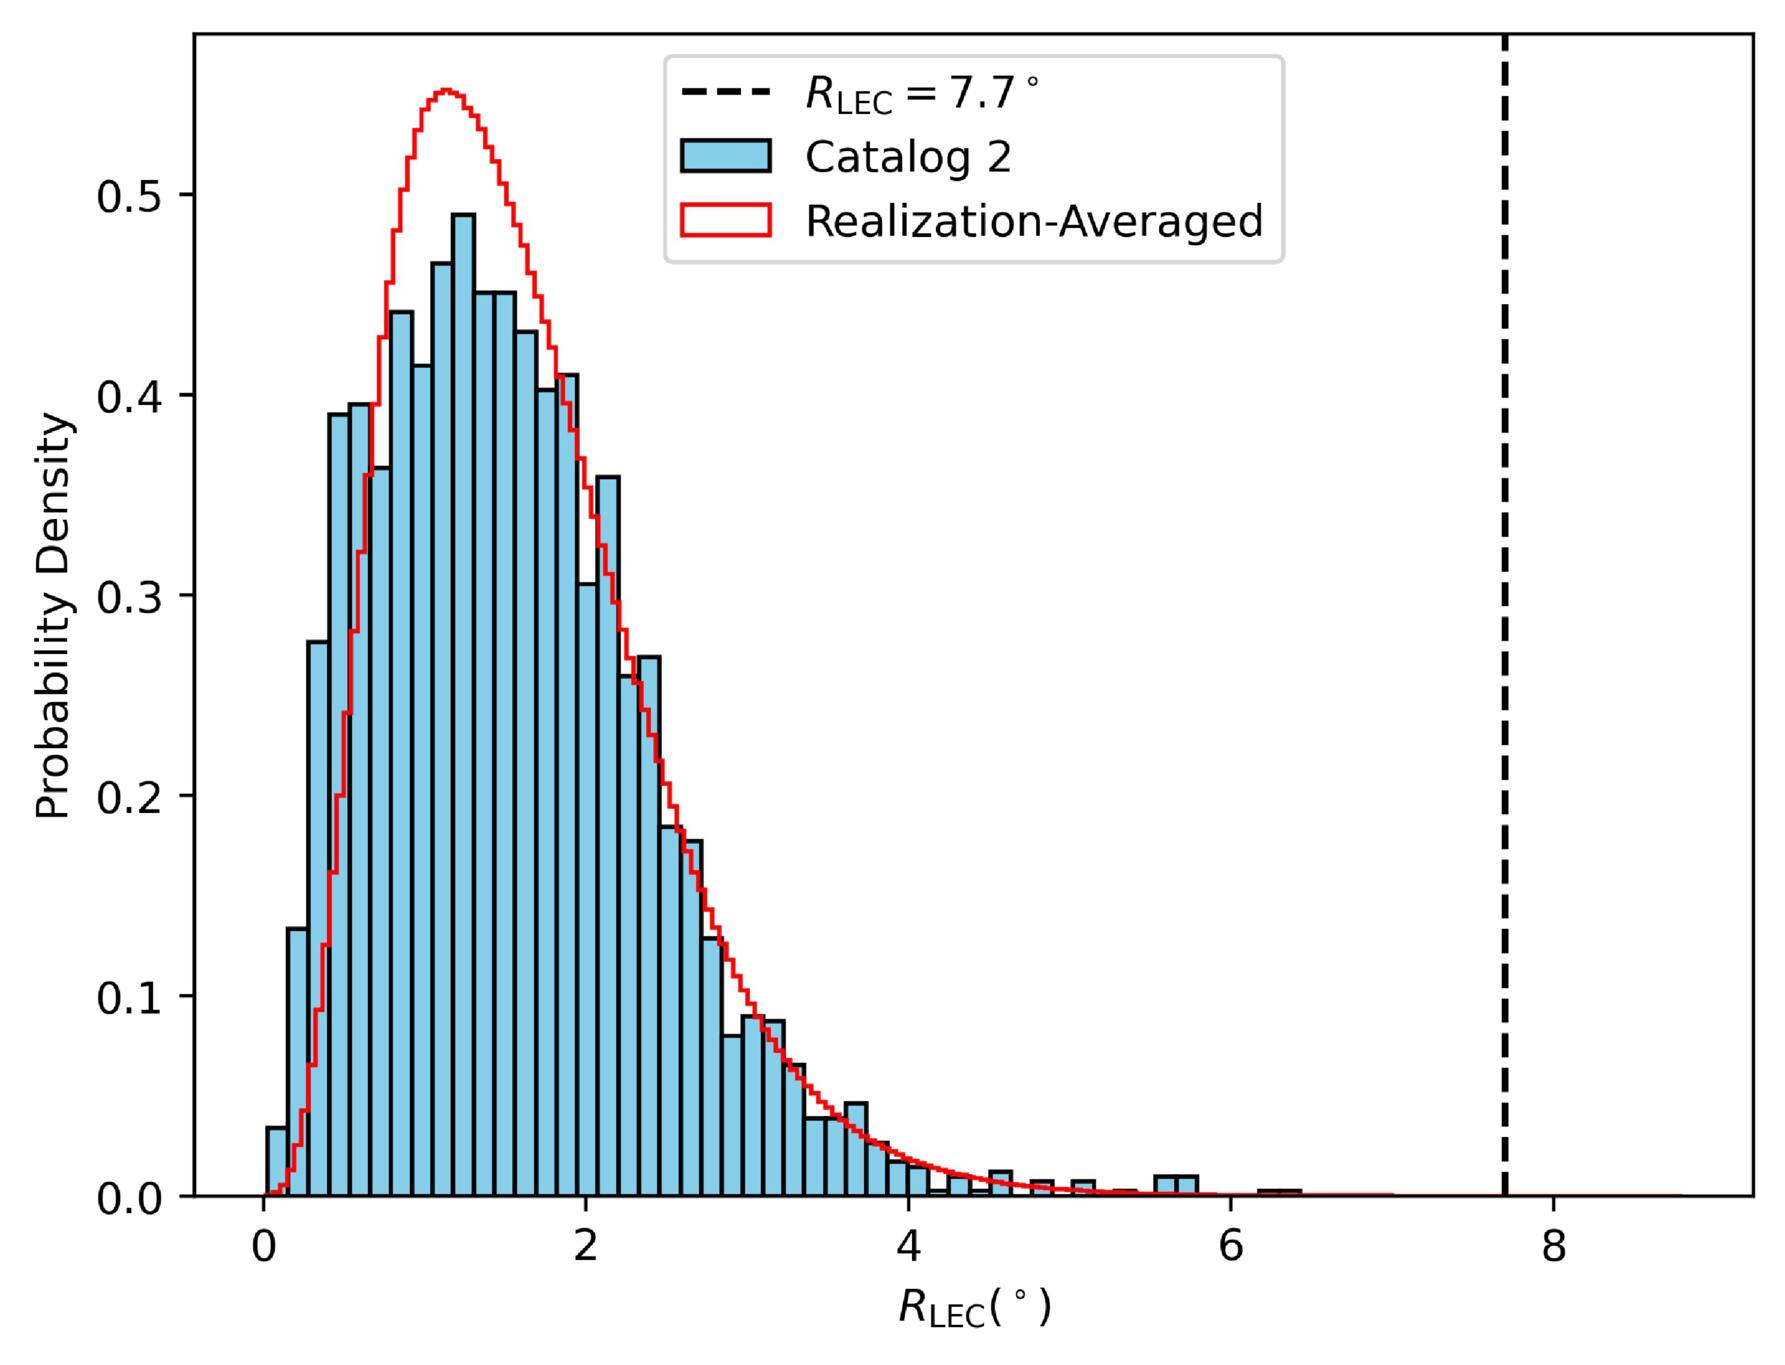
Figure 3. Distribution of RLEC estimates obtained from a Delaunay triangulation analysis of the Catalog 2 data (red histogram) and simulations of sky positions of FRBs in  catalogs derived from the statistics of Catalog 2 detections (blue filled histogram). The black dashed vertical line indicates the largest measured RLEC in Catalog 2.
Download figure:
Standard image High-resolution image4.1.4. FRBs at Higher Observing Frequencies
According to Blinkverse (J. Xu et al. 2023), a single FRB lies within the CHIME detection gap: FRB 20210705 (see Figure 2), discovered by FAST in the Galactic Plane Pulsar Snapshot survey at L band (D. J. Zhou et al. 2023). This burst is located at Galactic coordinates (76 03, 2
03, 2 71) with DM = 2011.6 ± 3.2 pc cm−3 and τsc, 1 GHz = 12 ± 2 ms (τsc, 600 MHz ≈ 92 ± 15 ms).
The distribution of observed scattering timescales in Catalog 2 is well described by a lognormal distribution (CHIME/FRB Collaboration et al. 2026). In log-space,  follows a normal distribution characterized by a mean μ = −0.5 and standard deviation σ = 1.02. This corresponds to a mean τsc, 1 GHz = 1.02 ms and σ = 1.37 ms. FRB 20210705, with
  , lies 2.93σ above the mean. This value corresponds to the 99.5th percentile of the Catalog 2 distribution, placing it among the most highly scattered FRBs in the sample.
We include all aforementioned measurements of angular broadening and scattering timescales in Figure 2, superimposed on the Planck foreground EM map, surrounding our spatial gap in FRB detections.
4.2. Biases from DM Models and Dispersion Smearing
As described in Section 2.3, the CHIME/FRB pipeline uses Galactic DM predictions from NE2001 and YMW16 to classify events as Galactic or extragalactic. This raises a general concern that DM-based thresholds could cause nearby, low-DM FRBs to be missed, if the models overestimate the Galactic DM along the LOS. For example, FRB 20220319D (DM = 110.95 pc cm−3, distance = 50 Mpc), detected by the Deep Synoptic Array (DSA-110), exhibits a DM lower than the model predictions (V. Ravi et al. 2025). However, in the Cygnus X region, the situation is reversed and the Galactic-ne models underestimate the DM (see pulsars in Section 4.1.3). As a result, pulsars with unusually high DMs are more likely to be misclassified as FRBs, not vice versa. Therefore, this classification bias cannot explain the absence of FRBs in the detection gap.
We acknowledge the possibility that the Cygnus X complex is so poorly accounted for in the models that they could underestimate the maximum DM by an order of magnitude, i.e., that the true value of  along the LOS. At such high DMs, intrachannel dispersion smearing could partially emulate scatter broadening and reduce pulse brightness at low frequencies. However, we believe that DM smearing can be ruled out as the origin of the detection gap. Temporal broadening due to intrachannel dispersion smearing (J. M. Cordes & M. A. McLaughlin 2003) is given by

The CHIME/FRB detection pipeline searches to a maximum DM of 13000 pc cm−3 (CHIME/FRB Collaboration et al. 2018). In order to produce tchan ≈ 8 ms at 600 MHz—comparable to the mean value of τsc measured in Catalog 2 (1 ms at 1 GHz; see Section 4.1.4)—a value of DM > 8000 pc cm−3 is required. This estimate is substantially higher than the DM inferred from the maximum EM in the Cygnus X region as discussed in Section 4.1.1.
4.3. Free–free Absorption in the Direction of Cygnus X
Here we examine whether the FRB detection gap toward Cygnus X could be caused by free–free absorption. The free–free opacity is well approximated by (P. G. Mezger & A. P. Henderson 1967)

As discussed in Section 4.1, the Planck EM map for the Cygnus X region indicates that EM ≈ 9400 pc cm−6, while detailed studies of overdense and overpressured filaments show peak values of EM ≈ 105 pc cm−6(K. L. Emig et al. 2022).
Inserting EM ≈ 104 pc cm−6 for the Cygnus X region (S. K. Ocker et al. 2024) and Te ≈ 8000 K, the opacity is τff ≈ 0.02 at ν = 400 MHz, the bottom of our band. For the maximum measured EMs of EM ≈ 105 pc cm−6, free–free absorption begins to matter, with τff ≈ 0.2 at ν = 400 MHz, but it is still a small effect, and with τff < 0.1 averaged across the band. The detection of background quasars at 350 MHz (e.g., T. J. W. Lazio & A. L. Fey 2001) and the prevalence of free–free emission at 148 MHz (e.g., K. L. Emig et al. 2022) also qualitatively suggest that free–free absorption is not dominating at low radio frequencies in this region. We therefore conclude that while free–free absorption could have a small effect on a background FRB, it is not the primary cause of the detection gap.
4.4. Effect of the Sky Temperature
The spatial gap is toward Cygnus X (J. H. Piddington & H. C. Minnett 1952), a bright source of radio continuum at CHIME’s observing frequencies that could reduce sensitivity to a background burst. Using the Haslam 408 MHz radio sky temperature map (C. G. T. Haslam et al. 1982), scaled to the central frequency of the CHIME band with a scaling index of −2.6, the average sky temperature within the detection gap is 35 K. To capture the effect of higher temperatures present in smaller subregions within the area, we use the 99th percentile Tsky = 108 K.
The expression for (S/N)b, the S/N of the broadened pulse,

follows directly from the standard radiometer equation as used in FRB and pulsar literature (e.g., J. M. Cordes & M. A. McLaughlin 2003; C. Patel et al. 2018), where Si is the intrinsic flux density, np is the number of polarizations measured, Δν is the bandwidth, and β is the correction factor for digitization. Burst detectability for CHIME/FRB is governed by the intrinsic burst width Wi, intrinsic flux, DM, and τsc. The observed peak flux density for an FRB decreases as its broadened pulse width—Wb—increases, defined as (D. W. Gardenier et al. 2021)

where z0 is the redshift and tchan depends linearly on the DM as described by Equation (6) in Section 4.2.
To compute the expected number of bursts within the detection gap, we perform simulations using subsamples of bursts from Catalog 2, explicitly accounting for the effect of elevated sky temperature. To ensure approximately uniform exposure and sensitivity, we select all Catalog 2 bursts in the similar declination range of 30° < δ < 50°, resulting in 919 bursts. This sample serves as an empirical proxy for the intrinsic burst sample seen at this declination range in the absence of the influence of Cygnus X. From Section 3, the expected number of bursts originating behind the gap (i.e., before accounting for the elevated Tsky in the Cygnus X region) is 19, following a Poisson distribution. We generate 106 simulated realizations as follows:
- 1.Generate a number of bursts originating behind the gap Ngap, drawn from a Poisson distribution P(λ = 19).
- 2.Randomly select Ngap bursts from the Catalog 2 subsample of 919 bursts, using their intrinsic burst width (Wi), sky temperature corresponding to their positions Tsky,i, and (S/N)i as burst parameters.
- 3.Compute the S/N resulting from the changed sky temperature in the gap, as

- 4.For each realization, find the number of bursts detected in the gap, Ndetected,gap, such that (S/N)Cygnus ≥ 8.

From the simulations, we find that the mean number of bursts detected would be 〈Ndetected,gap〉 = 6, when accounting for the above-average Tsky. We find that zero detections occur in fewer than 0.3% of the simulations (i.e., Ndetected,gap = 0), indicating that increased sky temperature and Poisson fluctuations alone are insufficient to account for the observed gap toward Cygnus X.
4.5. Empirical Limits on Scattering Timescale
As summarized in Section 4.1, the measurements to date of sources observed through the Cygnus X region show significant scattering (τsc, 600 MHz ∼ 10–1000 ms), based on the angular broadening of background quasars and Cygnus X-3, as well as the scattering of distant pulsars and the FRB detected by FAST. This already suggests that scattering can be deleterious for FRB detections at CHIME and is likely a significant contributor to the lack of CHIME/FRB detections in the gap. However, the magnitude of scattering, which depends on plasma fluctuations on tiny scales at ≪1 au, can drastically differ between sight lines. In this section, we quantify the effect of scattering on CHIME/FRB detections and in turn set a lower limit on the average scattering in the detection gap that would lead to zero detections.
We first searched the positional and fitburst data in Catalog 2 for a radial trend in measured τsc from the boundary of the Cygnus X region, observing no clear trend. In Catalog 1 injections, CHIME/FRB found a strong selection bias against temporally broad bursts (Wb > 10 ms, calculated at 600 MHz; M. Merryfield et al. 2023). The lack of a trend may be due to the narrow observable window in τsc, which is constrained by the lower limit set by the reliability cutoff (0.13 ms at 1 GHz; see Section 2.4) and by the upper limit (≥10 ms at 1 GHz) that corresponds to scattered pulses likely too broad to detect. Along with a limited number of detected FRBs, a statistically significant radial trend is difficult to establish without finer time resolution to probe a wider range in τsc. As a result, it is difficult to trace whether there is a gradual increase in scattering timescales for sight lines closer to the center of the detection gap.
From the simulations described in Section 4.4, we found that on an average six bursts are expected to be seen in the detection gap. These simulations account for the elevated sky temperature but not for scattering. Here we extend the simulation to assess the degree of scattering required to see zero bursts.
In the simulations outlined in Section 4.4, we introduce pulse broadening due to scattering using Equation (9). For each simulated realization, we compute the minimum τsc using Equation (8), such that the increased Wb and Tsky reduce the S/N of all FRBs within the detection gap to (S/N)b < (S/N)thresh = 8. The distribution of τsc, 1 GHz values obtained from these simulations is shown in Figure 4. We find that a mean value of τsc, 1 GHz = 5.59 ms or τsc, 600 MHz = 43.13 ms is sufficient to suppress all detections. Because all simulations adopt the 99th percentile Tsky measured within the void area, these are conservative lower limits on τsc. Using more typical, lower Tsky would require even larger τsc to achieve the same suppression in (S/N)b. The maximum τsc predicted by Galactic-ne models for the LOS through the center of the detection gap are  = 0.1 ms and
  = 16 ms. This range of model-dependent maximum values of τsc is consistent with our inferred maximum derived from the simulations. Moreover, this consistency reinforces the idea that enhanced scattering in Cygnus X is likely to explain the detection gap, though our limit was obtained in a manner independent of either ne model. However, we emphasize that these models are outdated, differ in their treatment of the Cygnus X region,20
and lack accurate modeling of small-scale plasma fluctuations, so their predictions should be interpreted only as rough references.
= 16 ms. This range of model-dependent maximum values of τsc is consistent with our inferred maximum derived from the simulations. Moreover, this consistency reinforces the idea that enhanced scattering in Cygnus X is likely to explain the detection gap, though our limit was obtained in a manner independent of either ne model. However, we emphasize that these models are outdated, differ in their treatment of the Cygnus X region,20
and lack accurate modeling of small-scale plasma fluctuations, so their predictions should be interpreted only as rough references.
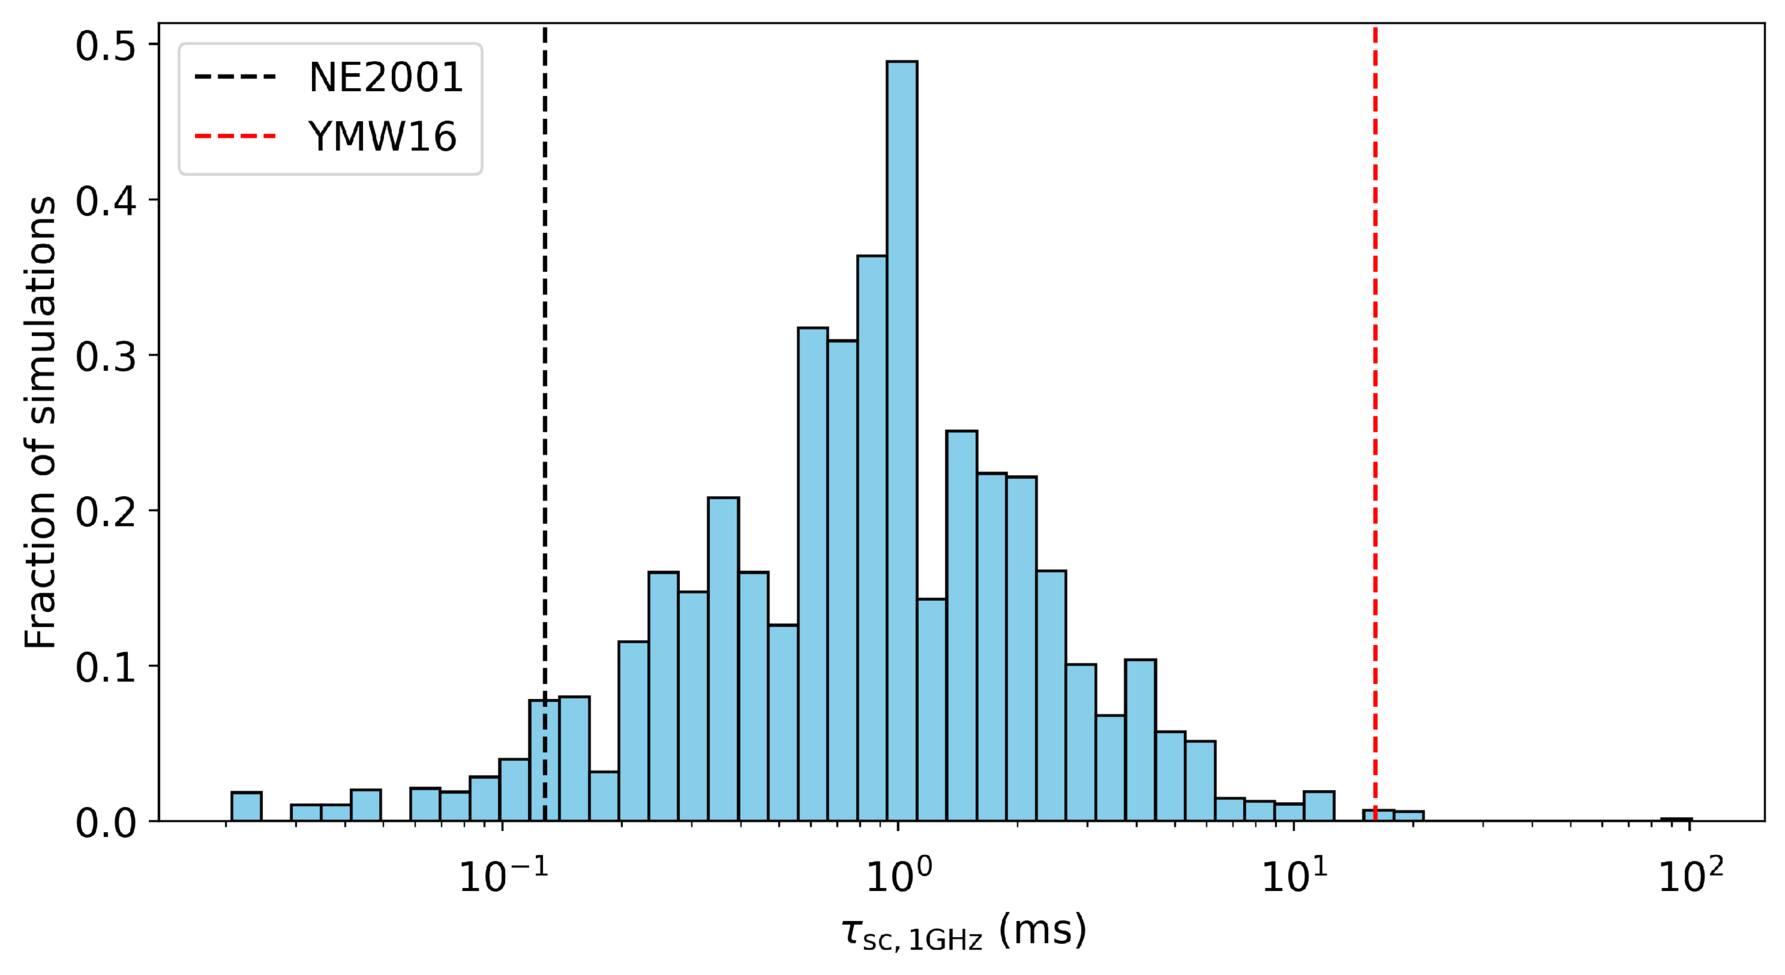
Figure 4. Distribution of scattering timescales at 1 GHz that result in zero detectable FRBs in the gap across 106 simulations, incorporating elevated sky temperature as described in Section 4.4. Vertical dashed lines indicate scattering predictions from the NE2001 model (black) and YMW16 model (red) for the LOS along the center of the gap.
Download figure:
Standard image High-resolution image5. Discussion
The statistical significance of the detection gap was aided by its large angular extent, as discussed in Section 3. Smaller spatial gaps, however, can occur through chance. We used the nondetections of FRBs in the direction of Cygnus X to place a data-driven lower limit on the magnitude of maximal scattering contribution from the Milky Way, in a manner independent of existing Galactic-ne models. However, even if smaller in angular extents, other ionized structures in the Galaxy such as H ii regions and high-EM sight lines may have similar impacts on the observed scattering properties and detectability of FRBs in Catalog 2. This may introduce a selection bias in the observed spatial distribution of FRBs.
The Murchison Widefield Array Interplanetary Scintillation survey has revealed similar spatial gaps in the distribution of compact radio sources due to angular broadening from clumpy ISM turbulence correlated with Hα emission (J. S. Morgan et al. 2022). In the case of pulsars, scintillation arcs and VLBI have been used to localize scattering structures to known H ii regions (e.g., G. Mall et al. 2022).
Figure 5 provides a visual overview of the spatial relationship between Catalog 2 FRBs, known H ii regions, and EM. Several FRB sight lines in our sample intersect known H ii regions. Furthermore, Figure 5 illustrates the possibility that FRBs with significant scattering are more likely to occur along LOSs intersecting H ii regions—or be missed entirely owing to reduced detectability. These visual trends in the sky distribution of Catalog 2 FRBs motivate the discussion in the following subsections.
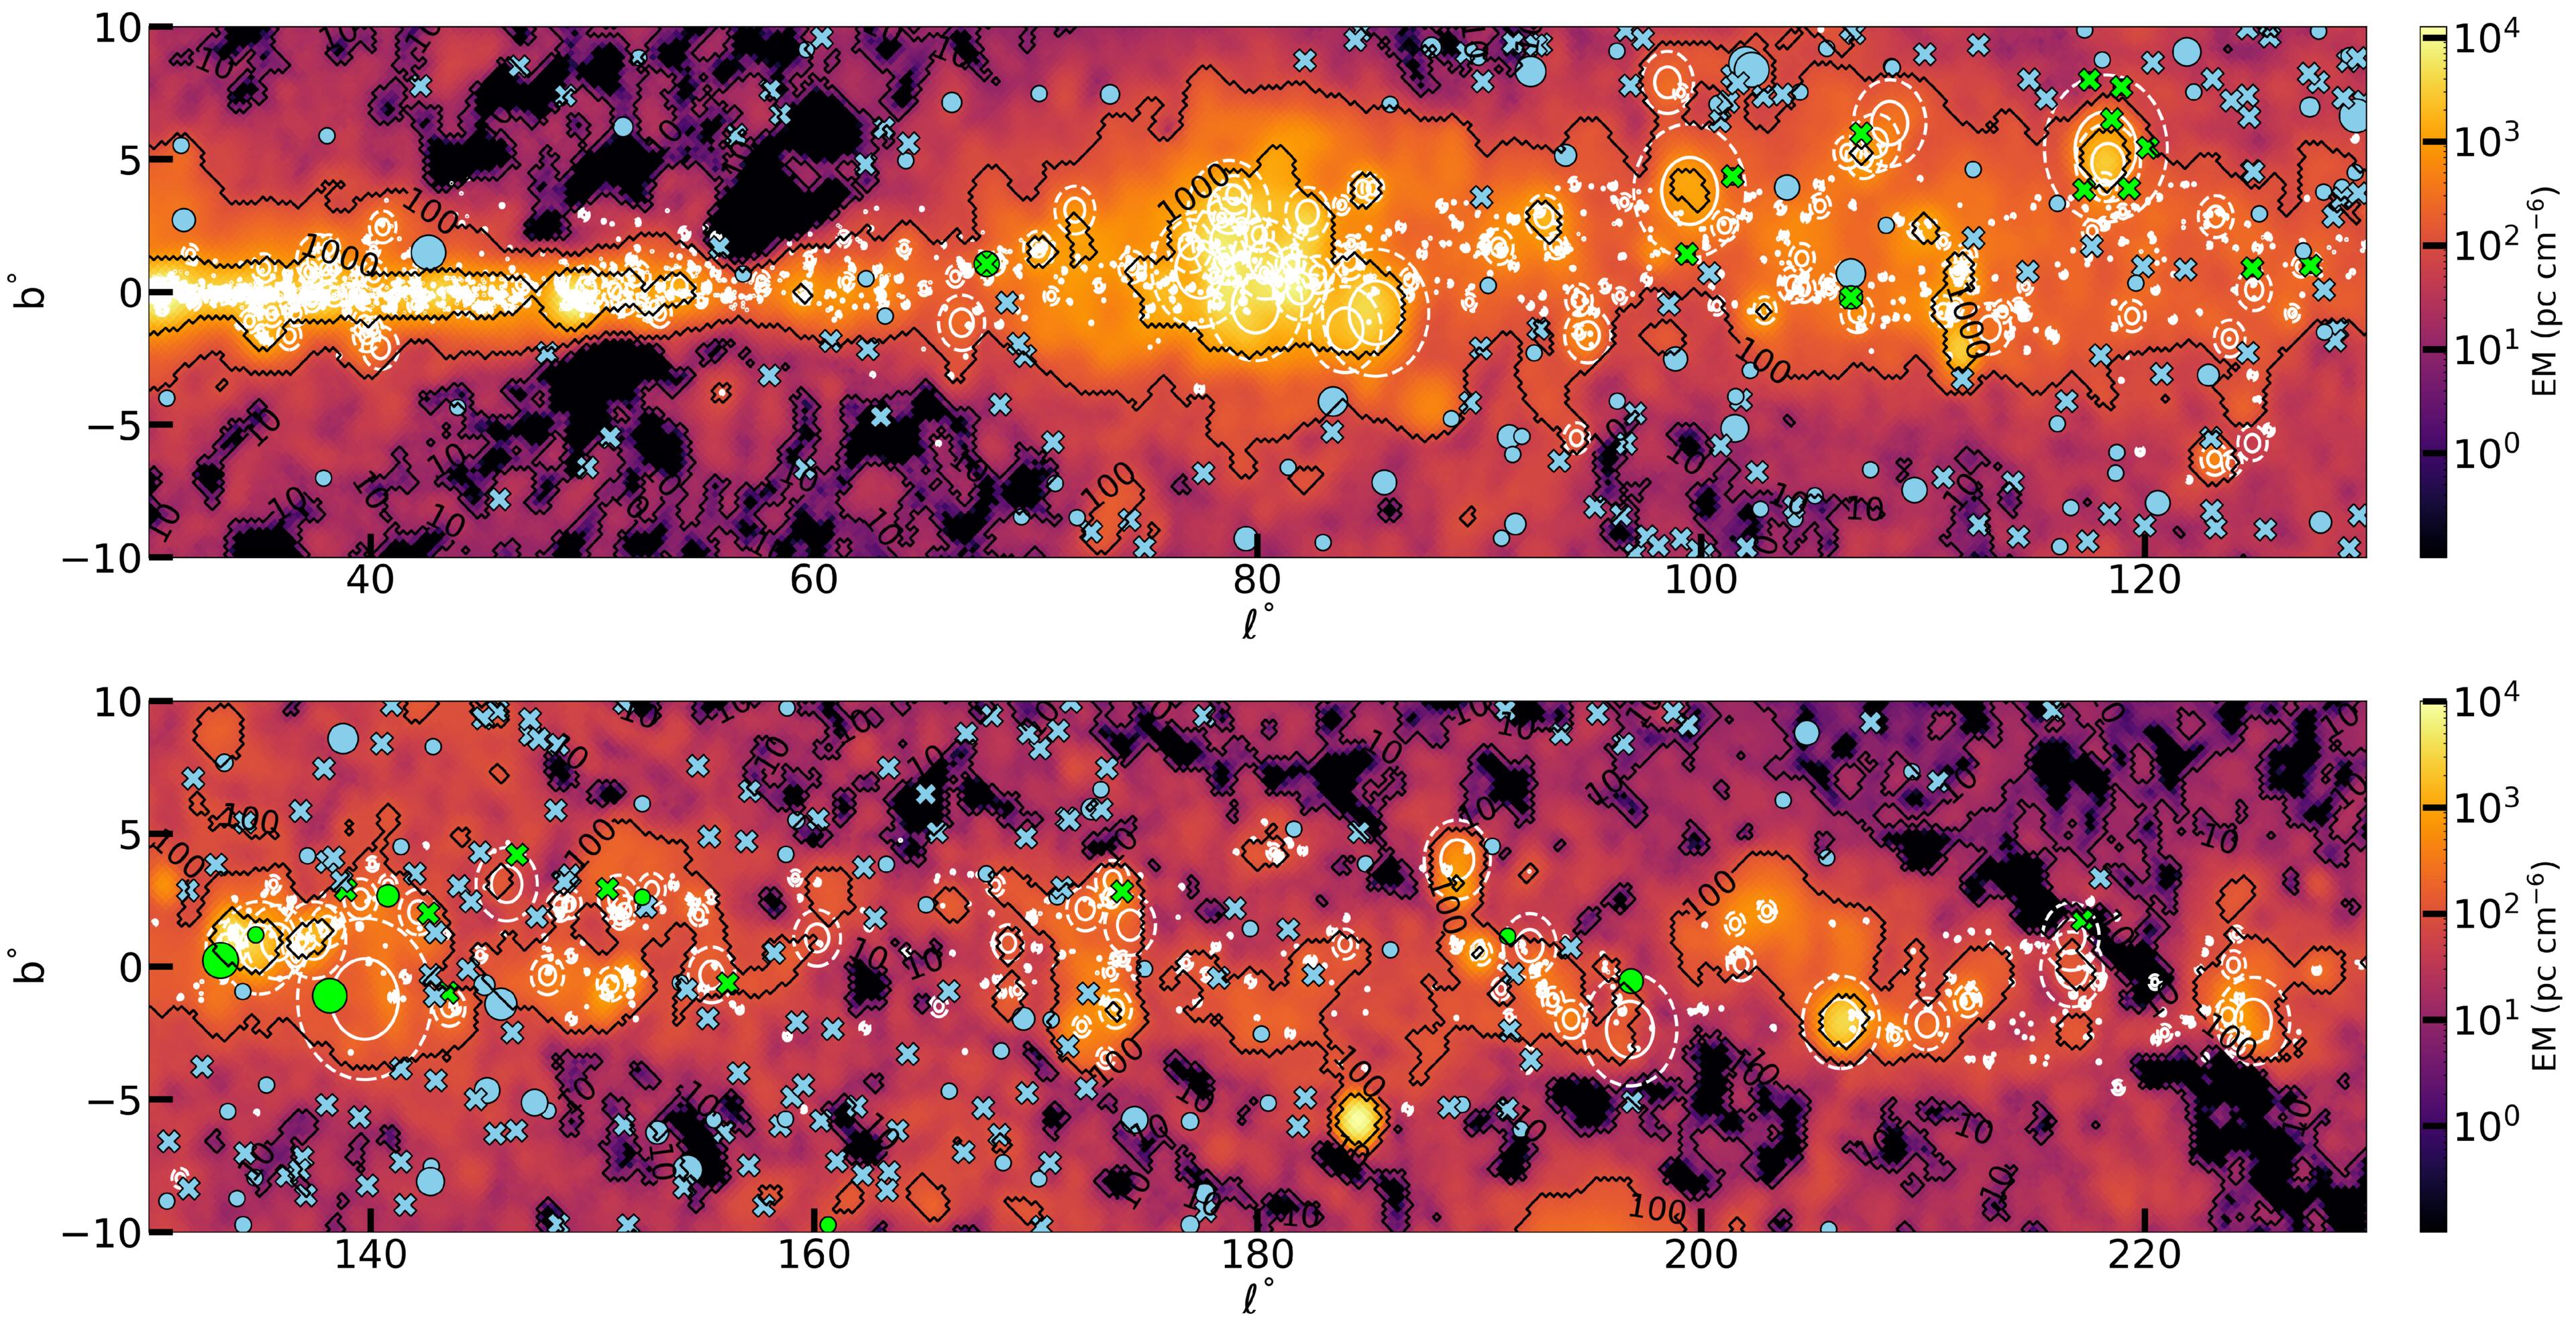
Figure 5. Planck EM map (Planck Collaboration et al. 2016) in Galactic coordinates centered at l = 80°, b = 0° (top) and l = 180°, b = 0° (bottom). Overlaid black contours trace logarithmically spaced EM 10, 100, and 1000 pc cm−6. White solid and dashed circles highlight WISE H ii regions (L. D. Anderson et al. 2014) with angular radii θIR and 2θIR, respectively. The radius of the IR emission θIR is provided by the WISE catalog. Lime markers are for FRB LOS with intersecting H ii regions, and sky-blue markers are for nonintersecting FRBs. Crosses indicate FRBs for which no reliable scattering timescale was measured with total-intensity data, while the radii of circles are scaled according to the log of the measured scattering timescale.
Download figure:
Standard image High-resolution image5.1. Trends with DM, EM, and Hα
To statistically test whether highly scattered FRBs are underdetected in general owing to propagation through regions of elevated EM, we compared EMs at FRB positions with those along all sight lines visible to CHIME. Exposure weighting is applied using the CHIME/FRB beam exposure map (CHIME/FRB Collaboration et al. 2026), such that each sky position contributes proportionally to its observing time. Figure 6 shows this comparison using the Planck EM map (Planck Collaboration et al. 2016). The FRB distribution drops to zero for EM ≥ 2900 pc cm−6. This difference demonstrates a deficit of FRBs along high-EM sight lines that are associated with ionized regions in the Galaxy.
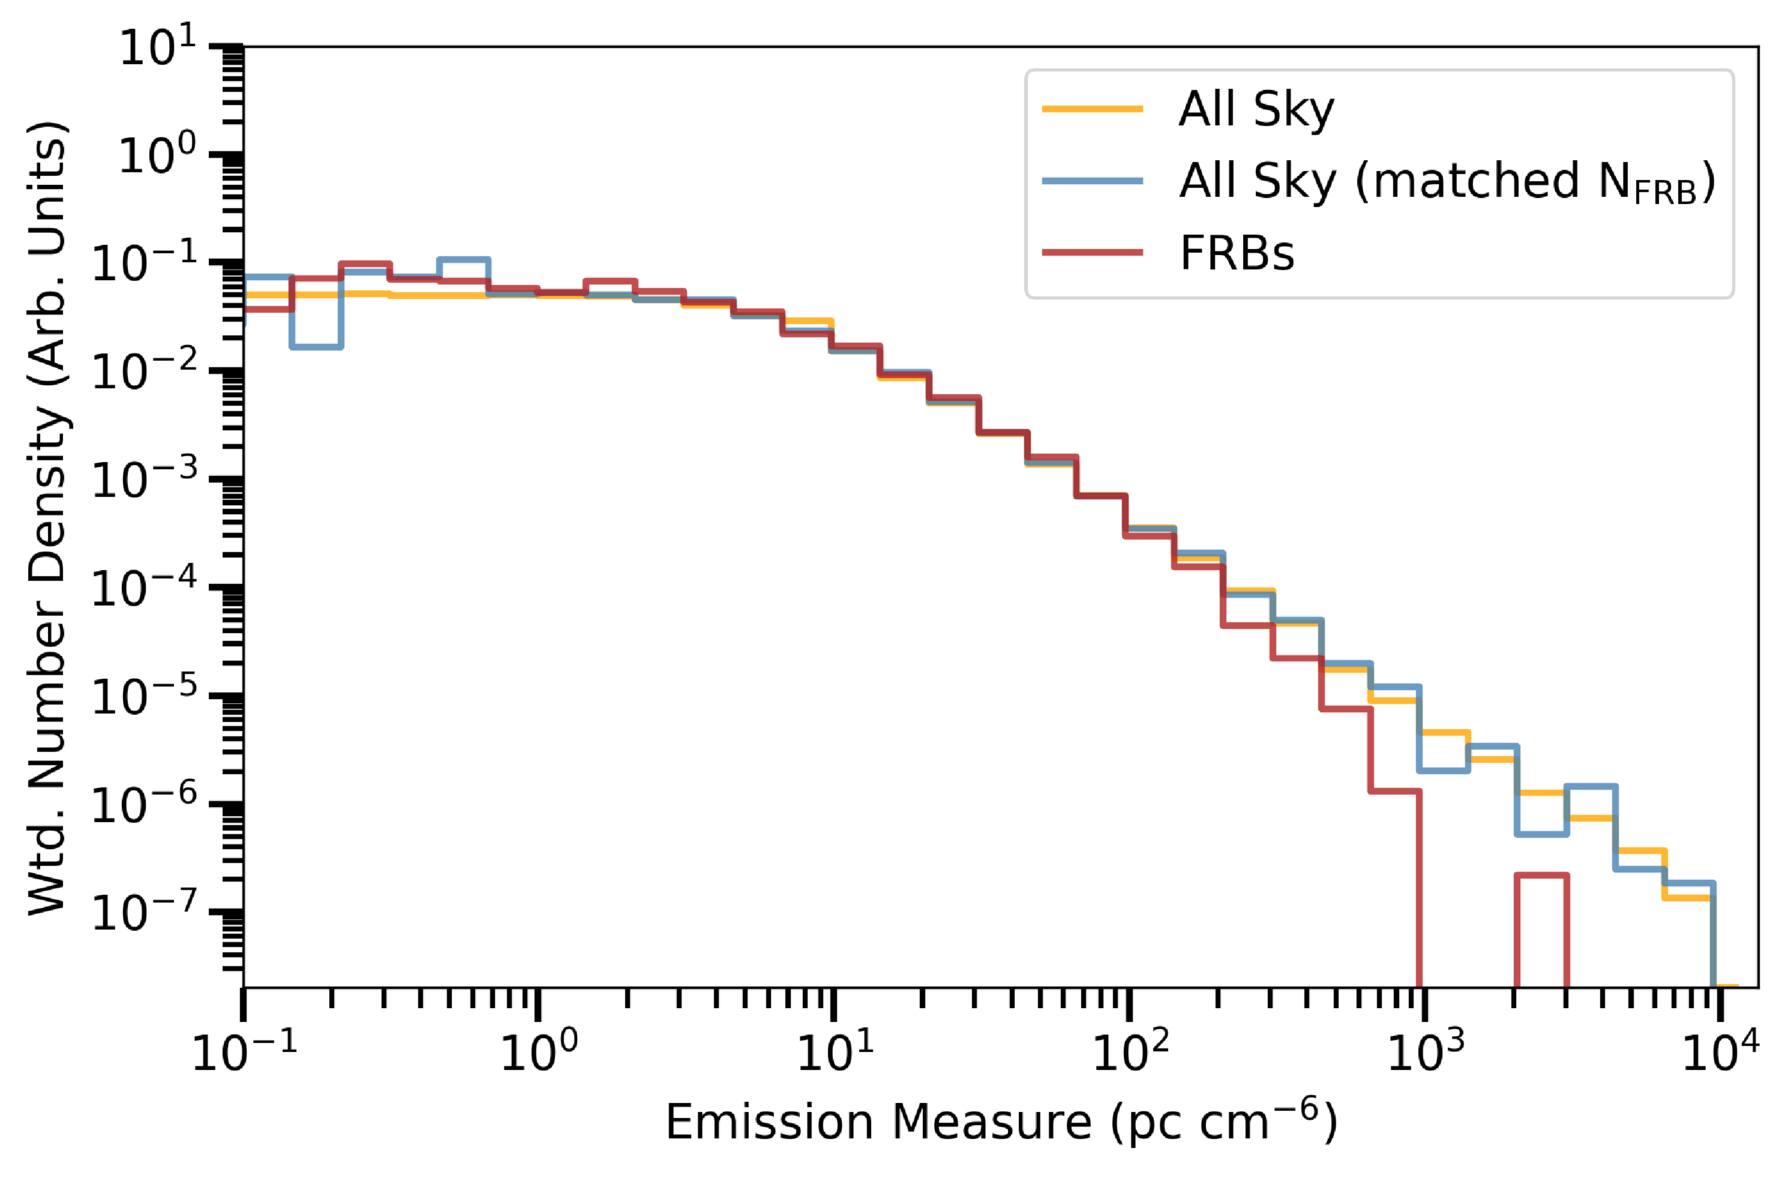
Figure 6. Normalized, exposure-weighted (wtd.) number density histogram of EMs along all CHIME/FRB sight lines (orange) compared to the EM distribution at detected FRB positions (red). The “All Sky (matched NFRB)” (blue) curve corresponds to EMs along the same number of sight lines as the FRB sample, uniformly distributed in the CHIME-visible sky. This control sample is plotted to assess whether the apparent deficit of FRBs along high-EM sight lines arises from small number statistics rather than a physical suppression. The y-axis is plotted in arbitrary (arb.) units for ease of comparison between samples.
Download figure:
Standard image High-resolution imageWe can ask what the above EM cutoff of 2900 pc cm−6 corresponds to in terms of τff, DM, and τsc. Similar to the calculations in Section 4.3, τff is negligible (≈0.003) in our band. Using Equation (4) and assuming L = 10 pc (a typical H II region path length; see Section 5.2), we estimate a DM contribution near the cutoff of ≈170 pc cm−3, which is too small to induce appreciable DM smearing. We estimate τsc using the empirical τsc−DM relation from J. Cordes et al. (2016), resulting in a rough lower bound of τsc, 1 GHz ≳ 0.5 ms, or τsc, 600 MHz ≳ 4 ms. We note that use of their relation while assuming DM  yields τsc ∝ EM2.25 for DM ≳100 pc cm−3; values of EM above the aforementioned cutoff yield values of τsc that rapidly rise to magnitudes that make FRBs undetectable at CHIME. We also note that pulsars behind H ii regions lie preferentially above the τsc−DM relation and that a future reassessment is therefore warranted (S. K. Ocker et al. 2024). While we caution that the logic mapping EM to τsc is indirect, the above results support the interpretation that FRBs are preferentially scatter-broadened beyond detectability along high-EM sight lines.
5.2. H ii Region Intersections and Scattering Properties
Similar to the treatment for pulsar sight lines intersecting H ii regions by S. K. Ocker et al. (2024), we utilize the Wide-field Infrared Survey Explorer (WISE) V2.4 catalog of H ii regions (L. D. Anderson et al. 2014). The WISE catalog contains over 8400 H ii regions and H ii region candidates, identified using the all-sky WISE satellite data. We match FRBs to WISE H ii regions by computing angular separations in Galactic coordinates and checking whether each FRB falls within twice the angular radius of any H ii region (<2θIR). We adopt this maximum impact parameter of 2θIR following the prescription of S. K. Ocker et al. (2024) to account for potential underestimation of the ionized gas extent by the infrared size, which may miss diffuse outer emission caused by radiation leakage (M. Luisi et al. 2019; J. Dey et al. 2024). In Appendix B, we report the angular separations (η) between H ii regions and intersecting FRB sight-line candidates, in units of θIR. Out of the 3542 FRBs in our sample, 36 are candidate sight lines that pass through the WISE H ii regions. We similarly examined the optical H ii region catalog HH14 (L. G. Hou & J. L. Han 2014) following the method described in S. K. Ocker et al. (2024). We do not include the results in our main analysis owing to the lack of angular radii in HH14; however, the results are consistent with those obtained using WISE.
Among candidate FRB sight lines that intersect H ii regions, as well as those that do not but lie near the Galactic plane (∣b∣ < 10°), only about one-third pass the τsc reliability cutoff described in Section 2.4. This sample of sight lines is not sufficiently large to enable a robust statistical comparison of τsc between these subsets. For completeness, we report the mean and median τsc, 1 GHz values: for intersecting sight lines, the mean is 1.65 ms and the median is 0.63 ms; for nonintersecting near-plane sight lines, the mean is 1.06 ms and the median is 0.51 ms. The intersecting sample exhibits slightly higher values consistent with expectations, but an Anderson−Darling test between the two populations yields a statistic of 1.78 and a p-value of 0.06, indicating no significance. A more robust assessment will require either a larger sample from future CHIME/FRB catalogs or the use of raw baseband data with higher time resolution to permit measurement of shorter scattering timescales. For interested readers, Table 2 in Appendix B lists the FRB sight lines that intersect H ii regions, along with their positions, DMs, τsc, and angular separations in units of θIR. These may be useful for further case studies of scattering in dense Galactic environments. Their dynamic spectra are presented in Figure B1 in Appendix B to illustrate observed pulse morphologies.
For future investigation, we point out two interesting candidates. The FRB 20190912D LOS passes through the Sharpless 171 (S171) H ii region surrounding the Berkeley 59 cluster of young stars. The FRB 20200416A LOS passes through the giant W4 complex enclosing the Heart Nebula, hosting numerous O/B-type stars and the IC 1805 open cluster of young stars. Interestingly, the fitburst-measured τsc for FRB 20200416A is smaller than the maximum predicted by NE2001 for an extragalactic source along this LOS. This could indicate an overestimate by the model, or geometric suppression of scattering if the dominant screen lies at a cosmological distance/closer to the observer. However, we note that NE2001 was not designed to predict scattering with high precision, especially for extragalactic sources and along complex or poorly constrained sight lines. As such, this comparison should be interpreted cautiously.
We also explore the possibility of a correlation or lack thereof between τsc and DM for FRBs. Figure 7 shows a τsc–DM plot for all FRB candidates in Catalog 2 and exhibits an overall trend that confirms previous findings—FRBs are systematically underscattered compared to expectations from the τsc–DM relation from Galactic pulsars (J. Cordes et al. 2016). The discrepancy arises because a large fraction of the FRB DM comes from the intergalactic medium, which contributes minimally to scattering (D. R. Lorimer et al. 2007; D. Thornton et al. 2013). However, this comparison is biased to reflect the statistics of detected events, as we likely miss highly scattered FRBs passing through H ii regions that therefore fall below the CHIME/FRB detection threshold. For example, Catalog 2 FRBs that intersect Galactic H ii regions do not show a strong correlation between DM and τsc in Figure 7 for FRBs—even when considering only the Galactic contribution to DM—despite the expectation that significant δne in H ii regions causes scattering. However, FRB 20210705 as detected by the FAST telescope (see discussion in Section 4.1.4) indeed follows the τsc−DM trend, indicating that its scattering is consistent with being induced by the Cygnus X region. While the statistics currently remain small, this difference raises a cautionary note for population studies: low-scattering, high-DM bursts may be overrepresented in Catalog 2. CHIME/FRB’s selection function for Catalog 1 has been studied by injecting synthetic FRBs (M. Merryfield et al. 2023). This effort confirmed that the CHIME/FRB back end is more sensitive to bursts with smaller broadened pulse widths. An updated injection study for Catalog 2 is currently underway. In order to make conclusions about the cosmological population of FRBs, a follow-up study incorporating the updated selection functions and host models is essential.
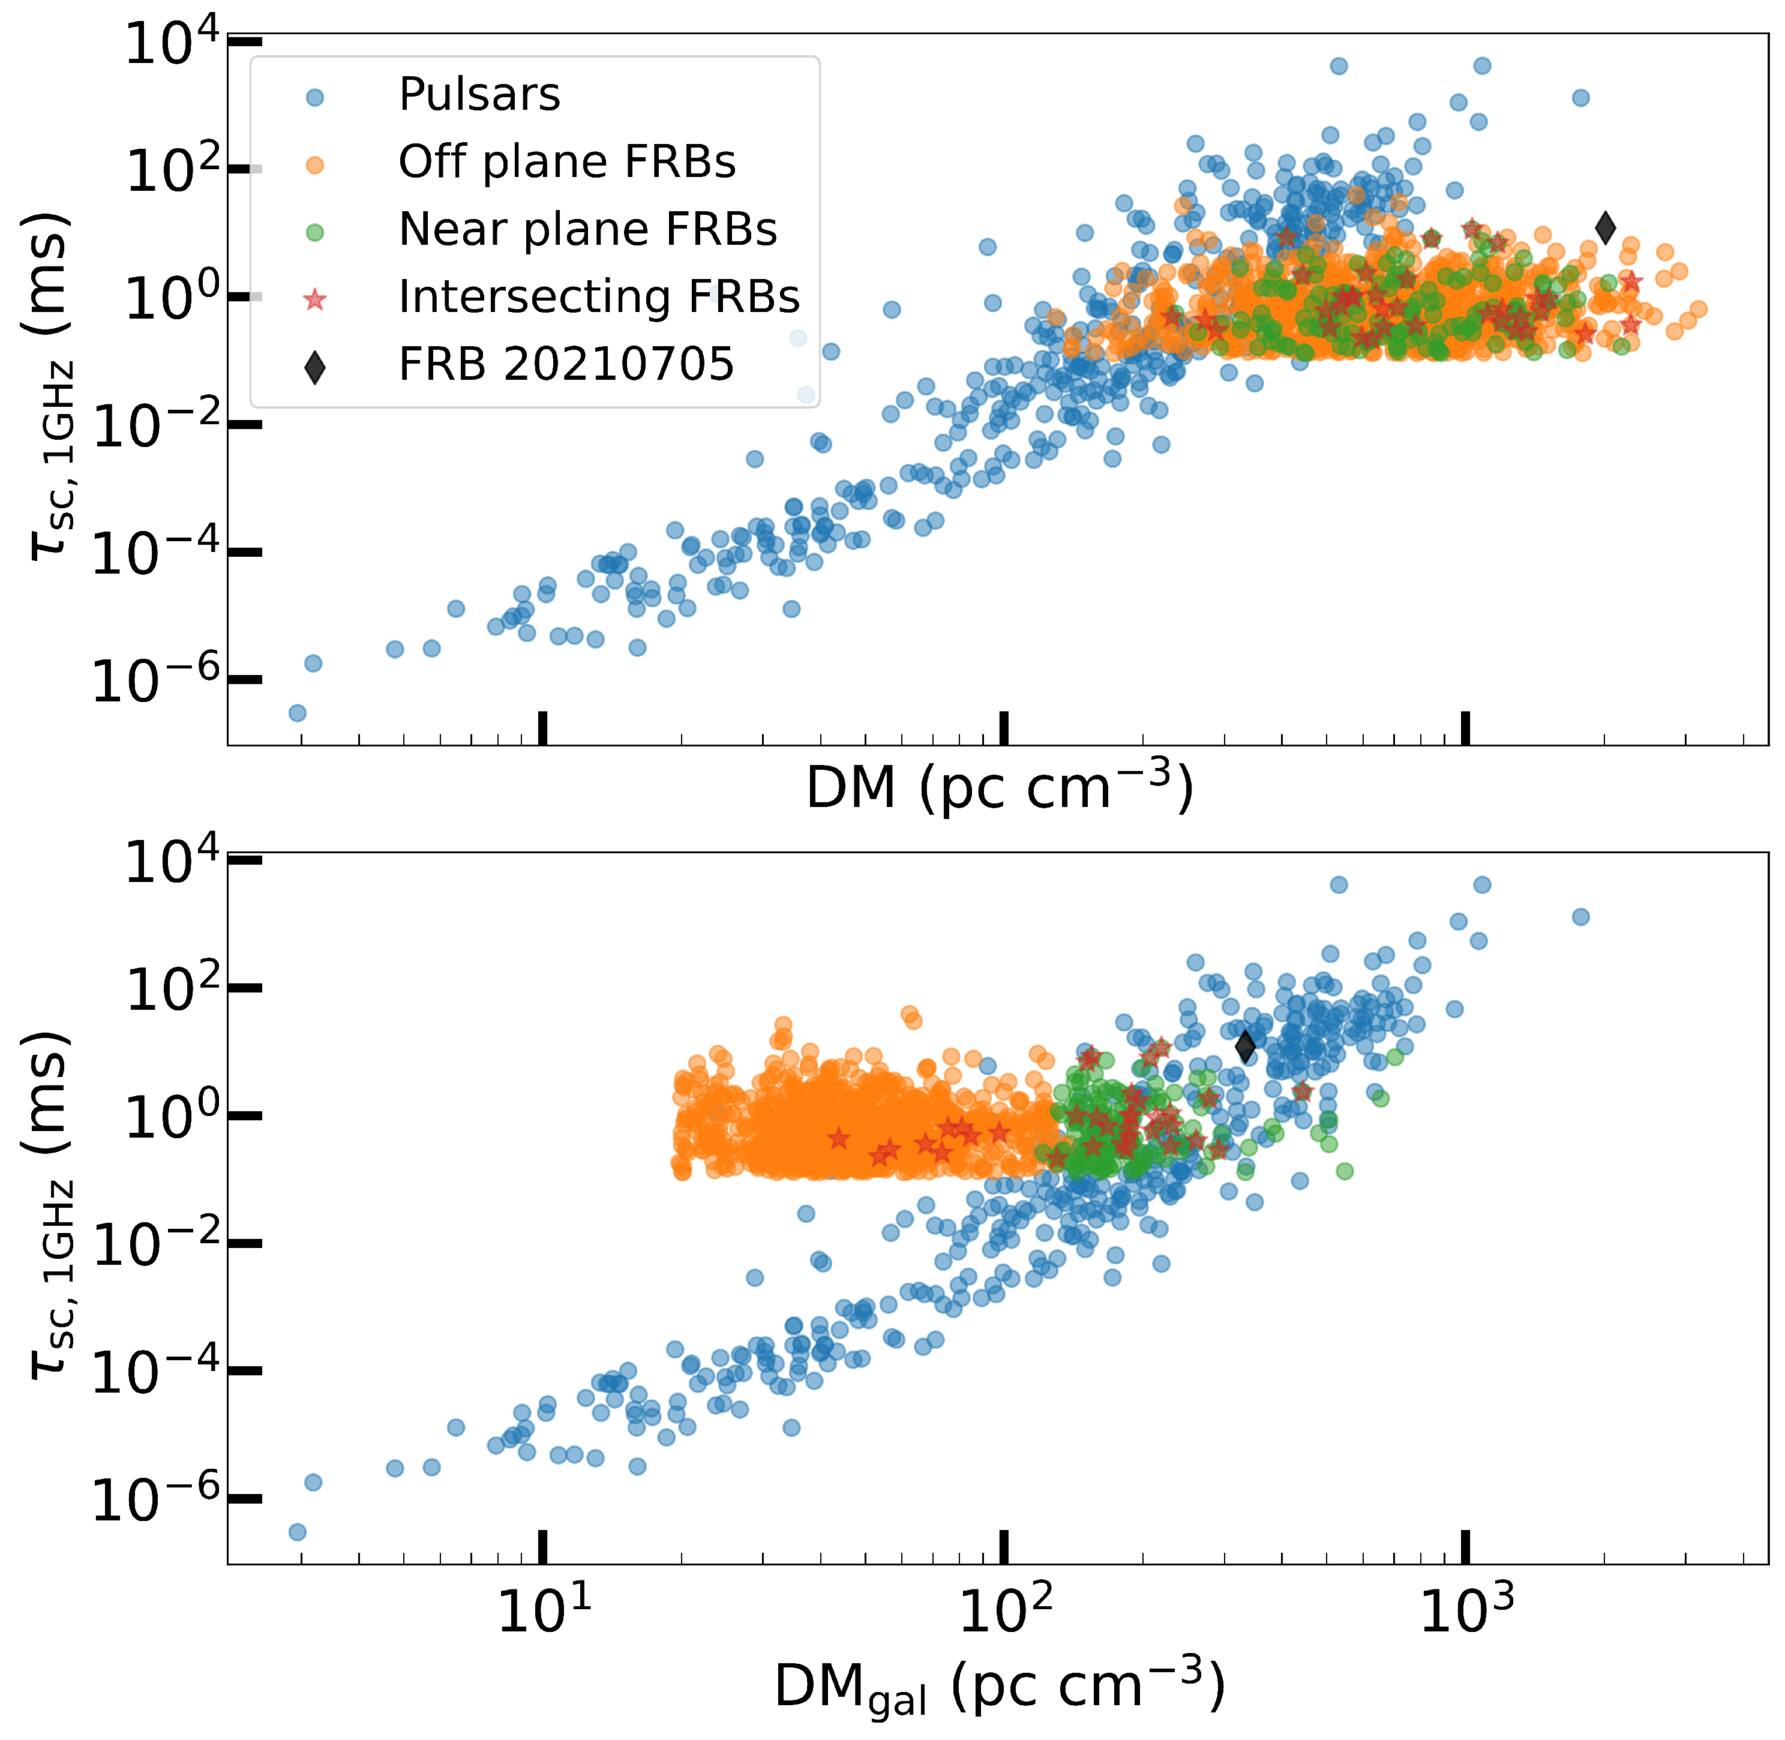
Figure 7. Catalog 2 FRBs plotted alongside pulsars and FRB 20210705 in the τ−DM plane. Top panel: τsc, 1 GHz vs. total DM. Bottom panel: τsc, 1 GHz vs. Galactic DM contribution. In both panels, blue points show Galactic pulsars, green points show FRBs near the Galactic plane (∣b∣ < 10°), and orange points mark those away from the plane. Red stars show FRBs intersecting known H ii regions, and the black diamond marks FRB 20210705.
Download figure:
Standard image High-resolution image5.3. Visibility Fitting of Scattered FRBs as a Complementary Probe of ISM Scattering
As discussed in 4.1.2, a scattered source will also be angularly broadened, where larger time delays correspond to larger deflection angles. Assuming deff ≈ dscr for an extragalactic source, the mapping between delay τ and observed angle θ for each scattered path through a thin screen is (e.g., M. A. Walker et al. 2004)

The CHIME/FRB Outriggers project (CHIME Collaboration et al. 2025) augments CHIME/FRB by providing milliarcsecond-scale localization using VLBI across three strategically placed stations in North America. By enabling precise FRB localization, the Outriggers facilitate host galaxy identification, studies of FRB environments, and their use as cosmological probes. Given CHIME/FRB Outriggers’ target resolution of  mas (CHIME Collaboration et al. 2025), FRBs scattered by τsc, 600 MHz ≳ 10 ms at ∼kiloparsec distances will have an angular extent larger than the Outriggers’ resolution. Many of the bright bursts piercing through H ii regions, or one detected through Cygnus X (with τsc, 600 MHz ≳ 40 ms), would be easily resolved by CHIME/FRB Outriggers. We note that while CHIME/FRB is biased against finding bursts of these scattering times, particularly bright bursts are seen with sufficient scattering for this approach (see, e.g., K. Shin et al. 2024 for a bright burst scattered ≳1 s in the CHIME band).
Given the mapping between τ and θ, the interferometric visibility (V) of scattered FRBs (or pulsars) will show a characteristic shape as a function of V(τ, ν) through a scattering tail (O. Wucknitz 2012, 2014), which allows for a determination of screen distances and orientations. Conversely, for spatially unresolved sources, an upper limit on the angular broadening will place a lower limit on the screen distance. This will allow mapping of Galactic scattering structures to astrophysical sources and will cleanly distinguish between Galactic and extragalactic scattering screens.
Upcoming ultra−wide-band instruments such as the Canadian Hydrogen Observatory and Radio Transient Detector (CHORD; 300–1500 MHz; K. Vanderlinde et al. 2019) and DSA-2000 (0.7–2 GHz; G. Hallinan et al. 2019) will be particularly well suited to studies of scattering, offering improved sensitivity across a broad frequency range.
6. Conclusion
Our analysis shows that FRB detections in CHIME/FRB Catalog 2 exhibit a two-dimensional dependence on Galactic coordinates. The most striking feature is the complete absence of CHIME/FRB detections in a patch of the sky that coincides with the Cygnus X region. The analyses discussed in Sections 3–5 demonstrate that this detection gap, along with other regions of reduced FRB detections within the Galactic plane, corresponds with known H ii regions. Based on the discussion presented in Section 5, we favor the interpretation that turbulence along these LOSs induces large degrees of scatter broadening that totally smear FRBs out of detectability within the CHIME band.
As shown in Section 4, measurements of τsc in CHIME/FRB Catalog 2 and derived τsc from nondetections can be used to gauge the accuracy of existing ne models of the Milky Way. We specifically used the CHIME/FRB Catalog 2 measurements of τsc to argue that the lower limit on scattering in the direction of Cygnus X is τsc,1 GHz ≥ 5.59 ms in order to produce zero detections in the CHIME band. This estimate is inconsistent with the NE2001 prediction for the maximum τsc, and while consistent with the YMW16 prediction, the latter model does not explicitly account for individual H ii regions. Our analysis of FRB τsc measurements therefore demonstrates that FRB measurements can be used to place “background” constraints on inhomogeneous ne models in a manner that complements the “foreground” constraints placed by radio pulsars. This prospect of using FRB τsc measurements as tools to constrain ne models is especially important in an era where cosmological applications of FRBs are often sensitive to knowledge and/or reasonable assumptions of the ne distribution for both the Milky Way and FRB-host galaxies (e.g., J. Zhuge et al. 2025).
Future CHIME/FRB measurements of τsc will increase the surface density of FRB detections at low frequencies. Such an increase will likely yield additional detection gaps associated with Galactic H ii regions that have smaller angular extents. These same datasets will also allow for data-driven constraints on the Galactic electron density models themselves, through all-sky estimates of the maximum τsc as estimated for the Cygnus X region in Section 4.5. Although the nature of FRB classification makes similar constraints on DM more complicated, phenomenological models can be used to gauge the likely maximum values for the contribution of the Milky Way to DM (e.g., A. M. Cook et al. 2023). We therefore expect that future CHIME/FRB catalogs will provide the means to strengthen and expand on the inferences made in our work.
The CHIME/FRB experiment is also recording baseband (voltage) data for the high-significance subset of its catalogs (D. Michilli et al. 2021). Access to baseband data allows for evaluation of polarization profiles (e.g., R. Mckinven et al. 2023a, 2023b, 2025; A. Pandhi et al. 2024), scatter broadening at the submillisecond level (A. P. Curtin et al. 2025; K. R. Sand et al. 2025), and the presence of scintillation down to the Nyquist-limited data resolution (e.g., K. Nimmo et al. 2025). A catalog of such FRB measurements will provide novel avenues for exploring the structure of the WIM , e.g., using FRB scintillation as a tool to complement the analysis of intraday scintillation of blazars coincident with Galactic Hα emission (e.g., J. Y. Koay et al. 2019). These measurements may also be useful for exploring the impact of other Galactic features that interact with the WIM (e.g., the “Fermi bubbles”; M. Su et al. 2010; D. Krishnarao et al. 2020). Furthermore, future CHIME/FRB baseband catalogs will shed light on the role of scintillation in potentially affecting FRB detection rates across Galactic latitudes (J.-P. Macquart & S. Johnston 2015).
The CHIME/FRB experiment is also expanding its capabilities to measure the angular broadening of FRBs through Outriggers. Coupled with the time delay from scattering, this will enable the determination of the geometry of scattering screens. This additional constraint will be crucial for further probing the role of the WIM in modulating FRB visibility. This includes spatial correlations with known plasma structures such as H ii regions, Hα filaments, and detailed comparisons to emission and DMs across the sky. This present work can therefore be viewed as a step toward using FRBs, in both the time and image domains, as “backlights” to explore the WIM of the Milky Way.
Acknowledgments
We are grateful to the anonymous referee for their constructive comments that have improved our work. We thank Loren Anderson, Liam Connor, Duncan Lorimer, Namir Kassim, and Jackson Taylor for thoughtful questions and discussions that informed the analyses presented in this Letter. We acknowledge that CHIME is located on the traditional, ancestral, and unceded territory of the Syilx/Okanagan people. We are grateful to the staff of the Dominion Radio Astrophysical Observatory, which is operated by the National Research Council of Canada. CHIME operations are funded by a grant from the NSERC Alliance Program and by support from McGill University, University of British Columbia, and University of Toronto. CHIME was funded by a grant from the Canada Foundation for Innovation (CFI) 2012 Leading Edge Fund (Project 31170) and by contributions from the provinces of British Columbia, Québec, and Ontario. The CHIME/FRB Project was funded by a grant from the CFI 2015 Innovation Fund (Project 33213), by contributions from the provinces of British Columbia and Québec, and by the Dunlap Institute for Astronomy and Astrophysics at the University of Toronto. Additional support was provided by the Canadian Institute for Advanced Research (CIFAR), the Trottier Space Institute at McGill University, and the University of British Columbia (UBC). This research has made use of the VizieR catalog access tool, CDS, Strasbourg, France (DOI: 10.26093/cds/vizier). The original description of the VizieR service was published in 2000, A&AS 143, 23. E.F. and S.S.P. are supported by the National Science Foundation under grant AST-2407399. K.T.M is supported by a FRQNT Master’s Research Scholarship. A.M.C. acknowledges funding from NSERC as a Banting Postdoctoral Fellow. A.P.C. is a Vanier Canada Graduate Scholar. G.M.E. acknowledges support from NSERC Discovery grant RGPIN-2020-04554. V.M.K. holds the Lorne Trottier Chair in Astrophysics & Cosmology, a Distinguished James McGill Professorship, and receives support from an NSERC Discovery grant (RGPIN 228738-13). C.L. acknowledges support from the Miller Institute for Basic Research at UC Berkeley. K.W.M. holds the Adam J. Burgasser Chair in Astrophysics and is supported by NSF grant 2018490. M.N. is a Fonds de Recherche du Quebec—Nature et Technologies (FRQNT) postdoctoral fellow. K.N. is an MIT Kavli Fellow. A.P. is funded by the NSERC Canada Graduate Scholarships—Doctoral program. A.B.P. is a Banting Fellow, a McGill Space Institute (MSI) Fellow, and a FRQNT postdoctoral fellow. Z.P. is supported by an NWO Veni fellowship (VI.Veni.222.295). M.W.S. acknowledges support from the Trottier Space Institute Fellowship program. K.R.S acknowledges support from the FRQNT doctoral research award. P.S. acknowledges the support of an NSERC Discovery grant (RGPIN-2024-06266). K.S. is supported by the NSF Graduate Research Fellowship Program.
Appendix A: Literature Scattering Values near Cygnus X
Table 1 lists the dispersion measure, angular broadening, and scattering timescale for sources previously observed toward Cygnus X, facilitating a comparison between these literature values and our results.
Table 1. Table with Literature Values of Scattering and Angular Broadening toward Cygnus X, from Background Pulsars, FRBs, Quasars, and Cygnus X-3
| Source | ℓ | b | θ | τ1 GHz | τ600 MHz | DM | References |
|---|---|---|---|---|---|---|---|
| (deg) | (deg) | (mas) | (ms) | (ms) | (pc cm−3) | ||
| PSR J2021+4024g | 78.18 | 2.11 | ⋯ | 8.21E+01 | 6.33E+02 | 678.8 | (1) |
| PSR J2030+3818g | 77.45 | −0.51 | ⋯ | 7.80 | 6.02E+01 | 596.8 | (1) |
| PSR J2030+3944g | 78.60 | 0.30 | ⋯ | 1.14E+02 | 8.80E+02 | 934.8 | (1) |
| PSR J2046+4253g | 83.02 | −0.26 | ⋯ | 1.27E+02 | 9.80E+02 | 622.2 | (1) |
| PSR J2052+4421g | 84.84 | −0.17 | ⋯ | 9.50E+01 | 7.33E+02 | 543.8 | (1) |
| PSR J2108+5001 | 91.20 | 1.47 | ⋯ | 1.91 | 14.7 | 482.3 | (2) |
| FRB 20210705 | 76.03 | 2.71 | ⋯ | 1.19E+01 | 9.20E+01 | 2011.6 | (3) |
| 1923+210 | 55.60 | 2.30 | <16.30 | <1.74E−01 | <1.34 | ⋯ | (4) |
| 1954+513 | 85.30 | 11.80 | <4.30 | <1.21E−02 | <9.34E−02 | ⋯ | (4) |
| 2005+403 | 76.80 | 4.30 | 79.50 | 4.14 | 3.19E+01 | ⋯ | (4) |
| 2013+370 | 74.90 | 1.20 | 46.40 | 1.41 | 1.09E+01 | ⋯ | (4) |
| 2021+317 | 71.40 | −3.10 | 25.70 | 4.32E−01 | 3.34 | ⋯ | (4) |
| 2022+542 | 90.10 | 9.70 | <1.40 | <1.28E−03 | <9.90E−03 | ⋯ | (4) |
| 2023+336 | 73.10 | −2.40 | 67.60 | 2.99 | 2.31E+01 | ⋯ | (4) |
| 2048+313 | 74.60 | −8.00 | 64.70 | 2.74 | 2.11E+01 | ⋯ | (4) |
| 2050+364 | 78.90 | −5.10 | 9.30 | 5.66E−02 | 4.37E−01 | ⋯ | (4) |
| 2113+293 | 76.60 | −13.30 | <1.20 | <9.42E−04 | <7.27E−03 | ⋯ | (4) |
| 3C418 | 88.80 | 6.00 | <8.00 | <4.19E−02 | <3.23E−01 | ⋯ | (5) |
| 1922+155 | 50.62 | −0.03 | <20.00 | <2.62E−01 | <2.02 | ⋯ | (5) |
| 1932+204 | 56.08 | 0.10 | <14.00 | <1.28E−01 | <9.90E−01 | ⋯ | (5) |
| 1934+207 | 56.55 | −0.07 | <9.60 | <6.03E−02 | <4.65E−01 | ⋯ | (5) |
| 1954+282 | 65.31 | −0.21 | <8.30 | <4.51E−02 | <3.48E−01 | ⋯ | (5) |
| 2001+304 | 67.97 | −0.29 | <13.60 | <1.21E−01 | <9.34E−01 | ⋯ | (5) |
| 2008+33D | 71.16 | −0.09 | 130.00 | 1.11E+01 | 8.53E+01 | ⋯ | (5) |
| 2027+383 | 77.50 | −0.17 | <189.00 | <2.34E+01 | <1.80E+02 | ⋯ | (5) |
| Cygnus X-3 | 79.85 | 0.70 | 240 | 3.77E+01 | 2.91E+02 | ⋯ | (6) |
References: (1) W. C. Jing et al. (2025); (2) C. Andrade et al. (2025); (3) D. J. Zhou et al. (2022); (4) A. L. Fey et al. (1989); (5) A. L. Fey et al. (1991); (6) L. A. Molnar et al. (1995).
Download table as: ASCIITypeset image
Appendix B: FRBs Intersecting H ii Regions
B.1. Catalog
Table 2 compiles the observational parameters of CHIME-detected FRB sight lines passing through H II regions.
Table 2. A Full List of FRB Sight Lines Intersecting H II Regions from the WISE (L. D. Anderson et al. 2014) Catalog
| TNS Name | (l, b) | τsc | DM | Name | (l, b) | D | θIR | η |
|---|---|---|---|---|---|---|---|---|
| (deg) | (ms at 1 GHz) | (pc cm−3) | (deg) | (kpc) | (deg) | (θIR) | ||
| FRB 20200306C | 15.6, 28 | ⋯ | 337.2 | ⋯ | 6.4, 22.9 | ⋯ | 5.19 | 1.89 |
| FRB 20230511B | 15.7, 23.1 | ⋯ | 191.6 | ⋯ | 6.4, 22.9 | ⋯ | 5.19 | 1.65 |
| FRB 20181119B | 67.8, 1 | 2.307 ± 0.043 | 608.5 | ⋯ | 68.2, 1.1 | ⋯ | 0.22 | 1.8 |
| FRB 20230426F | 99.4, 1.4 | 0.286 ± 0.017 | 1360.1 | S131; IC 1396 | 99.5, 3.8 | 0.91 ± 0.57 | 1.26 | 1.89 |
| FRB 20210810B | 101.4, 4.4 | 1.101 ± 0.153 | 639.6 | S131; IC 1396 | 99.5, 3.8 | 0.91 ± 0.57 | 1.26 | 1.58 |
| FRB 20210103A | 106.7, −0.2 | 1.881 ± 0.185 | 746.2 | S142 | 107, −0.8 | 3.52 ± 0.47 | 0.37 | 1.83 |
| FRB 20230102D | 107.2, 6 | ⋯ | 983.0 | S141 | 107.9, 5.6 | ⋯ | 0.55 | 1.37 |
| S150 | 108.5, 6.4 | 1.34 ± 0.47 | 0.82 | 1.63 | ||||
| FRB 20230316H | 117.3, 3.9 | ⋯ | 496.1 | S171 | 118.2, 5.4 | ⋯ | 1.39 | 1.32 |
| FRB 20220411A | 117.5, 8 | 0.323 ± 0.059 | 507.4 | S171 | 118.2, 5.4 | ⋯ | 1.39 | 1.95 |
| FRB 20210309F | 118.5, 6.5 | ⋯ | 547 | S171 | 118.2, 5.4 | ⋯ | 1.39 | 0.82 |
| FRB 20200828D | 118.9, 7.7 | 0.96 ± 0.052 | 1516.6 | S171 | 118.2, 5.4 | ⋯ | 1.39 | 1.74 |
| FRB 20190912D | 119.3, 3.9 | ⋯ | 786.2 | S171 | 118.3, 4.9 | 0.84 ± 0.31 | 0.73 | 1.32 |
| S171 | 118.2, 5.4 | ⋯ | 1.39 | 1.35 | ||||
| FRB 20220218A | 120.1, 5.4 | ⋯ | 594.5 | S171 | 118.2, 5.4 | ⋯ | 1.39 | 1.85 |
| FRB 20220330A | 124.9, 0.9 | 0.367 ± 0.023 | 664.9 | ⋯ | 125, 0.9 | ⋯ | 0.12 | 0.95 |
| FRB 20220814A | 127.5, 1 | 0.919 ± 0.104 | 1430.7 | ⋯ | 127.6, 1.1 | ⋯ | 0.2 | 0.59 |
| FRB 20190302A | 133.2, 0.2 | 11.28 ± 0.604 | 1033.8 | S190; W3 | 133.5, 0.8 | ⋯ | 0.46 | 1.31 |
| FRB 20200416A | 134.8, 1.2 | 0.702 ± 0.035 | 538.6 | W4; S190 | 135.8, 0.9 | ⋯ | 0.69 | 0.6 |
| W4; S190 | 135, 0.7 | 3.31 ± 0.35 | 0.87 | 1.46 | ||||
| FRB 20200708A | 138.2, −1.1 | 7.998 ± 0.667 | 842.5 | ⋯ | 139.7, −1.2 | ⋯ | 1.52 | 1.99 |
| FRB 20191209B | 138.9, 2.9 | ⋯ | 910.7 | ⋯ | 139.6, 2.5 | 3.81 ± 0.34 | 0.38 | 1.05 |
| FRB 20221129E | 140.8, 2.7 | 1.709 ± 0.372 | 2293.1 | ⋯ | 140.8, 3.1 | ⋯ | 0.21 | 1.9 |
| FRB 20210207E | 142.6, 2 | ⋯ | 479 | ⋯ | 142.2, 2 | ⋯ | 0.43 | 1.08 |
| FRB 20211001B | 143.5, −1 | ⋯ | 378.7 | S203 | 143.6, −1.5 | 3.39 ± 0.25 | 0.36 | 1.57 |
| FRB 20230709B | 146.6, 4.2 | ⋯ | 514.9 | ⋯ | 146.1, 3.1 | ⋯ | 0.69 | 1.75 |
| FRB 20200717B | 150.7, 2.9 | ⋯ | 295.2 | S207 | 151.2, 2.5 | ⋯ | 0.46 | 1.46 |
| FRB 20230418E | 152.3, 2.6 | 0.592 ± 0.051 | 497.5 | S210 | 152.7, 2.9 | 1.67 ± 0.34 | 0.31 | 1.65 |
| FRB 20200112E | 156.1, −0.6 | ⋯ | 913.7 | ⋯ | 155.4, −0.3 | ⋯ | 0.53 | 1.49 |
| FRB 20211231B | 158.6, −11.9 | ⋯ | 905.7 | California Nebula; S220 | 160, −12.7 | 0.77 ± 0.31 | 1.58 | 1.12 |
| FRB 20211120B | 159,−18.7 | ⋯ | 359.1 | ⋯ | 159.9, −18.6 | 0.24 ± 0.02 | 0.78 | 0.96 |
| FRB 20221012E | 159.1, −15.1 | 0.457 ± 0.08 | 1118.3 | California Nebula; S220 | 160, −12.7 | 0.77 ± 0.31 | 1.58 | 1.57 |
| FRB 20201017C | 159.7,−11.3 | 0.659 ± 0.048 | 731.9 | California Nebula; S220 | 160, −12.7 | 0.77 ± 0.31 | 1.58 | 0.91 |
| FRB 20200323G | 160.6, −9.7 | 0.212 ± 0.05 | 627.9 | California Nebula; S220 | 160, −12.7 | 0.77 ± 0.31 | 1.58 | 0.95 |
| FRB 20190902B | 173.9, 2.8 | ⋯ | 758.2 | S235 | 173.5, 3.2 | ⋯ | 0.38 | 1.54 |
| FRB 20190103B | 191.3, 1.1 | 1.008 ± 0.121 | 540.7 | ⋯ | 192.3, 0.8 | ⋯ | 0.6 | 1.78 |
| FRB 20230905D | 196.8, −0.5 | 2.163 ± 0.006 | 443.7 | S268 | 196.8, −2.4 | ⋯ | 1.06 | 1.84 |
| FRB 20191014B | 196.9,−12.1 | ⋯ | 278.2 | S264; lambda Ori | 195.3, −12.1 | ⋯ | 0.84 | 1.73 |
| FRB 20211204B | 217.2, 1.8 | ⋯ | 425.9 | ⋯ | 216.7, 1.1 | ⋯ | 0.64 | 1.28 |
Download table as: ASCIITypeset image
B.2. Waterfall Plots
Figure B1 presents the dynamic spectra for FRBs with sight lines intersecting Galactic H II regions to demonstrate the observed pulse morphologies.
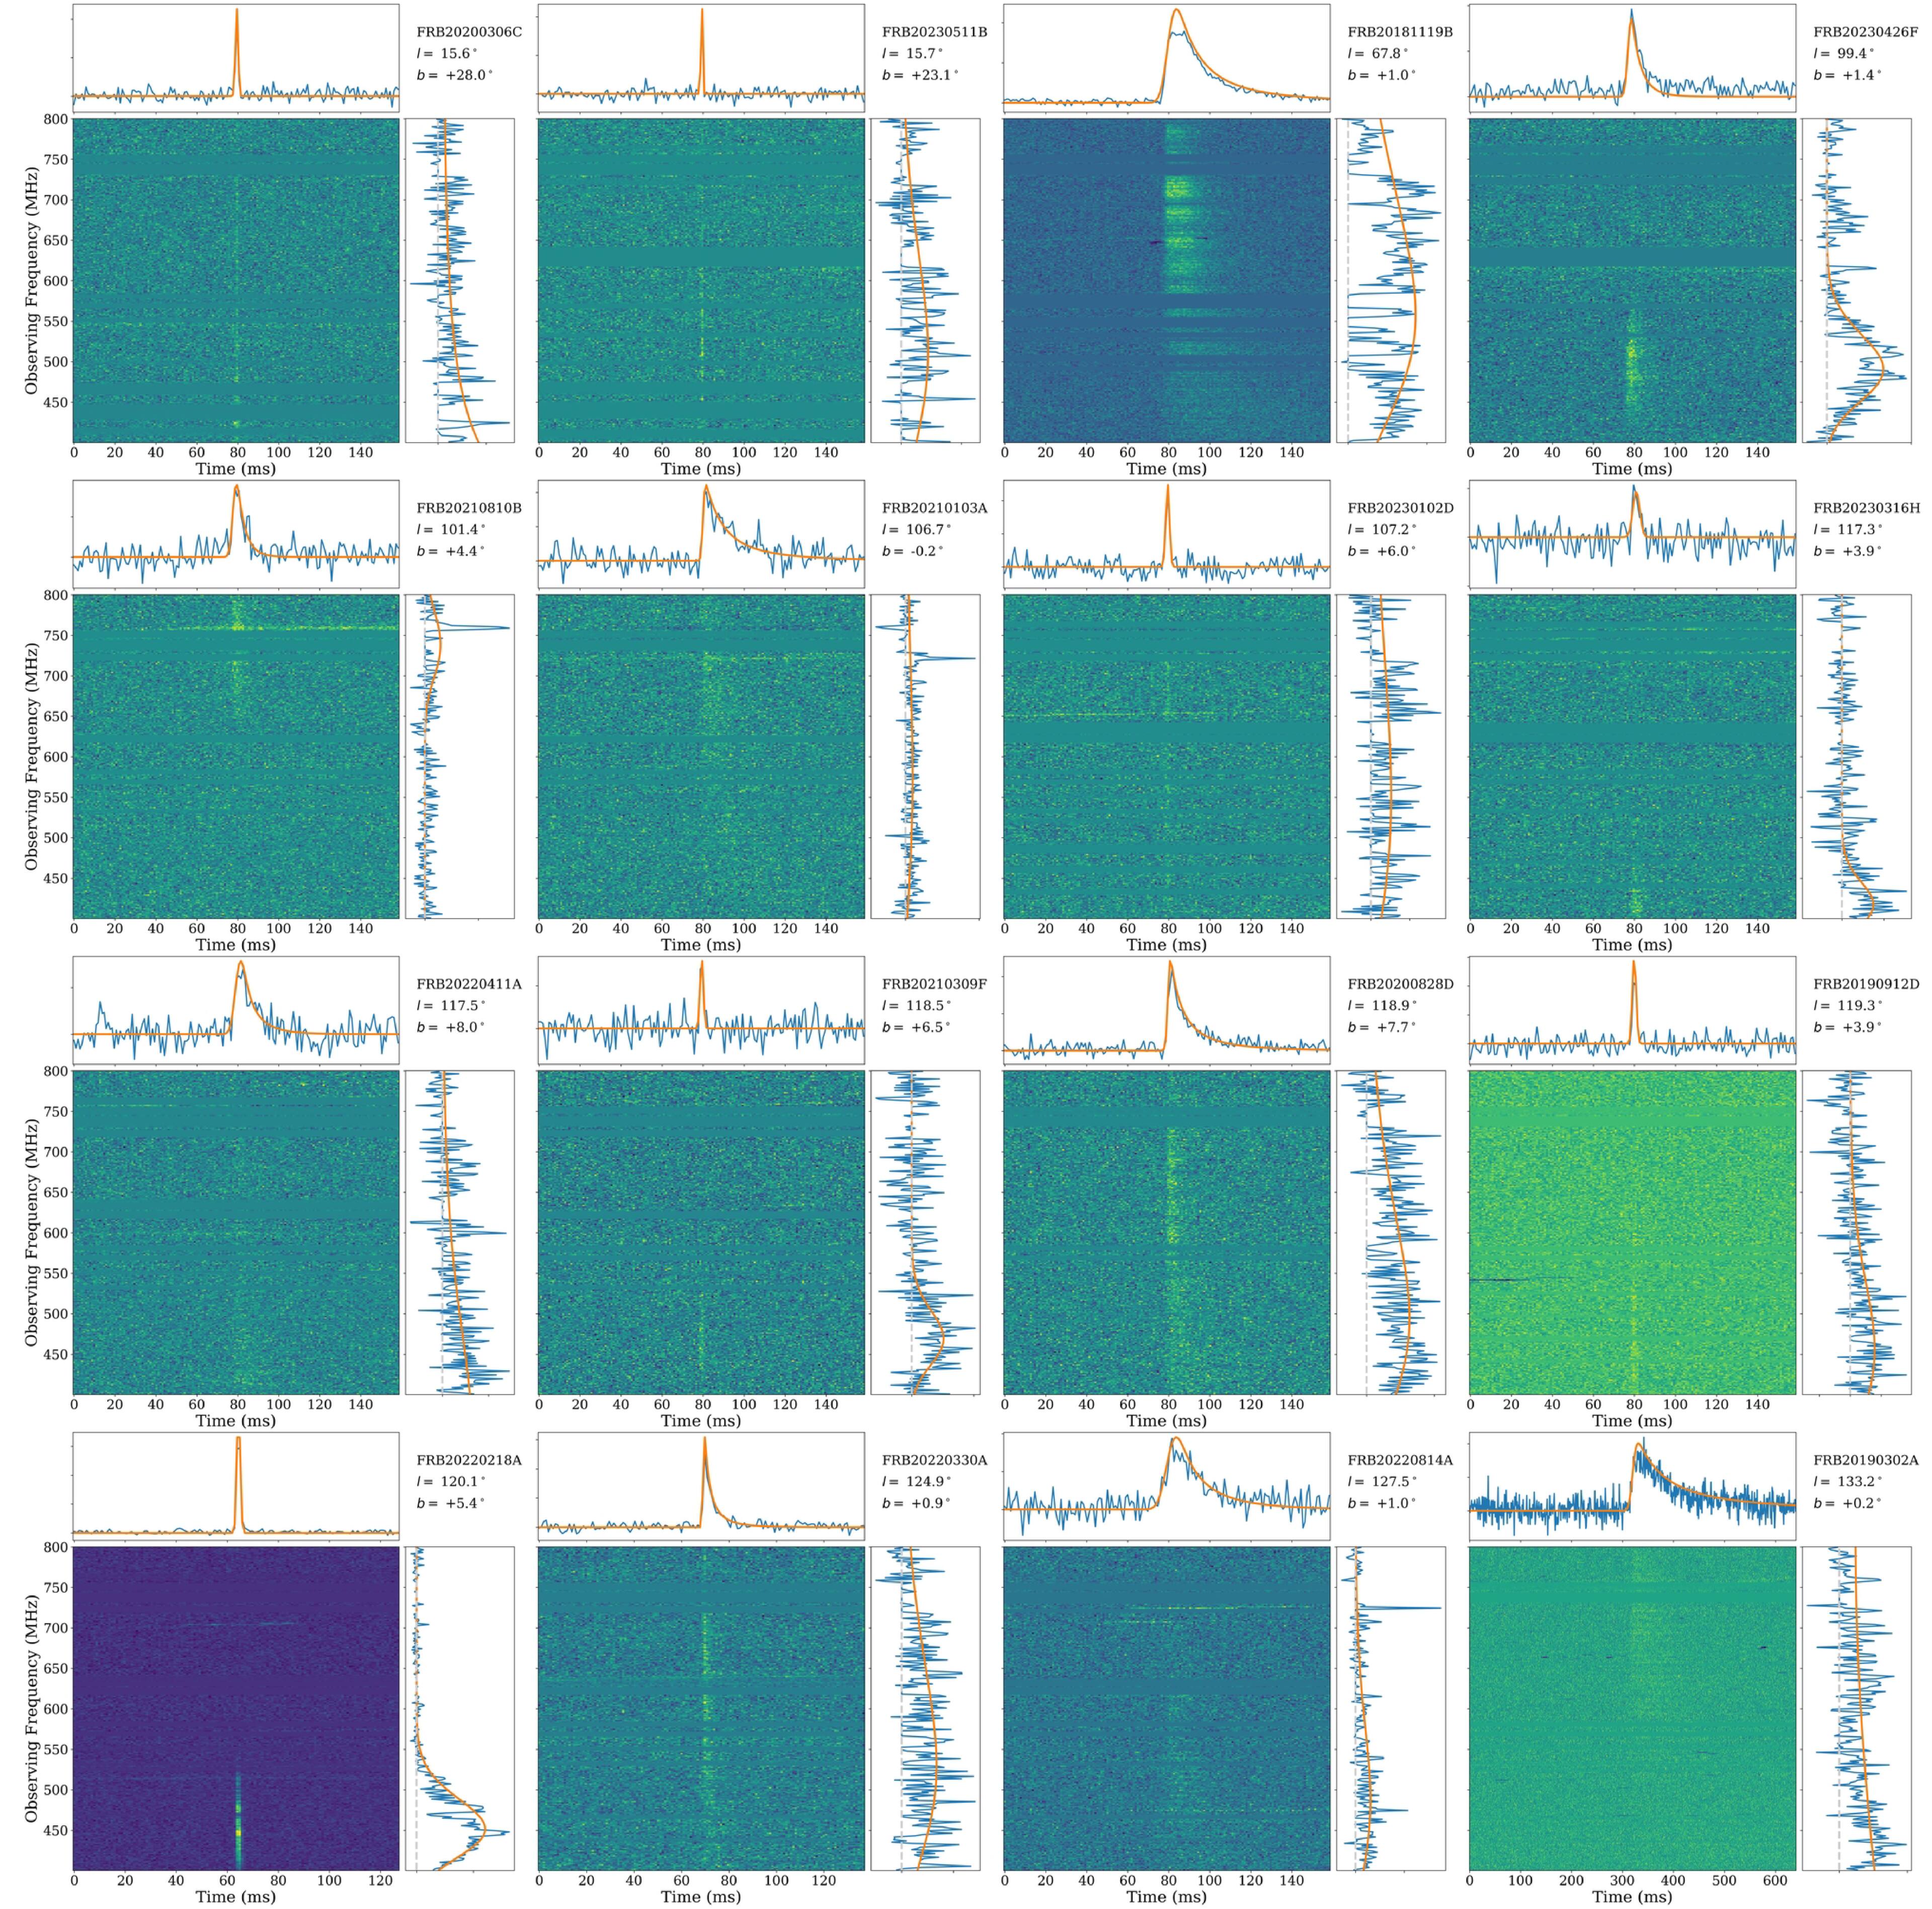
Download figure:
Standard image High-resolution image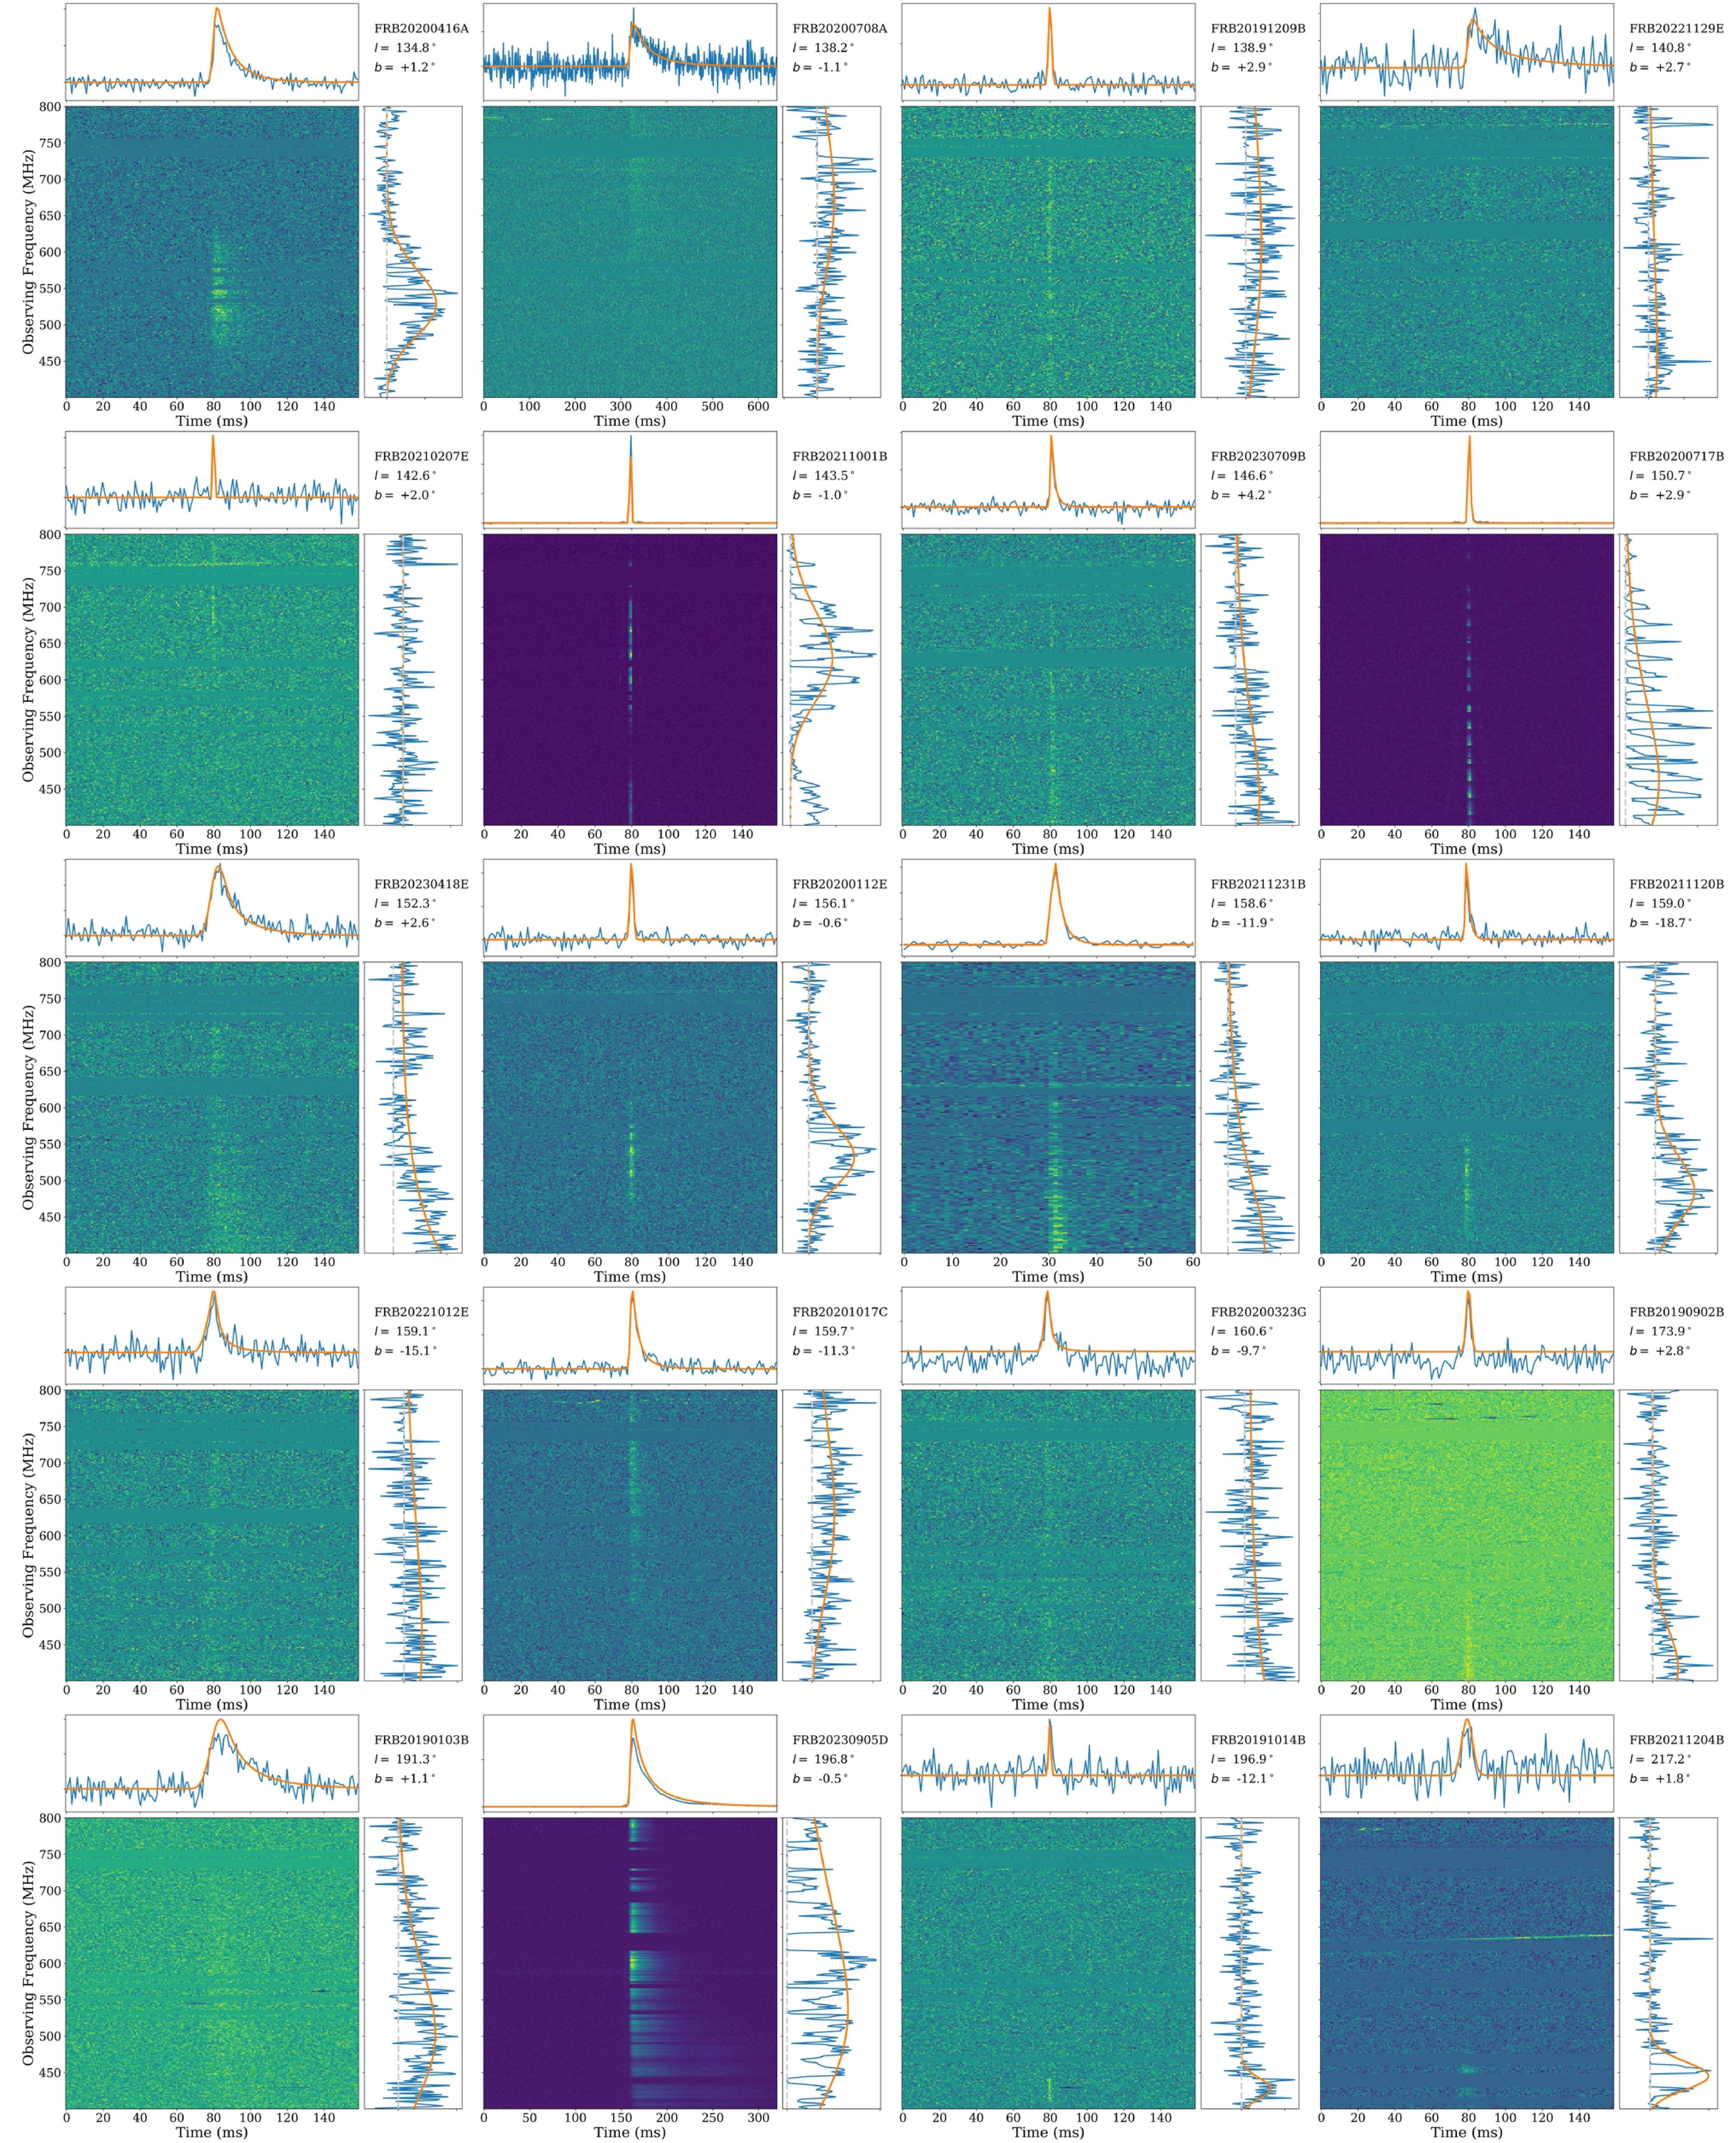
Figure B1. Observed dynamic spectra (colorized maps), time-averaged spectra (right panels), and band-averaged timeseries (upper panels) for CHIME/FRB detections that intersect known H II regions as described in Section 5.2. The orange lines in the one-dimensional panels represent the best-fit shapes and spectral energy distributions determined by fitburst.
Download figure:
Standard image High-resolution imageAppendix C: Reduced Exposure
During part of the observing duration, there was reduced exposure between declinations ∼27° and ∼34° owing to a period of computational downtime as shown in Figure C1. A dip in exposure is present in the area enclosed by the gray square.
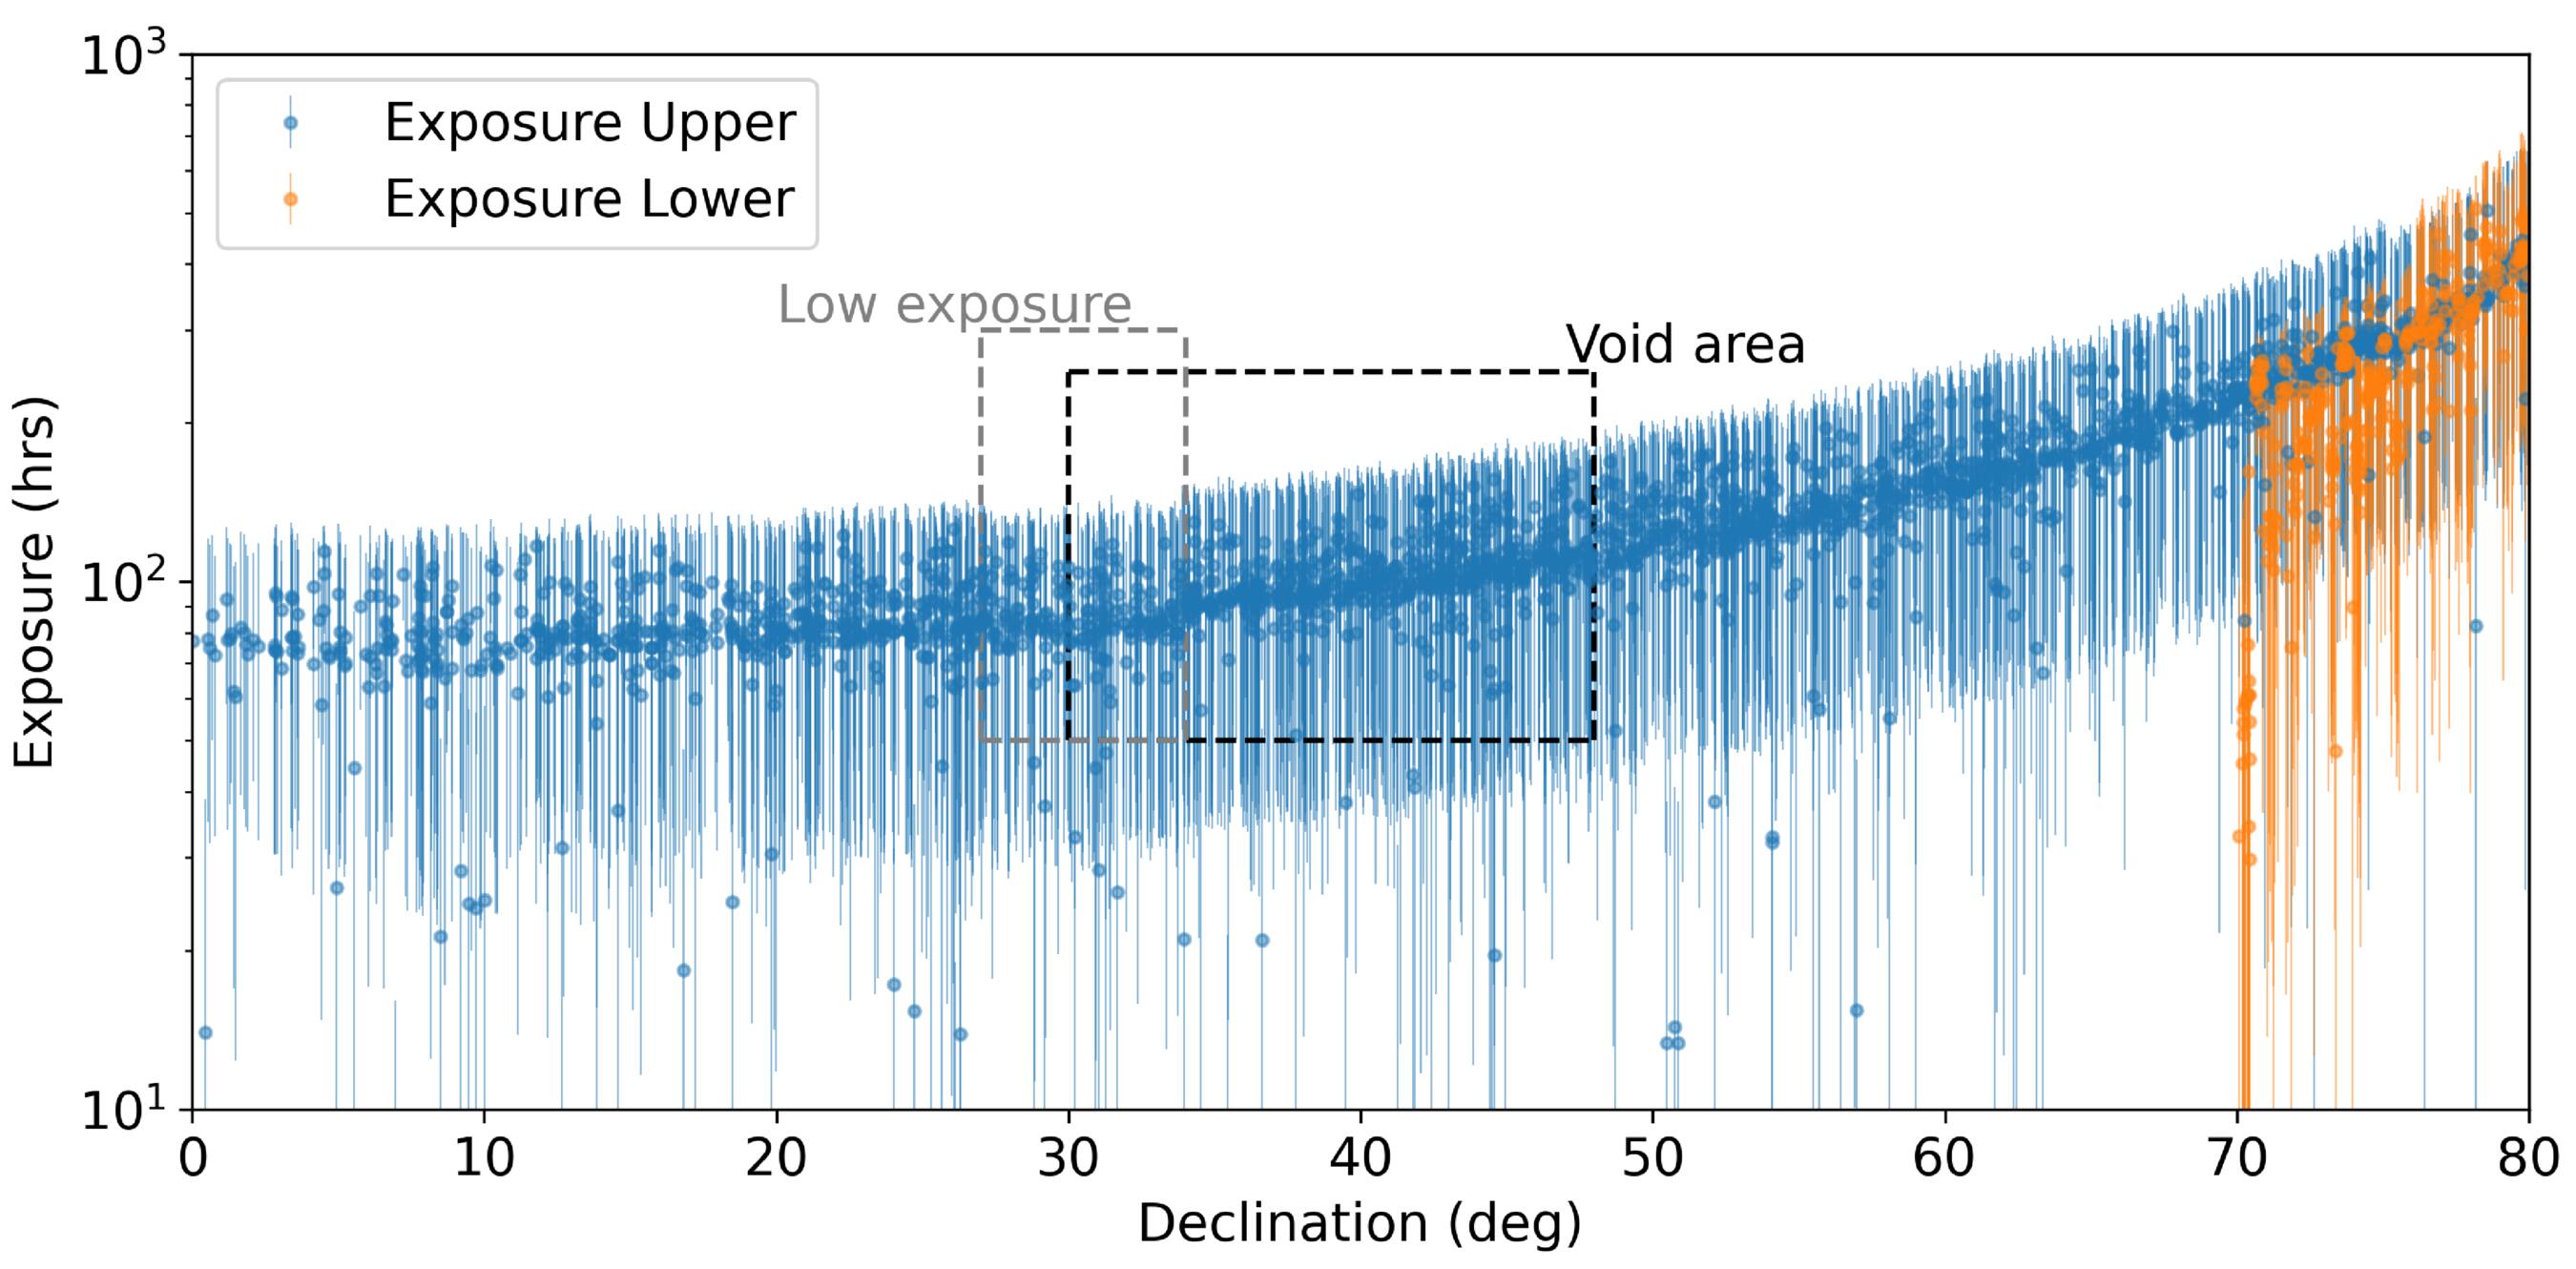
Figure C1. Exposure time (in hours) as a function of declination for both upper and lower transit beams. The low-exposure region corresponding to a period of computational downtime is indicated by a gray square, and the detection gap area is highlighted by a black square.
Download figure:
Standard image High-resolution imageFootnotes
- 20
For example, the YMW16 model does not incorporate external information available on the Cygnus X complex.