Abstract
In 2021 July, PKS 1510−089 exhibited a significant flux drop in the high-energy γ-ray (by a factor 10) and optical (by a factor 5) bands and remained in this low state throughout 2022. Similarly, the optical polarization in the source vanished, resulting in the optical spectrum being fully explained through the steady flux of the accretion disk and the broad-line region. Unlike the aforementioned bands, the very-high-energy γ-ray and X-ray fluxes did not exhibit a significant flux drop from year to year. This suggests that the steady-state very-high-energy γ-ray and X-ray fluxes originate from a different emission region than the vanished parts of the high-energy γ-ray and optical jet fluxes. The latter component has disappeared through either a swing of the jet away from the line of sight or a significant drop in the photon production efficiency of the jet close to the black hole. Either change could become visible in high-resolution radio images.
Original content from this work may be used under the terms of the Creative Commons Attribution 4.0 licence. Any further distribution of this work must maintain attribution to the author(s) and the title of the work, journal citation and DOI.
1. Introduction
As the relativistic jets of blazars are almost aligned with the line of sight, the emission region producing most of the jet’s radiation can be studied in great detail owing to the Doppler beaming of the radiation. The observed variability implies a compact emission region leading to the one-zone model (e.g., Böttcher 2019). In the leptonic version of this model, a single electron distribution is responsible for the multiwavelength (MWL) emission through synchrotron emission and inverse-Compton (IC) scattering of ambient photon fields, such as synchrotron, accretion disk (AD), broad-line region (BLR), or dusty torus (DT) photons. In some extensions of the model, relativistic protons may also influence the production of γ-rays (for more details on the radiation processes, see, e.g., Boettcher et al. 2012; Cerruti 2020).
PKS 1510−089 is a flat-spectrum radio quasar (FSRQ) at redshift z = 0.361 (Burbidge & Kinman 1966). It is one of the few FSRQs detected at very-high-energy (VHE, E > 100 GeV) γ-rays 41 (H.E.S.S. Collaboration et al. 2013). FSRQs are blazars with bright optical emission lines implying the presence of a strong BLR. Hence, the VHE emission zone must be located at the edge of or beyond the BLR in order to avoid the strong absorption of VHE photons. In turn, models were developed that explained the spectral energy distribution (SED) of PKS 1510−089 either through the necessity of multiple target photon fields for the IC process (e.g., Barnacka et al. 2014) or through two spatially separate emission zones (Nalewajko et al. 2012; Prince et al. 2019) with a primary emission zone within the BLR and a secondary emission zone several parsec from the black hole within the DT. PKS 1510−089 is known for its complex MWL behavior (e.g., Brown 2013; Saito et al. 2015; Zacharias et al. 2019) without clear correlation patterns between energy bands. One of the most spectacular flares was the VHE flare in 2016 (H.E.S.S. Collaboration et al. 2021) with only moderate counterparts in the high-energy (HE; E > 100 MeV) γ-ray and optical bands.
However, unlike all other FSRQs detected at VHE γ-rays, PKS 1510−089 also emits VHE photons in times of quiescence. MAGIC Collaboration et al. 2018 integrated their data taken during times without any MWL flaring activity. Their VHE spectrum is a near-perfect continuation of the HE spectrum allowing for the application of the one-zone model in both a near-zone and a far-zone scenario. In the near-zone scenario, the emission region is located close to the edge of the BLR about 0.1 pc from the black hole, while the far-zone emission region is located at about 1 pc from the black hole within the DT. Similarly, Meyer et al. (2019) independently derived an HE γ-ray low-state spectrum of PKS 1510−089, which they coupled with radio and X-ray observations of the extended kiloparsec-scale jet explaining the SED in terms of an IC model scattering the cosmic microwave background (CMB).
In this paper, a sudden change in the appearance of PKS 1510−089 is reported. While flares had become less and less frequent since about 2017, 42 in 2021 July, the source suddenly and abruptly dropped in HE and optical flux as seen in observations with the Fermi Large Area Telescope (hereafter Fermi-LAT) and ATOM, respectively. Similarly, the optical polarization in PKS 1510−089 measured with SALT vanished. Meanwhile, the VHE and X-ray fluxes observed with H.E.S.S. and the Neil Gehrels Swift observatory (hereafter Swift), respectively, remained almost steady.
2. Data Analysis
2.1. Very-high-energy γ-Rays
The five telescopes of the H.E.S.S. array recording VHE γ-rays are located in the Khomas Highland in Namibia at an altitude of about 1800 m. Four telescopes (CT1–4) with 106 m2 mirror area each, are laid out in a square of 120 m side length giving an optimal energy threshold of ∼100 GeV. A fifth telescope (CT5) with 600 m2 mirror area is located in the center of the square. In this study, the data recorded with CT 1–4 are used.
For the observations in 2021 (MJD 59311-59382) and 2022 (MJD 59672-59794), standard quality selection (Aharonian et al. 2006) results in acceptance corrected observation times of 50.9 hr in 2021 and 36.5 hr in 2022, respectively. The data sets have been analyzed with the model analysis chain (de Naurois & Rolland 2009) using very loose cuts. These cuts provide the lowest possible energy threshold with 129 and 106 GeV in 2021 and 2022, respectively. The results have been cross-checked and verified using the independent reconstruction and analysis chain ImPACT (Parsons & Hinton 2014) providing consistent results. PKS 1510−089 is detected with a significance of 13.5σ in 2021, and with 10.3σ in 2022.
In order to derive the light curves and photon spectra, instrument response functions were created using Run Wise Simulations (Holler et al. 2020), which accurately reproduce the atmospheric and instrumental conditions for each observation. There is no significant variability in the period-wise light curve [see Figure 1(a)].
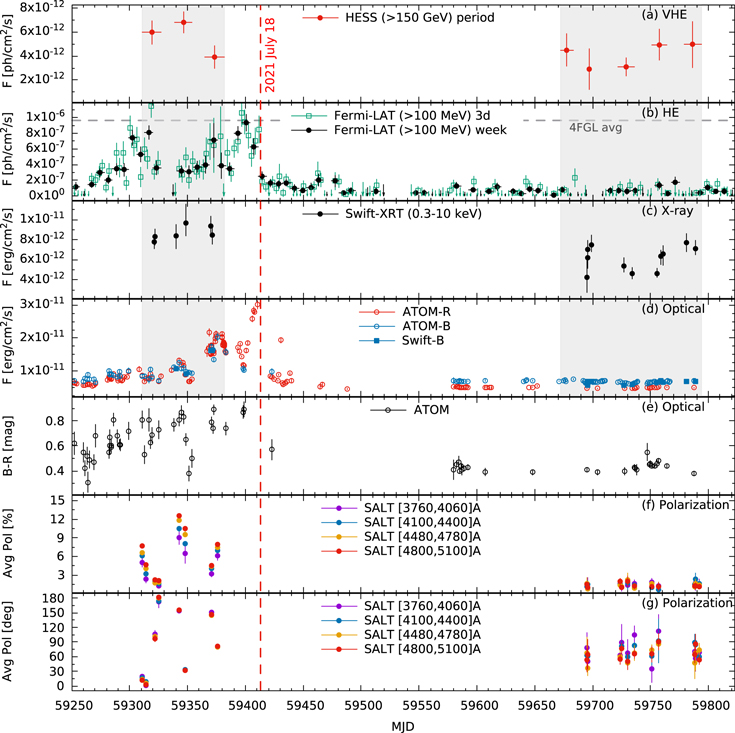
Figure 1. MWL light curves of PKS 1510−089 in 2021 and 2022. (a) Period-wise VHE γ-ray light curve from H.E.S.S. integrated above an energy threshold of 150 GeV showing statistical errors only. (b) HE γ-ray light curve from Fermi-LAT integrated above an energy threshold of 100 MeV in 3 days (green open squares) and 7 days (black filled circles) bins. Arrows display upper limits. The gray dashed line marks the average flux of the 4FGL-DR3 catalog. (c) X-ray light curve from Swift-XRT integrated between 0.3 and 10 keV for each observation. (d) Optical light curve from ATOM and Swift-UVOT in BR filters for individual observations. (e) Optical BR color from ATOM. (f) Average polarization degree and (g) average polarization angle from SALT in optical bands as indicated for each observation. The vertical red dashed line marks 2021 July 18 (MJD 59413). The gray shaded regions mark the time frames for which the average SEDs have been derived.
Download figure:
Standard image High-resolution imageIn both years, the spectra are consistent with power laws of the form

where N is the normalization at decorrelation energy E0, and Γ is the spectral index. The parameters for 2021 are  ph cm−2s−1TeV−1, E0 = 256 GeV, and Γ = 3.4 ± 0.1stat ± 0.4sys. In 2022, the spectral parameters are
  ph cm−2s−1TeV−1, E0 = 296 GeV, and Γ = 3.0 ± 0.1stat ± 0.4sys. The main systematic error is the uncertainty of 10% on the energy scale.
The spectra are shown in Figure 2 (top) along with spectra from the detection (H.E.S.S. Collaboration et al. 2013) and the low-state spectrum of MAGIC Collaboration et al. (2018). The latter is compatible with both spectra of 2021 and 2022, while the initial detection spectrum agrees with the new ones at the highest energies.
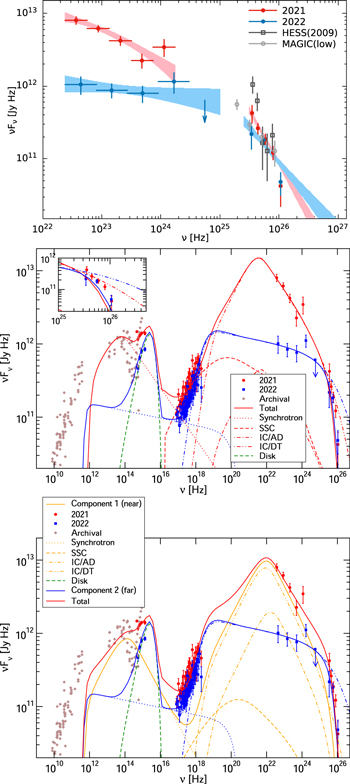
Figure 2. Top: observed HE and VHE γ-ray spectrum for the 2021 (red) and 2022 (blue) data sets showing statistical errors only. The dark gray open squares are from H.E.S.S. Collaboration et al. (2013), while the light gray open circles mark the spectrum from MAGIC Collaboration et al. (2018). Middle: leptonic single-zone model fits to the SED of PKS 1510−089 in 2021 (MJD 59311-59382, red) and 2022 (MJD 59672-59794, blue). The inset at the top left shows a zoom-in to the VHE γ-ray spectrum, illustrating the difficulty in finding a satisfactory model fit. Bottom: leptonic two-zone model fits to the SED of PKS 1510−089 in 2021 (MJD 59311-59382, red) and 2022 (MJD 59672-59794, blue). In the middle and bottom panels, extinction corrections are applied to optical and X-ray fluxes but not to the γ-ray data, while the total model lines account for the EBL absorption. Gray points mark archival data taken from the NED (http://ned.ipac.caltech.edu/) considered as upper limits for the modeling.
Download figure:
Standard image High-resolution image2.2. High-energy γ-Rays
Fermi-LAT monitors the HE γ-ray sky every 3 hr in the energy range from 20 MeV to beyond 300 GeV (Atwood et al. 2009). The analysis was performed with the FermiTools 43 version 2.2.0 software package employing the P8R3_SOURCE_V3 44 instrument response functions and the gll_iem_v07 and iso_P8R3_SOURCE_V3_v1 models 45 for the Galactic and isotropic diffuse emissions (Acero et al. 2016), respectively. A binned analysis of the SOURCE class events between energies of 100 MeV and 500 GeV was performed for a region of interest (ROI) with radius 10◦ centered at the nominal position of PKS 1510−089. In order to reduce contamination from the Earth limb, a zenith angle cut of 90◦ was applied. The sources within a region of radius 15◦ around PKS 1510−089 listed in the 4FGL-DR3 catalog (Abdollahi et al. 2020; Ajello et al. 2020) have been accounted for in the likelihood analysis.
The likelihood fitting procedure is iterative (for more details, see Lenain 2018, Section 3.1). First, all parameters from a source are fixed if a hint of emission from that object is detected with a test statistics (TS) 46 of TS < 9 and if the predicted number of photons from that source contributes less than 5% of the total of photon counts within the ROI. Second, only spectral parameters of sources within 3° from PKS 1510−089 are left free to vary. All other source parameters are fixed to their respective 4FGL values, which are also used for all sources included in the model as seed inputs. The normalization of the Galactic and isotropic background templates are left as additional free parameters. Neither the residual nor count maps show any particular hot spots above a significance at the ∼2σ level. Therefore, the best-fit model describes the ROI well.
The best-fit ROI model is then used to derive light curves of PKS 1510−089 in the time range from 2021 January to 2022 September with a binning of 3 and 7 days, respectively. They are shown in Figure 1(b). In the first half of 2021, the light curve was variable within a factor of 3 around its average integral flux of ∼4.3 × 10⁻⁷ ph cm−2s−1 in the [100 MeV; 500 GeV] energy range. This average is below the 4FGL-DR3 catalog [indicated by the gray dashed line in Figure 1(b)]. However, on 2021 July 18 (MJD 59413), the flux decreased significantly to an average value of ∼6 × 10⁻⁸ ph cm−2s−1, which is more than 1 order of magnitude below the 4FGL-DR3 value.
For the spectral analysis, two time ranges have been considered that coincide with the H.E.S.S. observation windows in 2021 (MJD 59311-59382) and 2022 (MJD 59672-59794). In 2021, the differential photon spectrum of PKS 1510−089 is described with a log-parabola function, which improves the spectral fit with respect to a pure power law at a 3.3σ confidence level,

with normalization N = (3.61 ± 0.31stat) × 10−11 ph cm−2s−1MeV−1, pivot energy E0 = 881 MeV fixed at the 4FGL-DR3 value, photon index Γ = 2.42 ± 0.07stat, and curvature β = 0.05 ± 0.04stat. This spectrum is fully compatible with the 4FGL-DR3 catalog except for the normalization. In 2022, the spectrum is compatible with a simple power law 47 with normalization N = (7.36 ± 0.92stat) × 10−12 ph cm−2s−1MeV−1, pivot energy E0 = 881 MeV, and photon index Γ = 2.1 ± 0.1stat. This spectrum is much harder than the typical spectrum of PKS 1510−089, and its normalization is much reduced. The change in flux and shape is clearly visible in Figure 2 (top).
In order to verify that the change in spectral shape coincided with the flux drop, two more power-law spectra have been derived for the time ranges MJD 59397-59411 and MJD 59415-59429 on either side of 2021 July 18 (MJD 59413). The spectral indices are 2.57 ± 0.09stat and 2.1 ± 0.1stat, respectively. These are compatible with the spectral shapes obtained for the longer periods confirming that the spectrum changed at the same time as the flux dropped.
2.3. X-Rays
Swift (Gehrels et al. 2004) is a multifrequency observatory for the X-ray and optical domain. X-ray data in the energy range of 0.3–10 keV collected with the X-ray Telescope (XRT; Burrows et al. 2005) have been analyzed from 2021 and 2022, corresponding to the observation IDs 00030797022-00030797027 and 00031173220-00030797029. They were taken in photon counting mode. The data analysis was performed using the HEASOFT software (version 6.31), while for the recalibration the standard xrtpipeline procedure was used. xspec (Arnaud 1996) was employed for the spectral fitting. All observations have been binned so that each bin contains at least 30 counts, and each individual observation has been fitted with a single power-law model with a Galactic absorption value of NH = 7.13 × 1020 cm−2 (HI4PI Collaboration et al. 2016) set as a frozen parameter.
The XRT light curve is shown in Figure 1(c). The flux is consistent with being constant in 2021. The average flux in 2022 is reduced by less than a factor 2 compared to 2021, even though the flux varies mildly around the average (see Table 6). The average spectral shapes of 2021 and 2022 are very similar (see Figure 2, middle and bottom, and Table 6).
2.4. Optical–UV Data
2.4.1. Photometry
Optical–UV photometry data have been collected with the Ultraviolet/Optical Telescope (UVOT; Roming et al. 2005) on board Swift in six filters—UVW2 (192.8 nm), UVM2 (224.6 nm), UVW1 (260.0 nm), U (346.5 nm), B (439.2 nm), and V (546.8 nm) (Poole et al. 2008)—as well as with the Automatic Telescope for Optical Monitoring (ATOM; a 75 cm aperture instrument located on the H.E.S.S. site, Hauser et al. 2004) with high cadence in B and R filters. For UVOT, the magnitudes and corresponding fluxes have been calculated using uvotsource including all photons from a circular region with radius 5″. In order to determine the background, a circular region with a radius of 10″ located near the source area has been selected. All data points are corrected for dust absorption using the reddening E(B − V) = 0.0853 mag (Schlafly & Finkbeiner 2011) and the ratios of the extinction to reddening, Aλ /E(B − V) from Giommi et al. (2006). The ATOM data were analyzed using the fully automated ATOM Data Reduction and Analysis Software, and their quality has been checked manually. The resulting flux was calculated via differential photometry using five custom-calibrated secondary standard stars in the same field of view. Extinction correction was done as for Swift-UVOT.
The light curves in R and B filters are shown in Figure 1(d). While variability is clearly visible in the 2021 data, the 2022 light curves show no significant variations. The fractional variability in the R and B bands in 2022 is 3% and 2%, respectively. The change in behavior seems to occur near-simultaneously with the flux drop in the HE γ-ray band, but the data is very sparse after 2021 July, which is why a firm conclusion cannot be drawn. Interestingly, the R − B color also shows variability [see Figure 1(e)]. In the high flux states in 2021, the R-band flux is higher than the B-band flux, while it is inverted for the low flux states, which is especially noticeable in 2022. In terms of B − R color, this change happens at B − R ≈ 0.6 mag.
For the spectra shown in Figures 2 and 3, the fluxes in given filters have been averaged within the observation range of H.E.S.S., namely, MJD 59311-59382 for 2021 and MJD 59672-59794 for 2022. While this includes some variability in 2021, it does not, for instance, include the peak in early July. Nonetheless, the high variability in 2021 results in an average of the ATOM data that cannot be properly compared to the Swift-UVOT averages, which were taken on at most six occasions and not necessarily parallel to the ATOM data. Therefore, in Section 3, the R-band average from ATOM is treated as an upper limit for the 2021 data set, while the spectral fitting is done on the V, B, U, and UVM2 bands of Swift-UVOT.
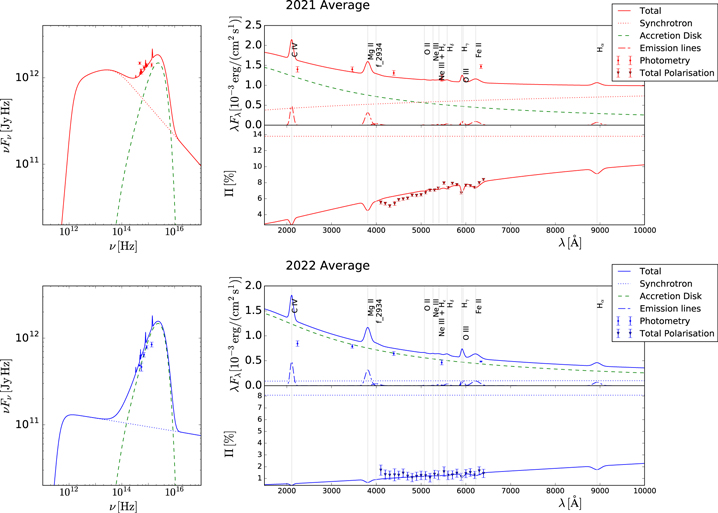
Figure 3. Application of the Schutte et al. (2022) model to the data averaged over 2021 (red) and 2022 (blue) with data points as in Figure 2 (middle and bottom). The first SED bump is shown in the left panels, and the components in the optical–UV regime are shown in the upper right panels with corresponding polarization in the lower right panels. The plotted radiation components are: synchrotron (dotted), AD flux (green dashed), emission lines (double-dashed–dotted), and the total of the components (solid). Individual emission line fluxes are not plotted in the left panels; they are, however, plotted in the upper right panels.
Download figure:
Standard image High-resolution image2.4.2. Spectropolarimetry
Optical spectropolarimetric observations of PKS 1510−089 were taken with the Southern African Large Telescope (SALT; Buckley et al. 2006), using the Robert Stobie Spectrograph (Burgh et al. 2003; Kobulnicky et al. 2003). PKS 1510−089 was observed eight times between 2021 April 6 and 2021 June 10, and eleven times between 2022 April 25 and 2022 July 31. All observations were performed using grating PG0900 at a grating angle of 12875 with a slit width of 1
25 giving a resolving power of R ≈ 800–1200. Observations were performed in linear mode, which takes four observations at 4 wave plate angles. A total exposure time of 1200 s (4 × 300 s) was used for the first eight observations, and 1440 s (4 × 360 s) for the remaining observations. Data reduction was performed using a modified version of the pySALT/polSALT pipeline
48
(Crawford et al. 2010) allowing for the wavelength calibration to be performed with IRAF
49
(see Cooper et al. 2022).
The average degree of polarization was calculated for each observation in four different wavelength bands (see Figure 1(f) and (g)), namely, λ = 3670–4060 Å, λ = 4100–4400 Å, λ = 4480–4780 Å, and λ = 4800–5100 Å, chosen to avoid spectral features. During the 2021 observing period, the source exhibited variable levels of polarization, reaching a maximum of 〈Π〉 = 12.5% ± 1.1% on 2021 May 08 (taken between λ = 4100–6200 Å), and a minimum of 〈Π〉 = 2.2% ± 0.5% on 2021 April 20. During the 2021 semester, the polarization angle varied by ∼ 174° (reaching a maximum of 1789 ± 4
8 on 2021 April 20, and a minimum of 4
7 ± 2
7 on 2021 April 9).
During 2022, the source exhibited little to no variation in the degree of polarization, consistently remaining below 2%. This is consistent with the level of polarization measured for a comparison star. Thus, the observed polarization can be attributed to interstellar effects, rather than any source-intrinsic polarization.
3. Results
The MWL light curves and spectra of PKS 1510−089 are shown in Figures 1 and 2, respectively. They show the aforementioned change in the source: most notably the HE γ-ray flux drop and spectral change, as well as the optical flux and polarization drop. These took place at a seemingly singular event around 2021 July 18 (MJD 59413). Interestingly, the VHE γ-ray and X-ray fluxes and spectra barely changed (within a factor 2), and the VHE γ-ray spectrum is a smooth continuation of the HE γ-ray spectrum in both years. The drop in optical polarization, along with the R − B color change, suggests that the optical–UV spectrum is strongly dominated by the AD and the BLR. In order to explore this further, a joint fit of the low-frequency SED and the optical spectropolarimetry is produced first to constrain the relative contributions of the jet synchrotron emission, the accretion-disk, and emission lines from the BLR as well as the jet emission-region parameters related to synchrotron emission (radiating relativistic electron distribution and magnetic field—see Section 3.1). The resulting parameters are then used in a second step to model the entire broadband SED, including X-rays and γ-rays, constraining additional parameters pertaining to the target photon fields for IC scattering (Section 3.2).
3.1. Modeling the Optical–UV Photometry and Spectropolarimetry
Generally, the degree of polarization of the optical–UV jet synchrotron emission is diluted by the nonpolarized, thermal contributions of the AD and the BLR. The model of Schutte et al. (2022; see also App. A for further details) derives the synchrotron state of a blazar assuming a single emission zone containing an electron distribution
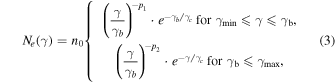
with electron spectral indices p1 and p2 where, in the slow-cooling regime, one expects p2 = p1 + 1. The characteristic Lorentz factors are in the range ![$[{\gamma }_{\min },{\gamma }_{\max }]$](https://content.cld.iop.org/journals/2041-8205/952/2/L38/revision1/apjlace3c0ieqn4.gif) with a break of a broken power-law spectrum at γb
and an exponential cutoff at γc. Synchrotron self-absorption effects are also considered. The model implements a geometrically thin, optically thick AD (Shakura & Sunyaev 1973) around a nonrotating supermassive black hole of mass MBH = 6 × 10⁸
M☉, which is within the range of previously obtained mass estimates,
with a break of a broken power-law spectrum at γb
and an exponential cutoff at γc. Synchrotron self-absorption effects are also considered. The model implements a geometrically thin, optically thick AD (Shakura & Sunyaev 1973) around a nonrotating supermassive black hole of mass MBH = 6 × 10⁸
M☉, which is within the range of previously obtained mass estimates,  and 7 × 10⁸
M⊙, by Rakshit 2020 and Ghisellini et al. 2010, respectively. For an AD accretion rate
and 7 × 10⁸
M⊙, by Rakshit 2020 and Ghisellini et al. 2010, respectively. For an AD accretion rate  , the efficiency of converting potential energy into AD radiation is assumed to be
  (Ghisellini et al. 2010). The different states from 2021 to 2022 can be modeled with an unchanging AD.
The synchrotron polarization was calculated following (Equation (6.38), Rybicki & Lightman 1979). The degree of polarization depends on the geometry of the magnetic field in the jet. This is characterized by the scaling factor FB between 0 and 1, with 1 representing perfectly ordered magnetic fields, whereas values less than 1 represent more tangled magnetic fields. The total degree of polarization is calculated as the sum of the synchrotron polarization and the unpolarized AD and BLR emissions.
The emission lines can be modeled as Gaussian functions, and the corresponding fluxes can be calculated relative to each other according to Phillips (1978). Their model did not include the Hα, C iv, and Lyα lines. However, these were considered by Malkan & Moore (1986), Isler et al. (2015) alongside the Mg ii, Hγ, Hβ, and Hα emission lines. The C iv, Mg ii, Hγ, and Hα emission lines are also included here, while emission lines are excluded if they are outside of the frequency regime with good spectropolarimetric or photometric data.
The data averaged over 2021 and 2022 are modeled and shown in Figure 3. In 2021, there are contributions by synchrotron, AD, and BLR radiation, while the data in 2022 requires dominating AD and BLR flux. The upper right panel, showing the 2022 fit, suggests that the photometry data can be well fitted with only the AD and line components without the synchrotron contribution. Thus, the fit to the 2022 data marks a strict upper limit to the synchrotron flux contribution, in line with the above statement that the source-intrinsic polarization is consistent with zero in PKS 1510−089. The parameters obtained with the model fits are given in Table 1. For reference, the model application to all individual observations in 2021 is shown in Appendix A.
Table 1. Parameters Obtained by Fitting the Optical–UV Flux and Polarization Data Averaged Over 2021 and 2022, respectively, with the Code of Schutte et al. (2022)
| Date | n0 | γb | γc | p1 | p2 | FB |

|
|---|---|---|---|---|---|---|---|
| 2021 Average | 1 × 1047 | 569 | 5.0 × 10⁶ | 2.7 | 3.7 | 0.18 | 0.06 |
| 2022 Average | 7 × 1049 | 30 | 5.0 × 10⁶ | 2.1 | 3.1 | 0.1 | 0.10 |
Note. Constant parameters are: bulk Lorentz factor Γ = 20, θobs = 2.9 deg, magnetic field B = 2 G, emission region radius R = 3 × 1015 cm,  , accretion disk luminosity Ld
= 1.8 × 1046 erg s−1, and MBH = 6 × 10⁸
M☉. n0 is the electron distribution normalization. The
, accretion disk luminosity Ld
= 1.8 × 1046 erg s−1, and MBH = 6 × 10⁸
M☉. n0 is the electron distribution normalization. The  is the goodness of fit to the spectropolarimetry data, with degrees of freedom ndf = 13.
Download table as: ASCIITypeset image
The simultaneous modeling of the flux and polarization shows that the jet’s synchrotron emission must have dropped considerably between 2021 and 2022, leaving behind the AD and the BLR as the almost sole flux contributors in the optical–UV regime. This underlines the unprecedented change that took place in PKS 1510−089.
3.2. Broadband SED Modeling
In this section, first a fit of the broadband (IR—VHE γ-ray) SEDs of PKS 1510−089 of 2021 and 2022 is attempted with a simple one-zone, steady-state leptonic model. For this purpose, the leptonic code of Böttcher et al. (2013) is employed. See that paper for a detailed description of the model, which includes IC scattering of the cospatially produced synchrotron emission (synchrotron self-Compton, SSC) and external Compton scattering of the AD emission (IC/AD), modeled with the parameters derived in Section 3.1, and of the DT, modeled as an isotropic (in the active galactic nucleus, hereafter AGN, rest frame) blackbody photon field (IC/DT). The most relevant model parameters are thus: the injection luminosity of nonthermal electrons, Linj, the low-energy and HE cutoffs of the injected electron spectrum,  and
and  , the electron injection spectral index, p1, the size of the emission region, R, the comoving magnetic field, B, the bulk Lorentz factor, Γ, the viewing angle, θobs (in the observer’s frame), the distance of the emission region from the black hole, z0, and the energy density and equivalent temperature of the external blackbody radiation field, uext and Text. The code evaluates self-consistently an equilibrium electron distribution, based on the balance between injection (and acceleration), radiative cooling, and escape, evaluates the kinetic jet power Le
corresponding to the final electron population in the emission region and the Poynting flux power LB
, and calculates the ratio LB
/Le
= uB
/ue
, which provides information on the magnetization of the jet plasma. The absorption through the extragalactic background light (EBL) is evaluated with the model of Finke et al. (2010). Given the large number of parameters, a fit by eye is conducted, as a proper χ2 minimization procedure is not feasible, and it would likely be degenerate in any case, since many of the model parameters are very poorly constrained.
, the electron injection spectral index, p1, the size of the emission region, R, the comoving magnetic field, B, the bulk Lorentz factor, Γ, the viewing angle, θobs (in the observer’s frame), the distance of the emission region from the black hole, z0, and the energy density and equivalent temperature of the external blackbody radiation field, uext and Text. The code evaluates self-consistently an equilibrium electron distribution, based on the balance between injection (and acceleration), radiative cooling, and escape, evaluates the kinetic jet power Le
corresponding to the final electron population in the emission region and the Poynting flux power LB
, and calculates the ratio LB
/Le
= uB
/ue
, which provides information on the magnetization of the jet plasma. The absorption through the extragalactic background light (EBL) is evaluated with the model of Finke et al. (2010). Given the large number of parameters, a fit by eye is conducted, as a proper χ2 minimization procedure is not feasible, and it would likely be degenerate in any case, since many of the model parameters are very poorly constrained.
Figure 2 (middle) shows representative attempts of single-zone leptonic fits to the 2021 (red) and 2022 (blue) SEDs. The adopted model parameters are listed in Table 2 and are chosen in such a way that the resulting radiating electron distribution is identical to the one resulting from the low-frequency SED and spectropolarimetry fit in Section 3.1. The distance of the emission region in 2021 is very poorly constrained, as a small contribution of IC/AD emission slightly improves the fit, but is not strictly required. An almost identical fit can be achieved with a much larger distance from the black hole, assuming that the DT radiation field has the same energy density at that distance. The soft HE γ-ray spectrum, implying a very soft electron spectrum, combined with Klein–Nishina effects at the highest energies, makes it very difficult to find a satisfactory fit to the H.E.S.S. spectral points in this single-zone scenario.
Table 2. Model Parameters for the SED Fits Shown in Figure 2 (Middle and Bottom)
| Parameter | 2021 | 2022 | 2021 |
|---|---|---|---|
| (units) | Single Zone | Single Zone | Two Zone |
| Le [erg s−1] | 6.2 × 1044 | 2.1 × 1044 | 2.3 × 1044 |

| 600 | 30 | 1.0 × 10³ |

| 5.0 × 10⁶ | 1.0 × 10⁶ | 1.0 × 10⁶ |
| p1 | 2.7 | 2.1 | 2.9 |
| R [cm] | 3.0 × 10¹⁵ | 1.0 × 10¹⁶ | 5.0 × 10¹⁵ |
| B [G] | 2.0 | 2.0 | 2.2 |
| z0 [pc] | 0.1 | 10 | 0.06 |
| Γ | 20 | 20 | 20 |
| θobs [deg] | 2.9 | 2.9 | 2.9 |
| uext [erg cm−3] | 1.5 × 10⁻³ | 1.5 × 10⁻³ | 1.5 × 10⁻³ |
| Text [K] | 100 | 100 | 100 |
| LB [erg s−1] | 6.5 × 1043 | 6.0 × 1044 | 1.5 × 1044 |
| LB /Le | 0.11 | 2.8 | 0.66 |
Download table as: ASCIITypeset image
For the 2022 low state, the HE γ-ray and nonthermal optical flux may be suppressed by using a smaller injection luminosity (or acceleration efficiency) and a significantly harder injection spectrum. In order to suppress any potential contribution of IC/AD, a distance z0 ≫ 0.1 pc from the black hole is required. The parameters adopted for the 2022 single-zone fit shown in Figure 2 (middle) have been chosen to keep as many parameters as possible unchanged between 2021 and 2022. However, if the dominant emission region in 2022 is indeed much farther down the jet than that in 2021, keeping the magnetic field and emission-region radius constant may not be plausible. A fit with a decreased magnetic field (such as  , as expected for a dominantly toroidal magnetic field) and larger emission region (such as R ∝ z0 for a conical jet) leads to an almost identical fit to the X-ray through VHE γ-ray flux, but strongly suppresses the synchrotron emission in the radio through X-ray regime.
Due to the difficulty of finding a satisfactory fit to the VHE spectrum in 2021, now the possibility of a two-zone model is explored, which is shown in Figure 2 (bottom). As the X-ray and VHE γ-ray spectra appear to have remained almost unchanged between 2021 and 2022, it seems natural to postulate a steady emission region responsible for the nonthermal emission in 2022, which may have been active also in 2021, with the additional emission region, closer to the central engine, that was only active in 2021. Therefore, the parameters of the far zone equal to the 2022 SED fit described above are kept, while a near zone is added with parameters listed in the last column of Table 2. This produces a satisfactory fit to the entire SED in 2021 (including the H.E.S.S. points) with physical conditions close to equipartition (bottom row in Table 2) in both emission regions. It should be noted that the B-field in the far-zone (2022) is poorly constrained and could easily be chosen to achieve exact equipartition.
The absorption of γ-rays in circum-nuclear radiation fields (accretion-disk, BLR) has not been accounted for in the model fits. It has been shown by Reimer (2007) for strong-lined AGN in general and by Böttcher & Els (2016) specifically for PKS 1510−089 that VHE γ-rays are expected to be strongly attenuated if the emission region was located at subparsec distances from the central engine. The fact that the VHE spectrum of PKS 1510−089 does not show any signs of such internal γ γ absorption (see also H.E.S.S. Collaboration et al. 2021) provides further support for the far-zone interpretation. This goes in line with the choice not to add an IC/BLR radiation component to the far-zone model. Such a component could plausibly be present in the near-zone (2021) model. However, the IC/DT spectrum provides a satisfactory fit to the Fermi-LAT spectrum in 2021, and an IC/BLR component would not significantly contribute to the VHE spectrum due to Klein–Nishina effects. Therefore, it is preferred not to include additional parameters to the model.
4. Discussion and Conclusions
The relativistic jet of PKS 1510−089 underwent a sudden and significant change around 2021 July 18. The HE γ-ray and optical fluxes observed with Fermi-LAT and ATOM, respectively, dropped to persistent low states, while the optical spectropolarimetry data obtained with SALT suggest a drop to a level compatible with no polarization in the source. The optical spectrum is thus fully explained by the AD and the BLR. Meanwhile, the VHE γ-ray and X-ray fluxes observed with H.E.S.S. and Swift-XRT, respectively, remained steady within a factor 2.
This favors the two-zone interpretation, where separate emission regions were active before 2021 July 18 contributing to various degrees in all energy bands. Around this date, the primary zone close to the black hole that was responsible for most of the optical synchrotron and HE γ-ray emission vanished leaving behind the secondary zone that has contributed strongly to the VHE γ-ray and X-ray domains. The secondary zone has been modeled as IC/DT at a few parsec from the black hole. In comparison to the two-zone interpretation in Nalewajko et al. (2012), a softer electron distribution and a slightly higher  is required for the secondary zone described here owing to the different characteristics in the HE γ-ray domain. The new γ-ray state can also be reproduced with an IC/CMB model in the kiloparsec-scale jet similar to Meyer et al. (2019)
50
with the caveat that it cannot account for the X-ray spectrum measured with Swift. The comparison of the current VHE γ-ray spectrum with the discovery spectrum [see Figure 2 (top)] suggests that the secondary zone was already present in the old data, but that the VHE spectrum was also influenced by the primary zone allowing for the reproduction of that data with a single-zone model (e.g., Barnacka et al. 2014). However, the two-zone explanation as outlined here would also explain the varying correlation patterns observed between the HE and VHE γ-ray bands (Zacharias et al. 2019).
is required for the secondary zone described here owing to the different characteristics in the HE γ-ray domain. The new γ-ray state can also be reproduced with an IC/CMB model in the kiloparsec-scale jet similar to Meyer et al. (2019)
50
with the caveat that it cannot account for the X-ray spectrum measured with Swift. The comparison of the current VHE γ-ray spectrum with the discovery spectrum [see Figure 2 (top)] suggests that the secondary zone was already present in the old data, but that the VHE spectrum was also influenced by the primary zone allowing for the reproduction of that data with a single-zone model (e.g., Barnacka et al. 2014). However, the two-zone explanation as outlined here would also explain the varying correlation patterns observed between the HE and VHE γ-ray bands (Zacharias et al. 2019).
The disappearance of the primary emission zone suggests two probable explanations. Either the inner jet has weakened considerably and is no longer capable of producing significant amounts of radiation, or the inner jet has swung away from the line of sight reducing the amount of Doppler beaming. Both scenarios may also explain the sudden termination of the flare that was ongoing in the HE and optical bands. In order to uncover the details of this event, elaborate modeling is required, which is beyond the scope of this paper. In either case, the disturbance should be transported through the jet and may eventually reach the parsec-scale jet. On these scales, the changes become observable in VLBI radio maps by a reduced total flux, by an outward motion of the core (if the jet weakens and becomes incapable of producing radio flux at the current core position) or a gradual swing of the jet structure. Publicly available radio data 51 show a flare occurring around the time of the disappearance of the primary emission region. This suggests a connection, but a detailed analysis is left to future work. Eventually, both scenarios could lead to a vanishing of the secondary emission zone, which could be uncovered in continuous MWL monitoring observations.
Acknowledgments
We thank the referee for a constructive report that helped to improve the manuscript. The support of the Namibian authorities and of the University of Namibia in facilitating the construction and operation of H.E.S.S. is gratefully acknowledged, as is the support by the German Ministry for Education and Research (BMBF), the Max Planck Society, the German Research Foundation (DFG), the Helmholtz Association, the Alexander von Humboldt Foundation, the French Ministry of Higher Education, Research and Innovation, the Centre National de la Recherche Scientifique (CNRS/IN2P3 and CNRS/INSU), the Commissariat á l’énergie atomique et aux énergies alternatives (CEA), the U.K. Science and Technology Facilities Council (STFC), the Irish Research Council (IRC) and the Science Foundation Ireland (SFI), the Knut and Alice Wallenberg Foundation, the Polish Ministry of Education and Science, agreement No. 2021/WK/06, the South African Department of Science and Technology and National Research Foundation, the University of Namibia, the National Commission on Research, Science and Technology of Namibia (NCRST), the Austrian Federal Ministry of Education, Science and Research and the Austrian Science Fund (FWF), the Australian Research Council (ARC), the Japan Society for the Promotion of Science, the University of Amsterdam, and the Science Committee of Armenia grant 21AG-1C085. We appreciate the excellent work of the technical support staff in Berlin, Zeuthen, Heidelberg, Palaiseau, Paris, Saclay, Tübingen; and in Namibia in the construction and operation of the equipment. This work benefited from services provided by the H.E.S.S. Virtual Organisation, supported by the national resource providers of the EGI Federation.
Some of the observations reported in this paper were obtained with the Southern African Large Telescope (SALT) under program 2021-2-LSP-001 (PI: D.A.H. Buckley).
This research has made use of the NASA/IPAC Extragalactic Database (NED), which is funded by the National Aeronautics and Space Administration and operated by the California Institute of Technology.
Facilities: H.E.S.S. - , SALT - Southern African Large Telescope, Fermi-LAT - , Swift(XRT and UVOT) - Swift Gamma-Ray Burst Mission, ATOM - .
Software: Fermi Science Tools (Fermi Science Support Development Team 2019), Astropy (Astropy Collaboration et al. 2022), SIMBAD (Wenger et al. 2000), PySALT (Crawford et al. 2010), iraf (Tody 1986), HEASOFT (Nasa High Energy Astrophysics Science Archive Research Center, Heasarc, 2014).
Appendix A: Supplementary Optical–UV SED and Spectropolarimetry Modeling
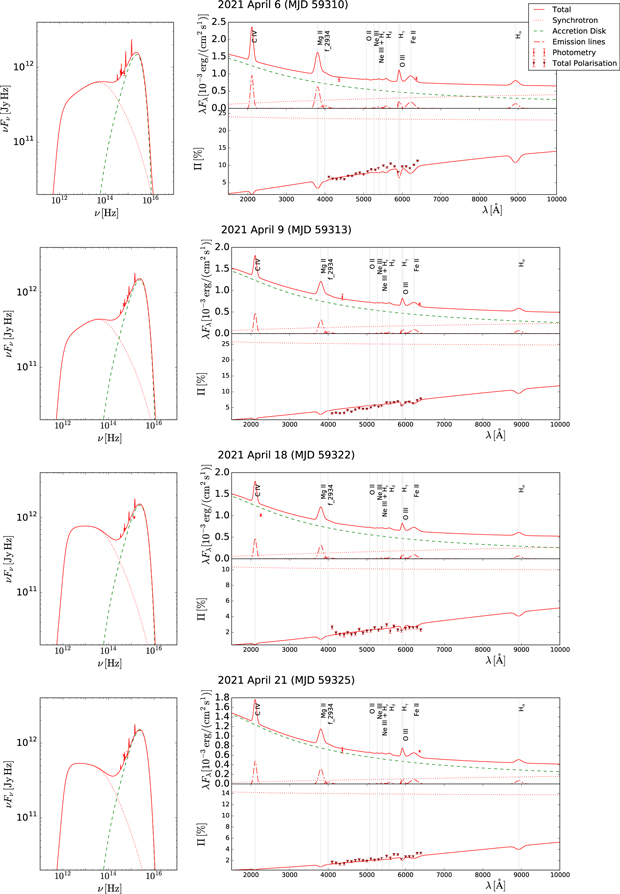
The plots in Figure 4 show the model fits to the optical–UV photometry and spectropolarimetry data for each of the SALT spectropolarimetry observing windows in 2021. Contemporaneous observations from the ATOM and Swift-UVOT telescopes were included in the fits, when detections were obtained on the same day as the SALT detections except for the SALT observations of 2021 April 6 (MJD 59310), 2021 May 9 (MJD 59343) and 2021 June 10 (MJD 59375) where the ATOM data of 2021 April 7 (MJD 59311), 2021 May 8 (MJD 59342), and 2021 June 9 (MJD 59374) in the R band were included, respectively, as a guide to the fits. The parameters obtained with the model fit are given in Table 3, and the obtained line fluxes for each observation are listed in Table 4. The full spectropolarimetry results for each of the SALT observations are given in Table 5.
Download figure:
Standard image High-resolution image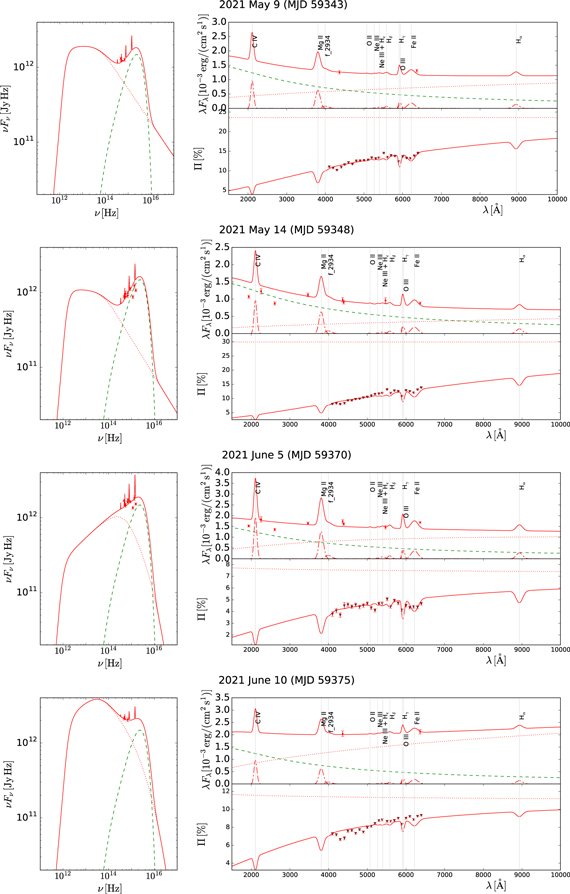
Figure 4. Same as Figure 3 but for the individual observations in 2021.
Download figure:
Standard image High-resolution imageTable 3. Parameters Obtained by Fitting the Data from Each of the 2021 Observation Windows with the Code of Schutte et al. (2022)
| Date | MJD | n0 | γb | γc | p1 | p2 | FB |

|
|---|---|---|---|---|---|---|---|---|
| 2021 Apr 6 | 59310 | 3.8 × 1046 | 697 | 2.8 × 10³ | 2.5 | 3.5 | 0.28 | 0.25 |
| 2021 Apr 9 | 59313 | 4.6 × 1046 | 569 | 2.8 × 10³ | 2.5 | 3.5 | 0.30 | 0.21 |
| 2021 Apr 18 | 59322 | 7.2 × 1046 | 569 | 2.8 × 10³ | 2.9 | 3.9 | 0.12 | 0.10 |
| 2021 Apr 21 | 59325 | 4.6 × 1046 | 569 | 2.8 × 10³ | 2.5 | 4.0 | 0.17 | 0.10 |
| 2021 May 9 | 59343 | 1.4 × 1047 | 569 | 5.0 × 10⁶ | 2.9 | 3.9 | 0.30 | 0.04 |
| 2021 May 14 | 59348 | 7.7 × 1046 | 569 | 5.0 × 10⁶ | 2.0 | 4.0 | 0.38 | 0.15 |
| 2021 Jun 5 | 59370 | 7.9 × 1045 | 156 | 2.8 × 10³ | 2.4 | 3.4 | 0.09 | 0.03 |
| 2021 Jun 10 | 59375 | 6.0 × 1047 | 493 | 2.8 × 10³ | 2.4 | 3.4 | 0.14 | 0.06 |
Note. See Table 1 for information on the parameters that are taken as constant in the model throughout all states. For the goodness of fit  , ndf = 13 for all states.
Download table as: ASCIITypeset image
Table 4. Fluxes of the Emission Lines of PKS 1510−089 During SALT Spectropolarimetry Observations in 2021
| Dates | 2021 Apr 6 2021 May 9, 14 2021 Jun 10 | 2021 April 9, 21 | 2021 April 18 | 2021 Jun 05 | |
|---|---|---|---|---|---|
| MJD | 59310 | 59313, 59325 | 59322 | 59370 | |
| 59343, 59348 | |||||
| 59375 | |||||
| Emission Line | Rest-frame Wavelength | Line Flux | |||
| (Å) | (×1012 Jy Hz) | ||||
| Hα | 6563 | 0.14 | 0.07 | 0.07 | 0.28 |
| Fe ii | 4570 | 0.19 | 0.09 | 0.1 | 0.37 |
| [O iii] | 4363 | 0.2 | 0.1 | 0.1 | 0.4 |
| Hγ | 4340 | 0.2 | 0.1 | 0.1 | 0.4 |
| Hδ | 4102 | 0.07 | 0.04 | 0.03 | 0.14 |
| [Ne iii] + H | 3967 | 0.04 | 0.02 | 0.02 | 0.09 |
| [Ne iii] | 3869 | 0.02 | 0.01 | 0.01 | 0.04 |
| [O ii] | 3727 | 0.01 | 0.01 | 0.01 | 0.04 |
| f2934 | 2934 | 0.08 | 0.03 | 0.04 | 1.15 |
| Mg ii | 2798 | 0.63 | 0.32 | 0.31 | 1.27 |
| C iv | 1549 | 0.97 | 0.48 | 0.48 | 1.94 |
Download table as: ASCIITypeset image
Table 5. The Average Degree of Linear Polarization and Average Equatorial Polarization Angle for Each of the SALT Observations, in Four Different Wavelength Ranges
| Degree of Linear Polarization | Equatorial Polarization Angle | |||||||
|---|---|---|---|---|---|---|---|---|
| (%) | (°) | |||||||
| Date | 〈Π〉range 1 | 〈Π〉range 2 | 〈Π〉range 3 | 〈Π〉range 4 | 〈PA〉range 1 | 〈PA〉range 2 | 〈PA〉range 3 | 〈PA〉range 4 |
| 2021 Apr 6 | 5.01 ± 0.76 | 6.08 ± 0.24 | 6.65 ± 0.35 | 7.75 ± 0.29 | 20.65 ± 2.89 | 16.54 ± 0.58 | 13.84 ± 1.02 | 12.91 ± 0.92 |
| 2021 Apr 9 | 2.31 ± 0.60 | 3.24 ± 0.23 | 4.10 ± 0.21 | 4.70 ± 0.28 | 1.16 ± 2.85 | 8.94 ± 1.92 | 6.40 ± 1.51 | 2.95 ± 1.10 |
| 2021 Apr 18 | 1.93 ± 0.46 | 1.93 ± 0.25 | 1.72 ± 0.16 | 2.16 ± 0.20 | 106.48 ± 7.39 | 100.99 ± 1.79 | 101.29 ± 2.38 | 97.63 ± 6.95 |
| 2021 Apr 21 | 1.21 ± 0.38 | 1.58 ± 0.45 | 1.87 ± 0.23 | 2.10 ± 0.18 | 172.81 ± 13.22 | 173.28 ± 5.71 | 180.59 ± 1.24 | 181.37 ± 5.23 |
| 2021 May 09 | 9.06 ± 1.16 | 10.46 ± 0.45 | 11.84 ± 0.36 | 12.62 ± 0.16 | 153.70 ± 1.64 | 155.66 ± 0.56 | 155.84 ± 0.46 | 155.20 ± 0.81 |
| 2021 May 14 | 6.45 ± 1.51 | 8.07 ± 0.25 | 9.55 ± 0.41 | 10.50 ± 0.28 | 33.61 ± 1.65 | 33.17 ± 0.92 | 32.33 ± 0.88 | 31.77 ± 0.39 |
| 2021 Jun 05 | 3.23 ± 0.56 | 4.06 ± 0.41 | 4.45 ± 0.32 | 4.50 ± 0.11 | 150.68 ± 1.75 | 145.80 ± 1.49 | 144.92 ± 1.19 | 145.48 ± 1.74 |
| 2021 Jun 10 | 6.07 ± 0.64 | 6.95 ± 0.40 | 7.48 ± 0.20 | 7.89 ± 0.25 | 80.21 ± 0.75 | 79.82 ± 0.99 | 80.40 ± 0.52 | 80.79 ± 0.79 |
| 2022 Apr 25 | 1.11 ± 0.44 | 1.17 ± 0.56 | 1.63 ± 0.97 | 1.53 ± 0.28 | 78.89 ± 30.56 | 63.34 ± 13.10 | 67.06 ± 33.03 | 53.45 ± 24.00 |
| 2022 Apr 26 | 1.55 ± 1.05 | 1.49 ± 0.65 | 0.78 ± 0.37 | 1.02 ± 0.39 | 51.43 ± 15.22 | 60.89 ± 12.52 | 36.54 ± 15.11 | 65.31 ± 30.40 |
| 2022 May 24 | 1.60 ± 0.53 | 1.52 ± 0.61 | 1.34 ± 0.58 | 1.96 ± 0.56 | 62.99 ± 12.08 | 59.34 ± 13.59 | 60.64 ± 14.07 | 55.17 ± 10.72 |
| 2022 May 25 | 1.00 ± 0.62 | 1.01 ± 0.29 | 1.12 ± 0.39 | 1.01 ± 0.32 | 88.53 ± 37.74 | 81.16 ± 11.77 | 76.19 ± 12.20 | 76.41 ± 10.86 |
| 2022 May 30 | 1.41 ± 0.76 | 1.75 ± 1.08 | 2.25 ± 1.07 | 2.01 ± 0.85 | 66.91 ± 28.68 | 59.95 ± 10.04 | 48.02 ± 13.75 | 50.79 ± 16.49 |
| 2022 Jun 5 | 1.61 ± 0.65 | 1.32 ± 0.33 | 0.86 ± 0.29 | 1.19 ± 0.44 | 104.78 ± 18.25 | 83.35 ± 5.92 | 67.60 ± 14.73 | 66.62 ± 9.63 |
| 2022 Jun 20 | 1.91 ± 0.59 | 1.03 ± 0.41 | 1.66 ± 0.25 | 1.16 ± 0.24 | 35.88 ± 28.23 | 60.98 ± 17.17 | 73.67 ± 10.36 | 65.40 ± 16.59 |
| 2022 Jun 26 | 1.24 ± 0.48 | 0.61 ± 0.29 | 1.18 ± 0.35 | 1.15 ± 0.65 | 112.92 ± 33.00 | 92.35 ± 44.39 | 85.73 ± 9.38 | 90.41 ± 16.94 |
| 2022 Jul 27 | 1.11 ± 0.48 | 1.45 ± 0.42 | 1.17 ± 0.53 | 1.24 ± 0.31 | 70.68 ± 33.54 | 88.82 ± 17.95 | 48.30 ± 32.87 | 64.05 ± 15.81 |
| 2022 Jul 28 | 1.79 ± 1.29 | 2.29 ± 0.97 | 1.56 ± 0.77 | 1.29 ± 0.46 | 57.58 ± 26.74 | 85.24 ± 9.63 | 67.96 ± 35.24 | 85.87 ± 19.82 |
| 2022 Jul 31 | 1.57 ± 0.75 | 1.60 ± 0.56 | 1.38 ± 0.31 | 1.13 ± 0.27 | 69.96 ± 2.17 | 60.70 ± 9.13 | 74.41 ± 13.54 | 54.01 ± 9.69 |
Note. The wavelength ranges (as specified in Section 2.2) correspond to λrange 1 = 3670–4060 Å, λrange 2 = 4100–4400 Å, λrange 3 = 4480–4780 Å, and λrange 4 = 4800–5100 Å.
Download table as: ASCIITypeset image
The photometry fluxes decrease from 2021 April 6 to April 21 (MJD 59310-59325, excl. 2021 April 18, MJD 59322, for which ATOM data was not available, but a single very low Swift-UVOT data point was recorded). On 2021 May 9 (MJD 59343), there is a sudden increase in flux, decreasing again on 2021 May 14, and thereafter, the flux continued increasing until 2021 June 10 (MJD 59375). The photometry fluxes and degree of polarization decreased and/or increased alongside each other, as shown in Figure 1.
The ordering of the magnetic fields does not indicate the presence of a shock; in a shock-in-jet scenario, one expects that the ordering of the magnetic field decreases and/or increases in correlation with the degree of polarization and flux (Paliya et al. 2018). Instead, the evolution of the ordering of the magnetic field shows no such correlation, which suggests the presence of turbulence and/or magnetic reconnection in the emission region as driver for the optical–UV variability.
The  is the goodness of fit of the model to the spectropolarimetry data, where the number of degrees of freedom, ndf, is the amount of spectropolarimetry data points minus the amount of estimated parameters (equal to 10 in this model) minus 1. The goodness of the model fit to the few photometry data points is neglected and only applied to the abundent spectropolarimetry data, since fitting the prediction of the model’s total polarization degree to the spectropolarimetry data is already dependent on the modeled total flux as well (where the modeled total flux was fitted to the photometry data). It does not indicate a good fit for all states since there might be contributions from components (such as emission lines) to the total flux (and thereby the total degree of polarization) that are missing or insufficiently accurately modeled. On the other hand, the inclusion of additional radiation components increases the number of free parameters in the model and therefore reduces its predictive power. Therefore, such additional components are not included.
The Swift-UVOT data shows an unexpected trend of a variable profile for each state. This might be explained by prominent emission lines that have fluxes higher than that of the continuum.
In the spectropolarimetry data, the dominant line was identified as Hγ
from which the other lines were calculated relative to each other according to Phillips (1978). The remaining wavelength ranges of the emission lines are taken from Francis et al. (1991), when available. The wavelength ranges of Hδ
, f2934, and [Ne iii] + H
(at 3967 Å) lines that are not given in Francis et al. (1991) are estimated by eye to fit the photometric and spectropolarimetric data.
Appendix B: X-Ray Spectral Analysis
Table 6 provides an overview over the spectral results of the Swift-XRT analysis for both years.
Table 6. Parameters of the Power-law Spectral Fits to the Swift-XRT 2021 and 2022 Observations
| Year | Time Exposure | Normalization | Photon Index | Avg. Flux | p-value |
|---|---|---|---|---|---|
| (ks) | (cm−2 s−1 keV−1) | (erg cm−2 s−1) | |||
| 2021 | 8.6 | (1.11 ± 0.04) × 10−3 | 1.51 ± 0.04 | (8.4 ± 0.4) × 10−12 | 0.85 |
| 2022 | 15.3 | (0.74 ± 0.03) × 10−3 | 1.47 ± 0.04 | (5.9 ± 0.2) × 10−12 | 0.007 |
Note. The last two columns give the average flux above 0.3 keV and its p-value of compatibility with a constant.
Download table as: ASCIITypeset image
Footnotes
- 41
For an up-to-date list, see http://tevcat2.uchicago.edu/.
- 42
See, e.g., the public Fermi-LAT light curves: https://fermi.gsfc.nasa.gov/ssc/data/access/lat/msl_lc/source/1510-089.
- 43
- 44
- 45
- 46
The TS value is defined as twice the difference of log-likelihood values of the optimized ROI model with and without the source included,
 (Mattox et al. 1996).
 - 47
A log-parabolic spectral shape is also tested for, but does not yield a better fit of the data with respect to a power law.
- 48
- 49
Version 2.16.
- 50
- 51
Such as from Metsähovi, https://www.metsahovi.fi/AGN/data/, and ATCA, https://www.narrabri.atnf.csiro.au/calibrators/, among others.
