Abstract
We present the discovery of the first millimeter afterglow of a short-duration γ-ray burst (SGRB) and the first confirmed afterglow of an SGRB localized by the GUANO system on Swift. Our Atacama Large Millimeter/Sub-millimeter Array (ALMA) detection of SGRB 211106A establishes an origin in a faint host galaxy detected in Hubble Space Telescope imaging at 0.7 ≲ z ≲ 1.4. From the lack of a detectable optical afterglow, coupled with the bright millimeter counterpart, we infer a high extinction, AV ≳ 2.6 mag along the line of sight, making this one of the most highly dust-extincted SGRBs known to date. The millimeter-band light curve captures the passage of the synchrotron peak from the afterglow forward shock and reveals a jet break at  days. For a presumed redshift of z = 1, we infer an opening angle, θjet = (15
5 ± 1
4), and beaming-corrected kinetic energy of
 , making this one of the widest and most energetic SGRB jets known to date. Combining all published millimeter-band upper limits in conjunction with the energetics for a large sample of SGRBs, we find that energetic outflows in high-density environments are more likely to have detectable millimeter counterparts. Concerted afterglow searches with ALMA should yield detection fractions of 24%–40% on timescales of ≳2 days at rates of ≈0.8–1.6 per year, outpacing the historical discovery rate of SGRB centimeter-band afterglows.
Original content from this work may be used under the terms of the Creative Commons Attribution 4.0 licence. Any further distribution of this work must maintain attribution to the author(s) and the title of the work, journal citation and DOI.
1. Introduction
Short-duration γ-ray bursts (SGRBs) are produced in the mergers of compact objects involving a neutron star (Berger 2014; Abbott et al. 2017). These explosive transient events are a known site of r-process nucleosynthesis and thus a source of heavy elements (Berger et al. 2013; Tanvir et al. 2013; Kasen et al. 2017). Their association with gravitational-wave transients makes excellent probes of fundamental physics, from cosmology to Lorentz violation (Margutti & Chornock 2021).
The interaction of the collimated, relativistic jets of SGRBs with the environment produces relativistic shocks, which accelerate electrons and produce the synchrotron afterglow (Granot et al. 1999; Granot & Sari 2002). In addition to providing precise localizations (and hence, host associations and redshifts), observing and modeling the afterglow emission yields the explosion energy, density and density profile of the pre-explosion environment, and the degree of ejecta collimation (e.g., Fong et al. 2015). These measurements enable tests of progenitor models, delay-time distributions, and true event rates corrected for beaming (Berger 2014).
Afterglow observations at millimeter (mm) wavelengths probe the synchrotron peak, which is sensitive to the explosion energy and density. Furthermore, mm-band observations are unaffected by interstellar scintillation, thermal emission from the supernova/kilonova/host galaxy, and inverse-Compton effects, which can impact observations at centimeter (cm), optical, and X-ray bands, respectively. In contrast to cm wavelengths, the mm band is also not subject to synchrotron self-absorption at the low densities (≲1 cm−3) typical of SGRB environments, making it an excellent wavelength to probe the location and evolution of the peak of the spectral energy distribution (SED).
Observations of the mm afterglows of long-duration γ -ray bursts (LGRBs, originating from the deaths of massive stars; Woosley & Bloom 2006) with the improved sensitivity of the Atacama Large Millimeter/Submillimeter Array (ALMA) are already proving revolutionary and have resulted in (i) confident detection and characterization of reverse shocks (Laskar et al. 2016, 2019b); (ii) constraints on the degree of GRB ejecta magnetization (Laskar et al. 2019a); and (iii) studies of ejecta collimation (Laskar et al. 2018). However, no mm-band afterglow for an SGRB has been reported to date. The deepest limits prior to the commissioning of ALMA are comparable to the observed mm-band luminosity of the least-luminous LGRB afterglows (Castro-Tirado et al. 2005; de Ugarte Postigo et al. 2012). While deeper mm-band limits have been published for GRB 170817A (Alexander et al. 2017; Kim et al. 2017), these limits were not constraining, as the peak of the SED was already below the cm band at the time. The lower energy and lower ambient density of SGRBs compared to LGRBs are expected to reduce the peak fluxes of their mm afterglows, putting them largely out of reach of these pre-ALMA facilities (de Ugarte Postigo et al. 2012; Pandey et al. 2019).
Here, we present the discovery of the mm afterglow of GRB 211106A. We discuss our γ-ray to radio observations of this burst in Section 2. We associate the burst with a host galaxy and consider its properties in Section 3. We perform multiwavelength afterglow modeling in Section 4 and discuss the results in Section 5. No redshift is available for this event, and, where relevant, we perform our analysis at two fiducial redshift values of z = 0.5 and z = 1, which are chosen to approximately correspond to the median values of large spectroscopic and photometric samples of SGRB hosts, respectively (Fong et al. 2022; Nugent et al. 2022) and report the results from both. We use a ΛCDM cosmology with ΩM = 0.31, ΩΛ = 0.69, and h = 0.68 throughout. All magnitudes reported here are in the AB system and not corrected for Galactic extinction. All uncertainties are 1σ and upper limits are 3σ, unless otherwise noted.
2. Observations and Data Analysis
2.1. γ-Ray: Swift/BAT and Fermi/GBM Analysis
Prompt γ-rays from GRB 211106A were first discovered
19
by INTEGRAL/SPI-ACS (von Kienlin et al. 2003) on 2021 November 6 at 04:37:31.2 UT (Tohuvavohu et al. 2021); all times in this paper are given relative to this time. The INTEGRAL notice triggered the Gamma-ray Urgent Archiver for Novel Opportunities (GUANO; Tohuvavohu et al. 2020) operated by the Neil Gehrels Swift Observatory’s (Swift; Gehrels et al. 2004) Mission Operations Center. GUANO ordered the Swift Burst Alert Telescope (BAT; Barthelmy et al. 2005) to save 90 s of BAT event-mode data around the time of burst. Using the Non-Imaging Transient Reconstruction And TEmporal Search (NITRATES; DeLaunay & Tohuvavohu 2021), we find a strong detection with BAT in the time-domain. The BAT light curve exhibits two pulses, with duration, T90 = 1.7 ± 0.1 s (50–300 keV, observer frame; Figure 1). The best-fit BAT position
20
from NITRATES is R.A. = 22h54m3432 and decl. = −53d14′0
9, with an uncertainty of 7′ (Tohuvavohu et al. 2021).
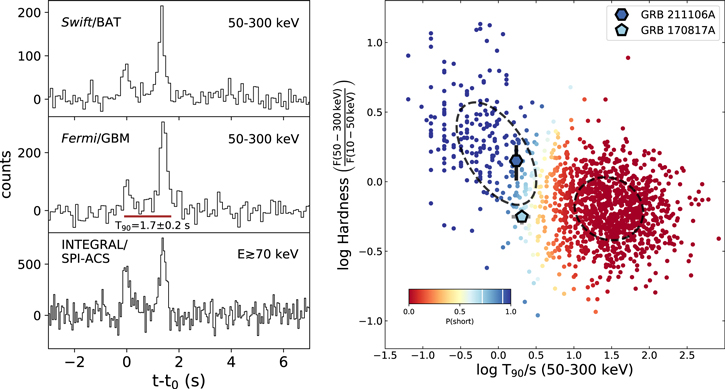
Figure 1. Left: background-subtracted γ-ray light curves of GRB 211106A in a common reference frame corrected for light-travel time effects in the canonical 50–300 keV range from Swift/BAT (top) and Fermi/GBM (middle; both at 96 ms resolution) and at E ≳ 70 keV from INTEGRAL/SPI-ACS (bottom) with 50 ms resolution. Right: the location of this event in the duration–hardness plane of Fermi GRBs (Bhat et al. 2016) colored by Pshort indicates GRB 211106A has a high (≈92%) likelihood of belonging to the SGRB population (Section 2.1). White lines in the color bar refer to the values of Pshort ≈ 0.92 and Pshort ≈ 0.72 for GRB 211106A and GRB 170817A, respectively (Section 2.1).
Download figure:
Standard image High-resolution imageGRB 211106A also triggered Konus-Wind (Aptekar et al. 1995) on 2021 November 6 at 04:37:32.485 UT. The observation revealed a light curve 21 with a single-pulse structure of ∼0.5 s (20 keV−2 MeV), consistent with the time of the second peak in the BAT light curve (Ridnaia et al. 2021).
The Gamma-ray Burst Monitor (GBM; Meegan et al. 2009) on board Fermi (GLAST Facility Science Team et al. 1999) did not trigger on this GRB. Fletcher & Fermi-GBM Team (2021) identified a significant event (signal-to-noise ratio (S/N) of 22) in the GBM data using the off-line targeted search pipeline (Goldstein et al. 2019), at a position consistent with the Swift/BAT-GUANO position. The Fermi/GBM light curve exhibits two pulses coincident with those in the BAT light curve, and with T90 = 1.71 ± 0.18 s (50–300 keV, observer frame; Figure 1). Fitting the time-integrated GBM spectrum during the T90 interval with RMfit
22
using a power-law model with an exponential cutoff (parameterized as the peak energy Epeak), we find a photon index, Γγ,CPL = −0.85 ± 0.20, Epeak = 306 ± 60 keV, and γ-ray fluence,  . The isotropic-equivalent γ-ray energy (1–104 keV, rest frame) corresponds to Eγ,iso = (1.1 ± 0.1) × 1051erg at z = 0.5 and Eγ,iso = (4.4 ± 0.4) × 1051erg at z = 1.0, two redshifts spanning the typical range for SGRBs as discussed in Section 1. Both Eγ,iso estimates are consistent with the Epeak–Eγ,iso distributions for SGRBs (Ghirlanda et al. 2009; Tsutsui et al. 2013; Minaev & Pozanenko 2020).
We compute the spectral lag between low-energy (25–50 keV) and high-energy (100–300 keV) GBM light curves using the same energy bands and procedure as described in Norris et al. (2000) and find  . This is consistent with τ ≈ 0 as measured for SGRBs (Gehrels et al. 2006). According to the lag–luminosity relationship for long GRBs, Lpeak ∝(τ/(1 + z))−0.74 (Norris et al. 2000), where Lpeak is the peak luminosity. Fitting the brightest 0.128 s time bin, we find a peak flux, Fpeak ≈ 2.4 × 10⁻⁶ erg cm−2 s−1, yielding Lpeak ≈ 1.5 × 1051 erg s−1 and 6.2 × 1051 erg s−1 at z = 0.5 and z = 1.0, respectively. If GRB 211106A were a long GRB, for the measured Lpeak, the lag–luminosity relation would imply a lag τ ≈ 0.238 s in the more conservative z = 1.0 case. This is inconsistent with the measured lag at a 4.9σ level. We derive the hardness ratio (HR), defined as the photon flux above the background in a high-energy band divided by those in a low-energy band (Bhat et al. 2016; Goldstein et al. 2017), and find HR = 1.41 ± 0.36. Modeling the T90–HR plane with a Gaussian mixture model
23
following Rouco Escorial et al. (2021), we find that the probability that GRB 211106A belongs to the SGRB population is P(short) ≈ 92% (Figure 1).
. This is consistent with τ ≈ 0 as measured for SGRBs (Gehrels et al. 2006). According to the lag–luminosity relationship for long GRBs, Lpeak ∝(τ/(1 + z))−0.74 (Norris et al. 2000), where Lpeak is the peak luminosity. Fitting the brightest 0.128 s time bin, we find a peak flux, Fpeak ≈ 2.4 × 10⁻⁶ erg cm−2 s−1, yielding Lpeak ≈ 1.5 × 1051 erg s−1 and 6.2 × 1051 erg s−1 at z = 0.5 and z = 1.0, respectively. If GRB 211106A were a long GRB, for the measured Lpeak, the lag–luminosity relation would imply a lag τ ≈ 0.238 s in the more conservative z = 1.0 case. This is inconsistent with the measured lag at a 4.9σ level. We derive the hardness ratio (HR), defined as the photon flux above the background in a high-energy band divided by those in a low-energy band (Bhat et al. 2016; Goldstein et al. 2017), and find HR = 1.41 ± 0.36. Modeling the T90–HR plane with a Gaussian mixture model
23
following Rouco Escorial et al. (2021), we find that the probability that GRB 211106A belongs to the SGRB population is P(short) ≈ 92% (Figure 1).
Owing to its short T90, hard spectrum, and negligible spectral lag, we consider GRB 211106A to be a bona fide short-duration, spectrally hard GRB.
2.2. X-Ray: Swift, Chandra, and XMM-Newton
Swift/XRT began follow-up observations of the BAT/NITRATES position at ≈0.46 days, revealing a fading X-ray afterglow at R.A. = 22h54m2045 and decl. = −53d 13′ 49
0, with an uncertainty of 3
4 (90% confidence; D’Elia et al. 2021). We downloaded time-sliced X-ray spectra per bin of the dynamically binned XRT light curve with the spectral extraction tool
24
on the Swift website (Evans et al. 2009), which we later use together with all available X-ray data for a joint spectral analysis.
We observed the afterglow with Chandra/ACIS-S3 (Garmire et al. 2003) at ≈10.5 and 59.8 days with total effective exposure times of 19.8 ks and 37.9 ks, respectively, through target-of-opportunity and DDT programs #22500107 (PI: Berger, ObsID 23543) and #22408828 (PI: Rouco Escorial, ObsIDs 26249 and 26262). We used the CIAO software package (v. 4.12, Fruscione et al. 2006) and calibration files (caldb; v. 4.9.0) to reduce the data. We detect the X-ray afterglow in the first Chandra epoch at R.A. = 22h54m2051 and decl. = −53d 13′ 51
17 (1σ uncertainty of 0
62; including centroiding uncertainty of 0
18 and absolute astrometric uncertainty of 0
6). We refine this position by astrometric calibration against Gaia using HST imaging (Section 2.5) in Appendix C. We derive the X-ray count rate and spectrum from a 2″ aperture centered on the X-ray afterglow and report the results in Table 1.
Table 1. X-Ray Observations of GRB 211106A
| Time | Count Rate | Unabsorbed Flux |
|---|---|---|
| (Days) | (10−3 counts s−1) | (10−14 erg s−1 cm−2) |
| Swift/XRT-PC | ||
| 0.5 | 12 ± 3 |

|
| 0.6 | 7 ± 2 |

|
| 2.7 | 1.8 ± 0.4 | 11 ± 3 |
| 27 | <5 | <29 |
| Chandra/ACIS-S3 | ||
| 10.5 | 1.7 ± 0.4 |

|
| 59.8 | <0.3 | <0.6 |
| XMM-Newton/EPIC | ||
| 14.9 | 2.6 ± 0.7, 1.6 ± 0.4, 1.1 ± 0.4 | 2.2 ± 0.3 |
| 33.0 | 1.0 ± 0.4, 0.3 ± 0.2 | 1.0 ± 0.2 |
| Best-fit Spectral Parameters | ||
| z | ΓX | NH, int |
| (1021 cm−2) | ||
| 0.5 | 1.9 ± 0.3 |

|
| 1 | 1.9 ± 0.3 |

|
Notes. Time is log-centered. XMM-Newton count rates are listed by detector in order: pn, MOS1, and MOS2 (first epoch) and pn and MOS1 (second epoch). Fluxes are reported in the 0.3–10 keV band (observer frame).
Download table as: ASCIITypeset image
We used XMM-Newton/EPIC (Strüder et al. 2001; Turner et al. 2001) to obtain two epochs of the afterglow at midtimes of ≈14.9 and 33.0 days after the burst, with total effective exposure times of 20.3 ks and 46.7 ks, respectively, through target-of-opportunity Program #086286 (PI: Fong, ObsIDs: 0862860301 and 0862860401). We reduced and analyzed the XMM-Newton data using SAS (v. 18.0.0; Gabriel et al. 2004). The afterglow was detected in both epochs. We derive the source flux and spectrum using a 20″ aperture (Table 1).
We use Xspec (v. 12.10.1f; Arnaud 1996) to perform a joint spectral fit of the Swift, Chandra, and XMM-Newton data in the 0.5–7 keV energy range sampled by all instruments. We use an absorbed power-law model with photon index (ΓX
), intrinsic absorption (NH,int), fixed Galactic absorption (NH,Gal = 1.06 × 1020 cm−2; Willingale et al. 2013), fixed normalization factors
25
to account for cross-calibration between observatories, W-statistics (statistic cstat; Wachter et al. 1979) and WILM abundances (Wilms et al. 2000). We find no evidence for spectral evolution and derive ΓX = 1.9 ± 0.3,  at z = 0.5 and
  at z = 1. We derive unabsorbed X-ray fluxes (0.3–10 keV) using the cflux convolution model and convert count rate upper limits to flux limits using the associated instrumental response files and Poisson statistics with the spectral parameters fixed to the best-fit values. This appears to be one of the most luminous SGRB afterglows at the corresponding rest-frame time known to date (Figure 2). We discuss this X-ray light curve in the context of those from other SGRBs in Section 5.
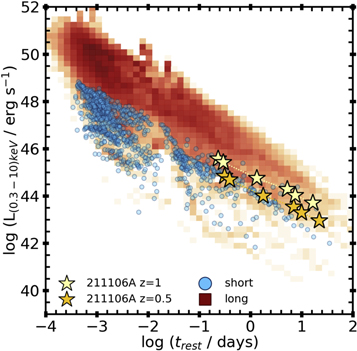
Figure 2. The X-ray luminosity (0.3–10.0 keV; unabsorbed (i.e., corrected for galactic and intrinsic absorption), observer frame) vs. rest-frame time for GRB 211106A at z = 0.5 and z = 1, compared with that of Swift/BAT LGRBs (red density) and SGRBs (blue circles) with known redshifts. GRB 211106A exhibits one of the most luminous X-ray afterglows of the SGRB population to date.
Download figure:
Standard image High-resolution image2.3. Millimeter: ALMA
We observed GRB 211106A with ALMA at 97.5 GHz at a midtime of 12.9 days after the burst (project 2019.1.00863.T, PI: Fong). We utilized four 2 GHz spectral windows centered at 90.52, 92.42, 102.52, and 104.48 GHz and employed J2357–5311 as bandpass and flux density calibrator, J2239–5701 as complex gain calibrator, and J2207–5346 as a check source. We calibrated the data using the automated ALMA pipeline procedure_hifa_cal.xml in the Common Astronomy Software Applications (CASA; McMullin et al. 2007) v. 5.6.1–8 followed by imaging to the half-power point of the primary beam using one Taylor term and with Briggs weighting using a robust parameter of 0.5. We detect a single point source with flux density 148 ± 11 μJy in the image spanning 15 in diameter (Figure 3). We obtained four additional epochs of ALMA observations, and the mm-band point source is observed to fade to a flux density below detection by the time of the final epoch obtained 62.6 days postburst. The most precise position of the counterpart is afforded by the second epoch, which has the smallest synthesized beam area of 0
346 × 0
269, R.A. = 22h54m20
53056 (±0.0012 s, 0
011), decl. = −53d13′50
525 (±0
010). The absolute systematic astrometric uncertainty on this position is given by beamFWHM/(S/N)/0.9 ≈ 36 mas (Remjian et al. 2019), with negligible additional systematic uncertainty (≲2 mas) from the calibrator positions. The mm-band position is consistent with both the original and refined Chandra afterglow position (Section 2.2 and Appendix C). The positional coincidence and fading behavior confirm this source as the mm afterglow of GRB 211106A. We plot the ALMA light curve in Figure 4 and report the corresponding flux density values in Table 2.
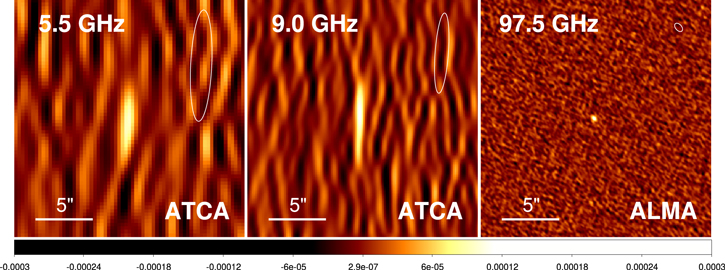
Figure 3. Discovery images of the radio and mm-band afterglow of GRB 211106A with ATCA at 5.5 GHz (left) and 9.0 GHz (center) at ≈14.18 days, and with ALMA at 97.5 GHz at ≈12.89 days after the burst. Ellipses in the top right represent the synthesized beam. The radio afterglow is clearly detected in each image. All images have the same display stretch and color scale, indicated by the color bar (in Jy) at the bottom.
Download figure:
Standard image High-resolution image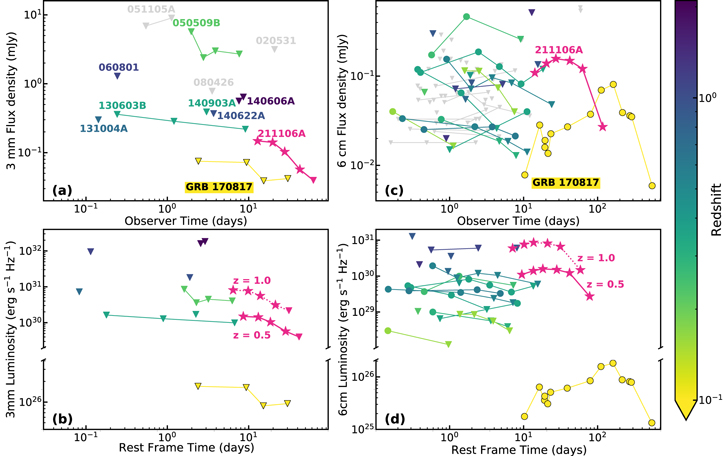
Figure 4. (a) Comparison of the mm-band afterglow of GRB 211106A (magenta stars) with all published 3 mm light curves of SGRBs colored by redshift. Events with no known redshift are in gray. Triangles denote 3σ upper limits. After GRB 170817A, our ALMA observations of GRB 211106A are the deepest obtained for any SGRB to date. (b) Millimeter-band luminosity vs. rest-frame time for GRB 211106A at two assumed redshifts, z = 0.5 (solid line) and z = 1.0 (dotted line), compared to SGRBs with available redshifts. The colors are the same as in the plot above. (c) The 6 cm (5.5 GHz) ATCA light curve of the afterglow of GRB 211106A (magenta stars). For comparison, we show the cm-band (5–10 GHz) light curves of the nine other radio-detected SGRBs as well as GRB 170817A (circles) colored by the host-galaxy redshift from yellow (low) to purple (high). Triangles denote 3σ upper limits, and SGRBs with no known redshift are in gray. (d) Radio luminosity of the 6 cm (5.5 GHz) ATCA light curve of the afterglow of GRB 211106A vs. rest-frame time for two redshifts: z = 0.5 (solid line) and z = 1.0 (dotted line). For comparison, we show the cm-band (5–10 GHz) radio luminosity of the nine other radio-detected SGRBs as well as GRB 170817A (circles). The colors are the same as in the plot above.
Download figure:
Standard image High-resolution imageTable 2. Radio and Millimeter Observations of GRB 211106A
| Telescope | Frequency | Time | Flux Density | Uncertainty |
|---|---|---|---|---|
| (GHz) | (days) | (μJy) | (μJy) | |
| ATCA | 5.5 | 14.18 | 109 | 11 |
| ATCA | 5.5 | 20.34 | 139 | 15 |
| ATCA | 5.5 | 27.27 | 157 | 32 |
| ATCA | 5.5 | 42.05 | 149 | 11 |
| ATCA | 5.5 | 62.60 | 121 | 13 |
| ATCA | 5.5 | 117.04 | 27 | 15 |
| ATCA | 9.0 | 14.18 | 130 | 11 |
| ATCA | 9.0 | 20.34 | 192 | 13 |
| ATCA | 9.0 | 27.27 | 84 | 27 |
| ATCA | 9.0 | 42.05 | 106 | 11 |
| ATCA | 9.0 | 62.60 | 66 | 13 |
| ATCA | 9.0 | 117.04 | 17 | 12 |
| ATCA | 18.0 | 27.25 | 144 | 28 |
| ATCA | 18.0 | 41.21 | <123 | 41 |
| ATCA | 18.0 | 62.72 | 158 | 41 |
| ATCA | 18.0 | 115.88 | <81 | 27 |
| ATCA | 34.0 | 20.20 | <372 | 124 |
| ATCA | 34.0 | 27.16 | <216 | 72 |
| ATCA | 34.0 | 41.20 | <138 | 46 |
| ALMA | 97.5 | 12.89 | 148 | 11 |
| ALMA | 97.5 | 19.72 | 141 | 11 |
| ALMA | 97.5 | 27.78 | 103 | 12 |
| ALMA | 97.5 | 42.70 | 57 | 14 |
| ALMA | 97.5 | 62.55 | <39.6 | 13.2 |
Note. We report the mean time postburst in all cases, including where observations span multiple, adjacent days.
Download table as: ASCIITypeset image
2.4. Centimeter: ATCA
We observed GRB 211106A with the Australia Telescope Compact Array (ATCA) at six epochs via DDT project CX493 (PIs: Laskar, Bhandari, Fong), with the first epoch taken at a midtime of 14.2 days after the burst. We used the dual-frequency, dual-polarization mode of the CABB correlator, with the two intermediate frequencies (IFs) tuned to different frequencies to maximize spectral coverage. We used the 4 cm (IFs tuned to 5.5 GHz and 9.0 GHz) receiver in each epoch and additionally observed at 15 mm (17 GHz/19 GHz) in four epochs and at 7 mm (33 GHz/35 GHz) in three epochs. We utilized PKS B1934−638 as bandpass and flux density calibrator and J2315−5018 as complex gain calibrator, except at 7 mm, where we utilized PKS B1921−238 as bandpass calibrator. The observations spanned multiple configurations.
We analyzed the data using standard reduction procedures in Miriad, treating each IF and each epoch separately, followed by imaging in CASA with two Taylor terms, employing Briggs weighting with a robust parameter of 0. To improve phase coherence in the data, we generated a deep image of the field by stacking the uv data from all epochs in each band separately and used the associated clean components as a model for self-calibrating the joint data set at each frequency (the target itself was not included in the model). After the second round of phase-only self-calibration, we subtracted the uv model from the visibilities to generate calibrated target-only data sets.
We combine and image the two IFs at 15 mm and at 7 mm together for maximum S/N and report the results at the mean frequencies of 18 GHz and 34 GHz in these bands, respectively. We image 5.5 and 9.0 GHz separately due to the large fractional bandwidth covered by the 4 cm receiver. We detect a radio counterpart at 5.5, 9.0, and 18 GHz at a position consistent with the mm-band position (Figure 3). There is insufficient flux in the 34 GHz images for self-calibration, and we report upper limits in this band from imaging of the field per epoch. We verify our results by performing point-source fitting directly in the uv domain for each epoch and frequency band separately using uvmodelfit in CASA and recover fluxes consistent within 1σ of those obtained from imaging. We present our ATCA flux density measurements in Table 2.
2.5. Optical and Near-IR: Hubble Space Telescope
Optical follow-up of GRB 211106A with the VLT yielded a deep nondetection at ≈2.9 days of R ≳ 26.4 mag (Malesani et al. 2021). We observed GRB 211106A with the Hubble Space Telescope (HST) over three epochs (at ≈19.1, 25.3, and 48.2 days after the burst, respectively) with the Wide Field Camera 3 (WFC3) in F110W (all epochs) and Advanced Camera for Surveys (ACS) in the F814W band (first and third epochs only) through program 16303 (PI: Berger). We aligned and drizzled each epoch using the Python-based code hst123 (Kilpatrick 2021) as described in Kilpatrick et al. (2022). In addition, we drizzled all F814W and F110W images into deeper combined images and determined their absolute world coordinate system in the Gaia eDR3 frame (with an rms astrometric uncertainty of 10 mas and 15 mas, respectively) using seven common astrometric standards in the HST imaging and Gaia catalog (Lindegren et al. 2021).
We perform image subtraction of the first two epochs relative to the final epoch to place a limit on the afterglow emission using hotpants (Becker 2015) with parameters identical to those used in Kilpatrick et al. (2022). We perform forced photometry at the location of the mm afterglow using an empirical point-spread function (PSF) constructed in the template image frames with photutils (Bradley et al. 2020) and list the resulting upper limits in Table 3.
Table 3. HST NIR Observations of GRB 211106A
| Time | Instrument | Object | Band | Magnitude | Uncertainty |
|---|---|---|---|---|---|
| (days) | |||||
| 19.05 | ACS | AG | F814W | >26.00 | … |
| 19.18 | WFC3/IR | AG | F110W | >27.01 | … |
| 25.26 | WFC3/IR | AG | F110W | >27.01 | … |
| Stack | ACS | H | F814W | 25.791 | 0.069 |
| Stack | WFC3 | H | F110W | 25.709 | 0.016 |
Note. Limits on the afterglow (AG) flux are computed by forced photometry on residual images obtained after subtracting the final epoch (at 48.15 days) from the given epoch. We report the photometry of object H identified in the stacks (Figure 5) in the last two rows.
Download table as: ASCIITypeset image
3. Host Association and Host Properties
To identify the most likely host galaxy, we compute the probability of chance coincidence, Pcc (Bloom et al. 2002) of the mm-band afterglow to nearby extended objects in the HST/F110W image and note this value next to the corresponding object in Figure 5. The ALMA and Chandra positions are at small angular offsets of 97 mas and 211 mas, respectively, from the center of an extended object, H. We measure mF814W = 25.791 ± 0.069 mag and mF110W = 25.709 ± 0.016 mag in a 03 aperture for this object. This yields low values of Pcc ≈ 5.5 × 10⁻⁴ and Pcc ≈ 2.6 × 10⁻³, for the ALMA and Chandra positions, respectively, where we have incorporated the localization uncertainty by combining it with the angular separation in quadrature.
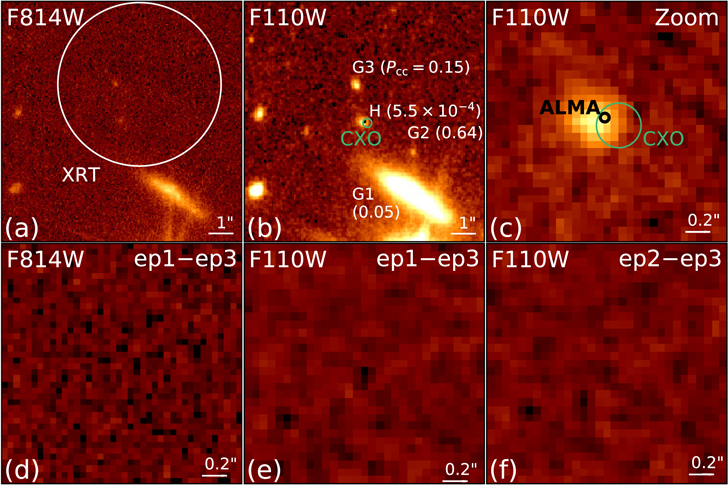
Figure 5. HST images of GRB 211106A from stacking all available epochs (top row) and difference imaging between epochs (bottom row). The ALMA position is coincident with a ≈25.7 mag optical counterpart, which has no detectable variability. (a) HST/F814W stack with the Swift/XRT 90% error circle, consistent with several potential matches. (b) HST/F110W stack with the Chandra (green, registered to HST; see Appendix C) and ALMA (black) 1σ error circles. Numbers indicate probabilities of chance coincidence of objects in the image with the ALMA afterglow. (c) Zoom into the F110W stack, showing the relative offset between the most likely host galaxy and the afterglow. (d) Difference image between the two observations (ep1 and ep3) taken in the F814W filter. (e) Difference image between the first (ep1) and third (ep3) observations in the F110W filter. (f) Difference image between the second (ep2) and third (ep3) observations in the F110W filter. No residual flux is detected in any difference image. Panels (a) and (b) are 10″ on a side and panels (c)–(f) are 2″ on a side. All panels are shown with the same color scale and are centered on the ALMA position, with north up and east to the left.
Download figure:
Standard image High-resolution imageIn contrast, we find much higher values of Pcc for other nearby objects, 26 marked G1, G2, and G3, in the HST/F110W stack. The next-lowest value of Pcc ≈ 0.05 is for galaxy G1 at z = 0.097 (Christensen et al. 2021) at a projected separation of 9 kpc (Figure 5). If located at the redshift of G1, object H would have an absolute magnitude of MH ≈ −12.5, corresponding to a luminosity L ≈ 6 × 10⁶ L⊙, which is much greater than that of the most-luminous globular clusters known (Rejkuba 2012). This rules out a globular cluster origin and instead implies that H is a background galaxy unrelated to G1. If the red color (R − F814W ≳ 0.6 mag) of H is due to the presence of the 4000 Å break between the R band and F814W, this would imply a redshift, z ≈ 0.7–1.4.
An alternative explanation for the observed red color is a dusty stellar population. However, this is not commensurate with the relatively blue F110W − F814W ≈ −0.1 mag color of H. To see this, we fit the observed fluxes of H with an intrinsic power-law model with Small Magellanic Cloud extinction (Pei 1992). We find both a large amount of intrinsic extinction, AV,H ≈ 2.9 mag and an extremely steep intrinsic spectrum, β ≈ 1.3 (corresponding to Fλ ∝ λ−3.3). This is steeper than the steepest observed UV spectral slope of local galaxies, β ≲ 0.5 (Wijesinghe et al. 2011), rendering a dusty origin of the red R − F814W color highly unlikely. To further test this, we fit the observed SED of H using CIGALE (Noll et al. 2009) at four different redshifts (z = 0.097, z = 0.5, z = 1, and z = 2; see Appendix D). While the fit at z = 1 is able to account for the red R − F814W color by ascribing the flux decrement to the 4000 Å break, fits at the other redshifts are systematically worse. This supports the hypothesis that H is unrelated to G1 and is at a moderately high redshift, z ≈ 1.
The observed F110W magnitude of object H corresponds to an absolute magnitude of M ≈ −16.2 (L ≈ 2 × 10⁸
L⊙ ≈ 0.02L*, roughly rest-frame I band) at z = 0.5 and M ≈ −17.7 (L ≈ 109
L⊙ ≈ 0.05L*, roughly rest-frame V band) at z = 1 (without K-corrections for the SED shape). Even without accounting for color corrections, this would place H at the low-luminosity end of the SGRB host luminosity function (Berger 2014). Alleviating this by supposing a redshift of z ≳ 1 would imply even more extreme properties for the afterglow (Section 5.2). Using the empirical PSFs derived from the image to fit H with an elliptical Gaussian model using galfit (Peng et al. 2002), we obtain an FWHM of 0260 ± 0
008 and axis ratio b/a = 0.73 ± 0.03 at position angle θPA = 68 ± 4 deg. Normalized to the host effective radius of σr
= FWHM/2.354 = 110 ± 3 mas, the offset of the ALMA afterglow is ≈0.9σr
. This corresponds to a physical separation of ≈0.6 kpc and ≈0.8 kpc at z = 0.5 and z = 1, respectively, placing GRB 211106A at the extreme lower end of the median SGRB offset distribution, both in terms of physical and host-normalized offsets (Berger 2014).
4. Multiwavelength Modeling
We now turn to an analysis of the extensive afterglow data. We interpret the observed X-ray to radio observations in the context of synchrotron radiation from an afterglow forward shock (FS) produced by the interaction of the relativistic GRB jet with its environment (Sari et al. 1998; Granot & Sari 2002). We assume a uniform density (ISM) environment (as expected for a compact binary progenitor) and a particle acceleration fraction, fNT = 1 (Eichler & Waxman 2005; Ressler & Laskar 2017). The parameters of this model are the isotropic-equivalent energy release (EK,iso), density of the environment (n0), the fraction of the shock energy given to relativistic electrons (e) with energy power-law index, p, and the fraction imparted to magnetic fields (
B). The resulting spectrum is characterized by three break frequencies: the self-absorption break (νa), the characteristic synchrotron frequency (νm), and the cooling break (νc). We include inverse-Compton (IC) cooling effects on the synchrotron spectrum, together with Klein–Nishina (KN) corrections (Sari & Esin 2001; Nakar et al. 2009; Jacovich et al. 2021).
4.1. Preliminary Considerations
The X-ray light curve can be fit as a single power law, 27 with decline rate αX = −0.97 ± 0.03 (Figure 2), which would imply p ≈ 1.9 if νc < νX and p ≈ 2.3 if νX < νc under the standard synchrotron framework (ignoring IC/KN effects). The expected spectral index in these cases is β ≈ −0.9 and β ≈ −0.6, respectively, both of which are consistent with the observed X-ray spectral index of βX = −0.92 ± 0.30. The X-ray data then suggest p ≈ 1.9–2.3, but do not yield a definitive constraint on the location of νc.
The ALMA 97.5 GHz light curve appears flat (Fν,3mm ≈ 0.15 mJy) from ≈13 to ≈20 days, after which it declines steeply as α3 mm≈ −1.5 (Figure 4). The shallow light curve before the break indicates that the spectral peak (νm) passes through the 3 mm band at ≈13–20 days with a flux density, Fν,m ≈ 0.15 mJy. The steepest decay at νm ≲ ν ≲ νc is expected to be α ≈ 3(1 − p)/4≈ −0.9 for p ≈ 2.2. Thus, unless there is a change in p, or it is much higher (i.e., p ≈ 3) than estimated from the X-ray light curve (p ≈ 2–2.3), the rapid postbreak decline suggests a jet break prior to the last ALMA detection at ≈43 days.
A broken power-law fit to the ATCA C-band (5.5 GHz) data yields a rise rate αC,1 = 0.26 ± 0.10, a decline rate αC,2 = −2.4 ± 0.8, break time 56 ± 4 days, and peak flux density,  mJy. The fact that the 5.5 GHz light curve does not decline appreciably until ≳42 days, whereas the ALMA light curve starts declining much earlier at ≲28 days is consistent with the interpretation of a jet break at ≲43 days and with a light-curve turnover in the radio/mm bands arising from the cascading passage of νm through the mm/cm bands.
Interpolating the X-ray light curve to the time of the VLT upper limit at ≈2.9 days, we find an X-ray to optical spectral index of βOX ≳ −0.39. This indicates that the optical flux is strongly suppressed relative to the expectation from the standard synchrotron model (βOX > −0.5). Furthermore, the observed X-ray spectral index βX ≈ −0.92 implies βOX − βX ≳ 0.52 and thus GRB 211106A satisfies the definition of a dark burst of both Jakobsson et al. (2004) and van der Horst et al. (2009). Several other SGRBs have been classified as dark (Berger et al. 2009; Fong et al. 2012; Berger et al. 2013), and we account for the dark nature by incorporating host extinction in our analysis using an SMC extinction model (Pei 1992).
Finally, our HST limits at ≳19 days cannot be used to place meaningful constraints on an AT2017gfo-like kilonova or previous SGRB kilonova candidates. The VLT limit at 2.9 days only probes to depths of comparable to ≈10 times the luminosity of AT 2017gfo for an assumed redshift of z = 0.5, while no meaningful constraints on kilonova emission can be derived from these optical/NIR observations at z = 1.0.
4.2. Markov Chain Monte Carlo Modeling
We now search the parameter space of p, EK,iso, n0, e,
B, tjet, and AV for the best-fit synchrotron model to the afterglow observations using Markov Chain Monte Carlo (MCMC) with emcee (Foreman-Mackey et al. 2013). The details of our implementation are described in Laskar et al. (2013, 2014). We include the effects of KN corrections for the first time (G. A. McCarthy & T. Laskar 2022, in preparation) using the prescription of Nakar et al. (2009) as described by Jacovich et al. (2021). We run 512 walkers for 2000 steps, discarding an initial period of 30–200 steps (judged by stationarity in the resulting posterior density function) as burn in. We use a uniform prior on p from 2.001 to 2.99 and on the intrinsic extinction, AV
≲ 8 mag. We restrict
 and
and  to the range ∈ (−7, 0) with the additional constraint
 e +
B < 1. We constrain
 (−10, 10) and EK,iso ∈ (1048, 5 × 1054). We use Jeffreys (1946) priors for these last four parameters. We also perform the analysis without IC/KN corrections in each case for comparison, resulting in a total of four sets of parameters. We summarize the results of our MCMC analysis in Table 4.
Table 4. Afterglow Model Parameters from Multiwavelength Modeling of GRB 211106A
| z | IC/KN | p |

|

|

|

| tjet | θjet | AV | EK |
|---|---|---|---|---|---|---|---|---|---|---|
| 1.0 | Y | 2.47 ± 0.05 |

|

|

|

|

| 15.51 ± 1.43 |

|

|
| 0.5 | Y | 2.59 ± 0.04 |

|

|

|

|

|

|

|

|
| 1.0 | N |

|

|

|

|

|

|

|

|

|
| 0.5 | N | 2.63 ± 0.03 |

|

|

|

|

|

|

| 51.54 ± 0.58 |
Note. Units are as follows: n0 is in cm−3, EK,iso and EK are in erg, tjet is in days, θjet is in degrees, and AV is in mag.
Download table as: ASCIITypeset image
We find that some of the derived parameters are sensitive to the choice of redshift. The cooling frequency is between the optical and X-rays in the z = 1 models, above the X-rays in the z = 0.5 model without IC/KN, and νc ≈ νX in the z = 0.5 model when including IC/KN. In addition, the parameters derived from including IC/KN effects are quite different from those without. We note that the fits achieved by turning off IC effects yield Compton Y parameters at νc of Yc < 1, where IC effects are indeed negligible (and vice versa), and thus all four sets of parameters are internally self-consistent. However, the fits without IC corrections are slightly systematically worse (maximum log-likelihood of  and 100.39 for the z = 0.5 and z = 1.0 fits, respectively) compared to the fits including IC/KN effects (
 and 108.22 for z = 0.5 and z = 1.0, respectively). Because the number of parameters in the models are the same, models with higher likelihoods are slightly statistically favored. Given the moderately high redshift of z ≈ 1 favored by the host SED, we focus the rest of the discussion on the z = 1.0 IC/KN model, with the understanding that some of the numerical results, in particular, are sensitive to these choices. We discuss the impact of the KN corrections in Appendix F. For completeness, we present the z = 1.0 model without IC/KN effects in Appendix E and include it in parameter comparisons below, where relevant.
For our fiducial parameter set (z = 1 with IC/KN corrections), we plot the correlation contours and marginalized posterior density functions in Figure 6. The parameters of the highest-likelihood model are EK,iso ≈ 1.9 × 1053 erg, n0 ≈0.5 cm−3, e ≈ 0.97,
B ≈ 5 × 10⁻⁶, and p ≈ 2.4. For this model, νm passes through the ALMA 3 mm band at ≈18 days with a flux density at νm of Fν,m ≈ 0.15 mJy, which is consistent with the constraints from the ALMA light curve. We also estimate a jet break time of tjet ≈ 29 days, consistent with the steepening observed in the cm- and mm-band light curves. We note that whereas we have provided ranges for the parameter AV, this parameter is unbounded above, because there was no detection of an optical transient associated with the event. However, we can establish a lower limit of AV ≳ 2.6 mag, corresponding to the value above which 99.7% of the MCMC samples reside. Our derived values of AV are consistent with the AV–NH,int correlations for dark GRBs (Zaninoni et al. 2013). We plot our model light curves and SEDs for the highest-likelihood parameter set in Figure 7.
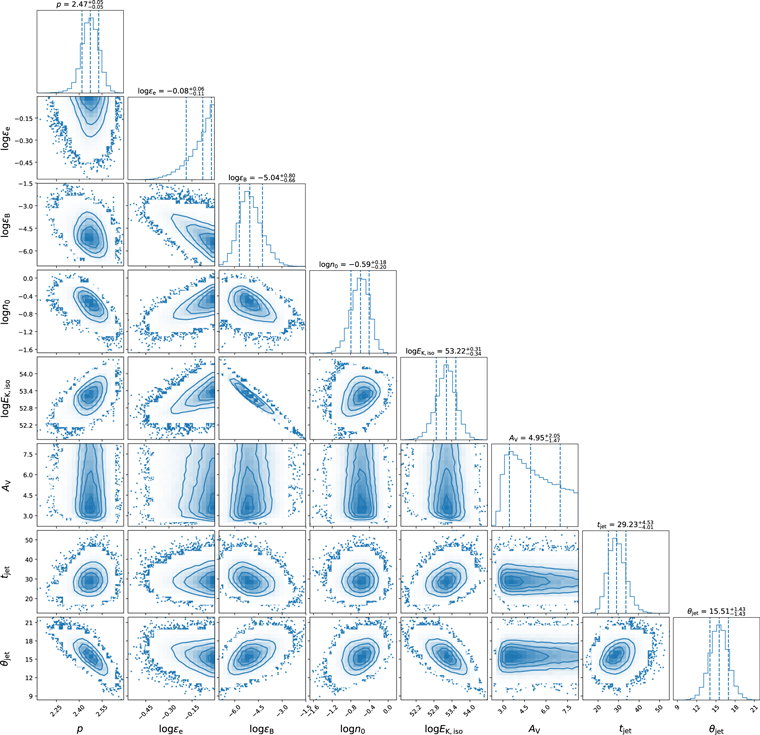
Figure 6. Correlations and marginalized posterior density from multiwavelength modeling of GRB 211106A at z = 1 (including IC/KN effects), with n0 in cm−3, EK,iso in erg, tjet in days, and the opening angle (θjet) in degrees. θjet is derived from EK,iso, n0, and tjet (Sari et al. 1999) and is not an independent free parameter. The contours enclose 39.3%, 86.4%, and 98.9% of the probability mass in each correlation plot (corresponding to 1σ, 2σ, and 3σ regions for two-dimensional Gaussian distributions), while the dashed lines in the histograms indicate the 15.9%, 50% (median), and 84.1% quantiles (corresponding to ± 1σ for one-dimensional Gaussian distributions). See Table 4 for a summary.
Download figure:
Standard image High-resolution image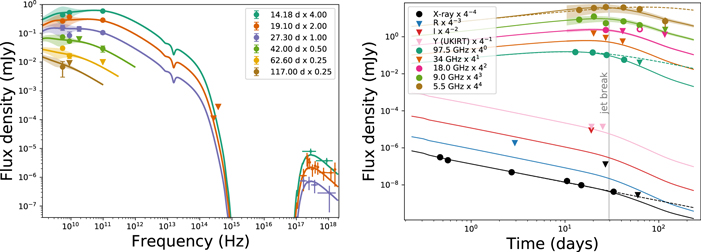
Figure 7. Left: Spectral energy distributions of the GRB 211106A afterglow from radio (circles) to X-rays (crosses) spanning from 14.18 to 117 days, together with a best-fit (highest-likelihood) forward-shock ISM model (lines) at z = 1.0, including expected contribution from interstellar scintillation (shaded bands). Triangles indicate upper limits. We have interpolated the radio observations, where necessary, to the common times for each epoch using broken power-law fits to the ALMA/ATCA 5.5 GHz light curves. Upper limits are not interpolated. The X-ray spectra have been scaled to the times of the SEDs using a broken power-law fit to the X-ray light curve. The HST upper limits require AV ≳ 2.6 mag of extinction in the host galaxy. Right: corresponding light curves with (solid) and without (dashed) a jet break. The model reproduces all observations, except for the 18 GHz detection at 62.7 days, which is masked during modeling (open circle). The turnover in the mm-band light curve and the steep decline in the cm-band light curve at ≳62.7 days require a jet break at tjet ≈ 29 days (gray, vertical line), constraining the jet opening angle to θjet ≈ 16°.
Download figure:
Standard image High-resolution imageFinally, we derive a very high value of e for both models upon inclusion of IC/KN effects. We note that the allowed range of
e spans a factor of ≈2 and furthermore this (and indeed all derived parameters) is degenerate with respect to the unknown electron participation fraction, fNT (Eichler & Waxman 2005). A value of fNT ≈ 0.1, as estimated from particle-in-cell simulations, would alleviate this issue by a corresponding factor (Sironi & Spitkovsky 2011). Capturing emission or absorption from thermal electrons would resolve this degeneracy (Ressler & Laskar 2017).
5. Discussion
5.1. The Jet Opening Angle
The ALMA mm-band observations of GRB 211106A were vital for constraining the jet break time and to derive the beaming-corrected energy unencumbered by scintillation effects in the cm-band and complications from IC/KN corrections in the X-ray band. This contribution is especially important in this case due to the absence of detectable optical afterglow emission, and because the jet break occurs after the X-ray afterglow has faded beyond the sensitivity of Chandra. The identification of the jet break, in combination with measurements of the circumburst density and energy for this burst, allows us to constrain the jet opening angle to θjet ≈ 16°, and this value appears relatively robust to the modeling uncertainties discussed above. The one notable exception in the case of the z = 0.5 model without IC corrections is driven by the extremely low density and high EK,iso, which itself arises from a strong degeneracy between these parameters for this model. 28 We find that removing the mm-band data from the fit and rerunning the MCMC results in similar degeneracies, further highlighting the importance of securing mm-band detections.
Eight other SGRBs have robust opening angle measurements 29 from identification of jet breaks in their light curves, with measured values of θjet spanning from 1° to 14° (Soderberg et al. 2006; Stratta et al. 2007; Nicuesa Guelbenzu et al. 2011; Fong et al. 2012, 2014; Troja et al. 2016; Lamb et al. 2019; Troja et al. 2019; O’Connor et al. 2021; Fong et al. 2021). Whereas an additional five events have robust lower limits on θjet (i.e., incorporating their EK,iso and n0), only one of these has a larger inferred lower limit than this (θjet ≳ 25° for GRB 050724A; Grupe et al. 2006). Thus, the opening angle for GRB 211106A is one of the widest inferred for SGRBs, and the resulting late jet break (tjet ≈ 29 days) is the latest observed in any SGRB. This confirms the finding of Fong et al. (2015) that afterglow observations at ≳25 days are essential for obtaining strong constraints on θjet. This late jet break ensures that the mm-band afterglow remains detectable for longer. We discuss the detectability of mm-band afterglows further in Section 5.3.
5.2. Afterglow Luminosity and Energetics
We find that the afterglow of GRB 211106A has several superlative properties. In comparison with the population of Swift/XRT SGRB afterglows, the X-ray afterglow of GRB 211106A is one of the most luminous at a comparable rest-frame time (Figure 2). Similarly, the cm afterglow of GRB 211106A is extremely long lived, and, at z = 1.0, is more luminous than any other SGRB radio afterglow (second-most luminous if at z = 0.5). The luminosity of this mm-band afterglow rivals that of several LGRBs (Figure 4). These properties are reflected in the high EK,iso ≈ 1.6 × 1053 erg (median value from the MCMC) in our fiducial model (z = 1 with IC/KN corrections), which is two orders of magnitude larger than the median values of EK,iso ≈ (1–3) × 1051 erg inferred for the SGRB population (Fong et al. 2015). This yields a prompt γ-ray efficiency of ηγ ≡ Eγ,iso/(EK,iso + Eγ,iso) ≈ 0.03 for the z = 1.0 model (≈0.02 at z = 0.5). This is the second-lowest prompt efficiency inferred for SGRBs after GRB 150101B with ηγ ≈ 10−3 but consistent with the wide range spanned by this parameter for SGRBs (Fong et al. 2015).
The true (beaming-corrected) energy is also high, with median values from the MCMC (in units of erg) of  and 50.3 for the z = 1 model with and without IC/KN corrections, respectively. To put this in context, we compute EK for all SGRBs that have published values of EK,iso and either measurements of or lower limits on θjet, resulting in a sample of 12 events from Fong et al. (2015) and 4 additional events published subsequently (Jin et al. 2018; Lamb et al. 2019; Troja et al. 2019; Fong et al. 2021; Rouco Escorial et al. 2021). We find that the highest value of EK was obtained for GRB 180418A (
 Rouco Escorial et al. 2021). Two additional events have
  values between those of the two z = 1 models (GRBs 120804 and 140930B, with
  and ≳50.3, respectively). The remaining 13 events all
  . This places GRB 211106A in the top ≳80% of SGRBs with measured beaming-corrected energy, making it one of the most energetic SGRBs to date. The mm-band detection was pivotal in this measurement, as it is the only band that samples both νm and Fν,m prior to the jet break, thus breaking the EK,iso–n0 degeneracy.
5.3. GRB 211106A and the Detectability of Millimeter-band SGRB Afterglows
It is reasonable to ask whether an unprecedented value of some physical property (e.g., high EK,iso, large opening angle) for GRB 211106A places it in a position in parameter space that makes this event uniquely suitable for detection in the mm band, or whether the improvement in sensitivity in the mm band with the advent of ALMA would have soon yielded such a discovery for an SGRB afterglow anyway. Alternatively, perhaps we simply missed previous mm afterglows because we did not observe them at the right time, and the relatively late commencement of the mm-band follow-up in this case coincidentally yielded just the right temporal sampling of the light curve. We now address these questions, beginning by investigating the mm-band light curves of all SGRBs with published mm-band upper limits in the context of the synchrotron model.
A total of 11 SGRBs have been observed in the mm band so far (Figure 4). Of these, three events have no afterglow detection at any wavelength (020531, 051105A, 140606A), and an additional two (GRB 050509B and GRB 060801) do not have data
30
of quality sufficient for constraining physical parameters. In Figure 8, we plot the mm-band observations for the remaining six SGRBs: GRB 080426 (de Ugarte Postigo et al. 2012), 130603B, 140622A, 140903A (Pandey et al. 2019), 131004A (Fong et al. 2015), and GRB 211106A (this work), along with model light curves corresponding to published values of the physical parameters for each event. Where multiple sets of physical parameters are available (e.g., for two different assumed values of B), we plot the more optimistic model (except in the case of GRB 130603B, as discussed below), which is always the one with lower assumed
B and higher inferred density.
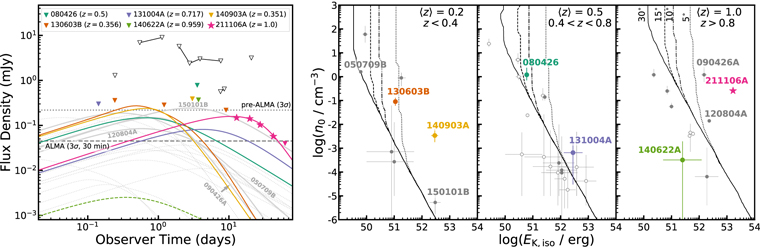
Figure 8. Left: theoretical 90 GHz light curves for 22 SGRBs (plus 211106A, magenta stars) with known redshift and published EK,iso and n0 (lines, including collimation effects, where a jet break has been inferred). Six events have mm-band observations (colored points and lines). Empty triangles are mm-band upper limits for an additional five SGRBs with unknown physical parameters. Previous observations have failed to detect mm-band afterglows owing to a combination of insufficient sensitivity (pre-ALMA; horizontal dotted line) and incommensurate cadence (Section 5.3); however, 9/23 events (indicated by solid lines) would have been detected by ALMA in 30 minutes on source (horizontal dashed line). Right: n0 vs. EK,iso for SGRB afterglows from Fong et al. (2015) divided into three redshift bins, with the median redshift and redshift range indicated in the upper-right corners. Events that have been observed in the mm band are indicated by colored circles and those with no measured redshifts are plotted as open circles at fiducial values of z = 0.5 or z = 1.0. The position of GRB 211106A is marked by the magenta star. The parameter space in each subplot is divided by lines at four different values of θjet (values indicated in the rightmost subpanel), to the right of which the afterglow is expected to be detectable with ALMA for ≳2 days (Section 5.3).
Download figure:
Standard image High-resolution imageIn the case of GRBs 080426, 131004A, and 140622A, we find that the peak flux of the mm-band light curve is below the only published upper limits for these events by factors of ≈5.3, 3.7, and 147, respectively. Two of these events have extremely low values of density (n0 ≈ 6.5 × 10⁻⁴ cm−3 for GRB 131004A and n0 ≈ 3.2 × 10⁻⁴ cm−3 for 140622A). Although the third (GRB 080426) has a higher density (n0 ≈ 1.2 cm−3), it also has one of the lowest inferred energies for SGRBs (EK,iso ≈ 6 × 1050 erg). For p ≈ 2.2 and at the typical SGRB redshift of z ≈ 0.5, the spectral peak flux density is given by  μJy (Granot & Sari 2002). This implies that SGRBs with n0 ≲ 10−2 cm−3 or EK,iso ≲ 1050 erg are unlikely to be detectable with both past and present mm-band facilities and confirms that these three previous events evaded detection due to their lower density or energy.
This leaves two events: GRBs 130603B and 140903A. Both the energy and density of GRB 130603B are higher than the above thresholds. For GRB 140903A, while the inferred density is low (n0 ≈ 3.4 × 10⁻³ cm−3), the energy (which has a stronger impact on Fν,m) is high (EK,iso ≈ 3 × 1052 erg), and thus both events should have been detectable by the metric of peak flux density. For these two events, the reason for mm-band nondetections appears to be their narrow collimation angles, θjet ≈ 6° and θjet ≈ 4°, respectively. Physically, narrower collimation corresponds to a lower true energy, EK. Observationally, the earlier jet break limits the peak flux of the mm-band light curve. In the case of GRB 140903A, the mm model light curve peaks at ≈0.24 mJy, which is lower than the spectral peak flux prior to the jet break (Fν,m ≈ 0.5 mJy) and below the PdBI upper limit of ≈0.4 mJy, thus explaining the mm-band nondetection. Two models are available for GRB 130603B with different values of B (Pandey et al. 2019). The model with lower
B and higher density actually overpredicts the existing mm-band observations (even upon including the jet break), and we can rule this model out. While the lower-density model does produce fluxes higher than the deepest upper limits for this event, the timing and depth of the epochs unfortunately do not probe the underlying light curve. The early observations were not deep enough, and by the time deeper observations were taken, the light curve would have faded below detectability due to the early jet break. This suggests that early, deep observations are essential to capture the mm counterparts of narrowly collimated/low-EK outflows.
The inferred energy and density for GRB 211106A (in all models) are higher than the thresholds discussed above. The wide opening angle and resulting late jet break (tjet ≈ 29 days) further drive the long-lived mm-band afterglow. Finally, the factor of 5–10 higher sensitivity of ALMA compared to CARMA and PdBI has further broadened the detectability window. To illustrate this, we plot model light curves for all 17 SGRBs at known redshifts with published EK,iso and n0 values (but without mm observations) as gray lines in the left panel of Figure 8. We find that the mm-band afterglows of 9/23 (39%) SGRBs (solid lines) would have been detectable for at least ≳2 days (observer frame) with ALMA, while only one event (GRB 150101B) satisfies this condition at pre-ALMA sensitivity levels.
To further quantify this, we compute the duration for which SGRB mm-band afterglows are detectable with ALMA at 3σ in 30 minutes of on-source integration time (Fν ≳ 50 μJy) at 90 GHz for different values of n0, EK,iso, and θjet and compare the results with the inferred parameters for a sample of 38 events from Table 3 of Fong et al. (2015), which forms an X-ray-complete parent sample spanning 10 yr. We plot the results, divided into three redshift bins, in the right panel of Figure 8. The mm-band afterglows of the events to the right of the lines (drawn for four different jet opening angles) are detectable with ALMA for more than 2 days. We find that, independent of the opening angle, GRB 211106A would have been detectable owing to its position in the n0–EK,iso space alone. Its wide jet (and hence, high EK) further ensured a high likelihood of discovery upon triggering of mm-band observations.
The detectability of the other events is contingent on their unknown opening angle (or, equivalently, their unknown true EK), although some events (especially at high redshift) simply cannot be detected owing to a combination of low density and/or energy, as previously suggested. Nine events fall to the right of the θjet = 5° line, and these events, even if narrowly collimated (i.e., with low EK), would have been detectable with ALMA. On the other hand, 22 events (58%) would not have been detectable for any value of their intrinsic θjet or EK.
If we assume that the sample of 38 events in Fong et al. (2015) is representative of the SGRB population, then if SGRBs with X-ray afterglows were to be uniformly followed up in the mm band, we might expect a conservative success rate of  (corresponding to the nine events that fall to the right of the θjet ≲ 5° lines) and a detection rate of rmm ≈ 9/10 ≈ 0.9 mm afterglows per year (as the sample spans 10 yr). For events with wider jets θjet ≳ 30°, the corresponding rates are
  and rmm ≈ 1.6 per year. These rates are even better than the discovery rates (≈7%) of SGRB afterglows in the cm-band (Fong et al. 2015). At pre-ALMA sensitivity levels, the mm-band detection rate is poorer by a factor of ≈3 with
  . We conclude that all three aspects (high density, wide opening angle/higher EK, and improved sensitivity) have contributed to the discovery of the mm-band afterglow of GRB 211106A. Systematic ALMA follow-up of SGRBs should yield a significant (24%–40%) discovery rate of mm-band afterglows, potentially outpacing cm-band detections.
6. Conclusions
We have presented ATCA, ALMA, HST, XMM-Newton, Chandra, Swift/XRT, Swift/BAT, and Fermi-GBM observations of GRB 211106A. Our γ-ray temporal and spectral analysis confirms this event as a bona fide short-duration GRB with exceptional afterglow properties. Our ALMA mm-band detection localizes the afterglow to a faint host galaxy at 0.7 ≲ z ≲ 1.4. A comparison of the X-ray, mm, and radio light curves of the afterglow to that of the SGRB population reveals that this event likely possessed one of the most-luminous SGRB afterglows at all these bands to date. The lack of an optical counterpart to deep limits implies a dust-obscured burst with an extinction, AV ≳ 2.6 mag, further consistent with the high intrinsic X-ray absorption column density.
We have presented the first mm-band afterglow detection of a short-duration GRB. Our well-sampled ALMA 97.5 GHz light curve for this event allows us to constrain the spectral peak frequency, peak flux density, and jet break time. We find a jet opening angle of θjet ≈ 16°, the largest yet measured for an SGRB, and the resultant beaming-corrected kinetic energy, EK ≈ 2 × 1050–6 × 1051 erg, is among the largest yet inferred for SGRBs. We conclude that the combination of high energy and high density, together with the improvement in sensitivity offered by ALMA, all contributed to the detection of this afterglow in the mm band. We find that a larger fraction (≈40%) of GRBs with known redshifts will be detectable with ALMA (compared to ≲16% with pre-ALMA facilities), but that the population will likely still be dominated by energetic events (EK,iso ≳ 1050 erg) in high-density (n0 ≳ 10−2 cm−3) environments. However, exceptions are possible for nearby (z ≲ 0.5) events.
The rapid triggering and archival of BAT data by the GUANO system enabled a prompt localization and afterglow follow-up for this event, underscoring the importance of rapid-response, software-based implementations for enhancing target-of-opportunity science with time-domain observatories such as Swift. The discovery of the cm-/mm-band counterpart ≳12 days after the trigger highlights the importance of sustained, deep radio follow-up of short-duration GRBs. The unusual energetics and host properties of GRB 211106A suggest that there may be even greater diversity in SGRB properties than currently known, necessitating continued identification, classification, and multiwavelength follow-up of these extreme events.
T.L. acknowledges support from the Radboud Excellence Initiative. The Fong Group at Northwestern acknowledges support from the National Science Foundation under grants AST-1814782, AST-1909358, and CAREER grant AST-2047919. W.F. gratefully acknowledges support from the David and Lucile Packard Foundation. E.B. acknowledges support from NSF and NASA grants. P.V. acknowledges support from NASA grant NNM11AA01A. S.B. is supported by a Dutch Research Council (NWO) Veni Fellowship (VI.Veni.212.058). Support for this work was provided by the National Aeronautics and Space Administration through Chandra Award Numbers GO1-22059X and DD1-22132X issued by the Chandra X-ray Center, which is operated by the Smithsonian Astrophysical Observatory for and on behalf of the National Aeronautics Space Administration under contract NAS8-03060. The scientific results reported in this article are based in part on observations made by the Chandra X-ray Observatory. This work is based on observations obtained with XMM-Newton, an ESA science mission with instruments and contributions directly funded by ESA Member States and NASA. This work made use of data supplied by the UK Swift Science Data Centre at the University of Leicester. This research is based on observations made with the NASA/ESA Hubble Space Telescope obtained from the Space Telescope Science Institute, which is operated by the Association of Universities for Research in Astronomy, Inc., under NASA contract NAS 5-26555. These observations are associated with program 16303. This paper makes use of the following ALMA data: ADS/JAO.ALMA#2019.1.00863.T. ALMA is a partnership of ESO (representing its member states), NSF (USA) and NINS (Japan), together with NRC (Canada), MOST and ASIAA (Taiwan), and KASI (Republic of Korea), in cooperation with the Republic of Chile. The Joint ALMA Observatory is operated by ESO, AUI/NRAO and NAOJ. The National Radio Astronomy Observatory is a facility of the National Science Foundation operated under cooperative agreement by Associated Universities, Inc. The Australia Telescope Compact Array is part of the Australia Telescope National Facility which is funded by the Australian Government for operation as a National Facility managed by CSIRO. We acknowledge the Gomeroi people as the traditional owners of the Observatory site.
Appendix A: The BAT/GUANO Localization
The highest-likelihood position of GRB 211106A as determined by the NITRATES analysis is close to the edge of BAT’s coded field of view (FOV) with only 3.9% of the detector plane coded, which precludes localization of the burst via the traditional coded aperture imaging techniques. To illustrate this, we generate BAT sky images with the event data from GUANO, which reveals a source with S/N 3.58 at the best-fit position from NITRATES. However, performing traditional image-domain analysis on this BAT sky image, we find that this source is only the 172nd (!) most-likely position for the burst, and thus the event is entirely hidden in the noise in the image domain.
From NITRATES, the difference in log-likelihood between this best-fit position and other positions in the BAT FOV is ΔLLHPeak = 6.7, and between this best-fit position and the best-fit out-of-FOV position is ΔLLHOut = 7.2. These measure the statistical preference for the specific arcminute-scale position derived by NITRATES compared to other possible positions on the sky, and the confidence that the burst originated from a position within BAT’s coded FOV, respectively. Both of these values are on the extreme lower boundary for confident locations that can be derived from BAT data, and thus the position was initially reported as a “candidate” localization (Tohuvavohu et al. 2021).
Of all events ever successfully localized with BAT and subsequently confirmed via afterglow discovery to date, GRB 211106A is the weakest in the image domain. It is also the first short burst discovered and localized by GUANO with a confirmed afterglow. This highlights the power of the NITRATES technique in localizing weak (in particular, short) GRBs, which would otherwise be impossible to follow up and characterize, with traditional imaging-based γ-ray techniques alone.
Appendix B: Classification Model Parameters
The density of the points in the duration–hardness plane is described by two, two-dimensional log-normal distributions. One component has the following form:

where X is a vector composed of ( ), V is the matrix of variances, and
  is a vector containing the means. To calculate the probability of a GRB being short, we have

where the w parameters indicate the weight of the two components (wshort = 1 − wlong). For the component describing the short class in Figure 1, and also in Rouco Escorial et al. (2021), we have wshort = 0.2094,  , and
, and

while for the long population: wlong = 0.7906,  and
and

Appendix C: Refined X-Ray Astrometry
We derive a refined X-ray afterglow position by registering the Chandra and HST images on a common reference frame. Because there are no sources in common between the two, we proceed via a Legacy Survey image of the field, which we tie to the HST reference frame using 15 sources (σtie,Legacy−HST = 003). We tie the Chandra image to Legacy using two common sources (σtie,Legacy,Chandra = 0
15). The Chandra position in the HST frame is R.A. = 22h54m20
518, decl. = −53d13′ 50
590, uncertainty 0
18, including the combined uncertainty in the astrometric tie and the centroid uncertainty from Chandra. This is the circle labeled “CXO” plotted in Figure 5.
Appendix D: Host-galaxy SED Fits
We fit the SED of the host galaxy (H) of GRB 211106A with CIGALE (Noll et al. 2009) following Heintz et al. (2020) at four different redshifts (z = 0.097, z = 0.5, z = 1, and z = 2) and present the best-fit models, together with the corresponding residuals, in Figure D1. The z = 0.097 model severely overpredicts the R-band upper limit, ruling out a redshift of z = 0.097 for the host galaxy. The red R − F814W color requires a break between the two bands, which is most easily explained as a 4000 Å break, suggesting a redshift of z ≈ 0.7–1.4 (Section 3). The available photometry is too sparse to further constrain the host-galaxy properties. Further photometric or spectroscopic observations (e.g., with JWST) could help constrain important parameters such as the true redshift and the host-galaxy extinction.
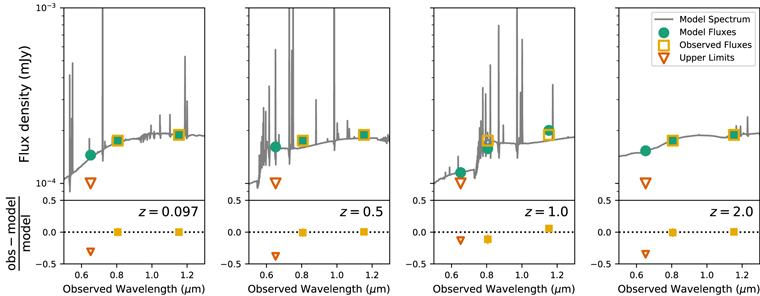
Figure D1. SEDs of the host galaxy of GRB 211106A in the R band (triangle), F814W, and F110W (squares), together with SED models from CIGALE at three redshifts (gray lines) with the model fluxes as green circles. The red R − F814W color suggests a redshift, z ≈ 1.
Download figure:
Standard image High-resolution imageAppendix E: Model without IC/KN Corrections
Here we briefly discuss the z = 1 parameter set without IC/KN corrections. The parameters of the corresponding highest-likelihood model are EK,iso ≈ 3.9 × 1051 erg, n0 ≈ 8.0 × 10⁻³ cm−3, e ≈ 0.24,
B ≈ 0.75, tjet ≈ 32 days, p ≈ 2.15, and AV ≳ 3.2 mag. The break frequencies at ≈1 day are νm ≈ 3.9 × 10¹² Hz and νc ≈ 2.0 × 10¹⁵ Hz. Like in the model incorporating IC/KN effects, νa is below the radio band and is not constrained. The flux density at νm is Fν,m ≈ 0.14 mJy. This model yields a slightly worse fit to the X-ray and ALMA light curves but is otherwise similar to the z = 1 model with the IC/KN effects presented above. The values of tjet and θjet and the limits on AV in this model are similar to those inferred when including IC/KN effects. The value of
e/
B ≈ 0.3 is very different from the value of ≈105 for the IC/KN model, which is expected, as this ratio is proportional to the Compton Y parameter and IC/KN effects are only important for Y ≳ 1. We note that previous studies have been unable to constrain these microphysical parameters individually in almost all cases due to a paucity of data, and have usually assumed fiducial values (e.g.,
e = 0.1 and
B = 0.1 or 0.01) for them. The best-fit and median MCMC values for EK,iso and n0 for this model are comparable to their median values for SGRBs, also derived without including IC/KN effects (Fong et al. 2015). However, the beaming-corrected kinetic energy, EK ≈ 1.6 × 1050, remains at the extreme high end of the distribution for EK (Section 5.2).
Appendix F: Impact of the Klein–Nishina Correction
In the highest-likelihood z = 1.0 model, the value of the electron index is constrained to p = 2.47 ± 0.05. This is steeper than that derived by applying standard closure relations to the X-ray light curve, and the difference can be explained by IC cooling. For the highest-likelihood parameters, we find Yc ≈ 280 with νc < νX; however, this value decreases with time, resulting in nonstandard light-curve evolution because  . For these parameters, IC cooling is weakly KN suppressed, and the spectral ordering at ≈1 day is
  , where
  is the KN break corresponding to electrons unable to cool efficiently by IC emission while radiating above νc (Nakar et al. 2009). The expected spectral index in this regime is β = 3(1 − p)/4 ≈ −1.1, consistent with the observed X-ray spectral index, βX = −0.92 ± 0.30. The expected light curve
31
in this regime is α = 7(1 − p)/8 + (p − 2)/2 ≈ −1.0 (Nakar et al. 2009; Laskar et al. 2018), which is consistent with the observed value of αX = −0.97 ± 0.03. We note that a similar slower evolution of the X-ray light curve in GRB 161219B was previously explained as arising from the same spectral regime (Laskar et al. 2018), although here we also incorporate the effects of an evolving Yc(t).
is the KN break corresponding to electrons unable to cool efficiently by IC emission while radiating above νc (Nakar et al. 2009). The expected spectral index in this regime is β = 3(1 − p)/4 ≈ −1.1, consistent with the observed X-ray spectral index, βX = −0.92 ± 0.30. The expected light curve
31
in this regime is α = 7(1 − p)/8 + (p − 2)/2 ≈ −1.0 (Nakar et al. 2009; Laskar et al. 2018), which is consistent with the observed value of αX = −0.97 ± 0.03. We note that a similar slower evolution of the X-ray light curve in GRB 161219B was previously explained as arising from the same spectral regime (Laskar et al. 2018), although here we also incorporate the effects of an evolving Yc(t).
Footnotes
- 19
- 20
See Appendix A for details of the NITRATES localization.
- 21
- 22
- 23
Details of the Gaussian mixture model are presented in Appendix B.
- 24
- 25
Following Table 5 in Plucinsky et al. (2017) and relative to Chandra/ACIS-S3, these constants are 0.87, 0.90, 0.98, and 1.0 for XRT-PC, EPIC-pn, MOS1, and MOS2, respectively.
- 26
To compute observed magnitudes for the other objects, we fit the surrounding field using galfit and empirical PSFs and scale the magnitudes to that of object H.
- 27
We employ the convention Fν ∝ tα νβ throughout.
- 28
In this model, νc > νX and is unconstrained, resulting in additional model parameter degeneracies.
- 29
We exclude GRB 150424A, for which the reported opening angle assumes values for both n0 and EK,iso (Jin et al. 2018).
- 30
The X-ray light curve of GRB 050509B is poorly sampled and that of GRB 060801 is dominated by an initial steep decay. Neither event was detected at any other wavelength.
- 31
The first term arises from the different spectral index above νc and the second from the evolution of Yc with time.