Abstract
The first source catalog of the Large High Altitude Air Shower Observatory (LHAASO) reported the detection of a very high energy gamma-ray source, 1LHAASO J1219+2915. This Letter presents a further detailed study of the spectral and temporal behavior of this pointlike source. The best-fit position of the TeV source (R.A. = 18505 ± 0
04, decl. = 29
25 ± 0
03) is compatible with NGC 4278 within ∼0
03. Variation analysis shows an indication of variability on a timescale of a few months in the TeV band, which is consistent with low-frequency observations. Based on these observations, we report the detection of TeV γ-ray emissions from this low-luminosity active galactic nucleus. The observation by LHAASO's Water Cherenkov Detector Array during the active period has a significance level of 8.8σ with a best-fit photon spectral index Γ = 2.56 ± 0.14 and a flux f1–10 TeV = (7.0 ± 1.1sta ± 0.35syst) × 10−13 photons cm−2 s−1, or approximately 5% of the Crab Nebula. The discovery of VHE gamma-ray emission from NGC 4278 indicates that compact, weak radio jets can efficiently accelerate particles and emit TeV photons.
Original content from this work may be used under the terms of the Creative Commons Attribution 4.0 licence. Any further distribution of this work must maintain attribution to the author(s) and the title of the work, journal citation and DOI.
1. Introduction
Active galactic nuclei (AGNs) exhibit diverse emissions across the electromagnetic spectrum, with gamma-ray emissions playing a crucial role in understanding ultra−high-energy (UHE) cosmic-ray acceleration and AGN physics. The very high energy (VHE, ≳0.1 TeV) extragalactic gamma-ray sky primarily comprises radio-loud AGNs (see TeVCat, http://tevcat.uchicago.edu/), particularly blazars, with relativistic jets directed toward us, enhancing emissions owing to beaming effects (Urry & Padovani 1995). Of the 89 known VHE AGNs, 83 are blazars (10 flat spectrum radio quasars (FSRQs) and 73 BL Lacs) with relativistic jets close to the line of sight, leading to enhanced broadband emissions from relativistic beaming. Blazar gamma-ray emissions stem from either leptonic processes, i.e., inverse Compton scattering by energetic electrons, or hadronic processes involving π0 meson decay or synchrotron radiation from ultrarelativistic protons. In addition to VHE blazars, there are also four VHE radio galaxies (RGs) and two VHE AGNs exhibiting both RG and BL Lac properties: IC 310 and PKS 0625−35 (see TeVCat and Rulten 2022). According to unified schemes of radio-loud AGNs, RGs are the parent population of blazars, with jet directions misaligned with the line of sight, resulting in less beamed emissions (Urry & Padovani 1995). These detected 4+2 VHE RGs all belong to the Fanaroff-Riley I subclass, characterized by bright jets in the center with edge-darkened radio structures (Fanaroff & Riley 1974). The origin of VHE emissions from FRI RGs remains unclear but may be attributed to stratified jets (Ghisellini et al. 2005), extended jet emission regions (H.E.S.S. Collaboration et al. 2020b), or the vicinity of black holes (Levinson & Rieger 2011). VHE emissions offer a unique view into the extreme physical processes within AGN jets, particularly in misaligned RGs. Current observations of VHE emissions from AGNs primarily operate in pointing mode, targeting objects during flaring states. The lack of uniform coverage across the VHE sky impacts the completeness of the VHE AGN catalog, especially for low-luminosity AGNs (LLAGNs).
LLAGNs are very common in the nearby universe and occupy the bulk of the fainter end of the AGN luminosity population (Ho 1999; Nagar et al. 2005; Ho 2008). They exhibit low bolometric luminosity relative to Eddington luminosity (Lbol/LEdd ∼ 10−6 to 10−4), lack a prominent big blue bump and Fe Kα line, and show flat or inverted radio spectra (Ho 1999, 2008), with radio variability typically on month-long timescales (Nagar et al. 2002; Anderson & Ulvestad 2005; Ho 2008). Their radio-loudness increases at lower luminosities (Maoz 2007; Ho 2008), and they are generally more radio-loud than typical AGNs (Nagar et al. 2005). These systems exhibit radiatively inefficient accretion flow (RIAF), due to low accretion rates (Ho 2008). Studying VHE emissions from these sources can offer insights into diverse mechanisms responsible for VHE emission in AGN jets, especially regarding jet−environment interactions, and aid in understanding the origin of the γ-ray background.
The first Large High Altitude Air Shower Observatory (LHAASO) source catalog reported the detection of the VHE gamma-ray source 1LHAASO J1219+2915 (LHAASO Collaboration et al. 2024). Because of its possible association with NGC 4278, in this Letter a further detailed study of the spectral and temporal behavior of this pointlike source has been performed with better statistics. NGC 4278, a typical LLAGN classified as a LINER owing to its weak Hα line, has a central black hole mass of ≈3 × 10⁸ M⊙ at distance DL = 16.4 Mpc (Tonry et al. 2001), with an Eddington ratio of ≈5 × 10⁻⁶ (Hernández-García et al. 2014), indicative of RIAF.
The Letter is structured as follows: Section 2 introduces the LHAASO detector and data set. Section 3 details the multi-TeV gamma-ray detection from the LLAGN NGC 4278, including spectral and variability analysis. Section 4 compares this with other VHE AGNs. Throughout, a ΛCDM cosmology from Planck results is adopted, with parameters Ωm = 0.32, ΩΛ = 0.68, and H0 = 67.4 km s−1 Mpc−1 (Planck Collaboration et al. 2020).
2. The LHAASO Experiment and Data
LHAASO is located at an altitude of 4410 m on Haizi Mountain (29°21′276 north, 100°08′19
6 east) in Daocheng, Sichuan Province, China. It consists of the KiloMeter-square Array (KM2A), Water Cherenkov Detector Array (WCDA), and Wide Field-of-view Cherenkov Telescope Array (WFCTA). Details about the instruments can be seen in Ma et al. (2022). LHAASO is a multi-scientific-purpose Extensive Air Shower (EAS) array designed to detect cosmic rays and gamma-ray air showers in a wide energy range, from sub-TeV to beyond 1 PeV. The WFCTA primarily focuses on cosmic-ray physics, while the KM2A and WCDA are mainly dedicated to gamma-ray astronomy. The WCDA is sensitive to gamma rays from sub-TeV to tens of TeV, and KM2A is sensitive from tens of TeV to several PeV. With a large detector area and excellent gamma-ray/background discrimination power, the sensitivity of LHAASO for both VHE and UHE gamma-ray observations is much better than that of any other EAS experiment.
The results presented here were mainly obtained using WCDA data taken between 2021 March 5 and 2023 October 31. The effective live time is about 891 days. For good quality of reconstruction, the following cuts are applied for both the experimental data and the simulated samples:
- (1)Events should have at least 60 fired detector units, Nhit ≥ 60.
- (2)Events should have a zenith angle less than 50°, θ ≤ 50°.
- (3)For every shower event, a variable called RMDS was determined as the root of mean distance square for shower core fitting in units of meters based on the top 10 hottest detectors. RMDS ≤ 20 m is required for better resolution of the shower core position.
- (4)The Gamma/Proton separation parameter,
 (Abeysekara et al. 2017), is required to be less than 1.12, 1.02, 0.90, 0.88, 0.84, and 0.84 for segments with Nhit value of [60–100), [100–200), [200–300), [300–500), [500–800), and [800–2000], respectively.

After applying these cuts, WCDA recorded around 8.3 × 10⁹ gamma-like events. Further details about the detector and reconstruction of WCDA can be found in LHAASO Collaboration et al. (2021b). LHAASO-KM2A data for the same time period are also used for this work, with about 1.3 × 10⁷ gamma-like events after quality cuts. Details about LHAASO-KM2A quality cuts can be found in LHAASO Collaboration et al. (2021a).
3. Analysis and Results
The event and background maps are generated in celestial coordinates (R.A. and decl. in epoch J2000.0) with a grid size of 01 × 0
1. The “direct integration method” (Fleysher et al. 2004) is employed to estimate the number of background events. In this work, the integration time is set to 4 hr, and events within the regions of the Galactic plane (∣b∣ < 10°) and gamma-ray sources (with a spatial size less than 5°) are excluded from the background estimation. The excess source map is then obtained by subtracting the background map from the event map.
For WCDA the events are grouped into six analysis bins based on the effective number of fired PMTs, allowing us to extract the energy spectrum of gamma-ray sources. Using the Crab Nebula trajectory as a reference, the corresponding energies range from 0.5 to 20 TeV. To convert the gamma-ray counts to flux, the detector response is calculated from simulated data samples. These are generated with the air shower simulation code CORSIKA (Heck et al. 1998) and the detector simulation package G4WCDA (LHAASO Collaboration et al. 2021b). The energy of simulated gamma rays is sampled from 1 GeV to 1 PeV along the Crab Nebula trajectory up to a zenith angle of 70°. For KM2A data, considering the reconstructed energy resolution and statistics, one decade of reconstruction energy, Erec, is divided into five bins with a width of  , for both event and background maps.
A multidimensional maximum likelihood analysis based on the forward folding method (LHAASO Collaboration et al. 2021a) is applied to fit the excess maps to estimate the position and photon flux of the sources with five free parameters: R.A. α, decl. δ, extension σ, differential flux ϕ0 at Epiv, and photon spectral index Γ. While propagating toward Earth, extragalactic VHE photons may be absorbed by the extragalactic background light (EBL) through the pair production process (γ
γ → e+
e−). In this work a power-law spectrum with attenuation  is assumed as the observed spectral energy distribution (SED) of the source. The reference energy Epiv is fixed at 3 TeV, and τ(E) is the photon attenuation derived from the EBL model (Saldana-Lopez et al. 2021) as a function of energy at the distance DL
= 16.4 Mpc (Tonry et al. 2001). A likelihood ratio test is performed on a test statistic,
is assumed as the observed spectral energy distribution (SED) of the source. The reference energy Epiv is fixed at 3 TeV, and τ(E) is the photon attenuation derived from the EBL model (Saldana-Lopez et al. 2021) as a function of energy at the distance DL
= 16.4 Mpc (Tonry et al. 2001). A likelihood ratio test is performed on a test statistic,  c. Here
  refers to the signal plus background model and
  refers to the background-only model. Then, TS is numerically maximized by iteratively varying the input parameters. It should be pointed out that for the light-curve estimation the spectral index was fixed to the value of the full-time period and only the differential flux value was left free to vary in the likelihood maximization.
3.1. Light Curve
The top panel of Figure 1 shows the accumulated excess as a function of time from the source near NGC 4278. A rapid change in the slope is obvious, indicating variable γ-ray emission. In order to further quantify this variable behavior, we have binned the light curve into 2-week intervals (14 transits), as shown in the middle panel of Figure 1. The Bayesian blocks algorithm (Scargle et al. 2013) is applied to identify the optimal source states. An active state, which started on MJD 59449 and ended on MJD 59589 with a duration of 140 days, has been identified. It is depicted as a red box car curve in the middle panel of Figure 1. It should be noted that negative flux points are shown in this figure, even though they are not physical. This occurs when low statistics lead to a low fluctuation of the event count rate relative to the background estimation, which also explains the occasional decline in the cumulative count. The significance of the dip around MJD = 60184 is −2.6σ, which is equivalent to a post-trial probability of 0.55 (−0.58σ).
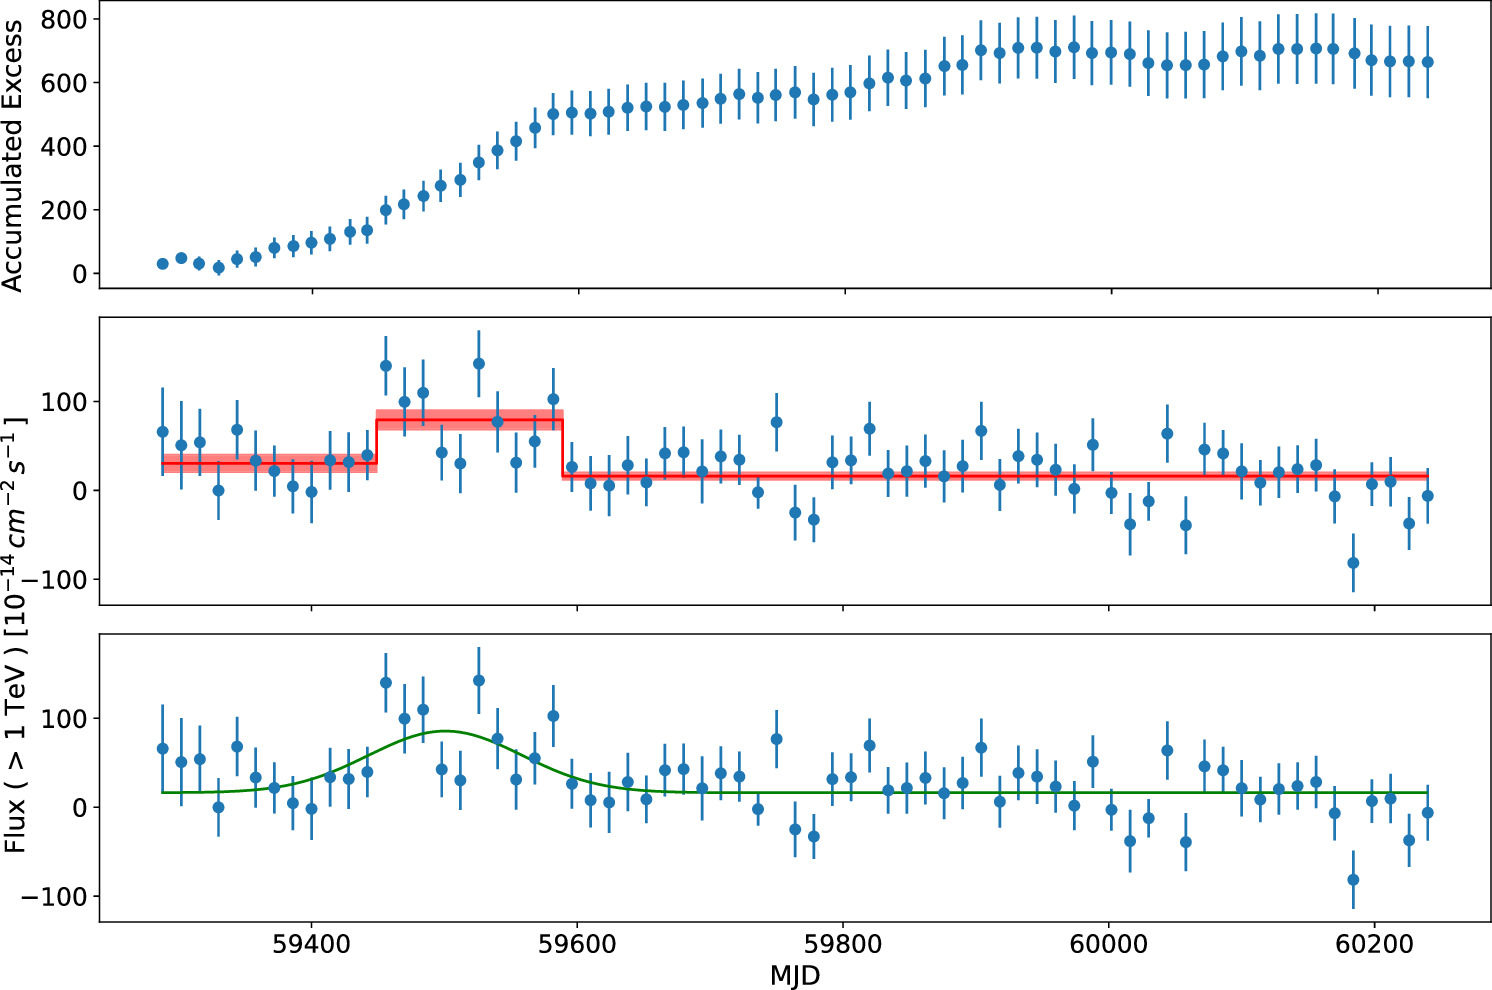
Figure 1. The light curves of NGC 4278. Top panel: the cumulative excess light curve. Middle and bottom panels: flux light curves. The red line in the middle panel is the result from Bayesian blocks analysis, and the green line in the bottom panel is the fitting result from a combined Gaussian function with the parameters as reported in the text.
Download figure:
Standard image High-resolution imageAdditionally, based on the likelihood variability test (HAWC Collaboration et al. 2017), we computed the probability that the source flux is constant throughout the observation period. We obtained a TS value of 105.1, which corresponds to a p-value of 2.6 × 10⁻³ and indicates a variable nature of the TeV emission from this source. Notably, the pretrial significance map with the variable duration has reached 8.8 standard deviations (as shown in the next section). This is significantly higher than the significance of a stable source behavior during the same time period, which is less than 2 standard deviations.
In addition, we also fit the biweekly light curve in another way. The green line in the bottom panel of the figure displays the fitting result using a combination of a constant term and a Gaussian function to describe the variable behavior in time, i.e.,  , with best-fit parameters of t0 = 59501±15, τs
= 58 ± 16 days, Fc
= (16.3 ± 4.5) × 10−14 cm−2 s−1 (denoting the stable amplitude), and F0 = (69.4 ± 16.6) × 10−14 cm−2 s−1 (denoting the variable amplitude). It is interesting to note that the timescale width obtained by this method is consistent with the result of the Bayesian analysis above, within uncertainties. Thus, based on current observation of data, there is likely a variability timescale on the order of a few months.
, with best-fit parameters of t0 = 59501±15, τs
= 58 ± 16 days, Fc
= (16.3 ± 4.5) × 10−14 cm−2 s−1 (denoting the stable amplitude), and F0 = (69.4 ± 16.6) × 10−14 cm−2 s−1 (denoting the variable amplitude). It is interesting to note that the timescale width obtained by this method is consistent with the result of the Bayesian analysis above, within uncertainties. Thus, based on current observation of data, there is likely a variability timescale on the order of a few months.
3.2. Significance Map
The top left panel of Figure 2 is the significance map for events with Nhit larger than 60 in all 891 days of WCDA observations. If the photon spectral index is assumed to be 2.62, the median energy of Nhit ≥ 60 is around 1 TeV, and the source is detected with a pretrial statistical significance of 7.6σ. Then, the trial factor is estimated as ![${\rm{\Omega }}/[2\pi (1-\cos (0.^\circ 5))]=3.5\times {10}^{4}$](https://content.cld.iop.org/journals/2041-8205/971/2/L45/revision1/apjlad5e6dieqn8.gif) , where Ω represents the solid angle of the LHAASO sky survey range with decl. from −20° to 80°, and 0
, where Ω represents the solid angle of the LHAASO sky survey range with decl. from −20° to 80°, and 05 is the point-spread function in this energy range. After accounting for the trial factor, the post-trial significance is 6.1σ. And during the quasi-quiet state when the source is not active, the pretrial significance is around 4.2σ from WCDA observation.
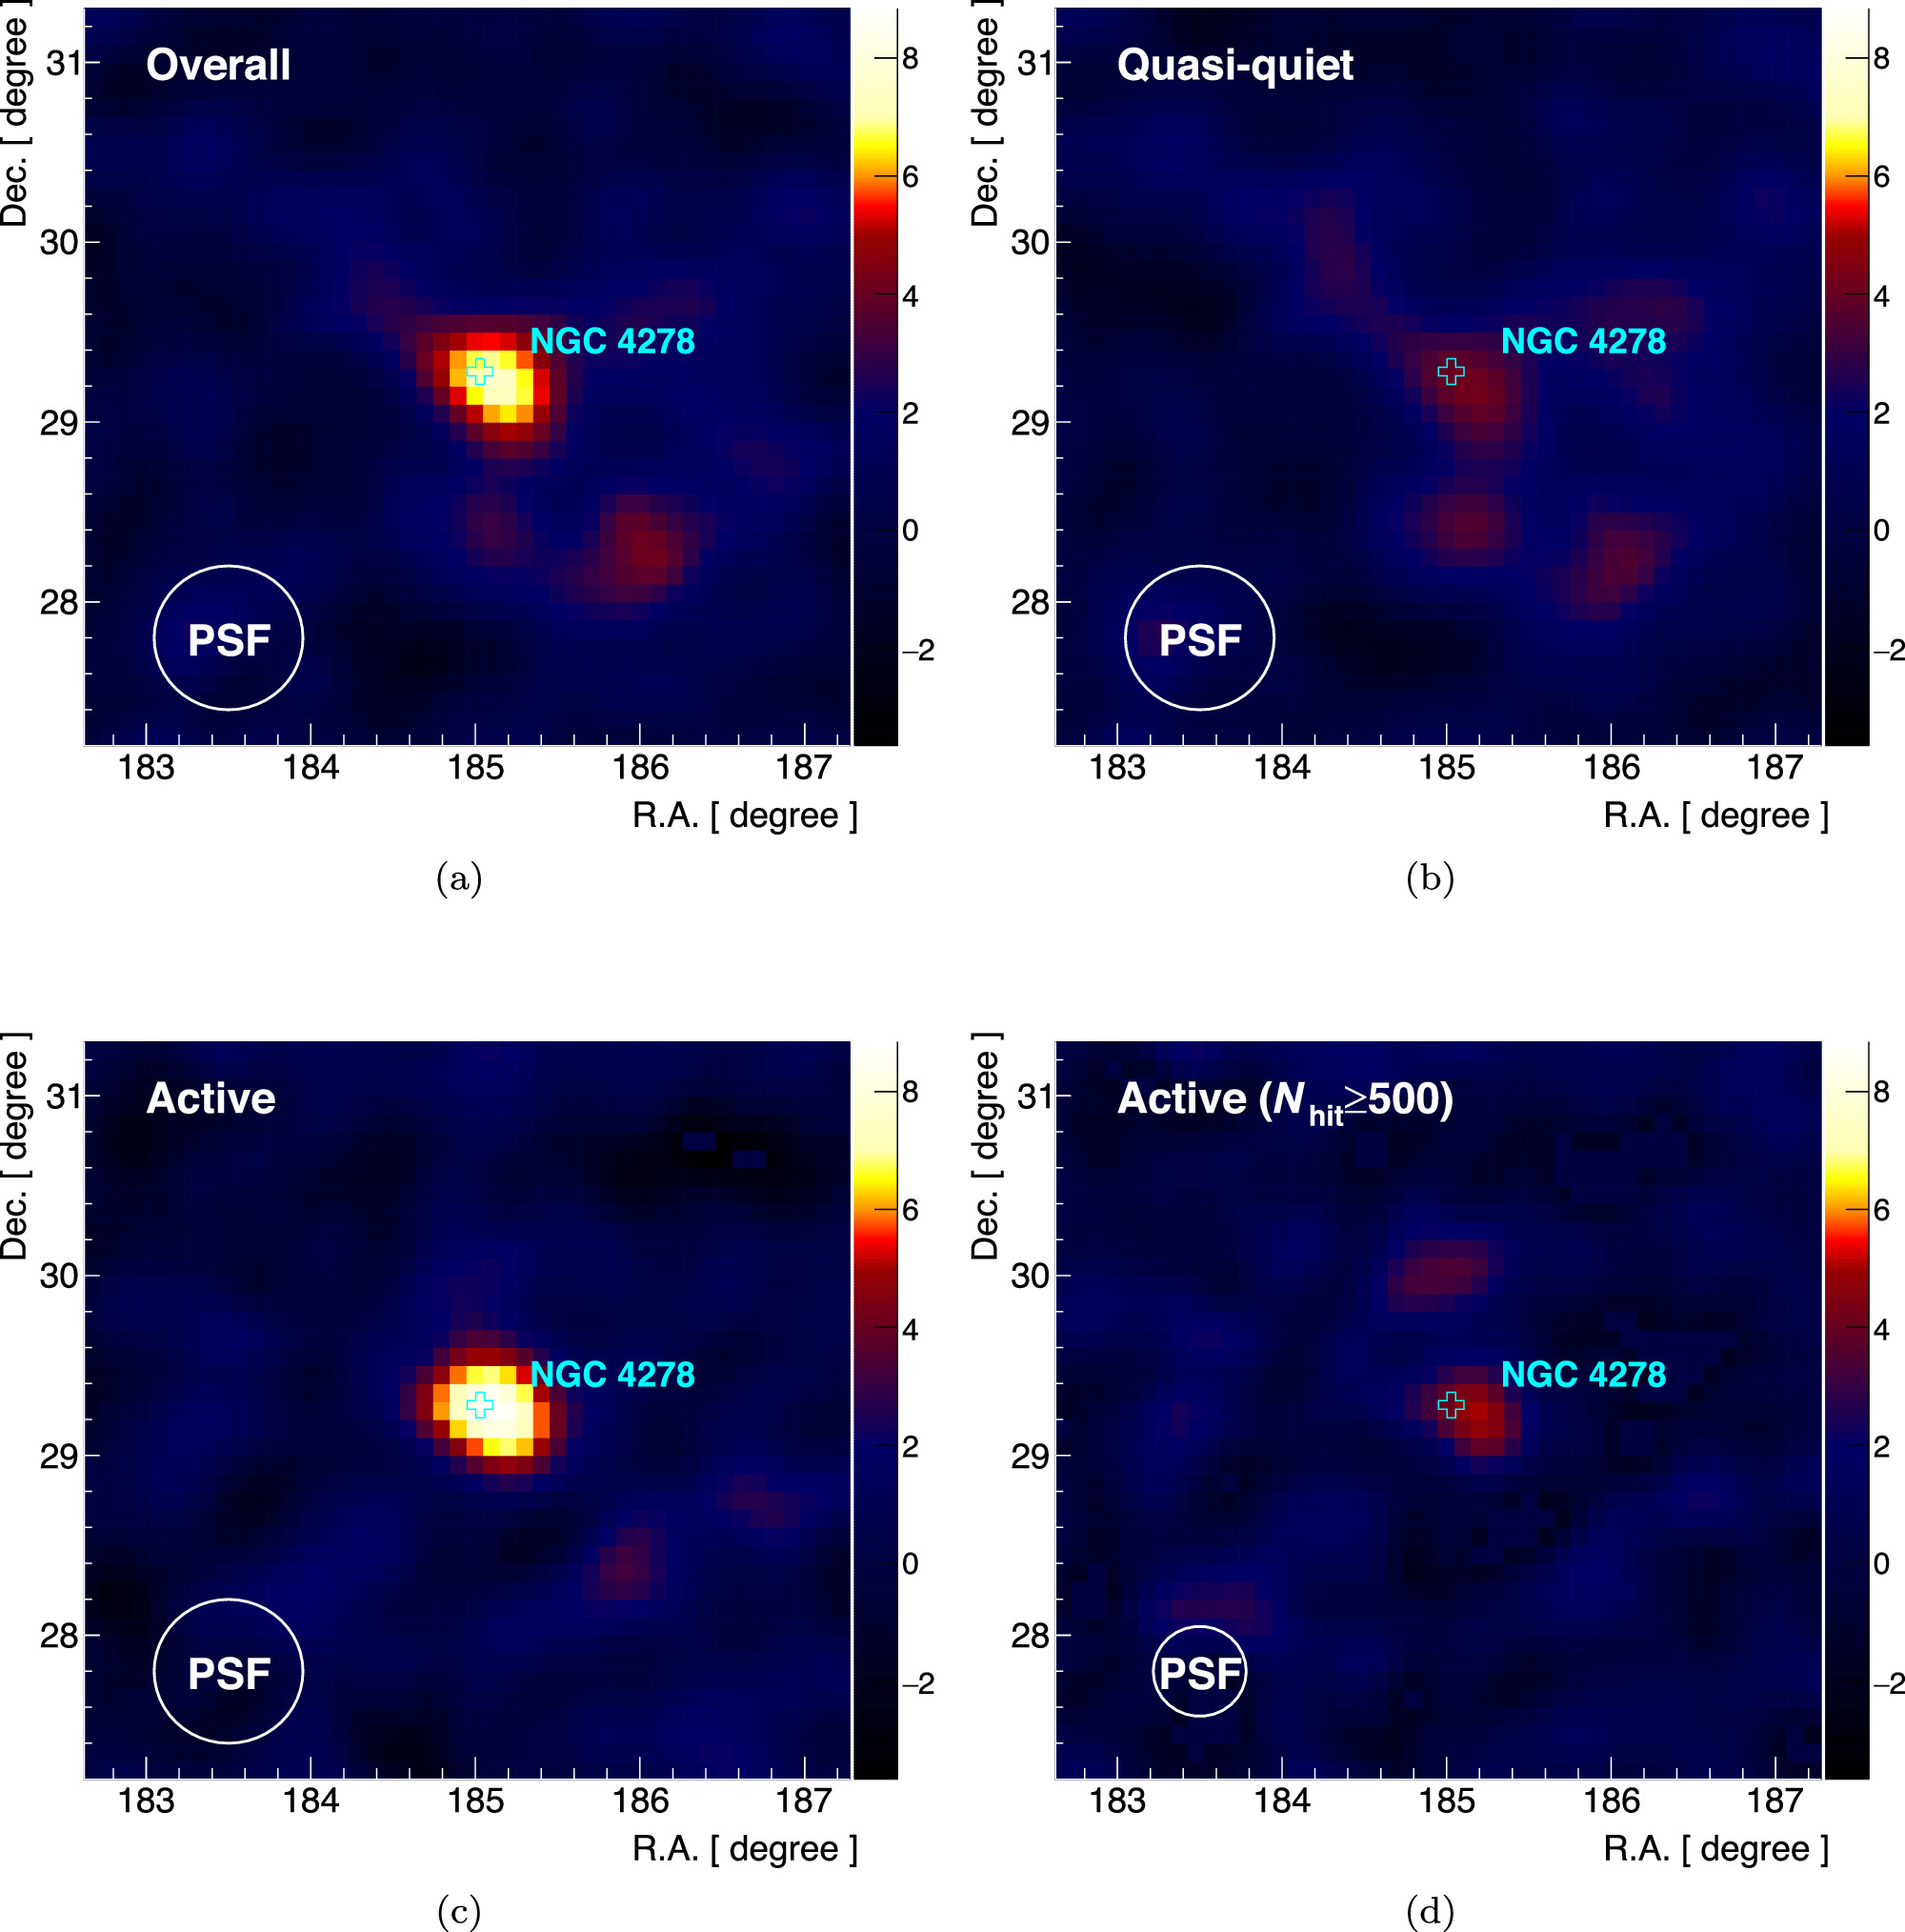
Figure 2. The pretrial significance map of the NGC 4278 region by WCDA for different states. Top left: the map with Nhit ≥ 60 for the entire 891 days of observation. Top right: the map for the quasi-quiet time. Bottom left: the map with Nhit ≥ 60 during the active state. Bottom right: the map with Nhit ≥ 500 during the active state.
Download figure:
Standard image High-resolution imageIn contrast, the bottom panels are maps for the active period as defined by Bayesian block analysis. The right panel is for Nhit ≥ 60 showing 8.8σ significance, and the left panel is for Nhit ≥ 500, with a median energy higher than 10 TeV, indicating 5.0σ significance. The position from likelihood fitting during the active period using WCDA observation is found to be R.A. = 18505 ± 0
04, decl. = 29
25 ± 0
03, which is 0
03 from the position of NGC 4278 (Helmboldt et al. 2007).
The pretrial significance for all KM2A observations is less than 4σ. Therefore, in the later analysis of SED, only upper limits are estimated from KM2A data.
3.3. SEDs in Different Conditions
Applying the maximum likelihood method, we obtained the intrinsic spectra for two states: the active state, which is the period marked by Bayesian block analysis, and the quasi-quiet state, which is the remaining time duration. Figure 3 shows the observed and intrinsic (corrected for EBL absorption) SEDs of the source in these two different states. The SED in the active state is in blue, while that of the quasi-quiet state is shown by black lines and gray bands. The final two upper limit points are from KM2A measurement. Due to the limited statistics of the quasi-quiet state, the six energy intervals of WCDA data are merged to two intervals as shown in the figure.
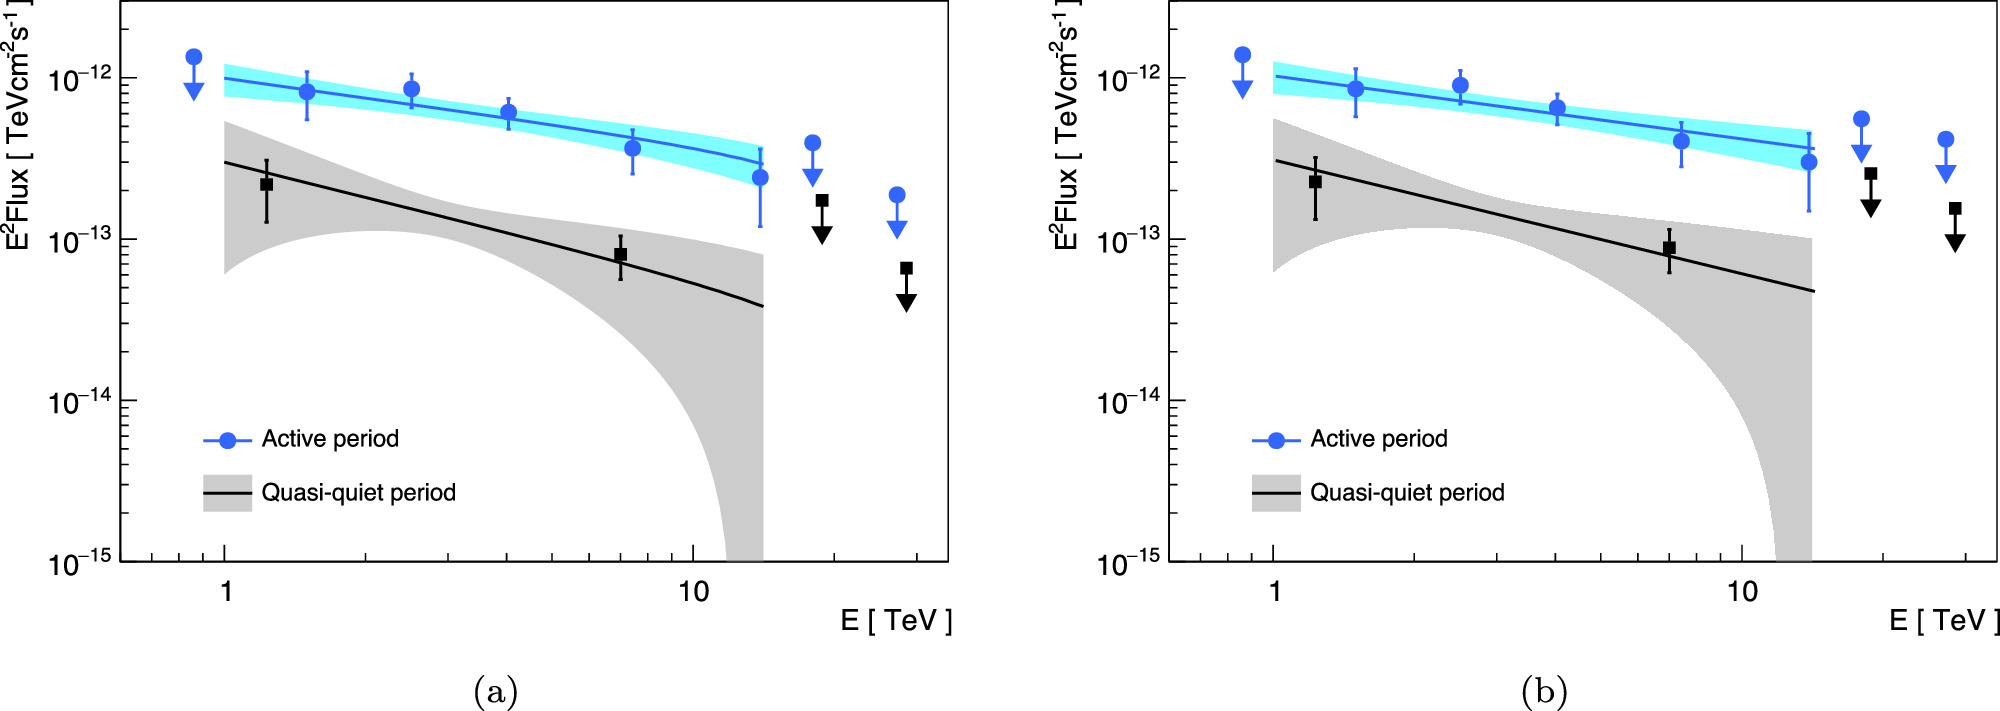
Figure 3. The observed (left) and intrinsic (right) SED of the source in different states: blue points are for the active state, and the black line is for the quasi-quiet state. Note that the EBL absorption (Saldana-Lopez et al. 2021) is not very important, due to the small distance.
Download figure:
Standard image High-resolution imageIt is interesting to see that in both active and quasi-quiet states there is no obvious change in the intrinsic photon spectral index within the error in the energy range from 1 to 20 TeV. The obtained best-fit parameters are ϕ0 = (0.74 ± 0.10) × 10−13 TeV−1 cm−2 s−1, Γ = (2.39 ± 0.17) with a TS value of 78 in the active state and ϕ0 = (0.16 ± 0.04) × 10−13 TeV−1 cm−2 s−1, Γ = (2.71 ± 0.69) with a TS value of 18.0 in the quasi-quiet state.
However, the integral flux in the active state does increase significantly, to about 7 times higher than that in the quasi-quiet state. Based on the SED measurement of the standard candle, the Crab Nebula, the systematic error in absolute flux is taken as 5%.
4. Discussion
NGC 4278 exhibits a compact symmetric radio morphology with ∼3 pc “S”-shaped jets (Giroletti et al. 2005), negligible polarization (≲0.4%, Bondi et al. 2004), months-long variability (Bondi et al. 2004; Giroletti et al. 2005), and low radio luminosity (∼1038–1039 erg s−1; Bondi et al. 2004; Giroletti et al. 2005). VLBA observations reveal an apparent jet proper-motion velocity of vapp ≃ 0.02c–0.2c, suggesting a kinetic age tkin ≲ 100 yr (Giroletti et al. 2005). These characteristics differ from those of blazars or FRI RGs. As an LLAGN, NGC 4278 resembles a typical compact symmetric object, making it one of the smallest and youngest radio sources (Giroletti et al. 2005; Readhead et al. 2024). Before its detection by LHAASO, all known VHE AGNs were either blazars or FRI RGs with powerful large-scale radio jets. Although some previously known VHE AGNs are LLAGNs (M87 and Cen A), their radio luminosities (≳1040 erg s−1) far exceed that of NGC 4278. The observation of VHE TeV emissions from NGC 4278 indicates that even compact, less powerful radio jets can efficiently accelerate particles to emit TeV photons. LHAASO’s discovery underscores the importance of survey-mode observations with homogeneous sky coverage in the VHE energy band for identifying TeV sources from various AGN types, especially LLAGNs.
Figure 4 compares NGC 4278 with other VHE AGNs, plotting radio luminosity against TeV luminosity. The data are from various studies with radio luminosity converted to 5 GHz and VHE luminosity to 0.1–10 TeV. NGC 4278 (red star) has L0.1–10 TeV ≈ 3.0 × 1041 erg s−1 and L5 GHz ≈ 2.5 × 1038 erg s−1 (Giroletti et al. 2005). NGC 4278's VHE luminosity is similar to that of FRI RGs despite having a notably lower radio luminosity than that of other VHE AGNs (L5 GHz ≳ 1040 erg s−1). NGC 4278 appears to align with the low-luminosity extension of blazars compared to FRI RGs, as guided by the dashed line L0.1–10 TeV/L5 GHz = 1000. This suggests that NGC 4278 efficiently produces TeV emissions akin to blazars, despite its low radio luminosity, slow jet proper motion, and less rapid variability. This could be attributed to a possibly small viewing angle of the jet in NGC 4278 (Giroletti et al. 2005), similar to that in blazars.
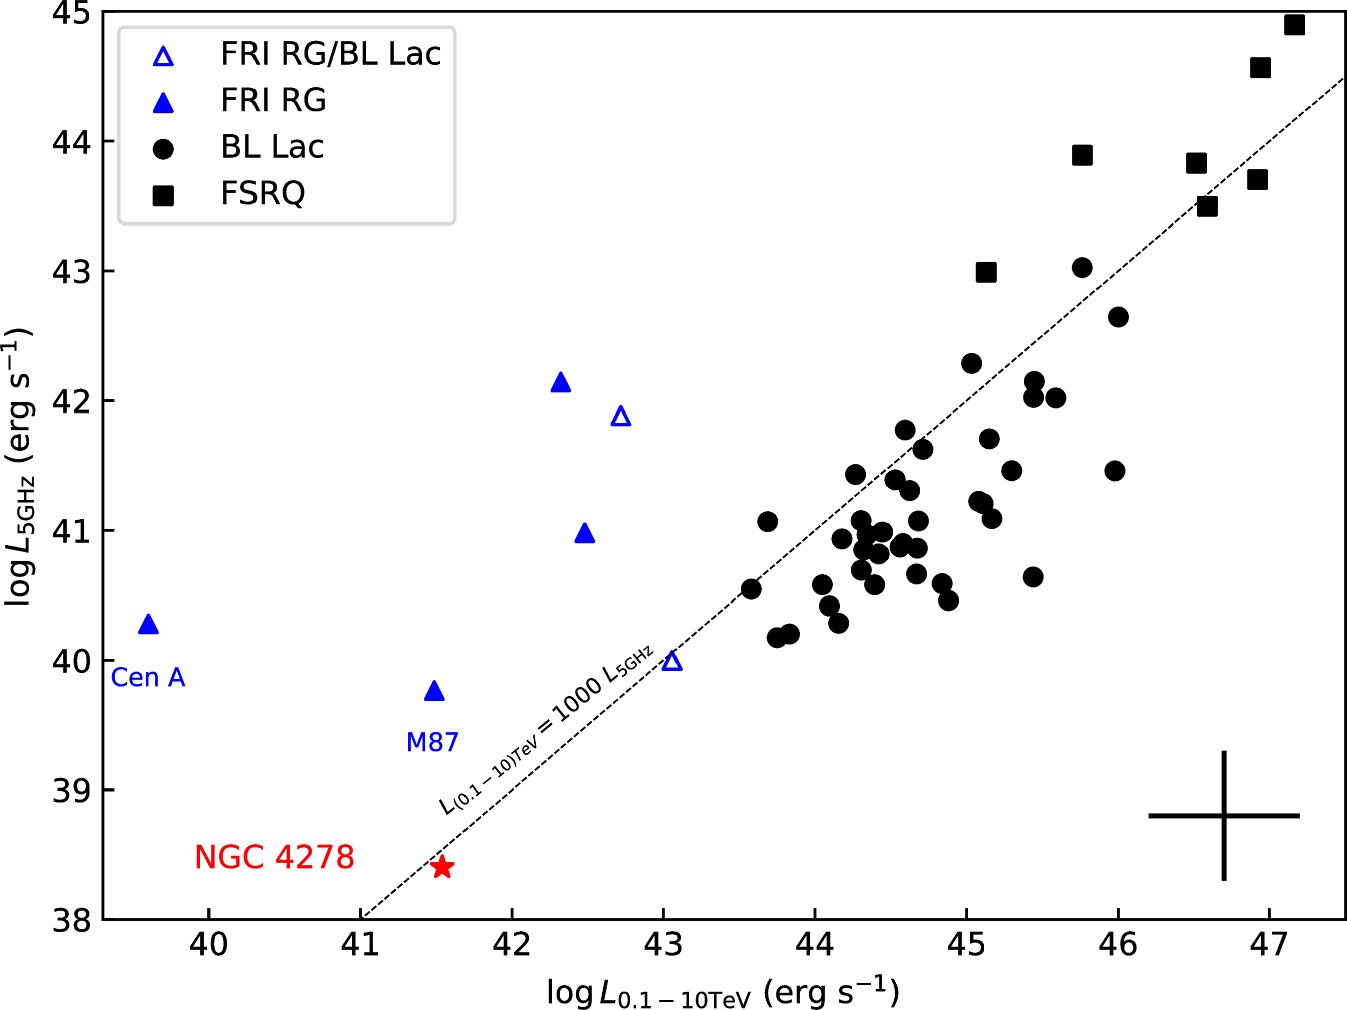
Figure 4. Radio luminosity vs. TeV luminosity. Data are obtained from various studies (Aharonian et al. 2006, 2009; MAGIC Collaboration et al. 2008, 2021; Aleksić et al. 2011, 2014; H.E.S.S. Collaboration et al. 2013, 2018, 2020a; Piner & Edwards 2014; Ahnen et al. 2015, 2016; Rulten 2022). The radio luminosity at 5 GHz is estimated from observed fluxes and radio spectral indices (assuming α = 0 for unknown indices). Most VHE AGNs, particularly blazars, exhibit significant flux variability, sometimes exceeding an order of magnitude, with a black plus sign (σ = 0.5 dex) in the lower right corner representing luminosity uncertainty.
Download figure:
Standard image High-resolution imageThe VHE spectra of Mrk 421 (the first discovered VHE BL Lac object), 3C 279 (the first VHE FSRQ), M87 (the first VHE FRI RG), and Cen A (the nearest VHE AGN) are compared with those of NGC 4278 in Figure 5. VHE emissions from Mrk 421 are typically well interpreted within the synchrotron self-Compton (SSC) model (Aleksić et al. 2015), while 3C 279's exceed Fermi/LAT GeV extrapolation, possibly from external Compton scattering or hadronic processes (Böttcher et al. 2009; Hayashida et al. 2012). Cen A’s VHE emissions may originate from its core and large-scale jet (H.E.S.S. Collaboration et al. 2020b). Although the SSC process can explain M87's broadband emissions (Abdo et al. 2009), the VHE emission seems to exceed Fermi/LAT GeV extrapolation, suggesting a structured jet or hadronic origin (Tavecchio & Ghisellini 2008; Alfaro et al. 2022). A caveat about the VHE emission exceeding the GeV extrapolation for 3C 279 and M87 should be noted: these GeV and TeV observations were not simultaneous. NGC 4278's VHE flux and spectra resemble M87's, with a similar photon index. Fermi/LAT GeV data from the same period as LHAASO observations provide only upper limits, hindering simultaneous broadband spectral analysis for NGC 4278.
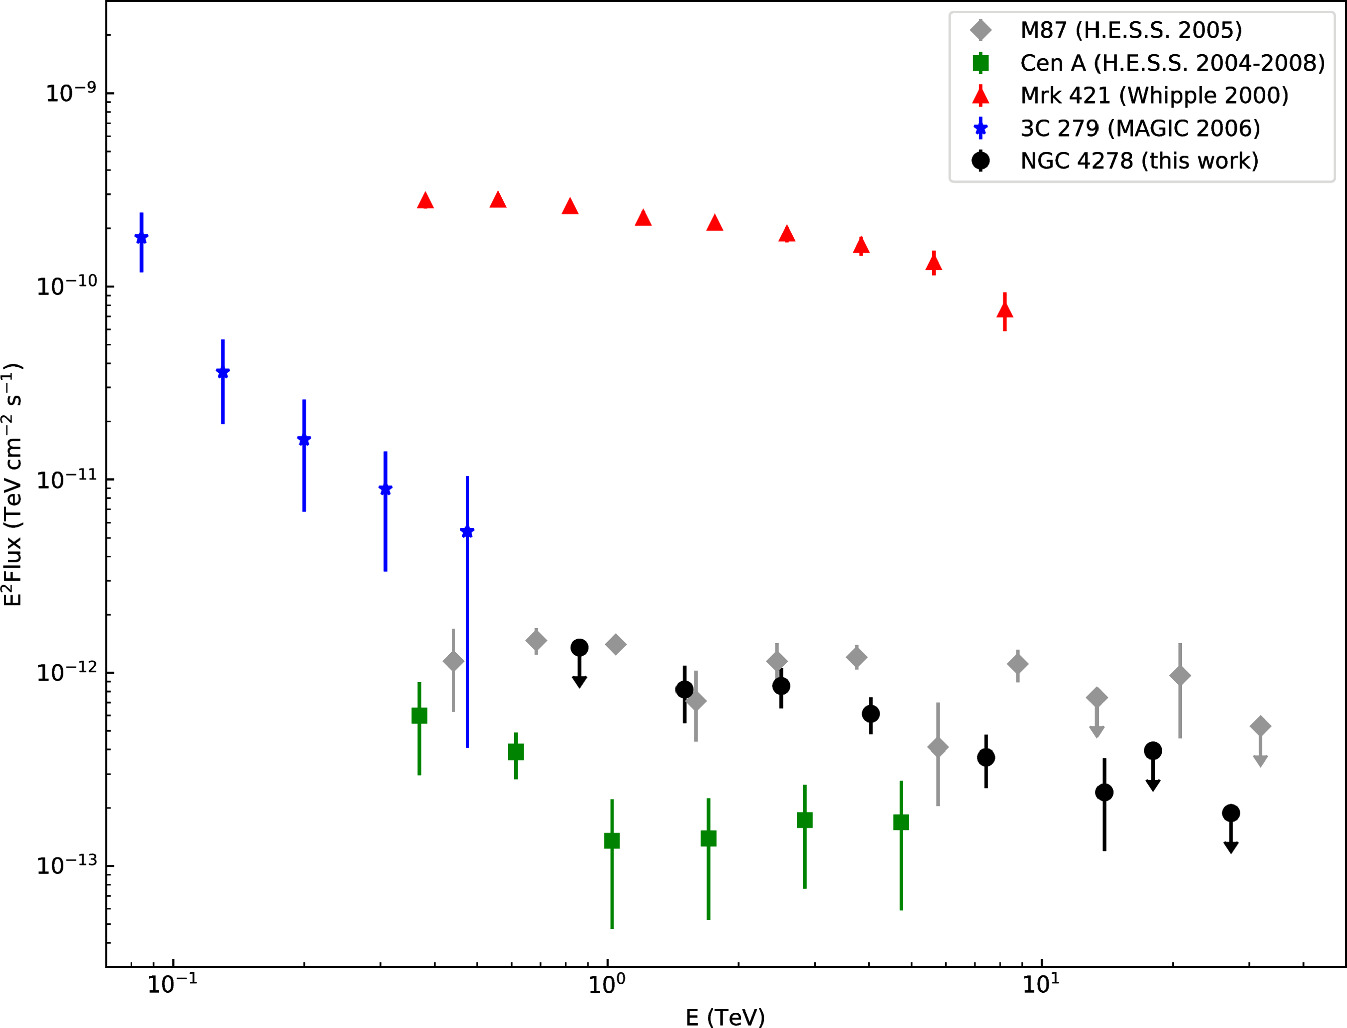
Figure 5. The observed VHE spectra of NGC 4278 compared with the BL Lac Mrk 421, FSRQ 3C 279, and FRI RGs M87 and Cen A, for which the data are taken during their active periods from Krennrich et al. (2002), Aharonian et al. (2006, 2009), and MAGIC Collaboration et al. (2008), respectively. It is noteworthy that the EBL significantly absorbs VHE photons above energies of approximately 0.2, 9, 30, 30, and 90 TeV (optical depth τγ γ = 1) for 3C 279 (z = 0.536), Mrk 421 (z = 0.03), M87 (Dl ≈ 16 Mpc), NGC 4278 (Dl ≈ 16 Mpc), and Cen A (Dl = 3.8 Mpc), respectively (from the EBL model of Saldana-Lopez et al. 2021).
Download figure:
Standard image High-resolution imageAs discussed in Section 3.1, LHAASO observed monthly VHE variability from NGC 4278, with a size (≲1 light-month) smaller than resolved radio knots (Giroletti et al. 2005), indicating a possible core origin for its VHE emission. Jet internal shocks within the core can efficiently accelerate particles to emit γ-rays (e.g., Rees 1978). In the leptonic model, inverse Compton processes responsible for VHE emission would enter the Klein–Nishina regime, with cooling timescales matching the observed monthly timescale, roughly suggesting B ≳ 5 mG in the emission region. LLAGNs’ collisionless plasma in RIAF could also produce high-energy particles for γ-ray emission (Mahadevan & Quataert 1997; Kimura et al. 2015), although VHE photon escape from RIAF may be hindered by high opacity (Kimura et al. 2015).
5. Summary
Previously known VHE AGNs include blazars and FRI RGs. LHAASO’s high sensitivity, wide field of view, and high duty cycle will enhance extragalactic source detection efficiency, reducing biases in VHE AGN catalogs. Data from 891 days of LHAASO-WCDA observations detected a new TeV source at ≈8σ (<4σ from KM2A data) named 1LHAASO J1219+2915 in the first LHAASO catalog (LHAASO Collaboration et al. 2024), which is likely due to the AGN in NGC 4278 (position within ∼003). The LHAASO observation unveils moderate variability with a variability timescale of months. The integral flux of active period f1–10 TeV ≈ (7.0 ± 1.1sta ± 0.35syst) × 10−13 photons cm−2 s−1 (∼5% of Crab Nebula, observed photon index Γ = 2.56 ± 0.14) is ∼7 times higher than its quiet period. The VHE emissions from NGC 4278 suggest that even compact, less powerful radio jets can efficiently accelerate particles to VHE and produce TeV photons. Further LHAASO observations may reveal more VHE LLAGNs like NGC 4278, aiding in constructing a comprehensive VHE AGN catalog and understanding AGN physics.
Acknowledgments
We would like to thank all staff members who work at the LHAASO site above 4410 m a.s.l. year-round to maintain the detector and keep the water recycling system, electricity power supply, and other components of the experiment operating smoothly. We are grateful to the Chengdu Management Committee of Tianfu New Area for the constant financial support for research with LHAASO data. This research work is also supported by the following grants: the National Natural Science Foundation of China (NSFC grant Nos. 12393853, 12393854, 12393851, 12393852, 12173066, 12173039), the Department of Science and Technology of Sichuan Province, China (grant Nos. 2024NSFSC0449, 2024NSFJQ0060), and in Thailand by the National Science and Technology Development Agency (NSTDA) and National Research Council of Thailand (NRCT): High-Potential Research Team Grant Program (N42A650868). L.C. is also supported by the Shanghai Pilot Program for Basic Research, Chinese Academy of Science, Shanghai Branch (JCYJ-SHFY-2021-013).
Author Contribution
M.Z. and L.C. led the drafting of text and coordinated the whole data analysis, S.C.H. performed energy spectrum analysis, G.M.X. (supervised by M.Z) performed light-curve analysis, T.W. calculated the upper limits from KM2A, L.C. contributed to the interpretation of the data and the studying at multiwavelength observation, and C.D.G. provided the cross-check. All other authors participated in data analysis, including detector calibration, data processing, event reconstruction, data quality checks, and various simulations, and provided comments on the manuscript.