Abstract
CK Vulpeculae (CK Vul), which erupted in AD 1670–71, was long considered to be a nova outburst; however, recent observations have required that alternative scenarios be considered. Long-slit infrared spectroscopy of a forbidden line of iron reported here has revealed high line-of-sight velocities (∼±900 km s−1) of the ansae at the tips of the bipolar lobes imaged in Hα in 2010. The deprojected velocities of the tips are approximately ±2130 km s−1 assuming the previously derived inclination angle of 65° for the axis of cylindrical symmetry of the bipolar nebula. Such high velocities are in stark contrast to previous reports of much lower expansion velocities in CK Vul. Based on the deprojected velocities of the tips and their angular expansion measured over a 10 yr baseline, we derive a revised estimate, with estimated uncertainties, of  kpc for the distance to CK Vul. This implies that the absolute visual magnitude at the peak of the 1670 explosion was
  , indicating that the 1670 event was far more luminous than previous estimates and brighter than any classical nova or any Galactic stellar merger. We propose that CK Vul belongs to the class of intermediate-luminosity optical transients (ILOTs), objects which bridge the luminosity gap between novae and supernovae. While eruptions in lower luminosity ILOTs are attributed to merger events, the origin of the highly luminous ILOT outbursts is currently not known.
1. Introduction
Until recently, CK Vulpeculae (CK Vul; long referred to as Nova Vulpeculae 1670) was believed to possibly be the earliest documented nova. It was discovered as a naked-eye object on 1670 June 20 by Anthelme, and independently on July 25 by Hevelius. Reconstruction of its light curve (Shara et al. 1985) shows that it had a visual brightness maximum of approximately 3 mag at discovery, followed successively by a fading and a second maximum at approximately 2.6 mag in 1671 March. It subsequently faded from naked-eye view, although a final maximum of  mag was observed by Hevelius in 1672 March. Since 1679, attempts to recover the object were unsuccessful until the discovery in 1982 of a small patch of Hα nebulosity at the site of the 1670 event (Shara & Moffat 1982). A thorough discussion is given by Shara et al. (1985).
Submillimeter photometry of CK Vul (Evans et al. 2002) revealed a large excess due to emission from dust, inconsistent with CK Vul being a classical nova remnant. A faint  bipolar nebula, oriented almost exactly north–south (Figure 1), was discovered in Hα imaging by Hajduk et al. (2007), who also reported a compact radio source located at the point of symmetry. Infrared (IR) spectroscopy (Evans et al. 2016) revealed a rich spectrum of hydrocarbons, together with H2, HCN and metallic fine structure line emission. A
  dusty bipolar submillimeter structure, symmetric about a small disk-like feature, the center of which coincides with the compact radio source, was reported by Eyres et al. (2018). This structure, which aligns with dark lanes in the Hα image, also shows emission from several small organic molecules.
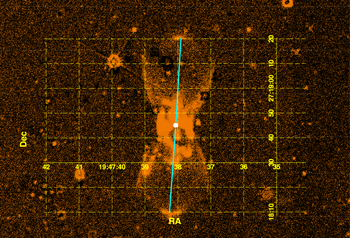
Figure 1. Hα continuum-subtracted image of CK Vul observed on 2010 June 22 with the Gemini North Telescope (image kindly provided by M. Hajduk). The position of the compact radio source is indicated by the white dot. The slit (cyan line) was centered on this source and passes through the tips of the ansae located near the top and bottom center of the image.
Download figure:
Standard image High-resolution imageThe central star of CK Vul is deeply enshrouded in dust, and is visible in neither the optical nor the near-IR. The current identification of CK Vul in the SIMBAD database is incorrect. In this study, we adopt the radio coordinates (Hajduk et al. 2007) listed in Table 1 for the central source of CK Vul.
Table 1. Observed [Fe ii] 1.257 μm Line
| Offset a | Aperture | Vel. of Peak b | Flux c | Notes |
|---|---|---|---|---|
| (arcsec) | (arcsec) | ( km s−1 hel.) | (10−19 W m−2) | |
| +36.7 | 0.45 × 0.90 | +869 | 1.39 | blue shoulder |
| +7.9 | 0.45 × 0.75 | −111 | 0.53 | |
| +4.2 | 0.45 × 0.75 | −147 | 1.48 | blue shoulder |
| +4.2 | 0.45 × 0.75 | −40 | 2.15 | |
| +2.9 | 0.45 × 0.75 | −118 | 6.25 | |
| +1.5 | 0.45 × 0.75 | −106 | 5.53 | Pa β at −120 km s−1 |
| +0.6 | 0.45 × 0.45 | −300 | 0.84 | |
| +0.6 | 0.45 × 0.45 | −63 | 2.62 | Pa β at −50 km s−1 |
| 0.0 | 0.45 × 0.45 | −302 | 1.16 | |
| 0.0 | 0.45 × 0.45 | −47 | 0.56 | Pa β at −50 km s−1 |
| −0.6 | 0.45 × 0.45 | −285 | 0.25 | |
| −3.3 | 0.45 × 0.75 | +68 | 2.25 | |
| −4.1 | 0.45 × 0.75 | +20 | 3.50 | |
| −8.9 | 0.45 × 0.75 | +137 | 2.05 | |
| −37.1 | 0.45 × 1.20 | −922 | 0.84 | may have red shoulder |
Notes.
a From radio coordinates of CK Vul (J2000 R.A. = 19:47:38.074, decl. = +27:18:45.16) along slit at position angle 3° west of north. b Uncertainty ∼10 km s−1. c Typical random uncertainty 0.10 W m−2. Uncertainty in absolute flux calibration ∼20%.Download table as: ASCIITypeset image
No consensus exists on the cause of the 1670 eruption. Proposed scenarios include a nova eruption, various types of stellar merger, and a very late thermal pulse in a post-asymptotic giant branch (AGB) star (Shara & Moffat 1982; Shara et al. 1985; Hajduk et al. 2007; Kamiński et al. 2015, 2017, 2018a; Eyres et al. 2018). A kinematic study of the nebula could be a means of discriminating between some of the above mechanisms. For example, stellar mergers rarely produce outflows with velocities exceeding 500 km s−1. On the other hand, nova eruptions can generate ejecta velocities of up to several thousand km s−1.
Here we present near-IR spectra of CK Vul, obtained through a slit positioned as shown in Figure 1. The orientation was chosen so that the slit intercepted the radio source at the center of the bipolar structure and the northern and southern tips of the ansae, approximately  from the center, where the expansion velocities are expected to be largest in a homologous or Hubble flow (Balick & Frank 2002, and references therein).
2. Observations and Data Reduction
Spectroscopy of CK Vul was obtained at the Frederick C. Gillett Gemini North Telescope on Maunakea on the nights of 2020 August 31 and September 1 (UT), using the Gemini Near-InfraRed Spectrograph (GNIRS; Elias et al. 2006). Sky conditions were excellent throughout the observations. The spectrograph configuration included its  slit oriented 3° west of north, a slit width of
  , and the short focal length blue camera, which provides a plate scale of
  /array pixel. The
  mm−1 grating in GNIRS was set to a central wavelength of 1.26 μm, which gave a coverage of 1.203−1.317 μm and a resolving power, R, of 4800 (corresponding to resolutions of 0.00026 μm and 62 km s−1).
Individual exposure times were 300 s. The total exposure times on source were 1800 s on 2020 August 31 and 2400 s on 2020 September 1. The same exposure times were used at a location  to the east, selected to minimize the number of stars in the “sky” slit. Exposures were obtained in the standard ABBA manner. The star HIP 98699 (A1V) was observed immediately following CK Vul; the airmass match was within 0.04 airmasses on each night.
On both nights the slit was centered on the radio coordinates (Table 1) using a blind offset from a  mag star located
  distant. The offsetting accuracy of Gemini is considerably less than a GNIRS pixel. Although CK Vul itself was not detected in the near-IR, we are confident of the angular distances from it to the spectral features reported in this Letter.
Examination of raw sky-subtracted frames revealed within  of CK Vul several patches of emission along the slit in the forbidden line of Fe ii at 1.25702 μm (vacuum). The H i Paβ line at 1.28216 μm was also weakly present in a portion of this region within a few arcseconds of the radio source.
Prompted by the report by Hajduk et al. (2013) of Hα line emission with high proper motions at the northern and southern tips of the bipolar nebula, we searched the spectral images on both nights and found regions of faint and highly Doppler-shifted (∼±900 km s−1) emission in the [Fe ii] line, about one arcsecond in extent, close to the locations of the Hα tips. The northern emission stands out fairly well. Superimposed on part of the southern emission is the spectrum of a faint star. However, careful data reduction clearly established the emission’s existence. We have considered whether these components are lines of some other atomic species, but think it highly unlikely and unreasonable that an atomic species would selectively create only one-sided emission (i.e., emission in only one of the two ansae), and also that emission would appear only in the tips and not in the bright central region where it would be expected to be strong. Thus, we are confident in our identification.
Full reduction of the spectra from each night was limited to the wavelength interval containing the [Fe ii] and Pa β lines, there being no detected lines outside of that interval. It involved the standard steps of flat-fielding, spatial, and spectral rectification of the images, removal of the effects of cosmic-ray hits, wavelength calibration using an argon lamp, and binning of the spectra, in this case into intervals of 0.0002 μm (48 km s−1).
Spectra of the 12 regions where the [Fe ii] line was detected were extracted from the rectified CK Vul reduced image from each night. Each was flux calibrated by dividing by the spectrum of the standard star, including correcting for slit loss in the spectrum of the star. The spectra from the two nights were then combined to produce a final spectrum for each region. Pertinent information for each spectrum is provided in Table 1.
3. Results
Spectra of [Fe ii] 1.257 μm at all positions where the line was detected are presented in Figure 2. Emission was also detected in the Paβ line, but only close to the radio source. A third line, [Fe ii] at 1.279 μm, was also weakly detected, but only in a few arcsecond long segment of the slit where the 1.257 μm line is at its brightest. Figure 3 shows the spectrum of that portion of the central region where all three lines are present.
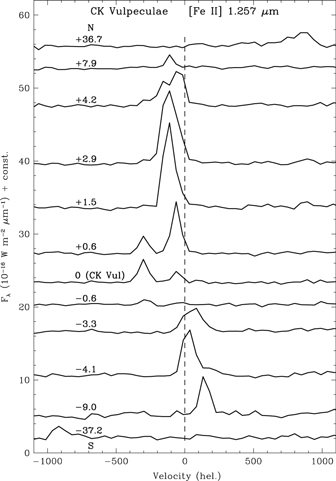
Figure 2. Spectra of the [Fe ii] 1.257 μm line in the CK Vul nebula at the 12 locations along the slit where the line was detected. See Table 1 for details.
Download figure:
Standard image High-resolution image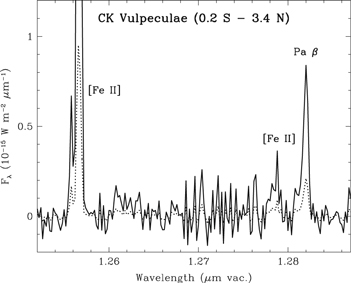
Figure 3. Spectrum extracted over a 36 region near the center, showing three lines ([Fe ii] 1.257 μm and 1.279 μm, and H i Paβ 1.282 μm). Dotted line: same spectrum scaled down by a factor of four.
Download figure:
Standard image High-resolution imageAs can be seen in Figure 2, the [Fe ii] 1.257 μm line emission is prominent at various locations within ±9″ of the central source. The velocity pattern within this inner region is complex, with large variations with position and at some locations more than one component present. Discussion and modeling of the velocity field will be reported elsewhere.
The highlight of these observations is the high line-of-sight velocities observed in the tips of the north and south ansae in the [Fe ii] line, peaking at ∼+870 km s−1 and ∼−920 km s−1, respectively. Hajduk et al. (2013), using the morpho-kinematic modeling tool shape (Steffen & López 2006), found that that the inclination angle of the bipolar Hα nebula is 65° relative to the line of sight. That implies that the northern and southern tips are moving outward from the center at 2130 km s−1 (900 km s−1/cos 65°). This is vastly higher than previously reported expansion velocities in CK Vul, which are of order a few hundred km s−1 or less (Shara et al. 1985; Hajduk et al. 2007).
The reason for these previously reported low velocities is now clear: all of them are for regions located around the central waist of the hourglass nebula (i.e., the equatorial region) where low expansion velocities are expected. It is believed that hourglass or bipolar nebulae are generated when the outflowing ejecta from the central source are constricted by a material over-densities in the equatorial planes, i.e., at the waist of the hourglasses. The ejecta expand freely and rapidly in the polar directions, but slowly in the equatorial region. High velocities are expected in the polar regions by virtue of the larger distance to the tips of the ansae.
For the Hα frame of 2010 June 22 (Figure 1) we measure the angular separation between the centers of the tips of the ansae at the positions where the GNIRS slit intersected them to be 7129 ± 020. Using an accurate value of 01517 ± 00002 pixel−1 for the plate scale of GNIRS in the configuration in which it was used, we find an angular separation of 7387 ± 023 for the centers of the tips in the [Fe ii] 1.257 μm emission line. Because [Fe ii] emission arises in a region where hydrogen is partially ionized (Mouri et al. 2000), we assume that Hα and [Fe ii] are co-spatial. Therefore, an expansion of 258 ± 030 has occurred over a 10.2 year period (2010 June 22 to 2020 August 31). Assuming constant velocity, this implies that the expansion began 290 ± 40 yr ago. Comparison with the the likely date of the ejection event, 1670 or 1671, suggests that the deceleration of the tips, if any, has been rather modest.
Assuming a constant transverse velocity of 1930 km s−1 (2130 sin 65°) between 2010 and 2020 (i.e., no significant deceleration of the ejecta), the distance to CK Vul is 3.2 kpc, independent of reddening. This distance is a factor of 4.5−6 times larger than other estimates (Shara et al. 1985; Hajduk et al. 2013).
The uncertainty in the derived inclination angle was not given by Hajduk et al. (2013) and is not incorporated in the above distance uncertainty. At high inclination angles, expansion velocity, distance, and absolute magnitude all have non-linear dependences on this angle. An uncertainty of 5° in the assumed 65° gives the distance to CK Vul as  kpc; further allowing for the uncertainty in reddening gives the absolute visual magnitude at outburst as
  .
.
The above distance of  kpc is in apparent conflict with distance estimates by Hajduk et al. (2013) of ∼500 pc and ∼2 kpc to two variable field stars, which they argued lie behind some of the ejecta of CK Vul, causing their recent brightness fluctuations and apparent Li overabundances. However, the former of these has a Gaia parallax (Bailer-Jones et al. 2018) of 4.9 kpc and thus no longer conflicts. The latter star is too faint for Gaia and a more precise distance would need to be determined by some other means.
4. Discussion
4.1. Line Emission in the Central Few Arcseconds
Here we confine our discussion to the central region and the spectrum in Figure 3, in which all three lines ([Fe ii] 1.257 and 1.279 μm, and Paβ) are present. This spectrum includes contributions from several disparate areas. Thus the properties derived here are mean values and do not necessarily represent any individual region. Based on the strength of [Fe ii] 1.257 μm relative to Paβ, we assume that the gas in this region is largely collisionally excited. However, the presence of a compact radio source (Hajduk et al. 2007) indicates the possibility of some photoionization.
As discussed by Mouri et al. (2000), the [Fe ii] emission arises in a region in which hydrogen is partially ionized. The critical density for collisional de-excitation of the upper level of the 1.257 μm line is

where Te is the electron temperature. Useful diagnostics are the [Fe ii] 1.257 μm / Paβ and [Fe ii] 1.279 μm / [Fe ii] 1.257 μm flux ratios, which are 4.9 ± 0.6 and 0.07 ± 0.02, respectively.
The [Fe ii] 1.257 μm/Paβ flux ratio suggests shock velocities of  km s−1 marginally below the threshold (75 km s−1) for an ionizing shock (Mouri et al. 2000). Note that this value is for solar abundances, which may not be applicable to these ejecta. The [Fe ii] 1.279 μm / [Fe ii] 1.257 μm flux ratio indicates
  K, although the deduced Te
is virtually independent of the flux ratio. This temperature gives a critical density of
K, although the deduced Te
is virtually independent of the flux ratio. This temperature gives a critical density of  cm−3 for the upper level of the 1.257 μm line.
4.2. The Outer Tips
The morphologies of the [Fe ii] 1.257 μm tips in the CK Vul nebula closely resemble the “fingertips” observed in the Orion Molecular Cloud by (Bally et al. 2015, see e.g., their Figure 9) in the shock-excited forbidden [Fe ii] 1.644 μm line. There over 100 high-density clumps of gas are being ejected from the cloud at typical speeds of 300 km s−1, which Bally et al. concluded is the result of a violent event ∼500 yr ago during the formation of a dense cluster of massive stars.
We propose that excitation of the upper level of the [Fe ii] 1.257 μm line in the CK Vul tips is the result of the same phenomenon as that proposed by Bally et al. (2015) for the [Fe ii] line in Orion. In each of the tips a low-velocity reverse shock is being driven into a high-density gas clump ejected from CK Vul as each clump encounters much lower density interstellar gas. The shock ionizes and collisionally excites the Fe and, at least to some extent, the hydrogen. It is possible that lines of molecular hydrogen are also associated with these clumps, as has been observed in detail in Orion by Tedds et al. (1999). Observations of them could provide constraints on the physical properties of the clumps.
4.3. The Nature of CK Vul
The greatly increased distance to CK Vul derived here has dramatic implications for the dust mass and luminosity in the bipolar nebula and for the luminosities of the explosive events in 1670–71. First, the dust mass in the compact bipolar dusty nebula reported by Eyres et al. (2018) now becomes 
 , of which
 lies in the diffuse emission, and
 lies in the disk. The present luminosity of the central object, as determined from the spectral energy distribution of the dust, is 20
  (see Kamiński et al. 2015).
Second, assuming the maximum visual brightness mV
in 1671 was 2.6 ± 0.3 (Shara et al. 1985), and that the visual extinction AV
in the direction of CK Vul at a distance  is 2.47 ± 0.45 (Marshall et al. 2006), the absolute magnitude of CK Vul at maximum was
  . It is thus clear that CK Vul underwent a much more luminous sequence of explosions in 1670–71 than hitherto recognized. At peak its absolute magnitude was at least 3 mag brighter than the brightest Galactic classical nova, which generally have MV
at maximum in the range –6.5 to –9.5 (see e.g., Bode & Evans 2012). A few luminous extragalactic novae have been known to approach
. It is thus clear that CK Vul underwent a much more luminous sequence of explosions in 1670–71 than hitherto recognized. At peak its absolute magnitude was at least 3 mag brighter than the brightest Galactic classical nova, which generally have MV
at maximum in the range –6.5 to –9.5 (see e.g., Bode & Evans 2012). A few luminous extragalactic novae have been known to approach  (e.g., Kasliwal et al. 2011b).
CK Vul might be considered as an extreme example of a luminous red nova (LRN; Kulkarni et al. 2007). Thus, it is of interest to compare its peak nebular expansion velocity of ∼2000 km s−1 with those of others of that class, such as V1309 Sco, V4332 Sgr, and V838 Mon. V4332 Sgr produced an Hα line with full width at zero intensity ∼550 km s−1 (Martini et al. 1999), a far lower expansion velocity than CK Vul. Similarly, the P Cygni profiles in an early spectrum of V838 Mon (Lynch et al. 2004) have separations between their absorption and emission peaks of 540 ± 140 km s−1. Recent millimeter/submillimeter-wave observations of V4332 Sgr, V838 Mon, and V1309 Sco taken 22, 14, and 8 yr, respectively, after their eruptions (Kamiński et al. 2018b), reveal molecular emission lines having full widths not exceeding 400 km s−1. In the few published spectra of extragalactic LRNe (e.g M31 RV and PTF10fqs) also only narrow emission lines are present, indicating velocities similar to those of their Galactic counterparts (Rich et al. 1989; Kasliwal 2012). In the case of PTF10fqs, in addition to the narrow Balmer and calcium emission features, there is a 10,000 km s−1 wide unidentified emission feature at ∼8600 Å, possibly suggestive of a terminal explosive event (Kasliwal et al. 2011a; Kasliwal 2012). In general, though, the highest velocities in CK Vul are considerably higher than those in LRNe.
The peak absolute luminosity of CK Vul is also much higher than the Galactic LRNe, the brightest of which was V838 Mon with  mag (Bond et al. 2003). Kasliwal (2012) has shown that there exists a group of objects with luminosities that are intermediate between the brightest novae and faintest supernovae (i.e., with peak MV
between –9 and –14, Kasliwal (2012), Figure 1). Soker & Kashi (2011) have termed these intermediate-luminosity optical transients (ILOTs). In the literature ILOTs are interchangeably called intermediate-luminosity red transients or LRNe. V838 Mon, M31 RV, and M85OT are all proposed members of this group. It is suggested (Kasliwal 2012) that the less luminous of these outbursts result from mergers of main-sequence stars: “mergeburst” events (Soker & Tylenda 2007).
mag (Bond et al. 2003). Kasliwal (2012) has shown that there exists a group of objects with luminosities that are intermediate between the brightest novae and faintest supernovae (i.e., with peak MV
between –9 and –14, Kasliwal (2012), Figure 1). Soker & Kashi (2011) have termed these intermediate-luminosity optical transients (ILOTs). In the literature ILOTs are interchangeably called intermediate-luminosity red transients or LRNe. V838 Mon, M31 RV, and M85OT are all proposed members of this group. It is suggested (Kasliwal 2012) that the less luminous of these outbursts result from mergers of main-sequence stars: “mergeburst” events (Soker & Tylenda 2007).
The strongest evidence for a mergeburst is the case of V1309 Sco, where a decaying orbital period prior to eruption was clearly detected (Tylenda et al. 2011), indicating the components of the binary were spiraling into each other. However, V1309 Sco is estimated to have a peak MV
of only  mag (although the distance to the object is uncertain).
To explain the outbursts of the more luminous ILOTs, alternative routes are needed. One suggested channel is electron capture in an O–Ne–Mg core in extreme asymptotic giant branch (eAGB) stars (Kasliwal 2012). The eAGB stars are massive AGB stars (5–10  , Soker & Kashi 2011). Alternatively, Soker & Kashi discussed the possibility that such outbursts could be related to major instabilities of the envelopes of eAGB stars leading to ejections of their envelopes. The focus on eAGB stars arises because the mid-IR progenitors of two of the nearest extragalactic ILOTs, NGC300-OT and SN 2008S, are at the extremely luminous and red ends of the AGB branch (Prieto 2008; Thompson et al. 2009; Kasliwal 2012). Other suggested mechanisms are luminous blue variable eruptions, asteroids falling onto white dwarfs, accretion-induced collapses, peculiar core-collapse supernovae, and peculiar classical novae (Kasliwal 2012, and references therein).
We make no attempt to classify the nature of the CK Vul outburst (e.g., non-terminal Luminous Blue Variable, terminal events such as SN 2008S and NGC 300 OT2008-1). Discriminating between these is challenging even for present-day events, despite having diagnostic tools such as panchromatic outburst spectra, archival images to identify the nature of the progenitor (e.g., Smith et al. 2010; Adams et al. 2016; Jencson et al. 2019; Andrews et al. 2020), and in some cases the presence of a stellar remnant.
Any proposed mechanism/model to account for the properties of the CK Vul explosion must be able to account for its key features. These include the high peak outburst magnitude; the multiple peaks of the outburst; the sustained brightness of the outburst for a remarkably long period (∼700 days; see the reconstructed light curve in Shara et al. 1985); the high peak expansion velocities exceeding 2000 km s−1; the formation and maintenance of jets, bubbles, and dust cocoons; and the production of the short-lived radio-nuclide  Al during its outburst (Kamiński et al. 2018a).
This Letter is based on observations obtained for program GN-2020B-Q-207 at the international Gemini Observatory, a program of NSF’s NOIRLab, which is managed by the Association of Universities for Research in Astronomy (AURA) under a cooperative agreement with the National Science Foundation on behalf of the Gemini Observatory partnership: the National Science Foundation (United States), National Research Council (Canada), Agencia Nacional de Investigación y Desarrollo (Chile), Ministerio de Ciencia, Tecnología e Innovación (Argentina), Ministério da Ciência, Tecnologia, Inovações e Comunicações (Brazil), and Korea Astronomy and Space Science Institute (Republic of Korea). D.P.K.B. is supported by a CSIR Emeritus Scientist grant-in-aid, which is being hosted by the Physical Research Laboratory, Ahmedabad. We thank M. Hadjuk for comments on an early version of the manuscript and are grateful to the referee for several helpful suggestions.
Facility: Gemini:Gillett - Gillett Gemini North Telescope
Software: Figaro (Shortridge et al. 2004), Gemini IRAF Package