Abstract
We investigate the three open clusters near the Aquila Rift cloud, named UPK 39 (c1 hereafter), UPK 41 (c2 hereafter) in Sim et al. (2019), and PHOC 39 (c3 hereafter) in Hunt & Reffert (2021). Using photometric passpands, reddening, and extinction from Gaia DR3, we construct the color-absolute-magnitude diagram. Using isochrone fits, their ages are estimated as 6.3 ± 0.9, 8.1 ± 1.4 and 21.8 ± 2.2 Myr. Their proper motions and radial velocities, estimated using data from Gaia and LAMOST, are very similar. From their orbits, relative distances among them at different times, kinematics, ages, and metallicities, we conclude that c1 and c2 are primordial binary open cluster, which are likely to have been formed at the same time, and c3 may capture c1, c2 in the future.
Original content from this work may be used under the terms of the Creative Commons Attribution 4.0 licence. Any further distribution of this work must maintain attribution to the author(s) and the title of the work, journal citation and DOI.
1. Introduction
Open clusters (OCs), gravitationally-bound stars originally formed from giant molecular clouds (Lada & Lada 2003), are building blocks of the Milky Way. Catalogs of OCs have been compiled for over a century (Dreyer 1888). High-quality astrometric and photometric data from Gaia (Gaia Collaboration et al. 2016, 2018, 2021), combined with new highly efficient tools such as DBSCAN (Ester et al. 1996), HDBSCAN (Campello et al. 2013; McInnes et al. 2017), and UPMASK (Unsupervised Photometric Membership Assignment in Stellar Clusters; Krone-Martins & Moitinho 2014), have dramatically increased the number of OCs (Castro-Ginard et al. 2018; Cantat-Gaudin et al. 2018; Bica et al. 2019; Castro-Ginard et al. 2019; Cantat-Gaudin et al. 2019; Ferreira et al. 2019; Liu & Pang 2019; Sim et al. 2019; Castro-Ginard et al. 2020; Ferreira et al. 2021; He et al. 2021; Hunt & Reffert 2021; Qin et al. 2021; Castro-Ginard et al. 2022; He et al. 2022). A complete census of OCs within the solar neighborhood will provide a sound basis to investigate a number of scientific questions. OCs could support us investigate other scientific program as well, such as the metallicity gradient of the galaxy and radial migration (Chen & Zhao 2020; Zhang et al. 2021; Netopil et al. 2022), spiral arms (Castro-Ginard et al. 2021b), and moving groups (Zhao et al. 2009; Liang et al. 2017; Yang et al. 2021). With more and more identified OCs, delicate analysis for them is needed to provide further understanding of the galaxy.
In the region around the Aquila Rift cloud, we identified three OCs with similar proper motions (PMs). Two of them, c1, c2, were first found by Sim et al. (2019) and the other, c3 Hunt & Reffert (2021). Sim et al. (2019) identified the centers of c1 and c2, respectively, as  mas y−1 and
  mas y−1. Hunt & Reffert (2021) located the center of c3 as,
  mas y−1. Sim et al. (2019) estimated the ages of c1 and c2 to be about 2.8 Myr and 7.1 Myr, respectively. As these three OCs are close to each other, young, and have similar PMs, we are interested in their detailed dynamic properties, such as the possibility they are gravitationally bound or interacting.
A certain percentage (∼12%) of OCs comprise binary or multiple systems in solar neighborhood (de La Fuente Marcos & de La Fuente Marcos 2009), either primordial or captured. At the present rapid pace of OC discovery in general, one can expect new binary and multiple OCs to be identified.
In this paper, we estimate the ages of c1, c2, and c3 from isochrone fitting. We also estimate their three-dimensional space velocities. From these data and metallicity estimates we examine the possibility that they are or were physically associated.
The structure of this paper is as follows: Section 2 describes the data extracted from Gaia EDR3; in Section 3 we detail the procedures of member selections of the three clusters and isochrone fitting using Gaia DR3 passpands; their ages, kinematic properties, relative distances, and metallicities are presented in Section 4; our conclusions are given in Section 5; and this paper is summarized in Section 6.
2. Data
The Gaia EDR3 astrometric parameters (Lindegren et al. 2021b; Gaia Collaboration et al. 2021)  are used to identify member candidates of the three clusters. We first select sources within a 40° × 40° zone on sky, and restrict the distance via the parallaxes ϖ. The relative errors of ϖ and PMsare restricted to 10% to ensure the qualities of data. Furthermore, we apply the renormalized unit weight error (RUWE; Lindegren 2018; Lindegren et al. 2021b) to refine our selections. The following constraints were used to define our primary sample:
- 1.260 < α < 300, −20 < δ < 20, 1/0.700 < ϖ < 1/0.250;
- 2.parallax over error > 10;
- 3.

- 4.
- 5.RUWE < 1.4.


Using the above criteria, 965,430 sources which contain all three Gaia passbands  are retained as our primary sample. However, only a small fraction of this sample have radial velocities RVs in Gaia DR3 (Katz et al. 2022) and the number will drop dramatically if we restrict the relative error of RV too strictly. It is more reasonable to search for clusters members in 5D phase space
  (3D Cartesian coordinates and 2D tangential velocity), where κ = 4.74047 and d is distance. The photogeometric distance from Bailer-Jones et al. (2021) is applied in the calculation and the inverse of parallax 1/ϖ is used for the distance for those without the photometric distance from Bailer-Jones et al. (2021). In addition, we correct ϖ with the code
5
from Lindegren et al. (2021a) to calculate the parallax zero point. Galpy (Bovy 2015) is used to calculate the Galactic Cartesian coordinates and velocities. We set the radial distance and height of Sun in Galactocentric frame at R⊙ = 8.3 kpc (Gillessen et al. 2009), Z⊙ = 0.027 kpc (Chen et al. 2001), and its velocity as
(3D Cartesian coordinates and 2D tangential velocity), where κ = 4.74047 and d is distance. The photogeometric distance from Bailer-Jones et al. (2021) is applied in the calculation and the inverse of parallax 1/ϖ is used for the distance for those without the photometric distance from Bailer-Jones et al. (2021). In addition, we correct ϖ with the code
5
from Lindegren et al. (2021a) to calculate the parallax zero point. Galpy (Bovy 2015) is used to calculate the Galactic Cartesian coordinates and velocities. We set the radial distance and height of Sun in Galactocentric frame at R⊙ = 8.3 kpc (Gillessen et al. 2009), Z⊙ = 0.027 kpc (Chen et al. 2001), and its velocity as  (Schönrich et al. 2010) relative to the local standard of rest (LSR), where VLSR = 240.0 km s−1 according to Reid et al. (2014).
3. Methods
3.1. Member Selections in 5D Phase Space
There are a number of known OCs in the region covering our primary sample. We collected catalogs from Cantat-Gaudin et al. (2018), Cantat-Gaudin et al. (2019), Cantat-Gaudin & Anders (2020a), Cantat-Gaudin et al. (2020b), Castro-Ginard et al. (2018), Castro-Ginard et al. (2019), Castro-Ginard et al. (2020), Kharchenko et al. (2013), Liu & Pang (2019), Sim et al. (2019), He et al. (2021), and Hunt & Reffert (2021), and show them in Figure 1 as triangles of different colors. Note we also use parallaxes gleaned from the literature to restrict our search to OCs in the same distance range as our sample. We use the same definition as in our previous papers (Ye et al. 2021a, 2021b) to calculate the number of neighbors of each star in 5D phase space. Stars within a radius of 15 pc in  and a radius of 1.1 km s−1 in tangential velocity are defined as the neighbors of a given source. Applying a lower limit of μ + 3σ (mean value plus three times standard deviation of neighbors) retains 3432 stars, which includes almost all the clusters in the literature. We then test both HDBSCAN (Campello et al. 2013; McInnes et al. 2017) and DBSCAN (Ester et al. 1996; Pedregosa et al. 2012) to search for member candidates of clusters among those 3432 stars. Eventually, we focus on the clusters in the region of 275° < α < 285°, −5° < δ < 4°. Using
 = 0.5, minPts = 30 via DBSCANin
 , this procedure yields the three OCs marked as colored crosses in Figure 1. The blue and orange crosses correspond to c1 and c2. The green cluster corresponds to c3.
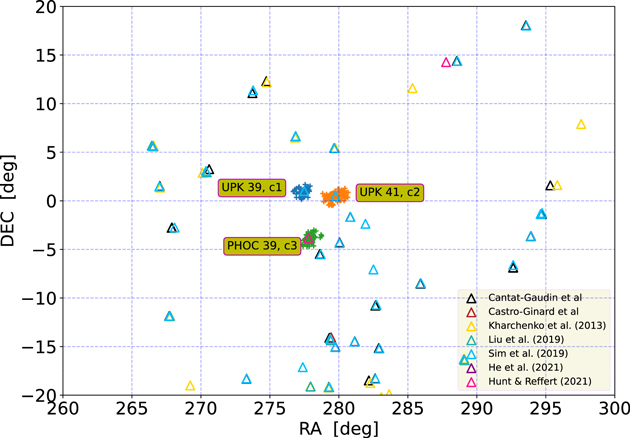
Figure 1. Pluses (+) represent stars in the three OCs c1(blue), c2(orange), and c3(green) of our study, located in 5D phase space. The corresponding color is adopted through this paper. Other known OCs from literature in this part of the sky are represented by colored triangles.
Download figure:
Standard image High-resolution image3.2. Member Refinement with Radial Velocity
Both the literature PMs values and those determined for our OCs member candidates are quite similar. However, we had no prior knowledge of their radial velocities. In this paper, we found RVs for a few stars in Gaia DR3. The mean errors in RVs of the member candidates are: 10.81, 7.26, and 8.32 km s−1 for c1, c2, and c3, respectively. We then set these values as the upper limits for σRV in our subsequent RV analysis. We found two stars from c1 and c2, respectively, have RVs in LAMOST DR8 low-resolution archive (Zhao et al. 2006; Cui et al. 2012; Zhao et al. 2012; Liu et al. 2015). In each cluster, some RVs deviate greatly from the median value, especially at G > 14.5 mag. Such stars are removed from our candidate list. Finally, we adopt the RV for each cluster as the mean value of the remaining members. Note that c1 contains one star for which only a LAMOST RV is available; this star was included in the calculation of the mean RV for c1. In Figure 2, the remaining RVs from Gaia DR3 are shown in Dec versus RV as dots in different colors, and two RVs from LAMOST (in c1 and c2) are marked as triangles. The adopted values are −8.05, −9.53, and −4.15 km s−1 for c1, c2, and c3, respectively, and are indicated with the dashed lines in different colors in Figure 2.
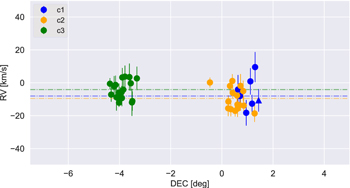
Figure 2. DEC vs. RV for the clusters candidates with Gaia DR3 and LAMOST DR8 RVs. For Gaia RVs, only σRV less than the mean σRV in each cluster were used. Data from LAMOST are marked as triangles. The horizontal lines indicate the final estimated RVs for the clusters that are the mean values.
Download figure:
Standard image High-resolution image3.3. Color-absolute-magnitude Diagram and Isochrone Fitting
The photometric parameters  and their errors, reddening, and extinction used in this paper are from Gaia DR3, which are obtained by cross-matching the member candidates with Gaia DR3 in TOPCAT (Taylor 2005). The errors in
  are from CDS.
6
For reddening E(BP-RP) and extinction AG, the uncertainties are taken as half the difference between upper and lower confidence levels, same as the uncertainties adopted in distance in this paper. There are >73%, >86%, and >96% stars having reddening and extinction data in Gaia DR3. With the dereddened color
are from CDS.
6
For reddening E(BP-RP) and extinction AG, the uncertainties are taken as half the difference between upper and lower confidence levels, same as the uncertainties adopted in distance in this paper. There are >73%, >86%, and >96% stars having reddening and extinction data in Gaia DR3. With the dereddened color  and absolute magnitude
 ![${M}_{{\rm{G}}}=G-5\mathrm{lg}\left(\tfrac{d[{\rm{p}}c]}{10}\right)-{A}_{{\rm{G}}}$](https://content.cld.iop.org/journals/1538-3881/164/4/132/revision1/ajac8545ieqn15.gif) , where d is the distance of each star, we estimated the ages of these clusters by fitting isochrones to each cluster’s CAMD. Two stars in c2 that diverge from the clearly coeval sequence were removed from the member candidate sample. The procedure outlined above yields 61, 103, and 78 member stars in each cluster. In Sim et al. (2019), c1 and c2 were determined to have ages of about 2.8 Myr and 7.1 Myr, respectively, according to isochrone fitting. The main sequence of c3 is noticeably different from the other two clusters. We use a series of PARSEC (version 1.2s) isochrones
7
(Bressan et al. 2012; Chen et al. 2014, 2019) with Gaia EDR3 photometric data to fit with these three clusters. The range of [M/H] of the isochrone grid is −0.5 ∼ 0.3dex with a interval of 0.05 dex. The ages of isochrones range from 1 to 30 Myr with a interval of 0.1 Myr. The closest isochrone for a cluster is adopted by minimizing
, where d is the distance of each star, we estimated the ages of these clusters by fitting isochrones to each cluster’s CAMD. Two stars in c2 that diverge from the clearly coeval sequence were removed from the member candidate sample. The procedure outlined above yields 61, 103, and 78 member stars in each cluster. In Sim et al. (2019), c1 and c2 were determined to have ages of about 2.8 Myr and 7.1 Myr, respectively, according to isochrone fitting. The main sequence of c3 is noticeably different from the other two clusters. We use a series of PARSEC (version 1.2s) isochrones
7
(Bressan et al. 2012; Chen et al. 2014, 2019) with Gaia EDR3 photometric data to fit with these three clusters. The range of [M/H] of the isochrone grid is −0.5 ∼ 0.3dex with a interval of 0.05 dex. The ages of isochrones range from 1 to 30 Myr with a interval of 0.1 Myr. The closest isochrone for a cluster is adopted by minimizing  in CAMD.
  is defined as Equation (1) in Liu & Pang (2019). For a cluster with n member candidates,
  for a given isochrone is:

where
x
i
gives the position of member star i in CAMD, and
x
i,nn
represents the nearest neighbor of member i in the isochrone in the same parameter space. The nearest neighbor is identified by the k-D tree approach in scipy (Virtanen et al. 2020). The influences of the errors in GBP, GRP and G passpands have also been considered. For each star, we use the errors in  and MG to randomly generate 100 different data points following a Gaussian distribution and calculate
  for j in those data points. The mean value is adopted for star i as
  . Then
  is evaluated between each cluster and each isochrone. To obtain the ages, we use the first 1% of the isochrones which have the smallest
  . In Figure 3, we present the 1% isochrone age versus [M/H]. It is apparent in this figure that c1 and c2 are similar both in age (c1 : 6.3 ± 0.9 Myr, c2 : 8.1 ± 1.4 Myr) and [M/H] (c1 : −0.3 ± 0.1 dex, c2 : −0.3 ± 0.1 dex), and c3 is much older and richer in [M/H] than the others.
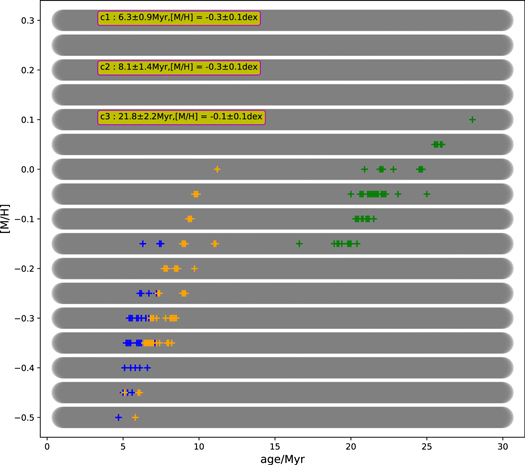
Figure 3. [M/H]] vs. age. The gray shadows show the coverages of PARSEC isochrones used in this paper. The colored crosses present the top 1% of isochrones that have smallest  for the three clusters.
Download figure:
Standard image High-resolution image4. Results
4.1. Age
The estimated ages of c1, c2, and c3 from our best-fitting isochrones are 6.3 ± 0.9, 8.1 ± 1.4, and 21.8 ± 2.2 Myr, respectively. In Figure 4, cluster members and isochrones with the corresponding best ages and [M/H] between −0.5 and 0.3 dex are presented.
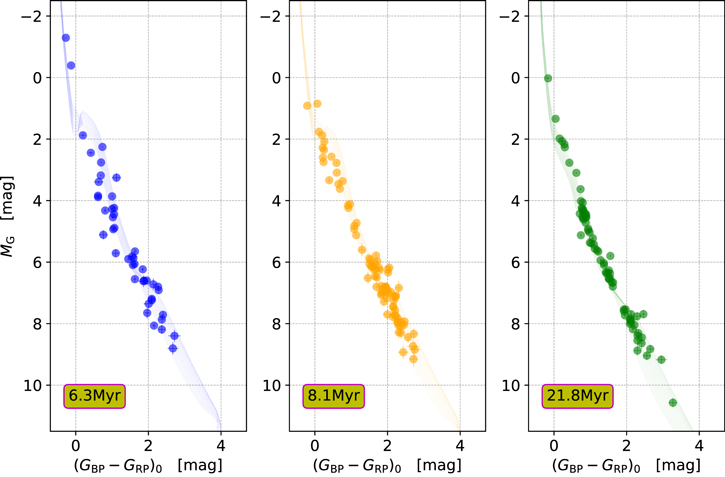
Figure 4. CAMD for c1, c2 and c3 (left to right), along with adopted ages and the corresponding isochrones with [M/H] between −0.5 to 0.3 dex (interval 0.05 dex) are shown.
Download figure:
Standard image High-resolution image4.2. Galactocentric Cylindrical Velocity
Averaging over our clusters members, the PMs of c1, c2, and c3 are  mas y−1,
  mas y−1, and
  mas y−1, respectively. The PMs and RVs imply similar space velocities for these three clusters in a Galactocentric cylindrical coordinates. We calculate that
  km s−1,
  km s−1, and
  km s−1 for c1, c2, and c3, respectively, where VR > 0 represents moving away from Galactic center, Vϕ
is the direction of Galactic rotation, and VZ points to the Galactic North Pole.
km s−1 for c1, c2, and c3, respectively, where VR > 0 represents moving away from Galactic center, Vϕ
is the direction of Galactic rotation, and VZ points to the Galactic North Pole.
4.3. Orbit and Separation
As the velocities of these three OCs are very similar, we are curious about their Galactic orbits and three origins. We use MWPotential2014 in Galpy to trace their birthplaces that correspond to their ages. In the left panel of Figure 5, we trace back c1, c2, and c3 to their birthplaces, marked as filled circles. The orange triangle shows c2's position when c1 was born. The positions of c3 in 6.3 and 8.1 Myr ago are presented as other green signs. The right panel of Figure 5 presents the orbits from their birthplaces to where they will be 400 Myr henceforth. The circles represent the origins and the crosses are their locations in the future. All the three clusters will orbit in unison in the Galactic thin disk. The minimal distances among them are on the order of dozens of parsecs. We use the standard deviations of positions and velocities of member stars in each cluster to randomly generate parameters following a Gaussian distribution. The adopted deviations in RVs are taken as 1.1 km s−1, the same as we used in Section 3.1 to extract member candidates from tangential velocities. We produce three data points in each position parameters and five in each velocity parameter. We then construct 3375 different orbits for each cluster and calculate the relative distance among c1, c2, and c3 at different times.
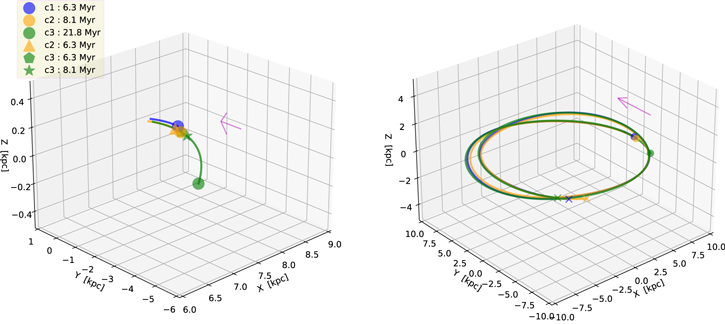
Figure 5. Left panel: orbits of c1, c2, and c3 traced back to their birthplaces. c3 was close to c1 and c2 when they were born and c2 was near c1 in the time of the formation of c1. Right panel: circles are where these clusters were born and crosses are their locations after 400 Myr. They did and will orbit together in the thin disk. The arrow in each panel shows the direction of motion.
Download figure:
Standard image High-resolution imageIn Figure 6, the separations between two clusters are presented. The black (solid, dotted, and dashed) lines in the panels are the separations calculated by the adopted positions and velocities for c1, c2, and c3. The gray shaded regions indicate the uncertainties in the orbits. These lower and upper bounds are μ − σ and μ + σ of the separations calculated with the generated data points. If the relative distance between two clusters is less than three times the outer radius, the mutual interaction becomes significant (Innanen et al. 1972). de La Fuente Marcos & de La Fuente Marcos (2009) used three times the mean tidal radius (rt) as the upper limit to select paired OCs. The adopted mean value of tidal radius is 10 pc in de La Fuente Marcos & de La Fuente Marcos (2009). However, this value may be smaller than the actual average value. In Kharchenko et al. (2013), the mean value of rt is 11.59 pc as determined from an analysis of nearly 3000 OCs. In recent research, parts of the known OCs have coronae or haloes (Meingast et al. 2021). According to Tarricq et al. (2022), the mean tidal radius is ∼30 pc as inferred from an analysis of more than 300 OCs in the solar neighborhood. This same study suggested a few OCs have rt > 65 pc. Leaving out those OCs with too large rt, the mean rt is still ∼24 pc in Tarricq et al. (2022). Some of our study’s cluster members do not have reddening and extinction estimates, which are important to estimating the stellar mass in CAMD using isochrones. The member candidates ofc1, c2, and c3 are clearly incomplete in MG, as seen in Figure 4. Therefore, rt calculated based on only these member candidates may be underestimated. In this work, we adopted an average tidal radius  pc. Therefore, clusters separated by less than
  pc may be tidally interacting. In Figure 6, the green shading with different transparencies are the regions where relative distances are in
  ,
,  , and
, and  pc.
pc.
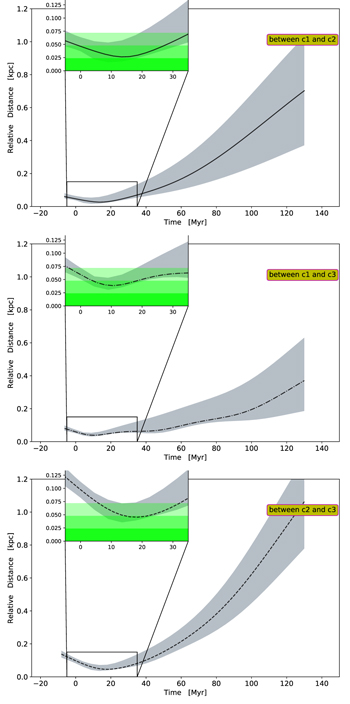
Figure 6. Relative distances among c1, c2, and c3 vs. time. The gray shaded areas present the uncertainties of relative distances and the green shaded areas denote their relative distances in multiples of  .
.
Download figure:
Standard image High-resolution imageThe distributions of member candidates in Cartesian coordinates xyz are presented in Figure 7 to show the dimensions of the clusters and  more clearly. In this figure, member stars in the xy plane appear to be stretched along the line of sight, primarily due to uncertainties in distance, reddening, and extinction. The solid circles are rt calculated from the total cluster mass of c1, c2 and c3, using Equation (2) according to Pinfield et al. (1998),

Mtotal in Equation (2) is the accumulated stellar mass for a cluster. The other constants are: gravitational constant G = 4.3 × 10⁻⁶ kpc (km s−1)2
 and the Oort constants A = 15.3 ± 0.4 kpc−1 km s−1 and B = −11.9 ± 0.4 kpc−1 km s−1 from Bovy (2017). The dashed circles represent the above three increments in
  . Some members of c1 are within the range of
  of c2, and vice versa. However, c3 is farther apart from the other two clusters and is unlikely to be tidally influenced by them at the present time.
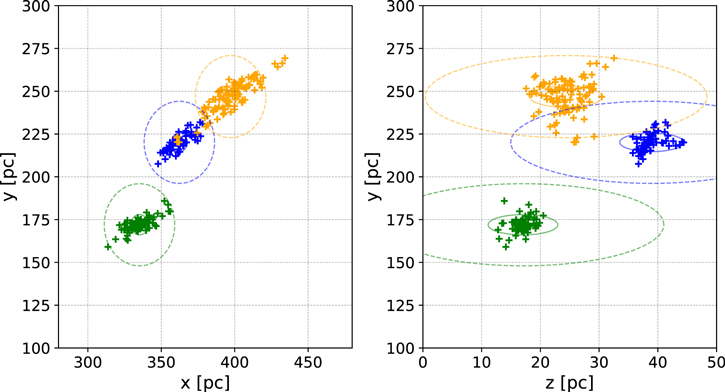
Figure 7. Distributions of member stars of c1, c2 and c3 in Cartesian coordinates xyz centered at Sun. The solid circles are the tidal radii based on the total cluster mass, and the dashed circles are  pc.
pc.
Download figure:
Standard image High-resolution image4.4. Metallicity
In Section 3.3, the metallicity [M/H] was estimated from isochrone fitting : −0.3 ± 0.1 dex for c1, c2, and −0.1 ± 0.1 dex for c3. Here, we use [M/H] (mh_gspphot) from Gaia DR3 to evaluate the metallicities of these clusters. We adopt the upper and lower bounds of [M/H] to represent the uncertainties of [M/H], and select 21 member candidates of each cluster with the smallest [M/H] uncertainties, which lowers the mean uncertainties of [M/H] to 0.02 dex for each cluster. In Figure 8 we present those stars in [M/H] versus G, and the median values of [M/H] are −0.26 dex for c1, c2, and −0.12 dex for c3, indicated by the dashed lines.
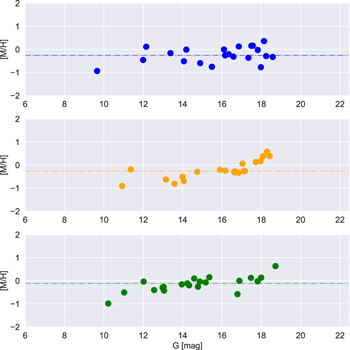
Figure 8. Distributions of [M/H] vs. G for c1, c2, and c3. The colored lines present the median values of [M/H] for the clusters.
Download figure:
Standard image High-resolution image5. Conclusion
In this section, we discuss the probable relationships among these three OCs based on their separations, kinematics, ages, and metallicities. The properties of c1, c2, and c3 are summarized in Table 1.
Table 1. Properties of c1, c2, and c3 from Our Member Candidates
| Name | gl | σgl | gb | σgb | d | σd |

|

| μδ |

| RV | Vr | Vϕ | VZ | τ | στ | [M/H] |
|---|---|---|---|---|---|---|---|---|---|---|---|---|---|---|---|---|---|
| deg | kpc | mas y−1 | km s−1 | Myr | dex | ||||||||||||
| (1) | (2) | (3) | (4) | (5) | (6) | (7) | (8) | (9) | (10) | (11) | (12) | (13) | (14) | (15) | (16) | (17) | (18) |
| c1 | 31.28 | 0.36 | 5.25 | 0.25 | 0.426 | 0.008 | 3.24 | 0.31 | −8.59 | 0.43 | −8.05 | −5.18 | 238.33 | −7.17 | 6.3 | 0.9 | −0.26 |
| c2 | 31.86 | 0.49 | 2.98 | 0.37 | 0.468 | 0.017 | 2.65 | 0.27 | −8.35 | 0.27 | −9.53 | −3.54 | 236.09 | −6.91 | 8.1 | 1.4 | −0.26 |
| c3 | 27.17 | 0.39 | 2.59 | 0.23 | 0.377 | 0.009 | 2.06 | 0.20 | −9.00 | 0.26 | −4.15 | −8.42 | 239.61 | −3.61 | 21.8 | 2.2 | −0.12 |
Note.
σgl
, σgb
, σd
,  , and
, and  are the standard deviations from cluster members. τ is the age of a cluster.
Download table as: ASCIITypeset image
When c1 was formed, c2 was very close to it. The relative distance between them is less than  pc at present. The extensions of
  for c1 and c2 have some areas overlapped at present, suggesting their tidally interacting. Their
  also differ by less than 3 km s−1. In addition, their ages and metallicities are almost the same. We conclude that c1 and c2 are a primordial binary cluster, formed simultaneously.
On the other hand, c3 was formed earlier and has a higher metallicity. In addition, the current separation between c3 and c1 (or c2) and their relative space velocities suggest that there was very little chance that c3 was closer to c1 (or c2) than  since c3 was formed. Also, most massive member candidates in c3 is no more than about 4 M⊙. Therefore, it is unlikely that c3 triggered the formation of the other two clusters. We consider c3 is not part of a multiple system with c1 and c2. However, Figure 6 suggests that tidal exchanges of stars among c1, c2 and c3 may occur in the future.
6. Summary
We have identified three OCs, named c1, c2, and c3 in this paper. Using data from Gaia DR3, we calculate the dereddened colors  and absolute magnitudes MG. Isochrone fits to the CAMD indicates that the ages of c1, c2, and c3 are about 6.3 ± 0.9, 8.1 ± 1.4, and 21.8 ± 2.2 Myr, respectively. All the cluster member candidates have similar PMs. From a few RVs in Gaia and LAMOST, we have estimated the mean RVs for these clusters. The difference between c1 and c2 is less than 3 km s−1. The Galactocentric Cylindrical velocities
  km s−1,
  km s−1, and
  km s−1 for c1, c2, and c3, respectively. The above data were used to compute the orbits of each OC and the relative distances among them. Using metallicities for individual OC stars from Gaia DR3, the median values of [M/H] are −0.26 dex, −0.26 dex, and −0.12 dex, respectively. From relative distances, kinematics, ages, and metallicities, we conclude c1 and c2 comprise a simultaneously formed primordial binary OC. We also expect there may be tidal captures among c3 and c1, c2 in the future.
This study is supported by the National Natural Science Foundation of China under grant Nos. 11988101, 11973048, 11927804, and 11890694, and National Key R&D Program of China No. 2019YFA0405502. We acknowledge the support from the 2 m Chinese Space Station Telescope project: CMS-CSST-2021-B05. This work presents results from the European Space Agency (ESA) space mission Gaia. Gaia data are being processed by the Gaia Data Processing and Analysis Consortium (DPAC). Funding for the DPAC is provided by national institutions, in particular the institutions participating in the Gaia MultiLateral Agreement (MLA). The Gaia mission website is https://www.cosmos.esa.int/gaia. The Gaia archive website is https://archives.esac.esa.int/gaia. Guoshoujing Telescope (the Large Sky Area Multi-Object Fiber Spectroscopic Telescope LAMOST) is a National Major Scientific Project built by the Chinese Academy of Sciences. Funding for the project has been provided by the National Development and Reform Commission. LAMOST is operated and managed by the National Astronomical Observatories, Chinese Academy of Sciences. T.D.O. gratefully acknowledges support from the U.S. National Science Foundation grant AST-1910396.
Software: Astropy (Astropy Collaboration et al. 2013), DBSCAN (Ester et al. 1996), Galpy (Bovy 2015), HDBSCAN (Campello et al. 2013; McInnes et al. 2017), Matplotlib (Hunter 2007), Numpy (van der Walt et al. 2011), Pandas (McKinney 2010), Scipy (Virtanen et al. 2020), Scikit-learn (Pedregosa et al. 2012), Topcat (Taylor 2005).
Footnotes
- 5
- 6
- 7