Abstract
Suspended dust is a vital component of Martian climatic system and its temporal-spatial variation can influence the recession of the South Polar Seasonal Cap (SPSC). However, dust activity varies across different stages and years, affecting the SPSC recession process differently. Continuous observations of SPSC/South Polar Residual Cap (SPRC) across several Martian years, alongside segmented analyses of annual dust activity, will provide new insights into the climate conditions of Martian south polar region. Here, we performed a combined analysis on the extents of SPSC from MY28-MY31 and MY36, together with the concurrent Martian atmospheric optical thickness, to assess the influence of dust activity at various recession time steps. Results show that dust activity peaks in both spring and summer can impact the SPSC/SPRC recession. The recession process is accelerated if the dust activity peak occurs earlier. If the timing of the peak dust activity is identical, the intensity of the dust activity influences the recession. Specific regions, such as the “Cryptic Region” and the Mountains of Mitchel, respond uniquely to dust activity. Higher dust intensity slows the recession of the Cryptic Region, while the SPSC in the Mountains of Mitchel area shows variability in recession timing based on local dust activity intensity. This research provides observational constraints that enhance our understanding of Martian atmospheric circulation and can potentially aid the future development of polar dust activity models.
Original content from this work may be used under the terms of the Creative Commons Attribution 4.0 licence. Any further distribution of this work must maintain attribution to the author(s) and the title of the work, journal citation and DOI.
This article was updated on April 7, 2025 to correct a production error which led to incorrect text citations for some references.
1. Introduction
The presence of suspended dust in the Martian atmosphere and its temporal and spatial variations are crucial components of the Martian climate system (O. B. Toon et al. 1980). Dust activity occurs on Mars across various seasons and locations (P. B. James et al. 1979; R. A. Kahn et al. 1992), which is observable through various remote sensing methods, such as visible image (Z. Li et al. 2024), CRISM spectra (A. J. Brown et al. 2014), etc. This activity varies in scale and can be categorized into localized and global events (M. A. Kahre et al. 2017). Notably, global-dust activity exhibits significant interannual variability across different Martian years (L. J. Martin & R. W. Zurek 1993; M. D. Smith 2004). Although dust activity has not been proven to be a decisive factor for polar environments (P. B. James et al. 1987; J. L. Benson & P. B. James 2005), the suspension of dust in the Martian atmosphere and its deposition on the surface influence the recession of the South Polar Seasonal Cap (SPSC; S. Piqueux & P. R. Christensen 2008; D. A. Paige & S. E. Wood 1992; B. P. Bonev et al. 2006, 2008), as dust attenuates the solar radiation reaching the surface (P. B. James et al. 2001; J. L. Benson & P. B. James 2005). Additionally, dust deposition affects the reflectance of frost deposits (J. L. Benson & P. B. James 2005; H. H. Kieffer et al. 2006; Y. Langevin et al. 2006), influencing the recession of the SPSC.
The impact of dust activity on the recession of the SPSC has been documented in multiple studies, which indicate that the dust activity can accelerate/delay the recession process of the SPSC. P. B. James & K. Lumme (1982) suggested that the similarities in the SPSC regression curves for MY9 and MY10, along with differences from the South Polar Residual Cap (SPRC), result from the similarities in dust activity and differences in intensity during those years. Mars Global Surveyor Mars Orbiter Camera images tracked the SPSC recession in MY23 and MY24 (P. B. James et al. 2000, 2001). The results for these years were similar, but the dust activity levels were variable (M. D. Smith et al. 2002; J. L. Benson & P. B. James 2005). P. B. James et al. (2001) attributed fluctuations in reflectance in the early thaw region of the MY24 SPSC (Solar Longitude (Ls) from 230° to 255°) to local dust activity. T. N. Titus & H. H. Kieffer (2002) and P. B. Bonev et al. (2002) documented a significant dust event in MY25 that accelerated the seasonal cap recession in the Mitchel Mountains area compared to non-dust-activity years. J. L. Benson & P. B. James (2005) analyzed differences in the SPSC for MY9, MY12, MY24, MY25, and MY26. P. B. James et al. (2010) discussed how late spring perihelion dust activity in MY9 and MY28 (B. A. Cantor et al. 2008) increased atmospheric opacity, thereby accelerating the sublimation of CO2 frost: the dust activity transfers a portion of solar radiation energy in the visible bands to the infrared range that is highly absorbed by CO2 (P. B. Bonev et al. 2002, 2008). S. Piqueux et al. (2015) compared the SPSC profiles across different Martian years at the same Ls, showing that dust activity accelerates SPSC recession. Z. Li et al. (2024) proposed that the differences in the recession process of the SPSC in MY36 compared to other Martian years may be due to the unusual dust activity during that year.
Numerous studies have shown that dust activity has an impact on the recession of the SPSC. However, the general patterns of how variations in dust activity across different Martian years affect the SPSC still require further investigation. Therefore, continuous observation and temporal analysis of SPSC/SPRC across different years will provide new insights into the climatic conditions of the Martian South Pole. This study utilizes dynamics data of the SPSC/SPRC, coupled with calculated Martian dust activity data (atmospheric optical thickness, from Martian Climate Database; MCD; F. Forget et al. 1999; L. Montabone et al. 2015, 2020; E. Millour et al. 2018), to obtain the time steps of the SPSC for different Martian years, and investigate the effects of dust activity at these time steps. Our analysis reveals new relationships between SPSC during Ls = 210°–340° for MY28-MY31 and MY36, providing materials and constraints for future analysis, and modeling of the SPSC and dust activity.
2. Data and Methods
2.1. SPSC Observations
The Chinese Tianwen-1 orbiter offered data on the SPSC during MY36, providing the most recent sequences of the recession of the SPSC (Z. Li et al. 2024). Meanwhile, the Mars Reconnaissance Orbiter contributes supplementary data sets through MARCI images (W. M. Calvin et al. 2017), which were previously used to get the sequences of the SPSC in MY28–31 (P. Acharya et al. 2024).
To describe the recession process of the SPSC, we applied the polynomial model (Z. Li et al. 2024) to calculate the time steps for the data from MY28–31 and MY36. This approach first employs the leave-one-out method for cross validation within the dataset and selects the optimal polynomial degree by minimizing the root mean square error (RMSE). The chosen polynomial degree is then used to fit the scatter points of SPSC recession. By calculating higher-order derivatives of the fitted polynomial, the curves for the rate, acceleration, and jerk of SPSC changes are obtained, allowing the recession process to be divided into different stages.
In this work, we conducted the cross validation on the SPSC scatter points for MY28-MY31 and MY36. The RMSE for polynomials of degrees 1–7 was calculated as shown in Table 1, where the trends of RMSE initially decreases and then increases. The optimal degree of the polynomial is selected when the RMSE reaches its minimum (Z. Li et al. 2024). The resulting RMSE indicates that a fifth-degree polynomial is the optimal option for Ls = 210°–350°. We obtained the fitting results for the fifth-degree function (Figure 1) and identified time steps (Table 2): The rate maximum (RM) point indicates the time when the maximum rate occurs during recession. The Mountains of Mitchel separation (MS) point marks the time of the separation between the Mountains of Mitchel seasonal cap and the main cap during recession. The jerk maximum (JM) point represents the time when the jerk of cap recession reaches its peak. The Southern Mountain Water Ice Outliers (SW) point indicates the time of rapid recession of the water ice in the Southern Mountains. The recession stop (RS) point signifies the time when the SPSC recession stops. The differences in timing (dates or delays) at these time steps represent variations in SPSC recession across different Martian years.
Table 1. The RMSE of the First–Seventh Degree Polynomial Models
| MY28 | MY29 | MY30 | MY31 | MY36 | |
|---|---|---|---|---|---|
| 1st order | 367.9 | 681.9 | 1246.2 | 1374.3 | 160.7 |
| 2nd order | 43.1 | 43.7 | 85.5 | 43.6 | 39.8 |
| 3rd order | 17.3 | 40.3 | 83 | 43.3 | 32.4 |
| 4th order | 17.2 | 18.5 | 55.7 | 32 | 11.4 |
| 5th order | 16.8 | 16.3 | 53.3 | 23.4 | 6.2 |
| 6th order | 138.3 | 69 | 60.1 | 30.6 | 17.2 |
| 7th order | 2753.3 | 12600.8 | 2971.9 | 6092.7 | 51246.7 |
Download table as: ASCIITypeset image
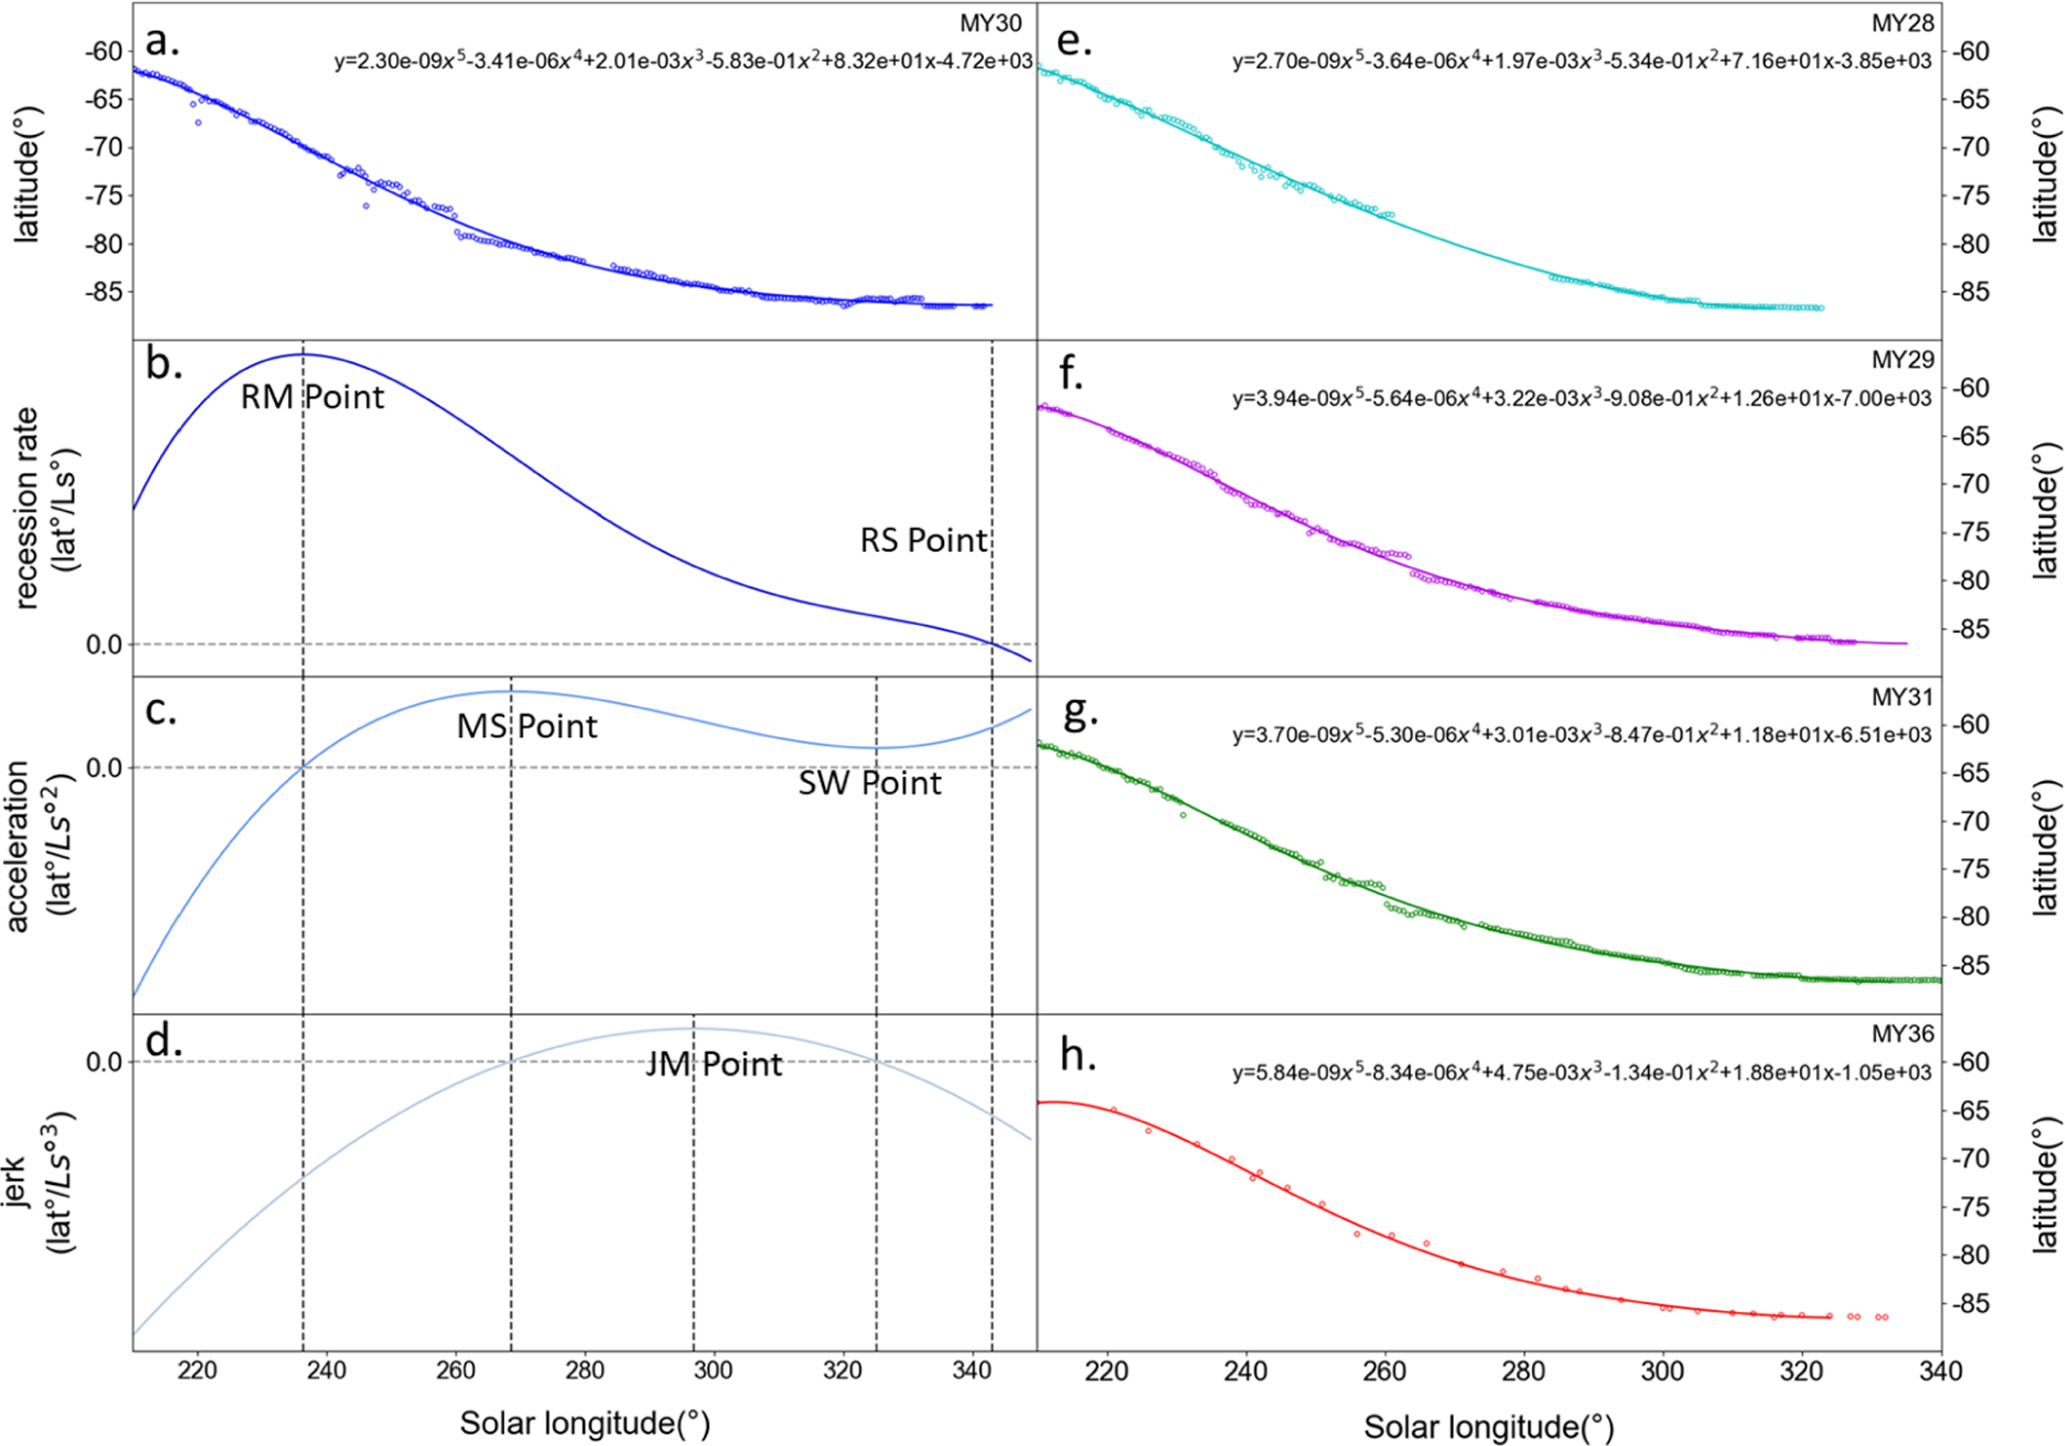
Figure 1. The fifth-order polynomial-fitting results for different Martian years. (a) The fifth-order polynomial fit of the recession curve for MY30. (b) The recession rate for MY30, represented as the negative first derivative of the fifth-order polynomial. The time at which the maximum value occurs (RM point) and the time at which the rate reaches zero (RS point) are determined. (c) The acceleration for MY30, represented as the second drivative of the fifth-order polynomial. The tme of separation of the mountains of Mitchel (MS point) and the time of recession of the water ice on the Southern Mountain (SW point) are determined. (d) The jerk for MY30, represented as the negative third derivative of the fifth-order polynomial. The tme at which the maximum jerk occurs JM point) is determined. (e)–(h) The fifth-order polynomial fit of the recession curves for MY28, MY29, MY31, and MY36.
Download figure:
Standard image High-resolution imageTable 2. Time Steps Obtained from Fitting for Different Martian Years
| Rate Maximum (RM) Point | Mountains of Mitchel Separation (MS) Point | Jerk Maximum (JM) Point | Southern Mountain Water Ice Outliers (SW) Point | Recession Stop (RS) Point | |
|---|---|---|---|---|---|
| MY28 | Ls = 233 08 08 | … | Ls = 270 36 36 | … | Ls = 316 15 15 |
| MY29 | Ls = 235 33 33 | Ls = 262 86 86 | Ls = 286 86 86 | Ls = 310 85 85 | Ls = 335 62 62 |
| MY30 | Ls = 236 33 33 | Ls = 268 55 55 | Ls = 296 87 87 | Ls = 325 19 19 | Ls = 343 12 12 |
| MY31 | Ls = 235 09 09 | Ls = 263 01 01 | Ls = 285 95 95 | Ls = 308 88 88 | Ls = 333 23 23 |
| MY36 | Ls = 240 57 57 | Ls = 266° | Ls = 285 9 9 | Ls = 305 8 8 | Ls = 324 9 9 |
Download table as: ASCIITypeset image
2.2. Atmospheric Optical Thickness
Atmospheric optical thickness is a parameter used to describe dust activity on the Martian surface, with its calculation method outlined in previous studies (F. Forget et al. 1999; L. Montabone et al. 2015; E. Millour et al. 2018; L. Montabone et al. 2020). This data can be utilized to investigate dust activity on Mars. We processed the atmospheric optical thickness data to obtain the average dust activity for different Martian years (Figure 2). In order to better investigate the relationship between dust activity and the recession of the SPSC, we performed multiple geographical averaging of the atmospheric optical thickness data. First, we averaged the atmospheric optical thickness over the region from 60°S to 90°S for each year to represent the average dust activity in the south polar region, and then compared these results with the recession process of the SPSC for joint analysis (Section 3). Additionally, we extracted and averaged the atmospheric optical thickness data for specific regions to examine the relationship between the recession in these areas and dust activity (Section 4.1).
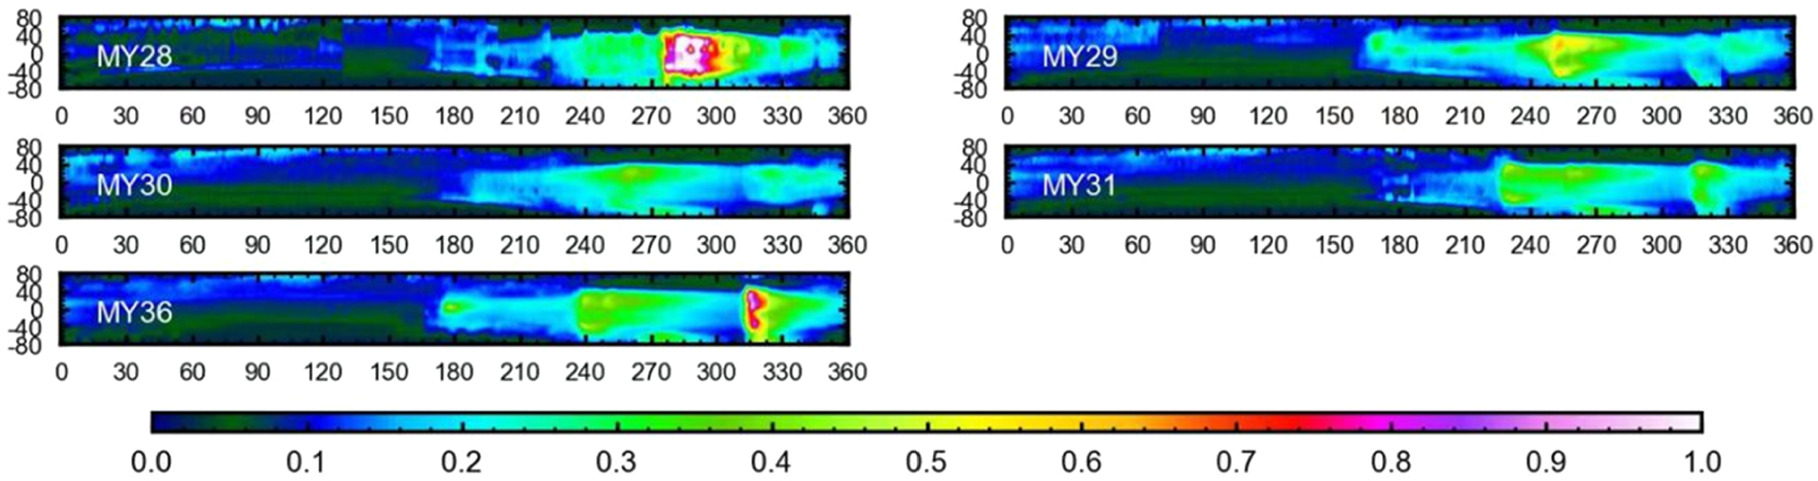
Figure 2. Atmospheric optical thickness for different Martian years. For each subpanel, the vertical axis represents latitude, and the horizontal axis represents solar longitude. The atmospheric optical thickness shown in the figure is the result of longitude averaging at each latitude.
Download figure:
Standard image High-resolution image3. Results
Dust activity varies significantly between MY28-MY31 and MY36 (Figure 3(a)). MY30 was the calmest year in this analysis, showing no significant peaks from spring through early fall (the maximum dust activity in spring occurs around Ls ∼ 270°, indicated by arrow A in Figure 3(a)). Although a minor dust activity peak occurred around Ls ∼ 345°, it appeared notably later than in other years. The year MY28 experienced a prolonged and intense global-dust-storm event, which is regarded as a global-dust- storm year. In contrast, years that did not witness similar global-dust-storm events as MY28 are referred to as non-global-dust-storm years. MY29 exhibited stronger seasonal dust activity than other non-global-dust-storm years between Ls = 240°–270° (indicated by arrow B in Figure 3(a)). MY31 showed moderate dust activity overall, with a brief peak around Ls ∼ 210°–220° (indicated by arrow C in Figure 3(a)) before quickly returning to low levels, followed by a moderate increase after Ls ∼ 310°.In contrast, MY36 displayed distinct behavior, with strong dust activity during Ls ∼ 225°–240° (indicated by arrow D in Figure 3(a)). This dust activity was similar to other non-global-dust-storm years, but from Ls ∼ 310°, it experienced an unprecedented peak. The intensity of this sudden increase was comparable to the peak global-dust activity in MY28 and remained elevated until the end of summer, not returning to average levels of other years. In MY28, between Ls = 210°–270°, the atmospheric optical thickness was relatively low, similar to the values in other years (Figures 2(b), 3(b)), until late spring when intense dust storms emerged, continuing through fall.
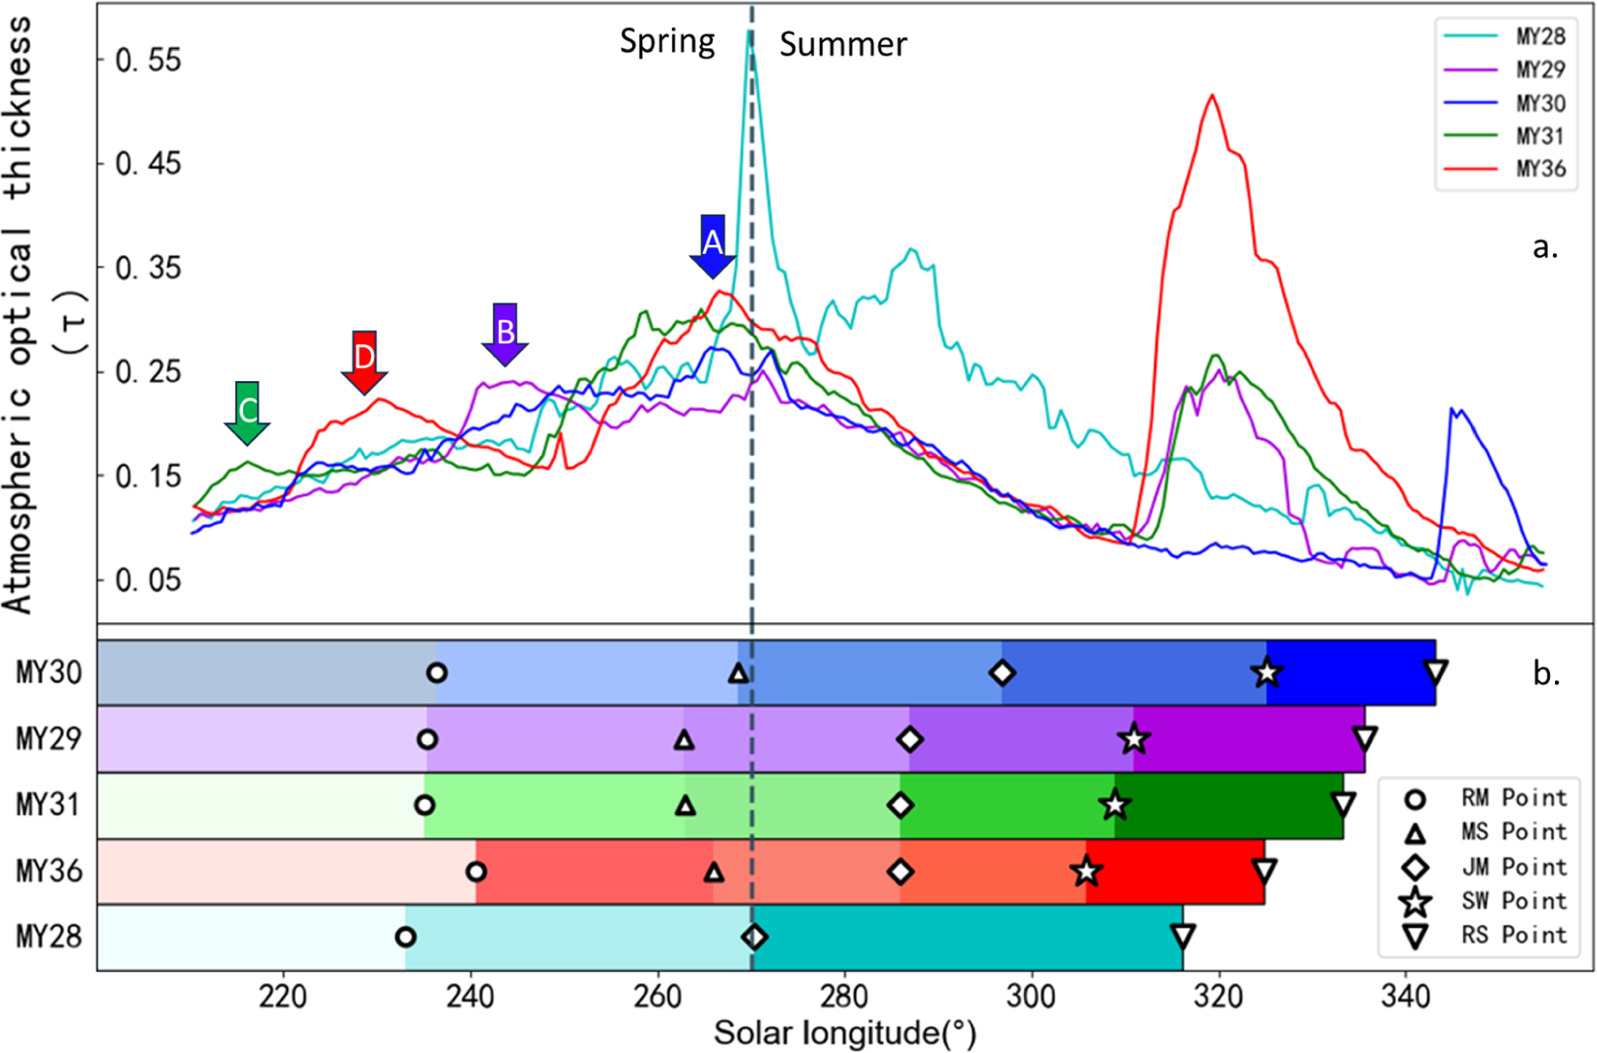
Figure 3. (a) Average atmospheric optical thickness in the Martian south polar region (60°S–90°S). Arrows A-D indicate the peaks of higher atmospheric optical thickness in different Martian years. (b) The recession process and the time steps of the SPSC in different Martian years, ordered up to down by the timing of the recession end dates. The shaded color bar in the figure represents the phases divided by each time step.
Download figure:
Standard image High-resolution imageDust activity can influence the time steps of certain dates in the SPSC recession process (Figure 3(b)). Overall, the time steps of events in the SPSC recession are affected by the intensity of dust activity in the south polar region (60°S–90°S). Similarly, different time steps may exhibit variations based on the phases of dust activity. For different Martian years, JM point, SW point, and RS point are significantly influenced by the peaks and intensity of summer dust activity (Figure 3(b)). In contrast, changes in spring may be influenced by other factors, leading to specific anomalies in the time steps of certain years.
4. Discussion
Previous studies indicate that the SPSC is more sensitive to late spring and summer dust activity (J. L. Benson & P. B. James 2005), primarily due to solar angle effects on the heat flux (P. B. James & K. Lumme 1982). To better differentiate the impacts of dust activity during various phases on SPSC recession, this section will focus on the effects of spring and summer dust activities.
4.1. Southern Hemisphere Spring Dust Activity
Spring dust activity is generally weaker than that in summer, and the lower solar angle results in a reduced atmospheric heating effect from suspended dust on SPSC recession. The RM and MS points in the MY29–31 show certain regularities. As mentioned in Section 3, MY30 had the lowest dust activity level throughout the year, serving as a baseline for our comparison. During spring dust activity, the peak of MY29 (indicated by arrow B in Figure 3) occurs around Ls ∼ 242°and MY31 around Ls ∼ 231° (indicated by arrow C in Figure 3). This variation influences the RM and MS points for MY29 and MY31, leading to a slightly quicker recession compared to MY30 (Figure 3(b)). However, both MY28 and MY36 exhibit some anomalies. In MY28, a high-intensity and widespread global-dust-storm event occurring during Ls ∼ 260°–270° resulted in the MS points not being observed during this period. In MY36, there is a delay in time steps and an inconsistency in the timing of peak activity. We attribute the anomalies observed in MY36 to regional dust activity. The impact of regional dust activity on the RM and MS points in MY36 will be discussed in the two following sections. Due to the lack of data in MY28, we are unable to observe the relationship between time steps and dust peaks.
4.1.1. RM Point
The RM point represents the maximum rate of SPSC recession after Ls = 210°, considered as a result of the earlier recession of the “Cryptic Region” (Z. Li et al. 2024). The “Cryptic Region” (H. H. Kieffer et al. 1976) is characterized by dark, low-albedo areas distinct from Martian soil in the visible spectrum (Figure 4(a)). Sediments in this area may be conducive to CO2 condensation, but their albedo is significantly lower than that observed in typical CO2 frost zones (H. H. Kieffer et al. 2000). TES observations suggest the presence of relatively large CO2 ice plates (S. Piqueux et al. 2003; H. H. Kieffer & T. N. Titus 2001), while OMEGA observations indicate that dust contamination may contribute to the low albedo (Y. Langevin et al. 2006). Y. Langevin et al. (2006) detected substantial dust contamination in this region using data from the Mars Express OMEGA spectrometer. H. H. Kieffer et al. (2006) also identified “spider-like” dust patterns through high-resolution imaging. Both external dust activity and dust fountains formed by ice plate sublimation may have contributed to the contamination of this region during recession. This accumulation of dust results in a unique low albedo phenomenon, which influences the reflectance of frost deposits and subsequently affects the SPSC recession process (J. L. Benson & P. B. James 2005).
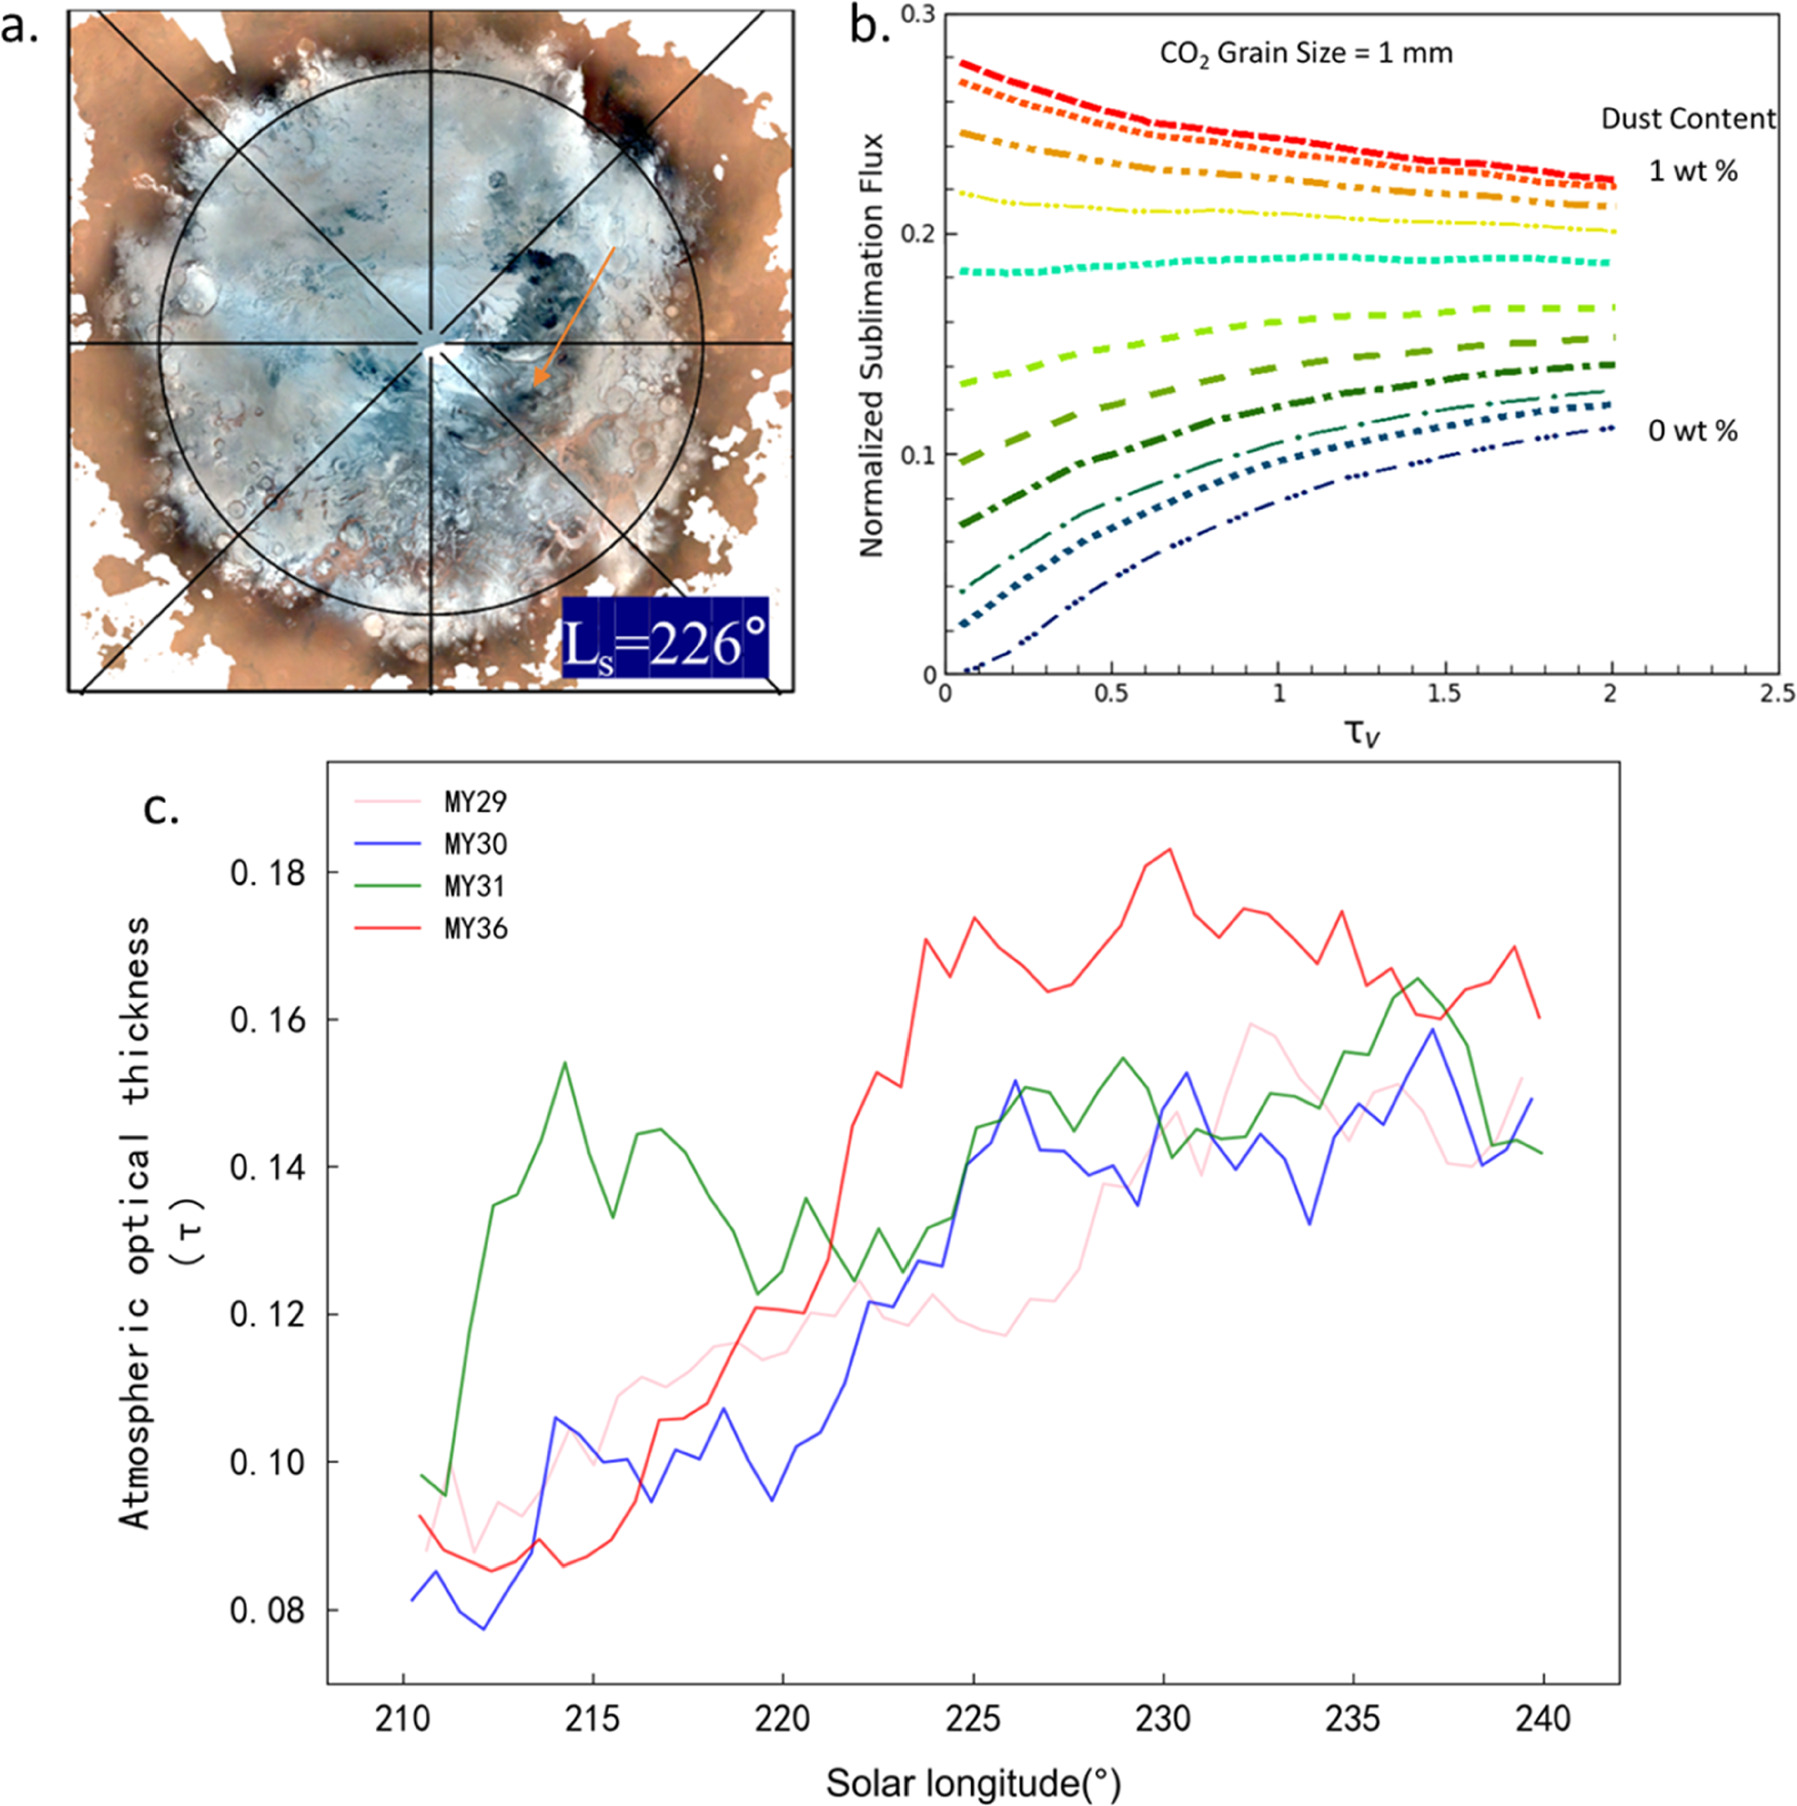
Figure 4. (a) Schematic diagram of the “cryptic region” (with orange arrows pointing to the area). (b) Sublimation flux of carbon dioxide ice with a grain size of 1 mm as a function of atmospheric optical thickness (adapted from P. B. Bonev et al. 2003). (c) Average atmospheric optical thickness of the “cryptic region” during the period Ls = 210°–240°.
Download figure:
Standard image High-resolution imageThe atmospheric optical thickness of the “cryptic region” is shown in Figure 4(c). After Ls ∼ 225°, the “cryptic region” enters a major recession phase, during which MY36 exhibits distinct regional dust activity compared to other non-global-dust years, characterized by elevated dust levels. P. B. Bonev et al. (2002) proposed that the sublimation flux of dust-contaminated CO2 ice (with 1% dust; G. B. Hansen 1997a,1997b, 1999), representing the “cryptic region,” decreases with increasing atmospheric optical thickness (Figure 4(b)). The increase in atmospheric dust hinders sublimation in low-albedo areas because suspended dust reduces visible light absorption by the ice cap beneath the dust layer, slowing sublimation in contaminated ice regions (P. B. Bonev et al. 2002). This leads to a delay of the RM point in MY36 compared to other non-global-dust years. Thus, we believe the enhanced dust activity observed in MY36 around Ls ∼ 225°–240° represents a specific dust event affecting the “cryptic region” and can be classified as spring dust activity that can delay SPSC recession.
4.1.2. Mountains of MS Point
The MS point represents the time step when the seasonal cap of the MM separates from the main cap (Z. Li et al. 2024). As noted in previous research (P. B. Bonev et al. 2002), elevated atmospheric optical thickness not only slows the sublimation of “dirty ice” (refers to a cap primarily composed of CO2 ice with dust contamination, similar to the “cryptic region” discussed in the previous section) but also contributes to the premature recession of high-reflectance areas like the MM, which are considered “clean ice” bodies. This effect occurs because the energy flux incident on the cap is transferred from the visible spectrum to the infrared spectrum (P. B. Bonev et al. 2002). Therefore, higher atmospheric optical thickness speeds up the recession of the MM. In this work, the MM exhibit delayed sublimation in MY36 for Martian years other than the global-dust-storm year (MY28). The average atmospheric optical thickness for this region between Ls = 240°–270° is calculated separately (for each Ls, we projected a map of atmospheric optical depth generated by MCD onto the Martian south polar region; then, we averaged the atmospheric optical depth values within the boundary of the MM region, thereby obtaining the mean atmospheric optical depth within the local area in quest) and shown in Figure 5(b). Figure 5(b) indicates that MY36 exhibits lower dust activity levels in the early stages of this phase compared to other nondust years, only showing increased dust activity after Ls ∼ 262°.
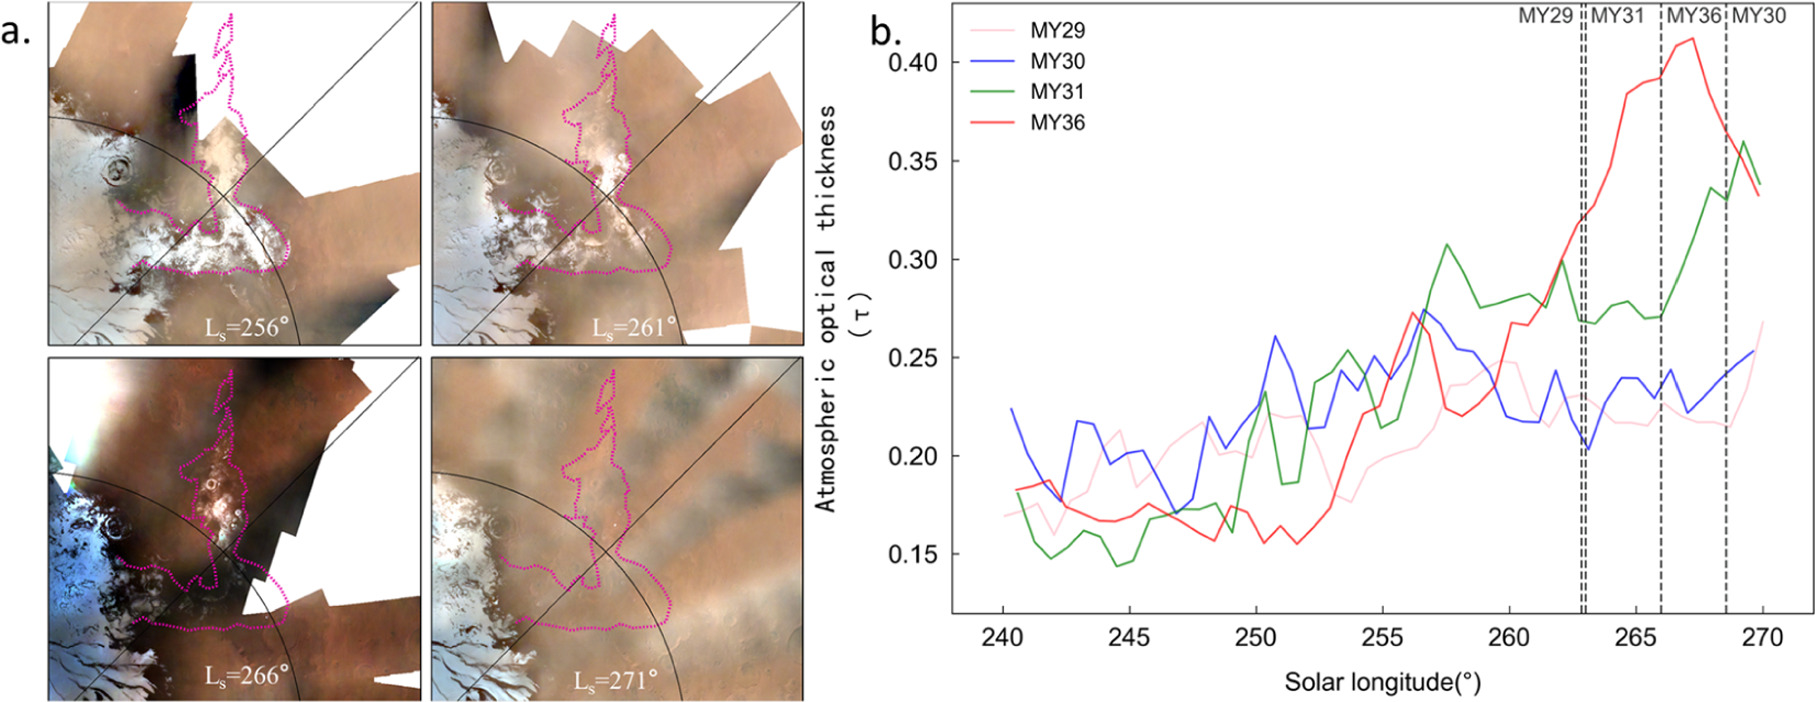
Figure 5. (a) The recession process of the MM seasonal cap during MY36. (b) Average atmospheric optical thickness of the MM during the period Ls = 240°–270°. The dashed line represents the occurrence times of the MS point in different Martian years.
Download figure:
Standard image High-resolution imageWe previously discussed how the SPSC recession in MY30 can serve as a “minimum baseline” (with MY30’s MS point occurring the latest). The delay of the MS point in MY36 compared to the other two non-global-dust years (MY29 and MY31) is influenced by the dust activity in the “Cryptic Region,” which delays the recession of the surface cap (the properties of the cap are altered due to dust contamination). In MY36, there is no rapid separation of the seasonal cap of the MM before Ls ∼ 262° (Figure 5(a)). As shown in Figure 5(a), at Ls = 261°, the cap in the MM begins to exhibit a “frosted” appearance, indicating that MY36, like other nondust years, is entering the separation phase from the main cap around this time step. However, unlike the others, the MM seasonal cap in MY36 fully separates from the main cap around Ls = 266°. Thus, the dust activity pattern in the MM (specifically, the timing of high-intensity dust events) impacts the SPSC recession, resulting in the postponement of the MS point in MY36.
At the beginning of Section 4.1, we discussed the relationship between the time steps of the SPSC recession and the peaks of dust activity. Our analysis in this section, combined with the previous one, confirms that this relationship is valid. Both MY36 and MY30 experience dust activity peaks around Ls ∼ 270°, with MY36 exhibiting a higher intensity of dust activity (which contributes to the acceleration of SPSC recession) than MY30. Consequently, the RM and MS points in MY36 are delayed compared to other nondust years but occur earlier than in MY30. However, the high dust activity observed in MY36 between Ls ∼ 225° and 240° does not accelerate the overall ice cap recession, which illustrates the limited but still delicate influence of the spring dust activity.
4.2. Dust Activity During Southern Hemisphere Summer
As summer begins, dust activity increases, and the warming effect of suspended dust, intensified by the higher solar incidence angle, significantly impacts the SPSC recession. In Section 4.1, we discussed how dust activity peaks influence temporarily the recession process, and this pattern continues to apply to summer dust activity. MY30 experiences the latest peak (around Ls ∼ 345°), while MY28 shows the earliest peak (around Ls ∼ 270°), with other years (MY29, MY31, and MY36) exhibiting similar peak timing (around Ls ∼ 320°) but varying intensities (Figure 3). The JM, SW, and RS points regularities (Figure 3(b)) indicate that earlier peak activity correspond to the earlier appearance of these time steps; if the peak activities are contemporary, then the greater the dust activity, the earlier the time steps.
The JM point occurs between Ls = 270° and 300°, with MY28 exhibiting the earliest and most intense level of dust activity, marking the onset of a global-dust storm. This results in the earliest appearance of the JM point in MY28, indicating a rapid increase in the intensity of SPSC recession (Z. Li et al. 2024). In contrast, other years show similar patterns of dust activity, consistent with JM point appearances among non-global-dust-storm years, except for MY30. The later occurrence of the JM point in MY30 may be attributed to the relatively weak dust activity in this year.
The SW and RS points represent the final stages of SPSC recession, where the SPSC has already recessed to the SPRC within which the further recession occurs (J. L. Benson & P. B. James 2005; Z. Li et al. 2024). These points are primarily influenced by overall dust activity and the intensity of large dust storms post-perihelion. Large perihelion dust events, which occur between perihelion and solstice during peak radiation intensity when most seasonal frost has sublimated, have a significant impact on both anomalous regions and the SPRC (B. P. Bonev et al. 2008; P. B. James et al. 2010). During Ls = 300°–325°, MY36 exhibited a notable increase in atmospheric optical thickness, reaching peak levels comparable to MY28’s global-dust storm. This resulted in a more pronounced recession of water-ice outliers in the southern mountains of MY36’s SPRC compared to other nondust years, with the minimum extent of the SPRC approaching that of MY28 (Z. Li et al. 2024).
5. Conclusion
We analyzed the time steps derived from the fifth-degree polynomial models of multiannual SPSC recessions, combined with corresponding dust activity data, to assess the impact of dust activities. Generally, the suspended dust accelerates SPSC recession, and the timing of the recession is affected by the peaks in the annual dust activity. However, some time steps in MY36 exhibit anomalies due to varying regional dust activity levels and the differing sensitivity of the SPSC to dust. The influence of dust activity on SPSC recession is as follows:
- (a).Spring and summer dust activities affect their respective SPSC recession processes. Spring dust activities pose mostly regional and temporal influences while the summer ones are characterized by their high-intensity and overall influences.
- (b).Time steps that occur in spring, the RM Point (Ls ∼ 225°–240°) and MS Point (Ls ∼ 265°), corresponding to the local recession and separation of the “cryptic region” and MM, respectively. The former holds a special mechanism wherein the cryptic region’s low albedo is more sensitive to visible light, which reduces visible light absorption and prolongs the recession process, leading to the delayed RM point in MY36 due to the strong dust activity around Ls ∼ 225°–240°. MS point is influenced by regional dust activity intensity. Observations show that the seasonal cap in this area consistently exhibits high reflectivity, correlating positively with sublimation flux and dust activity intensity (P. B. Bonev et al. 2002).
- (c).Time steps that occur in summer, the JM, SW, and RS points, are influenced by overall dust activity levels. The latter two are representative to the further recession of the remaining SPRC. Observations of water-ice outliers and the minimum extent of the SPRC allow for inferences about the year’s dust activity pattern and corroborate dust conditions around Ls ∼ 310°.
- (d).These time steps, except for the RM point, follow a general regularity: earlier peak activities correspond to earlier appearance of the time steps; if the peak activities are contemporaneous, then the greater the dust activity, the earlier the time steps. On the other hand, the RM point could be delayed by an intense dust event.
Our results provide a novel analysis of the patterns by which SPSC is influenced by dust activity at the Martian south pole. By segmenting both dust activity and SPSC recession, we offer a richer depiction of their relationship. We believe that ongoing missions like Tianwen-1, along with future probes (A. J. Brown et al. 2015), will continue to provide new data on SPSC and dust activity. Long-term observations will further facilitate the establishment of quantitative models for the SPSC-dust relationship, enhancing our understanding of contemporary Martian climate.
Acknowledgments
The authors thank the Tianwen-1 payload team for mission operations and China National Space Administration for providing the Tianwen-1 data that made this study possible. The MoRIC data used in this work are processed and produced by Ground Research and Application System (GRAS) of China’s Lunar and Planetary Exploration Program. This study is funded by the National Key R&D Program of China (grant No. 2022YFF0503204) and the Key Research Program of the Chinese Academy of Sciences (grant No. ZDBS-SSW-TLC00102). Thank Acharya Pruthviraj for providing the recession data of the South Polar Seasonal Cap (SPSC) for Martian Years 28–31. Furthermore, sincere thanks are extended to Adrian Brown for the invaluable suggestions to enhance the quality of this manuscript.
Data Availability Statement
Data will be made available on request.