Abstract
V473 Lyr is a classical Cepheid that is unique in having substantial amplitude variations with a period of approximately 3.3 yr, thought to be similar to the Blazhko variations in RR Lyrae stars. We obtained an XMM-Newton observation of this star to follow up a previous detection in X-rays. Rather than the X-ray burst and rapid decline near maximum radius seen in δ Cephei itself, the X-ray flux in V473 Lyr remained constant for a third of the pulsation cycle covered by the observation. Thus the X-rays are probably not produced by the changes around the pulsation cycle. The X-ray spectrum is soft (kT = 0.6 keV), with X-ray properties consistent with a young low-mass companion. Previously there was no evidence of a companion in radial velocities or in Gaia and Hipparcos proper motions. While this rules out companions that are very close or very distant, a binary companion at a separation between 30 and 300 au is possible. This is an example of an X-ray observation revealing evidence of a low-mass companion, which is important in completing the mass ratio statistics of binary Cepheids. Furthermore, the detection of a young X-ray bright companion is a further indication that the Cepheid (primary) is a Population I star, even though its pulsation behavior differs from other classical Cepheids.
1. Introduction
Population I classical Cepheids are radial pulsators that have very regular pulsation cycles. Complicated photometric variations, however, are found in a small group that are excited in two modes. Long series of precise photometry from satellites such as Kepler, Microvariability and Oscillations of Stars (MOST), and CoRoT have begun to alert us to additional excited frequencies, particularly in overtone pulsators. The notable exception to the regular pulsation is V473 Lyr, which has a variable amplitude of pulsation. The main pulsation period is 1.49d, with a period of amplitude variation of 1205d. Existing data are discussed by Molnar & Szabados (2014; hereafter MS14). This amplitude variation appears to be similar to the Blazhko effect seen in many RR Lyr stars. As discussed there, V473 Lyr is thought to be pulsating in the second overtone. A number of explanations have been put forward for the amplitude variation, but the most likely is the resonance between two pulsation modes, which is discussed by MS14. They identified an additional modulation cycle of 5300d. A sequence of 27 days of observations with the MOST satellite (Molnar et al. 2017) shows period doubling (the alternation of the amplitudes of successive cycles). This is seen in RV Tau and RR Lyr Population II pulsators, but this is the first case in a Population I classical Cepheid.
X-ray observations of classical Cepheids have a peculiar pattern (Engle et al. 2017). The pulsation cycle results in disturbances in the photosphere and chromosphere following minimum radius as the pulsation wave passes through. X-ray flux of δ Cep is relatively modest and constant at this phase. Just after maximum radius, however, the X-ray flux increases sharply by a factor of approximately four. At this phase, photospheric and chromospheric spectra are quiescent, indistinguishable from those of nonvariable supergiants. This pattern is seen in two cycles of δ Cep and in β Dor.
V473 Lyr was observed by the XMM satellite in a program to observe 14 Cepheids (Evans et al. 2016b), which was developed from observations using the Hubble Space Telescope (HST) Wide-field Camera 3 (WFC3) to identify possible resolved companions (Evans et al. 2016a). The XMM observations were used to distinguish X-ray active low-mass stars young enough to be Cepheid companions from old field stars that are much less active. V473 Lyr was found to have an X-ray source at the position of the Cepheid. Table 1 lists the phase of the observation based on complex pulsation behavior discussed in MS14. The phase of the X-ray observation was found to be the same as the phase at which δ Cep has a burst of X-rays, namely just after maximum radius (Evans et al. 2018). This suggests the possibility that the X-ray flux was produced in the same way as for δ Cep. For this reason an additional XMM observation was applied for, partly to use the variation in pulsation amplitude as a diagnostic of the effect.
Table 1. XMM Observations of V473 Lyr
| Year | JD | Exp | Phase | |
|---|---|---|---|---|
| −2400,000 | (ksec) | |||
| 2019 | Start | 58,559.762 | 40.3 | 0.42 |
| End | 58,560.228 | 0.73 | ||
| 2013 | Start | 56,557.909 | 6.6 | 0.47 |
| End | 56,558.002 | 0.53 |
Download table as: ASCIITypeset image
2. Observation and Data Analysis
2.1. XMM Observation
A new observation of V473 Lyr with XMM was obtained in 2019 (Table 1). Data analysis was carried out using standard data reduction tasks in scientific analysis subsystem (SAS) software version 17.0 as in Pillitteri et al. (2013). This involved a reduction starting from the opacity distribution functions of the observation, filtering the events according to their grades and screening out bad pixels. Only events between 0.3 and 8.0 keV were used, and the reduction was restricted to good time intervals and low background periods. These were evaluated using the recipe given in the SAS guidelines and based on the light curve of the events above 10 keV.
Again there was a source at the position of the Cepheid. The light variation (PN chip array) and the spectrum are shown in Figures 1 and 2. Figure 1 shows that the flux is essentially constant during the exposure. Figure 2 shows the spectrum fit given for a temperature of kT = 0.6 keV (using a H column density of 3 × 1021 cm−2 [appropriate for a low E(B−V) = 0.03 mag] and an abundance of  ). The unabsorbed flux is 3.2 × 10⁻¹⁴ erg cm−2 s−1 in the 0.3–8.0 keV band. Using a distance of 553 pc (Evans et al. 2016a), this is log Lx = 30.07 erg s−1. This distance is based on the Benedict et al. (2007) Leavitt Law. This is larger than the distance calculated from the data in the Gaia DR2 catalog (Gaia Collaboration et al. 2018).
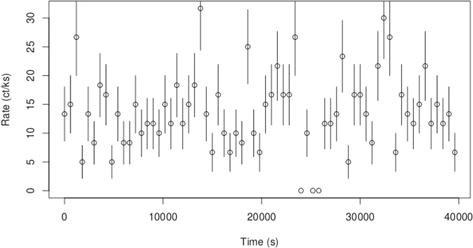
Figure 1. Count rate during the XMM exposure.
Download figure:
Standard image High-resolution image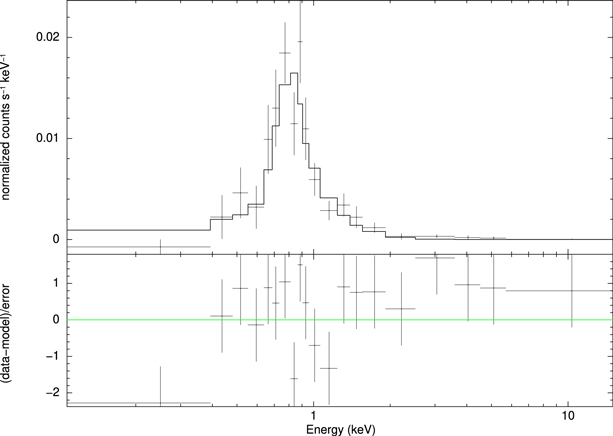
Figure 2. Extracted spectrum of V473 Lyr. Top: +'s: data; histogram: data fit. Bottom: residuals.
Download figure:
Standard image High-resolution imageWe have tested whether variability is detectable in the light curve (Figure 1) using the observed fluctuations in the counts against a constant count rate model. We account for the presence of a constant background rate, and exclude times when the PN background flares. We compute a cstat value (Cash statistic; Cash 1979) and a corresponding approximate goodness-of-fit measure (Kaastra 2017) for the data compared with the averaged counts in light curves binned from 100 to 1000 s. We have also compared the histogram of counts from a binned counts light curve against the predicted Poisson frequency. The PN data have the most counts, but we have also examined MOS1 and MOS2 both separately and together. The results varied depending on the detector and time bin, but we find marginal evidence for variability at the largest binning at the 10% level.
2.2. Photometry
Since the pulsation amplitude of V473 Lyr is variable, photometry was obtained near the time of the XMM observation to confirm the phases. Observations were made near Budapest, Hungary, with a 15 cm telescope, and an Orion StarShoot G3 CCD camera, in the V band. During the first night, defocused images were taken with 5 s integrations to avoid saturation. For the second night the telescope was used with an aperture opening reduced to 4 cm diameter, with 30 s integration times. HD 180316 (V = 6.891 mag) and HD 337922 (V = 9.171 mag) were used as comparison and check stars. Differential magnitudes were shifted to the average brightness of the star (V = 6.153 mag), and times were converted to HJD. Data are listed in Appendix A (full table in the electronic version). The data were binned (20 points) to decrease the scatter. Since the pulsation at this time is at a low-amplitude phase and the light curve is nearly sinusoidal, we fitted the observations with a simple sine, with the frequency fixed to the average pulsation frequency value (0.67079 day−1). This way we were able to confirm the pulsation phase during the observing window for XMM-Newton. As Figure 3 shows, data collection started slightly before minimum light, and ended about halfway up the ascending branch.
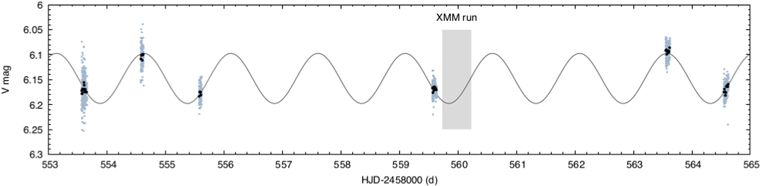
Figure 3. New photometric data and the phases of the XMM observation. Blue dots: V magnitude data; black dots: 20 point binned data; solid line: pulsation curve computed from the ephemeris; shaded region: the time XMM of the observation.
Download figure:
Standard image High-resolution imageFigure 4 shows the updated phase variation of V473 Lyr, with the photometry from Figure 3 included.
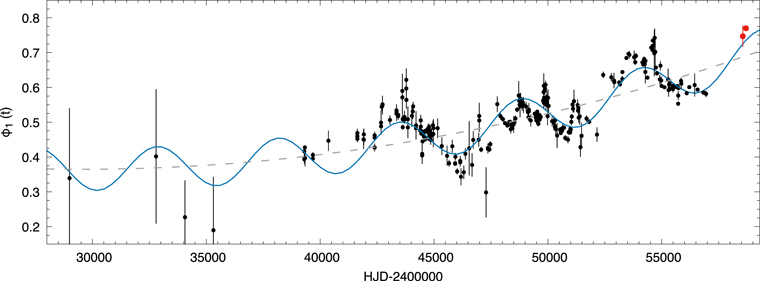
Figure 4. Long-term phase variation V473 Lyrae, based on the  Fourier term. The dashed line is a quadratic term describing a continuous decrease in period. The blue line shows the longer modulation cycle superimposed. This plot is an updated version of Figure 9 by Molnar & Szabados (2014), and includes photometric data from Molnar et al. (2017) and Appendix A. The red dots on the far right are from Appendix A and the TESS data.
Download figure:
Standard image High-resolution image2.3. Velocities: 2019
Radial velocity data were collected on two nights from Hungary with a 30 cm Newton telescope, and a Shelyak LHires III spectrograph, at R 13,000 resolution, on 2019 March 17, right before the XMM run started, and again on March 24, for 2.3 and 2.7 hr, respectively. An Ar/Ne calibration lamp and the radial velocity standard star 45 Dra were used for wavelength calibration. Images were processed with Integrated Spectrographic Innovative Software (ISIS),13 then the spectra were rectified with IRAF (Tody 1986). Lines between 6103 and 6223 Å were used to determine the radial velocities with the IRAF cross-correlation task fxcor. Uncertainties for the target and standard star measurements were both estimated to be 0.5 km s−1. Velocities are listed in Appendix B (full table in the electronic version).
2.4. TESS Observations
V473 Lyr was observed by the Transiting Exoplanet Survey Satellite (TESS) space telescope in Sector 14, a few months after the XMM run, from 2019 July 18 to August 14 (Ricker et al. 2014). Observations were made in short cadence mode, with 2 minute sampling. We analyzed the light curve released by the Spacecraft Operations Center and created custom-aperture photometry with our lightkurve package (Lightkurve Collaboration 2018), which is shown in Figure 5. Since the star is in a low-amplitude phase and TESS observes in a broad red bandpass (between 600 and 1000 nm), the peak-to-peak pulsation amplitude was very small, only 41 mmag. We detected the main pulsation peak (f), its first harmonic, and one side peak that is connected with the modulation, along with some low-frequency components that are likely caused by blending with nearby stars and other noise sources. We looked for signs of period doubling, and we found a low-amplitude frequency component at 1.5 f, but given the presence of low-frequency noise in the frequency spectrum nearby, we cannot claim unambiguous detection. However, this is not necessarily at odds with the earlier results, for two reasons. First, MOST observed the star in shorter wavelengths where Cepheid pulsation amplitudes are higher, making detection easier. Second, the amplitude of period doubling was found to fluctuate rather erratically in RR Lyrae stars: if V473 Lyr behaves similarly, nondetection from a short data set can be expected (Szabo et al. 2010). We also looked for any signs of flaring activity in the residual light curve, but found none with an upper limit of 1 mmag.
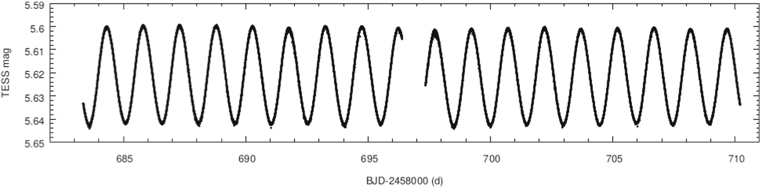
Figure 5. TESS observations of V473 Lyr.
Download figure:
Standard image High-resolution image3. Results
The new observation of V473 Lyr is shown in Figure 6 in the context of other Cepheid X-ray observations. δ Cep observations from Engle et al. (2017) are for both quiescent and burst states. β Dor observations include those from Engle (2015) supplemented by additional observations. For β Dor, the earlier phase (phase 0.25 on the left in Figure 6) is computed from the ephemeris using light maximum. However, β Dor is in the period range near 10 days (P = 9.84d) where a resonance decreases the pulsation amplitude and causes a distortion at maximum light. Since there are HST Cosmic Origins Spectrograph spectra (Engle 2015) the phase of minimum radius is well defined by ultraviolet emission lines caused by the passage of the pulsation wave through the photosphere and chromosphere. We can use this as the pulsation fiducial for the relation of minimum radius to the X-ray increase. Using this fiducial, the phase of the X-ray increase for β Dor is shifted to the right-hand x symbol in Figure 6. Upper limits for random phase Cepheid observations are from Evans et al. (2016b). Figure 6 shows that the X-ray observations for two cycles of δ Cep and also β Dor in the phase range of 0.4–0.5 near maximum radius are well above the quiescent range for other phases of δ Cep. Both observations of V473 Lyr are well above even this bright X-ray luminosity. Furthermore they cover the phase range, which extends over a third of the pulsation cycle, in contrast to the restricted phase range of δ Cep and β Dor. Although the cause of the X-ray bursts in δ Cep and β Dor is not yet understood, the X-ray luminosity of V473 Lyr does not appear to share the same characteristics of a much lower quiescent flux for most phases, but a short X-ray burst at the phase of maximum radius.
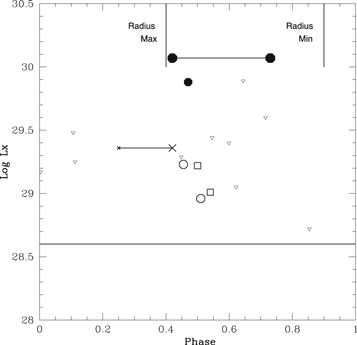
Figure 6. Cepheid X-ray observations as a function of pulsation phase. Filled circles: observations of V473 Lyr, with the phase range of the recent observation indicated by the joined circles; open circles and squares: δ Cep, with different symbols indicating different cycles; x’s: β Dor: the phase on the right is adjusted to the phase based on photospheric emission lines (see the text); open triangles: upper limits for other Cepheids; solid line at log LX = 28.6: δ Cep in quiescent phases. The two vertical lines at the top indicate the maximum and minimum radius of δ Cep. Luminosity is in erg s−1.
Download figure:
Standard image High-resolution image4. Discussion
The X-ray source detected for V473 Lyr is relatively constant with phase, unlike those seen for δ Cep and β Dor, making it much more likely that the X-rays are produced by a young low-mass companion than pulsation. The source is soft (kT = 0.6 keV), which would be consistent with a G or K main-sequence companion at the age of the Cepheid (younger than the Pleiades; Preibisch & Feigelson 2005). A cool companion is consistent with the upper limit to a companion spectral type of A6 from an International Ultraviolet Explorer spectrum (Evans 1992). We note that while G or K stars are common in the field population, young G and K stars are very rare, except in places such as open clusters.
A companion is surprising as there was no previous evidence that the Cepheid is a member of a spectroscopic binary. Identifying binary properties in a V473 Lyr system is, of course, complicated by variations due to pulsation, including the variable amplitude. MS14 discuss possible orbital velocity variation based on the velocities of Burki (2006) in connection with a third (5290d) modulation in V473 Lyr. Figure 7 shows the radial velocities over nearly 40 yr. Velocities before JD 2452,000 are CORrelation RADial VELocities (CORAVEL) as discussed by Burki (2006), kindly made available by the Geneva Observatory, listed in Appendix C. More recent velocities are from Molnar et al. (2017) and Appendix B. The bottom panel in Figure 7 shows the residuals after correction for pulsation including modulation, based on the analysis of MS14.
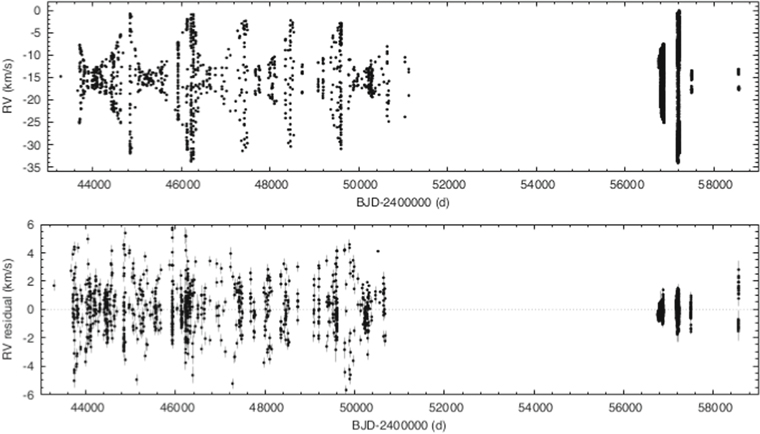
Figure 7. Radial velocities of V473 Lyr. Top: radial velocities; bottom: radial velocities corrected for pulsation including modulation (see the text).
Download figure:
Standard image High-resolution imageResiduals in the lower panel of Figure 7 sometimes exceed the typical CORAVEL error of 1 km s−1 (e.g., Evans et al. 2015), although the scatter in measures obtained on the same night (Appendix C) suggest that 1 km s−1 is a reasonable estimate. In order to look for multi-year velocity variations that might come from orbital motion, we have explored the data in two ways. First, we have binned data into one year segments to look at the mean and standard deviation. (Since the velocity uncertainties in the Appendix are all very similar, we have used no weighting.) Figure 8 shows the mean and standard deviation in these bins. The means are typically within ±0.2 km s−1, which is consistent with the standard deviations within each bin.
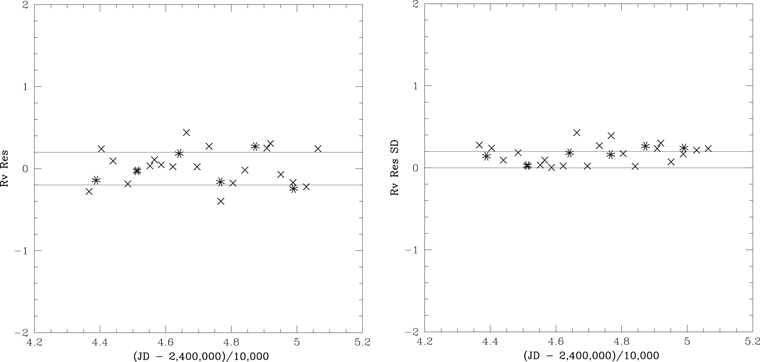
Figure 8. Left: radial velocities binned into a year (x) and in periods of low amplitude (*). Each bin is plotted using the first JD of the bin. Lines indicate ±0.2 km s−1. Right: standard deviation of each bin. The symbols are the same as the left plot.
Download figure:
Standard image High-resolution imageThe second approach is as follows. Since the amplitude of the pulsation is very small for some periods, corrections for pulsation should also be very small. We have identified periods of low amplitude and created the means and standard deviations in those bins. As shown in Figure 8 by asterisks, the means and standard deviation at these modulation phases are very similar to the results for the annual means. This demonstrates that the corrections for pulsation are accurate (for both high and low-amplitude phases) and confirms the values for the annual means. In summary Figure 8 provides an estimate of velocity variations of 0.2 km s−1 due to orbital motion over the 17 yr coverage.
Comparison of proper motions from Hipparcos and Gaia (DR2) can reveal orbital motion (proper motion anomalies or PMa), as fully discussed by Kervella et al. (2019). Figure 9 shows the constraints on the combination of companion mass M2 and radius (using a circular orbit) found from the lack of a significant PMa. The figure shows that an orbit of 3 au or one of more than 30 au would be compatible with a companion mass of at least a several tenths of a solar mass, but between them a stellar mass companion is unlikely. Furthermore, below 3 au there are only the very restricted peaks related to aliases of the time window of the Gaia DR2 data. It is unlikely that an orbital period would happen to fall in these limited regions.
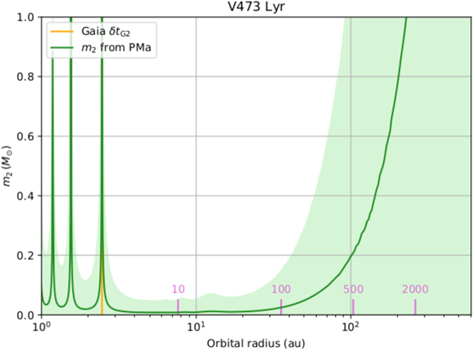
Figure 9. Constraints on the orbit from Gaia proper motions. X-axis: orbital radius in astronomical units and orbital periods (pink) in years; Y-axis: companion mass in  the green curve is the relation from the PMa, with the light green shading indicating a one σ uncertainty; the yellow line is the orbital radius corresponding to a Gaia DR2 time window of 688d. (Plot created using the techniques described in Kervella et al. 2019.)
Download figure:
Standard image High-resolution imageBased on the proper motion constraint on orbits, we can estimate possible orbital velocities for the V473 Lyr system. For the Cepheid we use a mass of 4  , based on the mass of V1334 Cyg (Gallenne et al. 2018). The X-ray luminosity of the companion is consistent with a G star at the age of the Cepheid (Preibisch & Feigelson 2005). There is some scatter in the age–spectral type–luminosity relations, but 1
  is a reasonable estimate for the companion. A semimajor axis of 3 au corresponds to an orbital period of 2.3 yr with these values. Note that orbits with Cepheid primaries all have periods of a year or more (Evans et al. 2015) since shorter period systems would have undergone Roche-lobe overflow when the primary became a red giant. For Cepheid masses, an orbit with a period of a year corresponds to an orbital radius of 1.7 au. A simple circular orbit with a period of 2.3 yr would have a Cepheid velocity of 10 km s−1 and companion velocity of 39 km s−1. These numbers will be reduced, of course, if the orbit is inclined or eccentric. Comparable velocities for a 30 au orbit (0
05) with a 73 yr period become 2.7 km s−1 for the Cepheid and 11 km s−1 for the companion. The velocity data (Figures 7 and 8) make the short-period orbit very unlikely, requiring a very small inclination. This is particularly true since a period of nearly 20 yr is covered well by the Burki data. An orbit of 30 yr or longer remains possible.
There is also a constraint on the outer size of the orbit. Seventy Cepheids have been surveyed with the HST WFC3 to detect resolved companions (Evans et al. 2016a). The final analysis uses point-spread corrected images as described in N.R. Evans et al. (2020, in preparation). On the corrected images, companions as close as 05 can be identified (Figure 10). No such companions are detected to this limit for V473 Lyr. Using the distance 553 pc (Evans et al. 2016a, based on the Benedict et al. 2007 Leavitt law calibration), this limits the companion to within 280 au. The parallax from Gaia provides a closer distance of 453 pc (hence a tighter limit). Furthermore, the Gaia data identified no wide common proper motion companions.
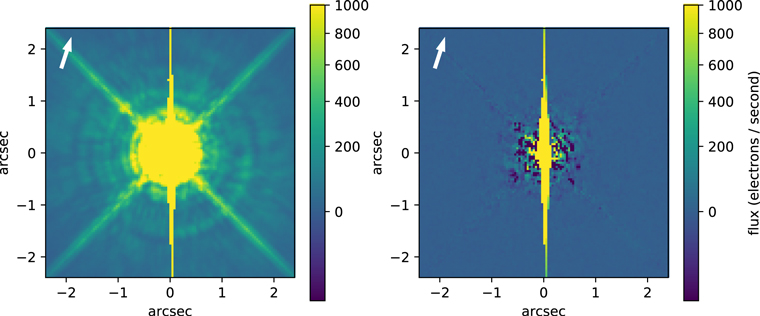
Figure 10. HST WFC3 image of V473 Lyr. Left: original image. Right: point-spread corrected image. The arrow points north.
Download figure:
Standard image High-resolution imageThis identification of a low-mass companion has two implications. First, low-mass companions of Cepheids are difficult to identify, since the spectral energy distribution is similar to that of the Cepheid, and the companion is much fainter than the Cepheid. Thus the X-ray identification of such a companion is important in determining the distribution of mass ratios down to small values. Second, as discussed above, we have usually used X-ray observations to confirm that a resolved companion is young enough to be a Cepheid companion. In this case, the argument is reversed. The X-ray active companion is another confirmation that V473 Lyr is a young Population I star itself, despite its unusual pulsation characteristics.
5. Summary
We have observed V473 Lyr twice with XMM with the following results.
- 1.The X-ray flux is reasonably constant through a large part of the pulsation cycle, implying that a low-mass companion is the likely source.
- 2.Limits on the orbit of the companion from HST images, Gaia proper motions, and radial velocities are consistent with a separation between 30 and 300 au.
- 3.This is important both because such a companion is otherwise difficult to detect.
- 4.Furthermore, it confirms that V473 Lyr is a Population I Cepheid, though an unusual one.
- 5.The X-ray upper limits in Figure 6 indicate nine other Cepheids where a companion as bright as that for V473 Lyr would have been detected.
Radial velocities from the Geneva observatory were provided by Stephane Udry and Maxime Marmier. Support for this work was provided by HST grant GO-12215.01-A and from the Chandra X-ray Center NASA Contract NAS8-03060. Support was also provided by the Lendület Program of the Hungarian Academy of Sciences, project No. 2018-7/2019. L.M. was supported by the Premium Postdoctoral Research Program of the Hungarian Academy of Sciences. E.P. was supported by the János Bolyai Research Scholarship of the Hungarian Academy of Sciences and by the Hungarian National Research, Development and Innovation Office (NKFIH) grant PD-121203. Support for H.M.G. was provided by the National Aeronautics and Space Administration through the Smithsonian Astrophysical Observatory contract SV3-73016 to MIT for Support of the Chandra X-Ray Center, which is operated by the Smithsonian Astrophysical Observatory for and on behalf of the National Aeronautics Space Administration under contract NAS8-03060. P.K. acknowledges the support of the French Agence Nationale de la Recherche (ANR), under grant ANR-15-CE31-0012-01 (project UnlockCepheids). The research leading to these results has received funding from the European Horizon 2020 research and innovation program (grant agreement No. 695099). This discussion is based on observations obtained with XMM-Newton, an ESA science mission with instruments and contributions directly funded by ESA member states and NASA. It is based in part in observations made with the NASA/ESA Hubble Space Telescope obtained by the Space Telescope Science Institute. STScI is operated by the Association of Universities for Research in Astronomy Inc., under NASA contract NAS5-26555. This work has made use of data from the European Space Agency (ESA) mission Gaia (http://www.cosmos.esa.int/gaia), processed by the Gaia Data Processing and Analysis Consortium (DPAC, http://www.cosmos.esa.int/web/gaia/dpac/consortium). Funding for the DPAC has been provided by national institutions, in particular the institutions participating in the Gaia Multilateral Agreement. SIMBAD was used in the preparation of this paper.
Software: SAS (v17.0; Gabriel et al. 2004), lightkurve (Lightkurve Collaboration 2018), ISIS (http://www.astrosurf.com/buil/isis-software.html), IRAF (Tody 1986, Tody 1993).
Appendix A: Photometry
Table 2 lists the photometry from 2019. Only the first few lines are provided here to show the scope of the data; the full data set is included in the electronic version. The columns list JD, radial velocity, and standard deviation.
Table 2. Photometry of V473 Lyr
| JD | V | sd |
|---|---|---|
| (−2400,000) | (mag) | (mag) |
| 58,553.5642 | 6.209 | 0.001 |
| 58,553.5644 | 6.211 | 0.001 |
| 58,553.5646 | 6.166 | 0.001 |
| 58,553.5647 | 6.208 | 0.001 |
| 58,553.5649 | 6.192 | 0.001 |
| 58,553.5651 | 6.159 | 0.001 |
| 58,553.5652 | 6.192 | 0.001 |
| 58,553.5654 | 6.170 | 0.001 |
| 58,553.5656 | 6.172 | 0.001 |
Only a portion of this table is shown here to demonstrate its form and content. A machine-readable version of the full table is available.
Download table as: DataTypeset image
Appendix B: Velocities (2019)
Table 3 lists the radial velocities from 2019. Only the first few lines are provided here to show the scope of the data; the full data set is included in the electronic version. The columns list JD, radial velocity, and standard deviation.
Table 3. Radial Velocities of V473 Lyr in 2019
| JD | VR | sd |
|---|---|---|
| (−2400,000) | (km s−1) | (km s−1) |
| 58,559.580 | −14.386 | 0.605 |
| 58,559.587 | −14.157 | 0.846 |
| 58,559.595 | −13.974 | 0.553 |
| 58,559.602 | −14.046 | 0.553 |
| 58,559.610 | −13.850 | 0.641 |
| 58,559.617 | −13.939 | 0.562 |
Only a portion of this table is shown here to demonstrate its form and content. A machine-readable version of the full table is available.
Download table as: DataTypeset image
Appendix C: CORAVEL Velocities
Table 4 lists the CORAVEL velocities discussed by Burki (2006). Only the first few lines are provided here to show the scope of the data; the full data set is included in the electronic version. The columns list JD, radial velocity, and standard deviation.
Table 4. CORAVEL Velocities of V473 Lyr
| JD | VR | sd |
|---|---|---|
| (−2400,000) | (km s−1) | (km s−1) |
| 43,286.527 | −14.81 | 0.39 |
| 43,666.609 | −17.99 | 0.49 |
| 43,706.471 | −25.24 | 0.37 |
| 43,708.471 | −13.04 | 0.38 |
| 43,709.449 | −25.05 | 0.39 |
| 43,709.522 | −24.93 | 0.44 |
| 43,710.472 | −7.89 | 0.38 |
| 43,711.474 | −12.56 | 0.37 |
| 43,712.452 | −24.87 | 0.38 |
Only a portion of this table is shown here to demonstrate its form and content. A machine-readable version of the full table is available.
Download table as: DataTypeset image
Footnotes
- *
Based on observations obtained with XMM-Newton, an ESA science mission with instruments and contributions directly funded by ESA Member States and the USA (NASA).
- 13