Abstract
The composition inside a comet nuclear can be detected through the molecular rotational emission lines at millimeter or submillimeter wavelengths. We observed a long-period comet C/2022 E3 (ZTF) using the Purple Mountain Observatory 13.7 m radio telescope at 3.4 mm during mid January and early February in 2023. From the observed spectra, the hydrogen cyanide (HCN)(J = 1–0) spectra lines was detected. The mean production rate of HCN is (8.30 ± 1.14) × 1025 molec. s−1 in mid January and (3.91 ± 0.84) × 1025 molec. s−1 in early February. we also estimated the upper limit of the production rate of HCO+. We obtained the abundance of HCN relative to water, (0.13 ± 0.02)% in mid January when C/2022 E3 (ZTF) got close to the Sun at 1.11 au, and (0.13 ± 0.03)% in early February at 1.16 au. Our conclusion leans toward E3 being similar to most comets, with the abundance of HCN remaining stable during our two observation periods.
Original content from this work may be used under the terms of the Creative Commons Attribution 4.0 licence. Any further distribution of this work must maintain attribution to the author(s) and the title of the work, journal citation and DOI.
This article was updated on April 7, 2025 to correct a production error which led to incorrect text citations for some references.
1. Introduction
Comets are among the most primitive bodies in the solar system and may have formed during the early stages of its formation (W. F. Huebner 2009). They originate from the Kuiper Belt, a disk-shaped region beyond Neptune's orbit, or Oort Cloud, a hypothetical spherical cloud of comets located beyond the outer edges of the solar system (M. J. Duncan & H. F. Levison 1997; J. A. Fernández 2008; N. Thomas 2020). Before comets were significantly perturbed by the gravitational influence of the outer planets, sending them into the inner solar system (M. Duncan et al. 2004; M. J. Duncan 2008), their composition have remained nearly unchanged since their formation and provide valuable insights into the conditions present during the formation of the solar system. Comets also play a role in the evolution of the solar system by transporting material from the outer regions to the inner regions.
Known as iceballs or snowballs, comets are composed primarily of dust and frozen gases, including water ice, carbon dioxide, methane, and ammonia (F. L. Whipple 1950; D. Bockelée-Morvan & N. Biver 2017). As comets approach the Sun, the frozen gases sublimate and form a coma around the nucleus, and dust particles are released into space, forming coma and tail. The coma and tail are rich in molecules that emit spectral lines when excited by sunlight or other radiation sources (D. Bodewits et al. 2022). Observations of gas molecules in comets provide valuable information on the chemical composition, temperature, density, origin, and evolution of these celestial bodies (D. Bockelée-Morvan et al. 2004; D. Bockelée-Morvan & N. Biver 2017).
Comet C/2022 E3 (ZTF) (hereafter E3) is a long-period comet that was discovered by the Palomar Observatory 48 inch telescope's Zwicky Transient Facility (ZTF) camera on 2022 March 2 (B. T. Bolin et al. 2022). E3 came to its perihelion on 2023 January 12 at 1.11 au, and reached about 4th magnitude at its brightest at the last week of January. The best time to observe this comet was from January to February in 2023 in the Northern Hemisphere, as the geocentric distance was as low as 0.5 au during this period. A great quantity of astrometric and photometric data are available in online databases5 ,6 and the orbital elements of this comet were obtained (Table 1). This comet showed a strong emission of CN in visible spectroscopy at around 380 nm (N. James 2023). The production rate of radicals including CN was also reported by E. Jehin et al. (2022a, 2022b, 2022c, 2023) based on observations using cometary HB narrowband filters of TRAPPIST robotic telescopes (T. L. Farnham et al. 2000; E. Jehin et al. 2011). The fact that hydrogen cyanide (HCN) is the main parent molecule of CN radical with the highest abundance of CN in Jupiter-family comets and long-period comets (N. Biver et al. 2022); however, observations of multiple comets have demonstrated that it is not the only source in the coma (D. Bockelee-Morvan & J. Crovisier 1985; N. Dello Russo et al. 2009, 2016).
Table 1. The Orbital Elements of C/2022 E3 (ZTF)
| Parameters | Value |
|---|---|
| Perihelion distance q | 1.112299 au |
| Eccentricity e | 1.000168 |
| Argument of perihelion ω | 145 8123 8123 |
| Longitude of ascending node Ω | 302 5545 5545 |
| Inclination i | 109 1683 1683 |
| Time of perihelion passage T | 2023 January 12th UT |
Download table as: ASCIITypeset image
We focused on the observation opportunity of E3 passing by Earth at a close distance, and used the Purple Mountain Observatory (PMO) 13.7 m millimeter-wave telescope at 3.4 mm (transition of HCN (J = 1–0) radio emission mainly) to observe and study its coma. In this paper, we reported the result of our observations in several days, and discussed the variation of activity and the difference from other comets. The paper is divided as follows: Section 2 outlines the observational equipment and method. Section 3 presents the data analysis and results. Section 4 follows with a discussion, leading to a conclusion in Section 5.
2. Observations and Data Reduction
Observations at 3.4 mm in E3 were carried out for approximately 4–5 hr on some days from 2023 January to February by using the 13.7 m millimeter-wave telescope of PMO in Delingha, China. The observation time can be divided into two periods, period 1 includes 2023 January 14–18, and period 2 includes 2023 January 31 to February 3. The total effective integration time was 7.5 hr and 5.9 hr in January period and February period, respectively. Observational parameters of E3 during these periods are listed in Table 2, which were obtained using Horizons System of Jet Propulsion Laboratory (JPL)7 and the Minor Planet Ephemeris Service.8
Table 2. Observational Parameters of C/2022 E3 (ZTF)
| UT Date (2023) | 〈rh〉a | 〈Δ〉b | 〈α〉c | 〈vr〉d | Integ.e | Line |
|---|---|---|---|---|---|---|
| (mm/dd.dd–(mm/)dd.dd) | (au) | (au) | (deg) | (km s−1) | (minutes) | |
| 01/14.87–15.00 | 1.113 | 0.646 | 61.4 | −49.135 | 71 | HCN(1–0)/HCO+(1–0) |
| 01/15.85–16.01 | 1.113 | 0.617 | 61.6 | −48.827 | 100 | HCN(1–0)/HCO+(1–0) |
| 01/16.85–17.01 | 1.114 | 0.590 | 61.8 | −48.416 | 97 | HCN(1–0)/HCO+(1–0) |
| 01/17.86–18.01 | 1.116 | 0.562 | 61.8 | −47.885 | 88 | HCN(1–0)/HCO+(1–0) |
| 01/18.85–19.00 | 1.117 | 0.534 | 61.8 | −47.212 | 93 | HCN(1–0)/HCO+(1–0) |
| 01/31.81–31.97 | 1.155 | 0.286 | 47.6 | −5.609 | 100 | HCN(1–0)/HCO+(1–0) |
| 02/01.82–01.97 | 1.160 | 0.284 | 46.5 | +1.104 | 91 | HCN(1–0)/HCO+(1–0) |
| 02/02.81–02.96 | 1.164 | 0.287 | 45.8 | +7.788 | 92 | HCN(1–0)/HCO+(1–0) |
| 02/03.82–03.93 | 1.169 | 0.293 | 45.4 | +14.180 | 68 | HCN(1–0)/HCO+(1–0) |
Notes. aMean heliocentric distance during observation time. bMean geocentric distance. cMean solar phase angle (Sun–object–Earth). dMean radial velocity. eOn source integration time.
Download table as: ASCIITypeset image
A 3 × 3 multibeam sideband separation superconducting receiver—a Superconducting Spectroscopic Array Receiver employing superconductor–insulator–superconductor mixers—is equipped on the telescope with a typical single sideband noise temperature of 60 K, which works on the 85–115 GHz frequency band (W. Shan et al. 2012). Signals from the upper and lower sidebands were analyzed by fast Fourier transform spectrometers with 16,384 channels and 1 GHz bandwidth, resulting in a spectral frequency resolution Δν of ~61.04 kHz corresponding to a velocity width of ~0.21 km s−1 per channel. The pointing accuracy root mean square (rms) of the telescope was within 5″ as deduced from tests performed close to our observation periods. Around our observed frequency range, 88.433–89.433 GHz, we got the HPBW (half power beam width) is ~62″, while the main-beam efficiency ηB was ~62% at this frequency from Status Report on the 13.7 m Millimeter-Wave Telescope for the 2022–2023 Observing Season.9 We centered on the emission lines of HCN(J = 1–0) in 88.632 GHz and that near its frequency (e.g., HCO+(J = 1–0) in 89.188 GHz). The frequencies were obtained from the JPL catalog.10
The single-point on-off observations were performed under good atmospheric conditions with the typical system temperatures (Tsys) between 100 and 130 K. The equation  was used to convert antenna temperature,
  , to main-beam brightness temperature, Tmb, where ηB is the main beam efficiency. Atmospheric calibration was done in every scan using employing the standard chopping wheel calibration method (B. L. Ulich & R. W. Haas 1976 and references there in). The pointing and device status were confirmed with a strong sources before each day's observations (e.g., IRC+10216).
The data were reduced and analyzed using the CLASS of GILDAS software package.11 The data processing included correction of Doppler shift, which corrects the radial velocity of the comet relative to the telescope during observation period (listed in Table 2) for spectral lines. The function used to fit baseline showed a negligible effect within small frequency range under our experiment. We subtracted baseline using linear fitting excluding the width range of emission line profile (−2 to +2 km s−1), then averaged all spectra based on rms level.
3. Result
The spectra of the two transitions we focus on within our observation frequency, HCN(J = 1–0) and HCO+(J = 1–0), were shown in Figures 1 and 2. Averages were done with a weight inferred from the noise of individual spectra to increase the signal-to-noise ratio (S/N) over the whole observation periods owing to very limited integration times in a single day. Spectra are aligned on the velocity scale.
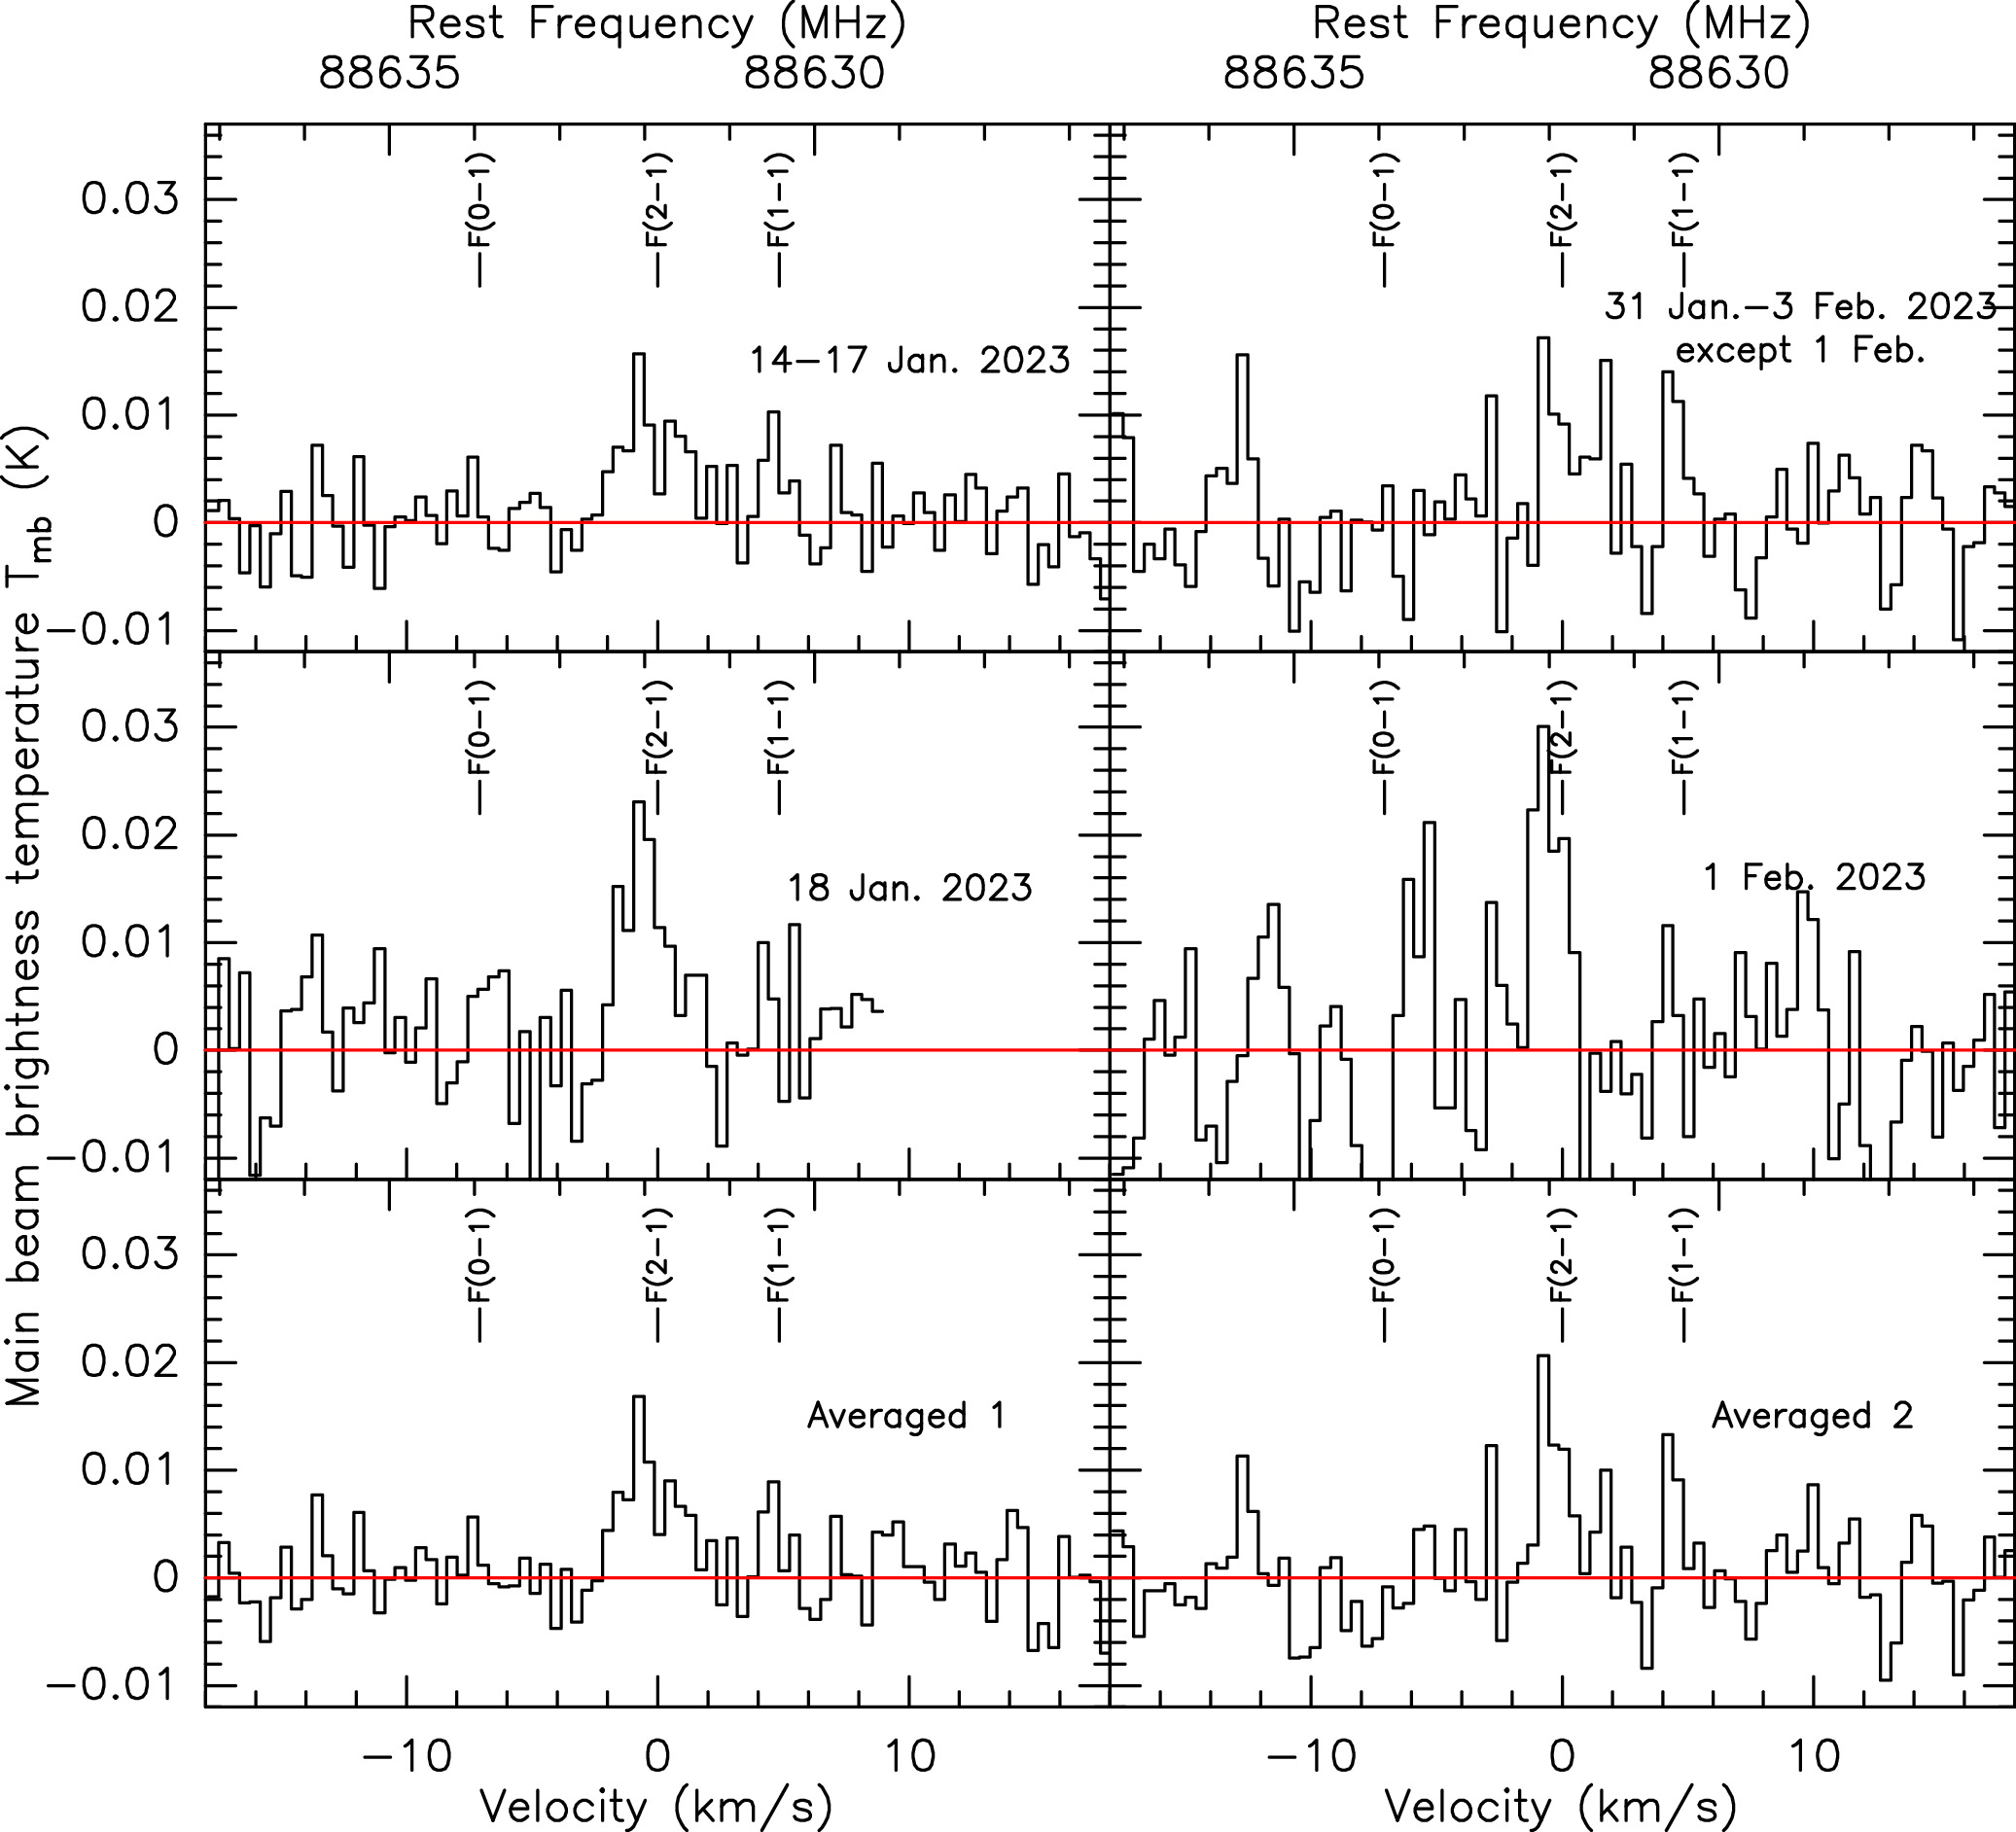
Figure 1. Averaged HCN(J = 1–0) spectra of C/2022 E3 observed at two certain times: 2023 January 14 to 18 (left), January 31 to February 3 (right). The average spectrum of the day with the strongest signal (middle row), the other days besides that day (top row), all days (bottom row) in each of the two observation periods was shown. The red line is the baseline. The vertical scale is the main beam brightness temperature and the horizontal scale is the Doppler velocity in the comet rest frame. The frequency resolution of 0.1221 MHz, and velocity resolution of 0.4129 km s−1 after smooth. We listed the fitting results in Table 3.
Download figure:
Standard image High-resolution image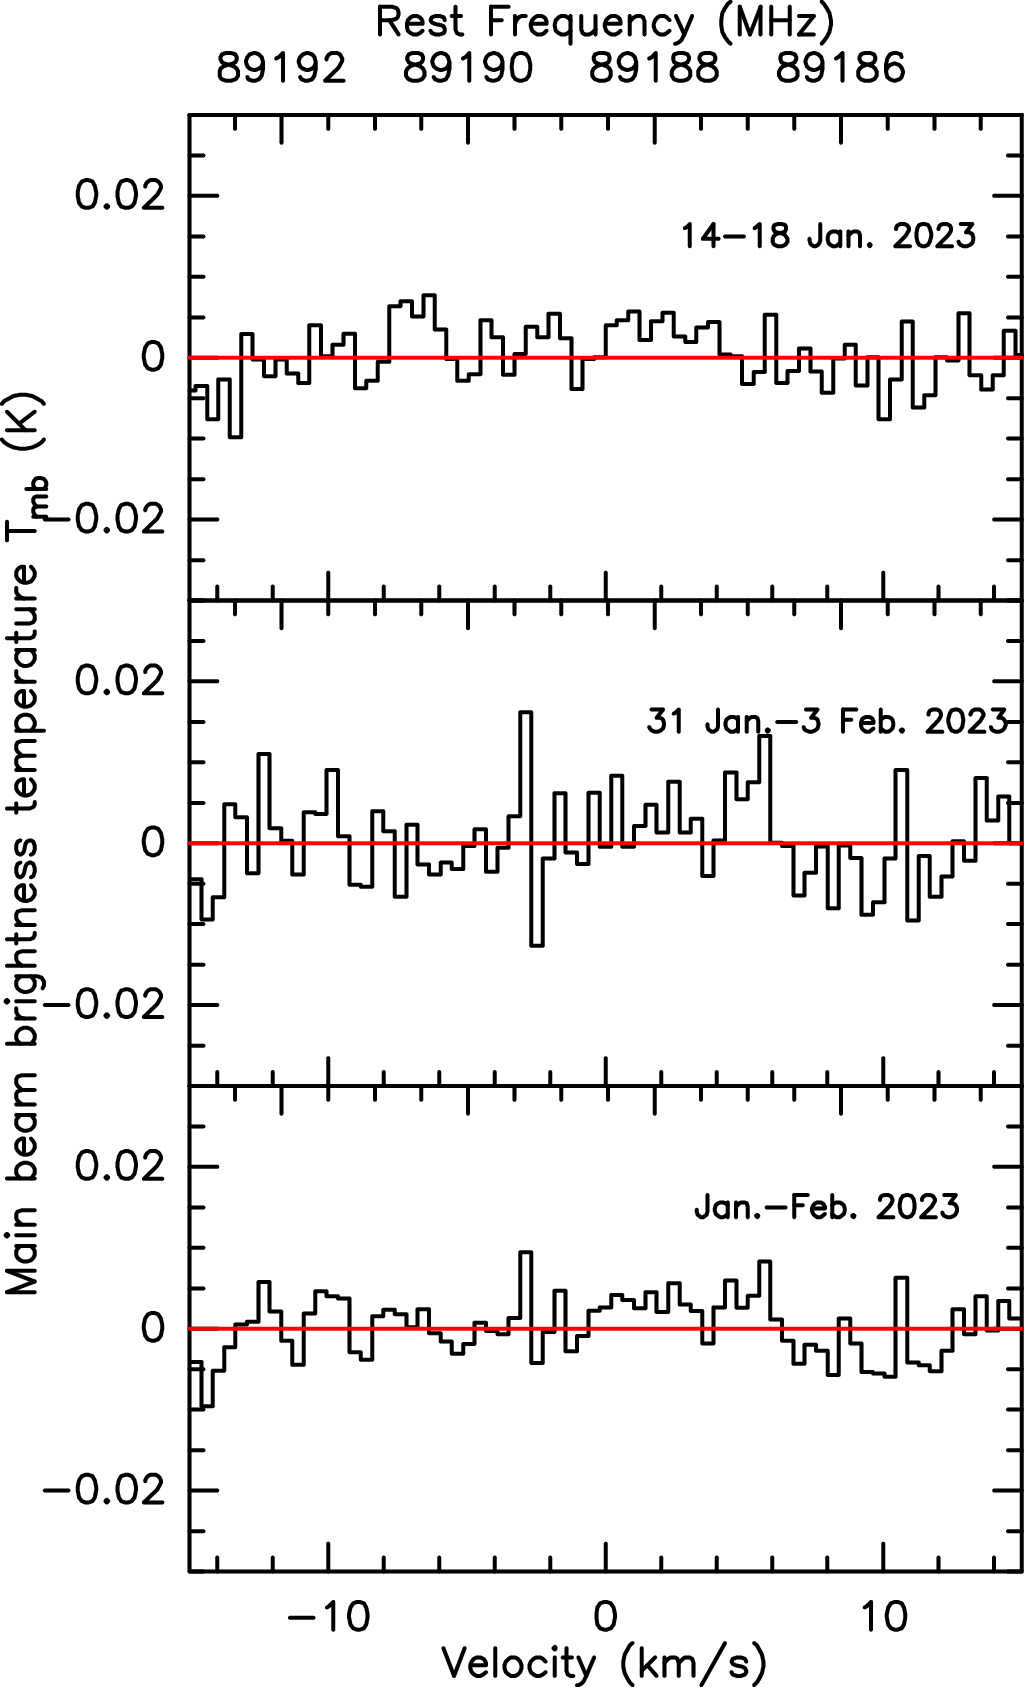
Figure 2. Averaged HCO+(1–0) spectra of C/2022 E3 observed in our two observing periods: 2023 January 14 to 18 (top), January 31 to February 3 (middle), and all averaged (bottom). The frequency resolution was 0.1221 MHz, corresponding to velocity resolution of 0.4103 km s−1.
Download figure:
Standard image High-resolution imageThe two stronger hyperfine components for HCN(J = 1–0), F = 1–1, and F = 2–1 were detected, the S/N of the average F = 0–1 was less than 1σ during the observational session. With regard to local thermal equilibrium condition, the intensities at low optical depths of the three hyperfine components F = 0–1, 2–1, and 1–1 from their statistical weights should be in the ratio of 1:5:3. The peak main beam temperature of these three components were 0.006, 0.017, 0.009 K, respectively, in the averaged spectra of January with rms = 0.003 K, and <0.004, 0.021, 0.012 K in the averaged spectra of February with rms = 0.004 K (see detail in Table 3). Our detection results roughly match this ratio, despite the insufficient S/N of the weakest F = 0–1 line. We also estimated the 3σ upper limits of integrated intensities for the weaker line, HCO+(J = 1–0), which were not detected.
Table 3. Spectral Characteristics of C/2022 E3 (ZTF)
| UT Date (2023) | 〈rh〉 | Line | Frequency | FWHMa | ∫TMBdvb | Doppler Shiftc | Tpeakd | rmse |
|---|---|---|---|---|---|---|---|---|
| (mm/dd.dd–(mm/)dd.dd) | (au) | (MHz) | (km s−1) | (K km s−1) | (km s−1) | (K) | (K) | |
| 01/14.87−18.01 | 1.114 | HCN(1–0) | 88631.847 | 1.170 ± 0.311 | 0.027 ± 0.004 | −0.731 | 0.015 | 0.003 |
| 01/18.85−19.00 | 1.117 | ⋯ | ⋯ | 2.040 ± 0.604 | 0.048 ± 0.006 | −0.731 | 0.024 | 0.005 |
| 01/14−19 | 1.115 | HCN(1−0) | 88631.847 | 1.295 ± 0.299 | 0.029 ± 0.004 | −0.731 | 0.017 | 0.003 |
| HCO+(1−0) | 89188.518 | ⋯ | <0.012 | ⋯ | ⋯ | 0.003 | ||
| 01/31.81−02/03.93 (except 02/01) | 1.163 | HCN(1−0) | 88631.847 | 1.264 ± 0.802 | 0.029 ± 0.006 | −0.731 | 0.018 | 0.005 |
| 02/01.82−01.97 | 1.160 | ⋯ | ⋯ | 1.284 ± 0.325 | 0.026 ± 0.009 | −0.731 | 0.028 | 0.007 |
| 01/31−02/03 | 1.162 | HCN(1−0) | 88631.847 | 1.264 ± 0.310 | 0.028 ± 0.006 | −0.731 | 0.021 | 0.004 |
| HCO+(1−0) | 89188.518 | ⋯ | <0.019 | ⋯ | ⋯ | 0.005 | ||
Notes. aThe FWHM line width obtained from a Gaussian fit. bThe integrated intensity or 3σ upper limit. cThe velocity of peak temperature. dThe peak main beam temperature. eThe 1σ noise of the base residuals in observed spectra (TMB scale).
Download table as: ASCIITypeset image
Two Gaussians, one to each of the blueshifted (v < 0) and redshifted (v > 0) peaks, were tried to fit the profile, which provides a good estimate of the expansion velocity (N. Biver et al. 2021). From these fittings, we analyzed the marginal HCN spectral line profiles and obtained the full width at half maximum (FWHM). The integrated intensity or 3σ upper limit was obtained from velocity interval [−2, 2] km s−1, and the error was calculated from the equation  , where dv is the channel width and n is the number of channels spanning the line. The Doppler shift relative to the reference frame of the cometary nucleus is the velocity of the peak main beam temperature. Their values are summarized in Table 3.
4. Discussion
4.1. Outgassing Pattern
The gas expansion velocity  has been estimated from the half width at half maximum intensity (HWHM) using the assumption 0.9 HWHM from N. Biver et al. (1999; Table 4). The asymmetry of E3’s coma (M. M. Knight et al. 2023b; D. G. Schleicher et al. 2023) was also shown in our spectrum, even with a long integration time. The Doppler shift remains at a stable negative value (−0.731 km s−1 with the velocity resolution of 0.4129 km s−1) around our observations exhibited a stronger coma in the hemisphere facing toward the Earth and the Sun with the solar phase angle reduced from 62° to 45°. A stronger peak on the observer side (dayside) than that on antiobserver side (nightside) during January was found with symmetry velocity locations after the fitting. We can easily deduce from the spatial position relationship that if the comet's activity is uniformly concentrated in the hemisphere toward the Sun, then with a phase angle of less than 90°, stronger peak will also be concentrated in the hemisphere toward the Earth. Therefore, blueshift is a normal situation. However, the signal from the nightside seems to be obscured on the stronger days, January 18 and February 1, in our two periods with the best S/N (middle row in Figure 2). This suggests that E3 may exhibit short-term activity variations, which we will discuss in the next section.
Table 4. Production Rate
| UT Date (2023) | 〈rh〉 | Composition |

| Production Rate Aa | Production Rate Bb | H2O Production Rate |
|---|---|---|---|---|---|---|
| (mm/dd.dd–(mm/)dd.dd) | (au) | (km s−1) | (×1025 molec. s−1) | (×1025 molec. s−1) | (×1028 molec. s−1) | |
| 01/14.87–18.01 | 1.114 | HCN | 0.53 ± 0.14 | 6.78 ± 1.86 | 7.91 ± 1.17 | ⋯ |
| 01/18.85–19.00 | 1.117 | HCN | 0.92 ± 0.27 | 11.21 ± 2.94 | 13.08 ± 1.63 | ⋯ |
| 01/14–19 | 1.115 | HCN | 0.58 ± 0.13 | 7.11 ± 1.91 | 8.30 ± 1.14 | 2.95 ± 0.07c |
| HCO+ | <0.60 | <2.74 | ⋯ | 6.23 ± 0.08d | ||
| 01/31.81–02/03.93 (except 02/01) | 1.163 | HCN | 0.57 ± 0.36 | 3.40 ± 1.09 | 4.06 ± 0.84 | ⋯ |
| 02/01.82–01.97 | 1.160 | HCN | 0.58 ± 0.15 | 3.00 ± 1.27 | 3.58 ± 1.24 | ⋯ |
| 01/31–02/03 | 1.162 | HCN | 0.57 ± 0.14 | 3.27 ± 1.07 | 3.91 ± 0.84 | 3.05 ± 0.06c |
| HCO+ | <0.60 | <2.34 | ⋯ | |||
Notes. aProduction rate estimated using the expansion velocity from this work. bProduction rate estimated using the expansion velocity of 0.68 km s−1 from N. Biver et al. (2024). cThe mean production rate of water from M. Combi et al. (2023). dThe mean production rate of water on January 19 from N. Biver et al. (2024).
Download table as: ASCIITypeset image
4.2. Production Rate Evolution
To compute the HCN production rates, we tried to adopt isotropic outgassing at the expansion velocity of 0.58 ± 0.13 km s−1 in January. Similarly, for February, we used an expansion velocity of 0.57 ± 0.14 km s−1. These velocities correspond to the mean velocity of the Gaussian-fit results of the two averaged line profiles from our observations. Modeling a symmetric outgassing pattern does not lead to significant changes in the retrieved total outgassing rates.
The line area ∫TMBdv can be converted into the production rate Q by modeling the excitation of considered energy levels of the molecule and radiative transfer (J. Crovisier 1985; D. Bockelee-Morvan et al. 1987). We considered an isotropic coma so that the volume density of the molecules is inversely proportional to the square of the nucleocentric distance (L. Haser 1957; L. Haser et al. 2020). The primary beam Half Power Beam Width is about 1.3 × 10⁴ km, which is one order of magnitude lower than the dissociation scale length of HCN (about 105 km, derived by photodissociation rate coefficients β0 = 1.26 × 10⁻⁵ s−1 for the quiet Sun at 1 au from W. F. Huebner & J. Mukherjee 2015). Local thermal equilibrium (LTE) was also assumed in this case, in which the rotational temperature is equal to the kinetic temperature. We have collected previous research on gas or rotational temperatures derived from series rotational lines and hypotheses in other long-period comets at similar heliocentric distances during our observations as references, 50–70 K (D. Bockelée-Morvan et al. 2001; M. A. DiSanti et al. 2009; N. X. Roth et al. 2021). We adopted the same gas temperature of 60 K as used in N. Biver et al. (2024) at 1.18 au, which is an average value obtained from multiple spectral lines of molecules such as CH3OH and CH3CN. A model from M. Drahus et al. (2010) was used to calculate production rate. Table 4 listed the estimated expansion velocity and production rate of HCN during mid January and early February. In our result, during our observation period, the yield of HCN appears to have reached its maximum on January 18 with the S/N above 4σ and may became higher in the coming days (M. Combi et al. 2023). During the observation period in February, the S/N was highest on February 1, but we did not observe any obvious fluctuations in the production rate during these days. From January to February, the production rate of HCN decreased by half, indicating a reduction in activity. The main reason should be the increase of heliocentric distance, but an effect of short-term changes like comet rotation should not be ignored. The significant error in yield primarily originates from our inability to obtain precise expansion velocities from weak spectral lines. We also used the velocity of 0.68 km s−1 from a strong line of HCN(3–2) in N. Biver et al. (2024), and the HCN production rate shown in Table 4 we recalculated was closed to the results of N. Biver et al. (2024).
During our observations, it was hard to obtain a line with high S/N in single day for the limited integration time. But there were obvious signal of HCN in two daily lines on January 18 and February 1, which were significantly higher than the other days. A decrease of mean yield during our observation derived from averaged spectra was obvious. In the case of nonisotropic coma, the rotation of the comet nucleus may also be one of the possible reasons for signal instability of our observations. F. Manzini et al. (2023) reported that through an analysis of the coma's morphology the rotation period of the nucleus of E3 was determined to be approximately 8.49 ± 0.12 hr. In contrast, a higher value of 8.70 ± 0.10 hr was estimated from M. M. Knight et al. (2023a) using both the Lowell Observatory Hall telescope and the Lowell Discovery telescope. N. Biver et al. (2024) also demonstrated temporal variations in water and methanol production rates with a period of approximately 8–9 hr. Our observations within a single day could not cover over 8 hr of a whole rotation period of E3. Thus our obtained result shows only an instantaneous behavior of this comet.
Table 5 presents the HCN production rates for long-period comets observed at similar heliocentric distances (rh ∼ 1.1–1.3 au). The HCN production rates of C/2022 E3 (ZTF) measured at three different epochs range from (3.91 ± 0.84) × 1025 to (8.30 ± 1.44) × 1025 molec. s−1, which are comparable to those of other long-period comets such as C/1999 T1 (McNaught-Hartley) ((5.8 ± 0.4) × 1025 molec. s−1) and C/2013 R1 (Lovejoy) ((7.4 ± 0.1) × 1025 molec. s−1).
We combined the production rates of HCN and CN radical from N. Biver et al. (2024), E. Jehin et al. (2022a, 2022b,2022c, 2023) and B. T. Bolin et al. (2024; Figure 3). The production rates show a clear trend with heliocentric distance, with the highest values observed at perihelion (around 1.11 au). The preperihelion data shows a power-law relationship with heliocentric distance (Q ~ r−2.05±0.33), similar to the  dependence observed for CO production in comet C/1995 O1 (Hale-Bopp; M. Womack et al. 2017). The postperihelion data suggests a steeper decline in production rates, particularly for HCN, though the limited number of observations makes a definitive power-law fit challenging. The variation in HCN production rate after perihelion is consistent with that of CN. But the HCN/CN ratio in comet E3 seems difficult to determine. While HCN is often considered the primary parent molecule of CN in cometary comae (N. Fray et al. 2005), the discrepancy between HCN and CN production rates is not unprecedented, having been observed in several other comets including 6P/d'Arrest (N. Dello Russo et al. 2009), 67P/Churyumov-Gerasimenko (N. Hänni et al. 2020), and C/2012 S1 (N. Dello Russo et al. 2016). The enhanced CN production, particularly evident in the strong CN jets observed during late January and early February (M. M. Knight et al. 2023b; D. G. Schleicher et al. 2023), suggests the possible presence of additional CN parent molecules or production mechanisms.
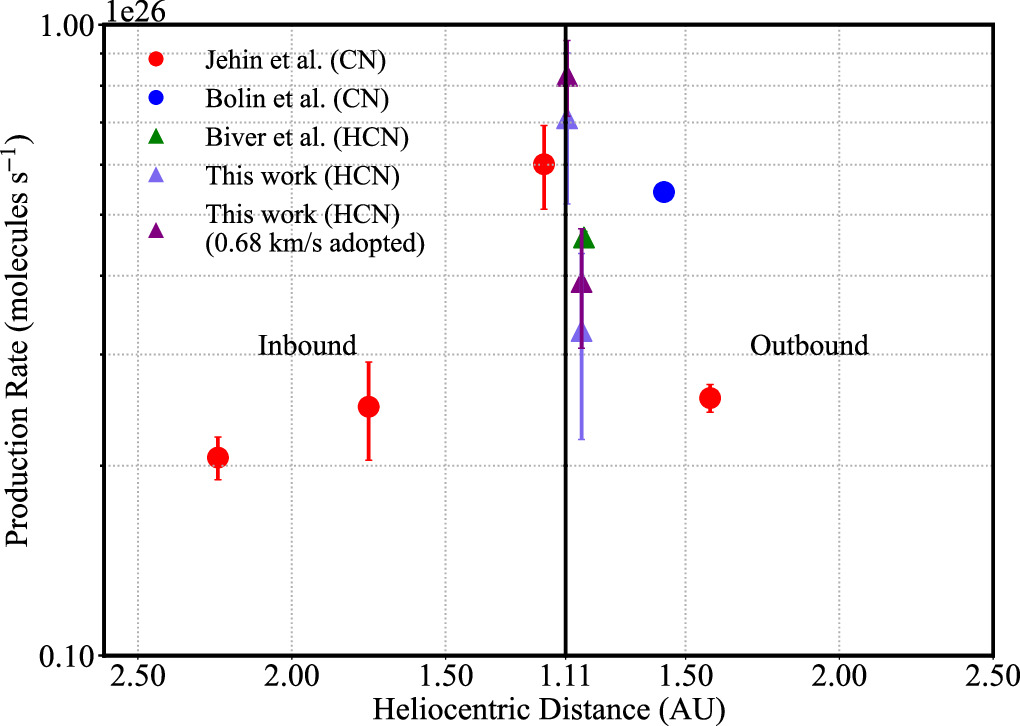
Figure 3. The evaluation of production rate of HCN or CN. The results from E. Jehin et al. (2022b, 2022c, 2023), B. T. Bolin et al. (2024), and this work are represented by different signs.
Download figure:
Standard image High-resolution imageHCO+ was detected in comet C/2006 P1 (McNaught) at heliocentric distance 0.256 au (N. Biver et al. 2011), which is the main daughter molecule of HCOOH dissociation, but escaped in E3. We estimated the 3σ upper limit of HCO+ production rate <2.74 × 1025 molec. s−1 and <2.34 × 1025 molec. s−1 during the two observation periods, respectively.
4.3. Abundance and Comparison with other Comets
As discussed in Section 4.2, the variation of production rate in postperihelion looked steeper than that in preperihelion. But comparing production rates is not very useful since they depend on the comet size and global activity in addition to the relative abundance of HCN, such as  . Water production rates of E3 during January and February were reported by M. Combi et al. (2023), which was derived from the observation of the Solar Wind ANisotropies (SWAN) all-sky hydrogen Lyα camera on the SOlar and Heliosphere Observer (SOHO) satellite. N. Biver et al. (2024) also detected H2O(110–101) line at 556.9 GHz by Odin satellite on January 19, from which production rate was derived. Since there is already evidence of temporal variations in E3 production rates (see Section 4.2), which could influence our abundance estimate. The discrepancy from two detections also indicated this (listed in Table 4). The daily water production rates inferred from SOHO/SWAN observations of the wide H Lyα coma tended to smooth out short-term variations. Results from N. Biver et al. (2024) may better match our short-term observations. Ultimately, we used the values from N. Biver et al. (2024) in January and M. Combi et al. (2023) in February to calculated the abundance, but we do not doubt their accuracy.
The HCN abundance relative to water in C/2022 E3 (ZTF) remains stable at around 0.13%, which falls within the typical range (0.08%–0.16%) observed in other long-period comets at similar heliocentric distances. Our results were same with that in N. Biver et al. (2024), (0.09 ± 0.01)%, this lower value was result from a higher water production rate, 5 × 1028 molec. s−1, they used. The abundances of HCO+ were also calculated, <0.04% in mid January and <0.08% in early February (Table 5).
Table 5. HCN Production Rate and Abundance of Long-period Comets in Similar Heliocentric Distance
| Comet | UT Date | 〈rh〉 | Production Rate Q | Abundance | References |
|---|---|---|---|---|---|
| (au) | (molec. s−1) | Relative to Water | |||
| C/1996 B2 (HYAKUTAKE) | 1996 05/15–16 | 1.23 | (1.4 ± 0.1) × 1026 | (0.07 ± 0.01)% | N. Biver et al. (1999) |
| C/1999 H1 (LEE) | 1999 05/24 | 1.163 | (1.18 ± 0.20) × 1026 | (0.11 ± 0.02)% | N. Biver et al. (2000) |
| C/1999 T1 (McNaught-Hartley) | 2001 01/05 | 1.23 | (5.8 ± 0.4) × 1025 | (0.08 ± 0.01)% | N. Biver et al. (2006) |
| C/2001 A2 (LINEAR) | 2001 07/09 | 1.16 | (6.2 ± 0.3) × 1025 | (0.14 ± 0.01)% | N. Biver et al. (2006) |
| C/2000 WM1 (LINEAR) | 2001 12/05 | 1.16 | (2.9 ± 0.2) × 1025 | (0.08 ± 0.01)% | N. Biver et al. (2006) |
| 2001 12/08 | 1.11 | (3.5 ± 0.2) × 1025 | (0.08 ± 0.01)% | N. Biver et al. (2006) | |
| C/2006 M4 (SWAN) | 2006 10/31–11/10 | 1.038 | (3.43 ± 0.352) × 1026 | (0.13 ± 0.02)% | M. A. DiSanti et al. (2009) |
| C/2004 Q2 (Machholz) | 2005 01/12–16 | 1.217 | (2.26 ± 0.02) × 1026 | 0.08% | M. de Val-Borro et al. (2012) |
| C/2013 R1 (Lovejoy) | 2013 11/08–12 | 1.13 | (7.4 ± 0.1) × 1025 | 0.16% | N. Biver et al. (2014) |
| C/2014 Q2 (Lovejoy) | 2015 01/14 | 1.312 | (4.5 ± 0.1) × 1025 | 0.09% | E. S. Wirström et al. (2016) |
| C/2018 Y1 (Iwamoto) | 2019 02/04–19 | 1.30 | (2.2 ± 0.2) × 1025 | (0.10 ± 0.02)% | P. Bergman et al. (2022) |
| C/2015 ER61 (PanSTARRS) | 2017 04/06–05/09 | 1.10 | (8.2 ± 2.1) × 1025 | (0.082 ± 0.021)% | P. Bergman et al. (2022) |
| C/2022 E3 (ZTF) | 2023 02/03–07 | 1.17 | (4.1 ± 0.1) × 1025 | (0.09 ± 0.01)% | N. Biver et al. (2024) |
| C/2022 E3 (ZTF) | 2023 01/14–19 | 1.115 | (8.30 ± 1.44) × 1025 | (0.13 ± 0.02)% | This work |
| C/2022 E3 (ZTF) | 2023 01/31–02/03 | 1.162 | (3.91 ± 0.84) × 1025 | (0.13 ± 0.03)% | This work |
Download table as: ASCIITypeset image
5. Conclusions
The Purple Mountain Observatory 13.7 m millimeter-wave telescope was used to observe a long-period comet C/2022 E3 (ZTF) at 3.4 mm after perihelion in 2023 mid January and early February, transition of HCN (J = 1–0) was detected.
- (1)The HCN and HCO+ production rates were (8.30 ± 1.14) ×1025 molec. s−1 and <2.74 × 1025 molec. s−1 in mid January, and (3.91 ± 0.84) × 1025 molec. s−1 and <2.34 ×1025 molec. s−1 in early February, respectively, which were derived from spectral lines by the excitation model of M. Drahus et al. (2010) under LTE assumption of 60 K gas temperature and 0.68 km s−1 expansion velocity from N. Biver et al. (2024).
- (2)For most of our observation time, the gas expansion velocity was about 0.6 km s−1, and the averaged spectral line exhibited an asymmetric profile, which may indicate that the activity of HCN on the day and night sides is inconsistent.
- (3)We got common values of HCN abundance relative to water, (0.13 ± 0.02)% in mid January when E3 closed to the Sun, and (0.13 ± 0.03)% in early February among several long-period comets in similar heliocentric distance. The different values of water production rate from M. Combi et al. (2023) and N. Biver et al. (2024) in mid January indeed effect our estimate of abundance. Our conclusion leans toward E3 being similar to most comets, with the abundance of HCN remaining stable during our two observation periods. However, regarding HCN/CN ratio, the data we have collected do not allow us to reach a definitive conclusion.
Acknowledgments
We thank all the staff of the Delingha Radio Telescope at Purple Mountain Observatory for their assistance. We thank Zhen Wang and Shaobo Zhang for helpful suggestions. We acknowledge the DPS meeting abstract from Michael Combi. We acknowledge the support of the National Natural Science Foundation of China (grant Nos. 12173093 and 12033010), the science research grants from the China Manned Space Project with No. CMS-CSST-2021-B08. We acknowledge the support of the Minor Planet Foundation of Purple Mountain Observatory, China.
Footnotes
- 5
- 6
- 7
- 8
- 9
- 10
JPL catalog: https://spec.jpl.nasa.gov (H. M. Pickett et al. 1998).
- 11