ABSTRACT
The recent discovery of methyl formate and dimethyl ether in the gas phase of cold cores with temperatures as cold as 10 K challenges our previous astrochemical models concerning the formation of complex organic molecules (COMs). The strong correlation between the abundances and distributions of methyl formate and dimethyl ether further shows that current astrochemical models may be missing important chemical processes in cold astronomical sources. We investigate a scenario in which COMs and the methoxy radical can be formed on dust grains via a so-called chain reaction mechanism, in a similar manner to CO2. A unified gas-grain microscopic–macroscopic Monte Carlo approach with both normal and interstitial sites for icy grain mantles is used to perform the chemical simulations. Reactive desorption with varying degrees of efficiency is included to enhance the nonthermal desorption of species formed on cold dust grains. In addition, varying degrees of efficiency for the surface formation of methoxy are also included. The observed abundances of a variety of organic molecules in cold cores can be reproduced in our models. The strong correlation between the abundances of methyl formate and dimethyl ether in cold cores can also be explained. Nondiffusive chemical reactions on dust grain surfaces may play a key role in the formation of some COMs.
1. INTRODUCTION
Interstellar complex organic molecules (COMs), which are defined as carbon-containing molecules with six or more atoms, have attracted increasing interest in the past few decades (Herbst & van Dishoeck 2009). Although this definition can refer to the unsaturated carbon-chain species detected in cold cores, the acronym is more commonly used to refer to the more terrestrial-like molecules most strongly associated with hot cores and corinos. The interest in COMs derives not only from the fact that COMs can be good probes of physical conditions of astronomical sources but also from the notion that COMs may be the basis of prebiotic molecules, which may be related to the origin of life. Although COMs were first observed in hot cores (Blake et al. 1987), they are also detected in a variety of other types of astronomical sources in the early phases of star formation (Bottinelli et al. 2004; Arce et al. 2008; Öberg et al. 2010; Bacmann et al. 2012; Cernicharo et al. 2012; Öberg et al. 2015).
Progress in the astrochemical modeling of COM formation has been driven by new observations of these species. COMs were first believed to be synthesized in the gas phase from precursors formed on cold dust grains and desorbed into the gas as the temperature of dust grains increased (Charnley et al. 1992). New observations toward hot corinos and the Galactic center challenged the original hypothesis that COMs are formed in the gas phase (Ceccarelli et al. 2000; Requena-Torres et al. 2007). Moreover, new experimental and computational results showed that the gas-phase syntheses used in the original models of COMs are not efficient enough to explain the abundances of methyl formate and other species in hot cores and corinos (Horn et al. 2004; Geppert et al. 2007). A commonly accepted formation mechanism, which is consistent with observations in these sources, has been developed (Garrod & Herbst 2006, Garrod et al. 2008; Vasyunin & Herbst 2013a). In this approach, zeroth-generation COMs such as methanol are formed on the growing ice mantles of cold dust grains by one mobile reactant, typically an atom or a diatomic molecule bound sufficiently loosely to a grain to diffuse rapidly even at 10 K, and another species. More complex species than methanol may also be formed by this mechanism. As the temperature increases, photodissociation products of zeroth-generation COMs, which are typically radicals, are able to diffuse on dust grain surfaces. The more strongly bound of these species do not desorb initially; thus, they can recombine via radical–radical association reactions to produce the first-generation COMs, such as methyl formate (HCOOCH3). Subsequent photodissociation and radical–radical reactions produce second-generation COMs, etc.
As the temperature continues to rise, the COMs desorb thermally into the gas, where they can be detected. Other mechanisms for desorption of COMs include shock processes (Requena-Torres et al. 2006, 2008), in regions such as the Galactic center not closely associated with hot cores, and nonthermal processes operative at low temperatures, such as photodesorption (Öberg et al. 2009). The thermal mechanism can explain in a semiquantitative sense most of the COM observations in hot cores and corinos (Garrod & Herbst 2006; Garrod et al. 2008). Most of the radical–radical recombination reactions used in this model, however, have not been studied in the laboratory, and complications have been found. For example, the methoxy radical (CH3O), used in the formation of methyl formate via surface recombination with the formyl radical (HCO), has not been found on ice surfaces in the synthesis of methanol from CO, leading to the suggestion that it may be converted into the isomeric form CH2OH and not be available to react with other radicals (Cernicharo et al. 2012). Of course, laboratory and interstellar timescales for surface reactions can be quite different; nevertheless, more research is clearly needed to confirm the radical–radical mechanism.
The recent detection of methyl formate and dimethyl ether in cold cores with temperatures as low as 10 K raises more serious questions about the general validity of the radical–radical mechanism to form COMs (Öberg et al. 2010; Bacmann et al. 2012; Cernicharo et al. 2012; Vastel et al. 2014) because radicals can diffuse only slowly if at all on ice mantles at 10 K and so cannot react efficiently with each other. It must be noted, however, that the studied sources are complex and the low resolution of single-dish telescopes might result in observations that mix both low-temperature and higher-temperature portions. In order to explain the recent detection of COMs in cold cores, Vasyunin & Herbst (2013b) suggested that the COMs are formed by precursors such as methanol that are first formed on grain surfaces at 10 K and then desorb to the gas phase via nonthermal mechanisms such as reactive desorption. Even so, they found that it was necessary to add more gas-phase reactions such as radiative association to produce reasonable abundances of methyl formate and dimethyl ether. A more recent approach to the gas-phase chemistry by Balucani et al. (2015) indicates that methyl formate can be formed in sufficient abundance via the gas-phase reaction

Moreover, they show that the CH3OCH2 radical is formed from dimethyl ether, leading to a correlation between the abundances of dimethyl ether and methyl formate. This correlation has been observed by Jaber et al. (2014) over a wide range of sources with differing conditions. However, a common problem of gas-phase routes to form dimethyl ether is that gas-phase methoxy abundances must be high enough in order to produce enough dimethyl ether (Vasyunin & Herbst 2013b). Given the low fractional abundance of gas-phase methoxy (4.7 × 10⁻¹²) observed in B1-b (Cernicharo et al. 2012), it is unclear that dimethyl ether can be formed solely in the gas phase in cold cores. For instance, in the standard model of Balucani et al. (2015), where the reactive desorption efficiency is set to be 0.01 and gas-phase COM formation reactions are included, at the time when the calculated fractional abundances of dimethyl ether and methyl formate fit observations in B1-b, the fractional abundance of methoxy is more than one order of magnitude larger than the observed value. Thus, even in cold cores where thermal desorption of COMs is very inefficient, COMs may also be formed appreciably on dust grains and then desorb into the gas phase via nonthermal processes. Recently, Ruaud et al. (2015) suggested that the abundances of gas-phase COMs in cold and dense regions can be significantly enhanced by introducing Eley–Rideal and complex induced reaction mechanisms on dust grains. However, the simulated abundances of methyl formate in their models are still more than two orders of magnitude smaller than the observed values in both B1-b and L1689b.
In this paper, we employ a different mechanism to help explain the detection of COMs in cold sources, as well as the correlation of the abundances of methyl formate and dimethyl ether. Our explanation is based on nondiffusive surface reactions, such as we and others considered for the case of CO2, which is one of the major components of ice mantles (Öberg et al. 2011). The most efficient formation mechanism to form CO2 is the reaction CO + OH  CO2 + H, although it does possess a significant barrier in the gas. In the laboratory, the surface analog appears to proceed via an Eley–Rideal mechanism, in which a gaseous CO molecule lands on and reacts with a surface OH radical, formed via photodissociation of water (Yuan et al. 2014). The efficiency of this reaction in the interstellar medium has not been determined. Another possible process to enable the CO + OH reaction is the so-called chain reaction mechanism, in which an O atom on a surface reacts diffusively with an H atom to form the OH radical, which can subsequently react with CO without undergoing diffusion if a CO molecule lies right below it (Chang et al. 2007; Garrod & Pauly 2011; Chang & Herbst 2012). Without the initial reaction between O and H, the O atoms cannot react efficiently with CO since the process has a significant barrier. Here, as discussed in Chang & Herbst (2014), we use the chain-reaction mechanism to produce COMs on the top layers of ice mantles. Note that chain reactions in our model are allowed to occur only if the radical–radical reactions are already in the network, so that it is possible that both this mechanism and a diffusive one can be operative, although the role of diffusion is limited for the production of COMs at low temperatures. In Figure 1, we show how dimethyl ether (CH3OCH3) is formed via a chain reaction in which an H atom adds to a methylene (CH2) radical on the surface to form a methyl (CH3) radical, which then can react with a methoxy radical (CH3O) lying beneath the methyl radical. Note also that the interstitial H atom shown in the figure (see below for a discussion) does not partake in the process.
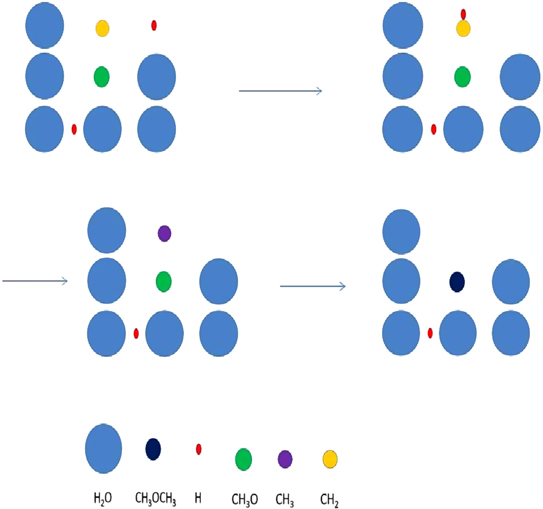
Figure 1. Chain-reaction mechanism leading to the formation of dimethyl ether in a water-rich ice mantle. See text for a discussion.
Download figure:
Standard image High-resolution imageRecently, we performed a unified microscopic–macroscopic Monte Carlo (UMMMC) simulation using a full gas-grain reaction network with physical conditions pertaining to cold cores (Chang & Herbst 2014). We found that moderate amounts of methyl formate and dimethyl ether could be formed on dust grains at temperatures as low as 10 K. The major nonthermal desorption mechanism considered was photodesorption; however, it is not sufficiently efficient to drive a significant fraction of COMs into the gas phase, so that most methyl formate and dimethyl ether remain on grain surfaces. In this paper, we report calculated gas-phase abundances of COMs in a cold core in a simulation that includes an efficient reactive desorption mechanism. In this mechanism, the exothermicity of a surface reaction is used to drive the reaction product into the gas phase. In addition to this nonthermal desorption mechanism, we also include a number of improvements to the gas-phase network. The improved model is able to reproduce observed abundances of COMs in cold sources, as well as the strong correlation in abundances between methyl formate and dimethyl ether.
2. SIMULATION METHODS AND CHEMICAL MODELS
We confine ourselves to a brief explanation of our simulation methods because they have been explained in detail in earlier papers (Chang et al. 2005; Cuppen & Herbst 2005; Chang & Herbst 2012, 2014), after which our chemical models are introduced.
2.1. Simulation Methods
In our UMMMC approach, the kinetics that occurs on grains is handled by a microscopic approach, in which the position of all species is known, while the gas-phase kinetics is handled by a macroscopic approach (Chang & Herbst 2014). In order to simulate chemical kinetics on a dust grain surface with N binding sites, we put these N sites on a 2L × 2L square lattice where L2 = N. Nodes in the lattice that have both even-numbered x and y coordinates are termed normal, while nodes with both odd-numbered x and y sites are termed interstitial. Normal sites exist both on the surface of a dust grain and in the bulk of the ice, while interstitial sites exist only in the bulk. Species on normal sites are called normal, while species occupying interstitial sites are labeled interstitial. Normal species on the topmost (surface) layer can hop from one normal site to another or desorb into the gas phase, while interstitial species can diffuse from one interstitial site to another in the bulk. The surface hopping rate b1 ( ) from one normal site to its nearest neighbor at temperature T is determined by the surface diffusion barrier Eb via the expression
  , where ν is the trial frequency. Similarly, the interstitial diffusion rate within the ice mantle is given by the expression
  , where
  is the interstitial diffusion barrier, while the thermal desorption rate is given by
  , where ED is the desorption energy. We set
  as in Chang & Herbst (2014). The formation of major species and COMs on dust grain surfaces is found to be independent of the value of the interstitial diffusion barrier,
  (Chang & Herbst 2014), while the abundance of radicals that are formed in the ice by photodissociation and bulk diffusion of photodissociation products is strongly dependent on Eb2. Because we only allow reactive desorption to occur on the topmost layer, the value of Eb2 should not affect the abundance of gas-phase COMs when reactive desorption is included in the simulation. We choose a value
  , which ensures that the interstitial diffusion rate is slower than the surface diffusion rate, while light species such as atomic H can still diffuse within the ice bulk. The desorption energy ED for each species on ice is taken from Garrod & Herbst (2006) and Garrod et al. (2008).
Hopping, interstitial diffusion, and thermal desorption are all modeled as Poisson processes, so the time interval between two consecutive events is given by  , where X is a random number uniformly distributed within (0, 1), while bi is the rate of hopping, interstitial diffusion, or thermal desorption. A chemical reaction can occur when one reactive species hops into another site with a reactive species, or, in the chain-reaction mechanism, a second reaction occurs between a newly formed species on the surface and one below it. Interstitial species can also diffuse out of the ice mantle and become normal surface species (Chang & Herbst 2014). Photodissociation processes are modeled as outcomes of another Poisson process, photon arrival. When photons arrive and strike the ice mantle, we keep track of the penetration of photons and decide whether photodissociation reactions can happen or not. The exponential nature of photon penetration is maintained in our simulation (Chang & Herbst 2014). Another possible outcome of photon arrival is photodesorption, which only occurs on the topmost two layers.
In order to include the reactive desorption mechanism in the UMMMC simulation, whenever a chemical reaction on the topmost layer occurs either diffusively or via a chain reaction, we generate a random number Y, which is uniformly distributed within (0, 1), and compare Y with a probability P. If Y < P, then all products of the reaction will desorb into the gas phase; otherwise, these products will remain on the ice mantle. Products of chemical reactions within the ice mantle still remain in the bulk, as in Chang & Herbst (2014). The probability P is the efficiency of reactive desorption, which is highly uncertain. On the other hand, it was found that P = 0.01 is large enough to explain the observed gas-phase methanol abundance, while  is the highest value considered by Garrod et al. (2007). We report simulation results from models with five different P values, 0, 0.01, 0.03, 0.05, and 0.1.
2.2. Chemical Models
The chemical reaction network used is based on the gas-grain reaction network used in Chang & Herbst (2014). Networks of this type can simulate both the gas-phase and grain-surface chemistry very well and predict abundances of many classes of molecules accurately in cold cores. Therefore, in this paper, we will concentrate on species such as COMs not treated by standard simulations, without discussing most other species in any detail. In particular, we emphasize methyl formate, dimethyl ether, and acetaldehyde, which were found in both B1-b and L1689B (Bacmann et al. 2012; Cernicharo et al. 2012), as well as the most ubiquitous COM, methanol. Although glycolaldehyde has not been found in cold cores so far, we still report the abundance of glycolaldehyde for comparison. Moreover, H2CO is a precursor of HCOOCH3 in some gas-phase synthetic routes (Horn et al. 2004; Vasyunin & Herbst 2013b), while the simulated abundance of H2CO is more than two orders of magnitude larger than the observed value in B1-b (Vasyunin & Herbst 2013b), so we also report the abundance of H2CO in our models.
The cosmic-ray ionization rate is set at ζ = 1.3 × 10⁻¹⁷ s−1. The physical conditions pertain to the cold regions of dense clouds where methyl formate and dimethyl ether have been found (Bacmann et al. 2012): the temperature is fixed at 10 K, while the total proton density ( ) is 105 cm−3. The dust-to-gas ratio is fixed at 10−12, and the visual extinction AV = 10. The major source of photons under these physical conditions occurs via the ionization of H2 by cosmic rays followed by electron excitation of H2 leading to photon emission (Gredel et al. 1989). We start from bare grain surfaces and use the same initial gas-phase abundances as in Chang & Herbst (2014), which are based on the assumption of low-metal abundances. We run each model 25 times up to a time of 2 × 10⁵ yr and take the average of these 25 simulation results so that the minimum nonzero fractional abundance of each species in the model is 4 × 10⁻¹³.
2.2.1. New Gas-phase Reactions
The more important additional gas-phase chemical reactions are listed in Table 1; of these, a few have been studied at 10 K, while some of the reaction rate coefficients have been extrapolated from higher temperature values, and still others represent a higher degree of speculation. The important formation of methoxy in the gas phase via the reaction between OH radical and methanol,

is well studied (Shannon et al. 2013). This reaction proceeds via an intermediate metastable van der Vaals-type complex, CH3OHOH , which can redissociate into reactants or proceed to form the final products via tunneling.
Table 1. Some Additional Gas-phase Reactions
| Additional Reaction | Rate Coefficient | References | ||
|---|---|---|---|---|
| at 10 K(cm3 s−1) | ||||
| (1) OH + CH3OH |

|
CH3O + H2O | 3.0 × 10⁻¹⁰ | Shannon et al. (2013) |
| (2) CH3 + CH3O |

|
CH3OCH3 + photon | 3.0 × 10⁻¹⁰ | Balucani et al. (2015) |
| (3) CH3OCH2 + O |

|
HCOOCH3 + H | 2.0 × 10⁻¹⁰ | Hoyermann & Nacke (1996) |
| (4) CH3OCH3 + Cl |

|
CH3OCH2 + HCl | 2.0 × 10⁻¹⁰ | Wallington et al. (1988) |
| (5) CH3O + O |

|
CH3 + O2 | 2.5 × 10⁻¹¹ | Zellner (1987) |
| (6) CH3O + H |

|
H2CO + H2 | 3.0 × 10⁻¹¹ | Baulch et al. (1992) |
| (7) CH3O + C |

|
CH3 + CO | 3.0 × 10⁻¹⁰ | Ruaud et al. (2015) |
| (8) CH3O + N |

|
H2CO + NH | 5.6 × 10⁻¹² | Ruaud et al. (2015) |

|
CH3 + NO | 1.7 × 10⁻¹² | ||
| (9) CH3OCH2 + H |

|
CH3O + CH3 | 3.0 × 10⁻¹¹ | Ruaud et al. (2015) |
| (10) CH3OCH2 + N |

|
CH3O + H2CN | 3.0 × 10⁻¹¹ | Ruaud et al. (2015) |
| (11) CH3OCH2 + C |

|
CH3O + C2H2 | 3.0 × 10⁻¹⁰ | Ruaud et al. (2015) |
| (12) CH3CHO + C |

|
C2H4 + CO | 3.0 × 10⁻¹⁰ | Ruaud et al. (2015) |
| (13) CH2OH + H |

|
H2CO + H2 | 1.0 × 10⁻¹¹ | Ruaud et al. (2015) |

|
CH3 + OH | 1.6 × 10⁻¹⁰ | Ruaud et al. (2015) | |
| (14) CH2OH + O |

|
H2CO + H2 | 1.0 × 10⁻¹⁰ | Ruaud et al. (2015) |
| (15) CH2OH + C |

|
CH3 + CO | 3.0 × 10⁻¹⁰ | Ruaud et al. (2015) |
| (16) CH2OH + N |

|
H2CO + NH | 2.2 × 10⁻¹¹ | Ruaud et al. (2015) |

|
HCN + H2O | 3.4 × 10⁻¹¹ | Ruaud et al. (2015) | |
| (17) H2CO + C |

|
CH2 + CO | 3.0 × 10⁻¹⁰ | Ruaud et al. (2015) |
| (18) H2CO + CH |

|
CH3 + CO | 4.0 × 10⁻¹⁰ | Ruaud et al. (2015) |
| (19) H2CO + CN |

|
HCN + HCO | 3.9 × 10⁻¹¹ | Ruaud et al. (2015) |
(20) CH3OCH + + 
|

|
CH3OCH2 + H | 2.7 × 10⁻⁸ | this work |
| (21) CH + H2O |

|
H2CO + H | 5.6 × 10⁻¹⁰ | Bergeat et al. (2009) |
| (22) CH + CH3OH |

|
H2CO + CH3 | 2.5 × 10⁻¹⁰ | Ruaud et al. (2015) |
| (23) CH + H2CO |

|
CO + CH3 | 4.0 × 10⁻¹⁰ | Ruaud et al. (2015) |
| (24) C + CH3OH |

|
HCO + CH3 | 2.0 × 10⁻¹⁰ | Shannon et al. (2014) |
| (25) CH3O + ions | This work | |||
| e.g., | ||||
| CH3OH++H1 |

|
CH3OH + H2 | 2.2 × 10⁻⁸ | ⋯ |
| He+ + CH3O |

|
CH + OH + He + OH + He |
9.3 × 10⁻⁹ | ⋯ |
| (26) CH3OCH2 + ions | This work | |||
| e.g., | ||||
 + CH3OCH2 + CH3OCH2 |

|
CH3OCH + H2 + H2 |
1.6 × 10⁻⁸ | ⋯ |
| He+ + CH3OCH2 |

|
CH +H2CO + He +H2CO + He |
7.2 × 10⁻⁹ | ⋯ |
| (27) glycolaldehyde | R. T. Garrod (2015, private communication) | |||
| reactions, e.g., | ||||
 + CH2OHCHO + CH2OHCHO |

|
CH2OHCH2O+ + H2 | 3.4 × 10⁻⁸ | ⋯ |
| He+ + CH2OHCHO |

|
CH2OH + HCO+ + He | 1.5 × 10⁻⁸ | ⋯ |
Download table as: ASCIITypeset image
Contrary to our earlier work (Chang & Herbst 2014), we distinguish the methoxy and hydroxymethyl (CH2OH) radicals in this study. We include the new gas-phase reactions related to methoxy, dimethyl ether, and methyl formate in Vasyunin & Herbst (2013b) and Balucani et al. (2015) except chemical reactions involving atomic fluorine because F can be quickly locked in the form of HF, so that Cl atoms play the major role in converting CH3OCH3 to CH3OCH2 in the gas phase (Balucani et al. 2015). Moreover, the additional gas-phase loss pathways of CH3O, H2CO, CH3OCH2, CH3CHO, and CH2OH in Ruaud et al. (2015) are also included in our reaction network. Because CH3O and CH3OCH2 are crucial for the gas-phase synthesis of COMs, we included destruction reactions of these two species by ions to complete the gas-phase destruction pathways. The rate coefficients and products of ion-CH3O reactions are set to be the same as those for ion-CH2OH reactions, which already exist in our gas-grain network. Similarly, the rate coefficients of ion-CH3OCH2 reactions are set to be the same as those of ion-CH3OCH3 reactions in our original gas grain network. We also introduced the channel CH3OCH3+ + 
 CH3OCH2 + H to complete the gas-phase formation routes of CH3OCH2, and we have included the gas-phase, mainly destruction, reactions related to glycolaldehyde (CH2OHCHO) (Garrod et al. 2008; Belloche et al. 2014; R. T. Garrod 2015, private communication).
Shannon et al. (2014) have shown that atomic C can react quickly with methanol at low temperatures, and this reaction may be the major loss process in the gas phase when atomic C is abundant. We included this reaction in our reaction network. In addition, we included three reactions involving the radical CH and the species H2O, CH3OH, and H2CO; these are analogs of surface reactions that are shown in Table 2.


2.2.2. Aspects of COM Grain Chemistry
The methoxy and hydroxymethyl radicals lead to COMs on grain surfaces. Both radicals can be hydrogenated to produce methanol, while only methoxy can react with HCO and CH3 to form HCOOCH3 and CH3OCH3, respectively, and hydroxymethyl can react with HCO and CH3 to form glycolaldehyde (CH2OHCHO) and ethanol (C2H5OH) instead. As for their formation, accretion of methoxy onto the grains is not likely to be important because the fractional abundances of gas-phase methoxy are found to be quite low in the cold cores B1-b and L1544 (Bacmann et al. 2012; Cernicharo et al. 2012; Vastel et al. 2014). On the grain surface, both methoxy and hydroxymethyl can be produced via the photodissociation of methanol (Garrod et al. 2008). The hydrogenation of CO can lead to hydroxymethyl and methoxy. In most models we assume that Y, the methoxy yield by gradual hydrogenation of CO, is zero because it has been argued that the abundance of methoxy on the grain surface is small and methoxy can quickly isomerize to hydroxymethyl (Cernicharo et al. 2012). We do, however, consider the possibility that Y = 0.5 in one model, considering that the H + H2CO reaction in the gas phase possesses a lower barrier to the formation of CH3O than to CH2OH, coupled with the high barrier to isomerization in the gas. We also include the analog of reaction (2) on the surfaces of grains among the new surface reactions in our model, shown in Table 2. If efficient, this reaction can be the dominant production mechanism for surface methoxy at certain times. It likely competes with stabilization to form the van der Waals complex CH3OHOH (Ruaud et al. 2015). Moreover, we also consider the case that the product of reaction (2) is CH2OH instead of CH3O owing to the high exothermicity of the chain-reaction mechanism. The radical CH is important for the formation of COMs on the grain surface, as explained in the next section, so we included three more surface reactions that destroy CH, which are shown in Table 2.
We define a parameter, RP, for the probability that OH and CH3OH, with the radical lying atop methanol, complete a chain reaction to form CH3O and H2O or CH2OH and H2O. The larger the value of RP, the more likely OH can react with CH3OH in the same site. In our simulations, we utilize values for RP ranging from 10−4 to unity. The parameter  is used to refer to the probability that OH and CH3OH form CH2OH and H2O. Table 3 shows the values of the parameters P, RP, Y, and
  used for different models simulated in this work. The models are characterized by two or three numbers following the letter M. For models with two numbers, the first number refers to the value of the efficiency P of reactive desorption; the digits 0, 1, 2, 3, and 4 refer, respectively, to values for P of 0, 0.01, 0.03, 0.05, and 0.1. The second number refers to the probability RP. Here the digits 0, 1, 2, and 3 refer, respectively, to values of RP equal to 10−4, 0.1, 0.5, and 1.0. For example, the model M40 refers to a simulation in which the probability of reactive desorption of products is 0.1, while the probability that methoxy and water are formed in the reaction between OH and CH3OH is a small 10−4. If a model has three numbers, the first two numbers refer to the same parameters as those in a model with two numbers, while the third number is an index that specifies different Y and
  values. For instance, in model M431, P = 0.1, RP = 1.0, Y = 0, and
  = 1.0.
Table 3. Model Parameters
| Model | M40 | M41 | M42 | M43 | M02 | M12 | M22 | M32 | M431 | M432 |
|---|---|---|---|---|---|---|---|---|---|---|
| P | 0.1 | 0.1 | 0.1 | 0.1 | 0 | 0.01 | 0.03 | 0.05 | 0.1 | 0.1 |
| RP | 0.0001 | 0.1 | 0.5 | 1.0 | 0.5 | 0.5 | 0.5 | 0.5 | 1.0 | 1.0 |
| Y | 0 | 0 | 0 | 0 | 0 | 0 | 0 | 0 | 0 | 0.5 |
| RP2 | 0 | 0 | 0 | 0 | 0 | 0 | 0 | 0 | 1.0 | 1.0 |
Note. The letter P refers to reactive desorption efficiency, while RP refers to the probability that the surface reaction between OH and CH3OH produces the methoxy or hydroxymethyl radical as a product. The probability that the surface reaction between OH and CH3OH produces the hydroxymethyl radical is represented as RP2. The letter Y refers to the CH3O yield by the hydrogenation of H2CO. See the text for details.
Download table as: ASCIITypeset image
3. RESULTS: THE FORMATION OF COMs
In this section, we discuss how COMs are formed both in the gas and on grains followed by desorption into the gas, in an attempt to determine which mechanism, if either, is dominant for which molecule. We start with a discussion of the uncertain abundance of the important precursor methoxy.
3.1. The Role and Abundance of Granular Methoxy
Figure 2 shows the fractional abundances with respect to  for H2O, HCOOCH3, CH2OHCHO, CH3OCH3, C2H5OH, CH3CHO, CH3O, CH2OH, H2CO, and CH3OH as functions of time on dust grain ices in models M43 (P = 0.1, RP = 1.0, Y = 0, RP2 = 0) and M40 (P = 0.1, RP = 10−4, Y = 0, RP2 = 0). In the figure, the letter J designates granular species. These are extreme cases; the models in which the parameter RP assumes intermediate values have results in between M43 and M40. We first discuss the abundance of methoxy because its existence on ice mantles to any appreciable degree is now controversial (Cernicharo et al. 2012). In model M43, methoxy can be efficiently formed on grain surfaces by the surface analog of reaction (2), while in model M40, this reaction contributes little to the formation of methoxy on grain surfaces. Reaction (2) cannot happen on grain surfaces by a diffusive process at 10 K because neither OH nor CH3OH can diffuse appreciably on grain surfaces this cold. Instead, we invoke a chain-reaction mechanism, in which the reaction happens when O combines with atomic H and there is a CH3OH molecule lying below the newly formed OH so that OH can immediately react with CH3OH to form CH3O and water.
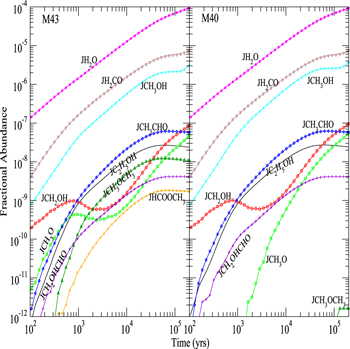
Figure 2. Fractional abundances of COMs, methoxy, hydroxymethyl, and water on and in grain mantles as a function of time in models M43 (P = 0.1, RP = 1.0, Y = 0, RP2 = 0) and M40 (P = 0.1, RP = 10−4, Y = 0, RP2 = 0).
Download figure:
Standard image High-resolution imageIn model M43, the methoxy abundance first increases because of the increase in the granular methanol abundance via hydrogenation of CO followed by surface reaction (2), then fluctuates before 104 yr, and then increases again because photodissociation of methanol can produce methoxy, which is buried within the ice mantle. In model M40, on the other hand, there is hardly any methoxy on the grain surface before 2 × 10³ yr because methoxy can only be formed weakly by surface reaction (2). Photodissociation of methanol is the major reaction to form methoxy in model M40, and at later times this mechanism produces as much methoxy as in model M43. Indeed, after 2 × 10³ yr the abundance of surface methoxy in model M40 increases monotonically. It is interesting to see that at about 104 yr, the total (surface+bulk) abundance of methoxy in both models M40 and M43 is roughly the same because methoxy formed by photodissociation of methanol that is deeply buried within ice accumulates and is much more abundant than methoxy on the topmost ice layer. Nevertheless, the abundance of methoxy on the topmost layer of the ice mantle in M43 is always much larger than that in M40 because the surface reaction (2) is efficient and is the major pathway for the formation of CH3O on the topmost layer in M43. Moreover, it is the methoxy on the topmost layer that can react with radicals to form methyl formate and dimethyl ether via the chain-reaction mechanism on the grain surface. Methoxy buried in the ice mantle can only participate in the interstitial chemistry or photodissociation.
The abundance of surface methoxy can be much lower than calculated here if, as discussed by Cernicharo et al. (2012), laboratory evidence suggests that surface methoxy can isomerize to CH2OH if it does not react with H first to form methanol. The main piece of evidence for this isomerization is the inability to detect the infrared bands of methoxy. Although the authors suggest that the isomerization is promoted by proton exchange, it is not clear to us how this process can occur quickly on an interstellar ice surface, even if it does in the laboratory. We have decided not to include this isomerization until it is investigated more closely. Calculations of other ion-neutral processes on ice mantles have been undertaken by Woon (2011). Perhaps some information on the isomerization could also be obtained from measured abundances of CH3OD and CH2DOH on interstellar grains. On the other hand, our assumption that methoxy cannot be formed by gradual hydrogenation of CO can partially offset the absence of isomerization of methoxy in our surface reaction network.
Figure 3 shows the fractional abundances with respect to nH for surface H2O, HCOOCH3, CH2OHCHO, CH3OCH3, C2H5OH, CH3CHO, CH3O, CH2OH, H2CO, and CH3OH as functions of time on dust grain ices in model M431, where the product of OH and CH3OH is CH2OH instead of CH3O, and model M432, where the CH3O yield of the H2CO hydrogenation reaction is 0.5. The reactive desorption efficiency is also fixed to be 0.1 in models M431 and M432. We can see that, similar to model M40, there is hardly any surface methoxy formed in model M431 before 2 × 10³ yr because there is no efficient methoxy formation process on the topmost layer in model M431. However, if the CH3O yield of the H2CO hydrogenation reaction is non-negligible, specifically Y = 0.5 as in model M432, the surface methoxy abundance in M432 is even slightly higher than that in model M43 before 2 × 10³ yr because H2CO hydrogenation is an efficient surface CH3O formation process on the topmost layer. After 104 yr, however, as the accumulation of CH3O formed by photodissociation reactions becomes the major source of CH3O on grain surfaces, methoxy abundances in models M432 and M431 are almost the same.
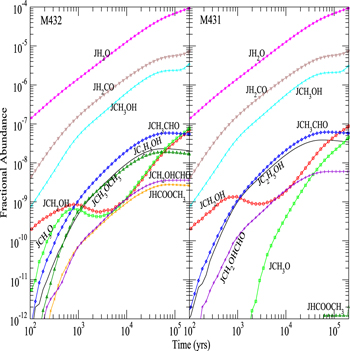
Figure 3. Fractional abundances of COMs, methoxy, hydroxymethyl, and water on and in grain mantles as a function of time in models M431 (P = 0.1, RP = 1.0, Y = 0, RP2 = 1.0) and M432 (P = 0.1, RP = 1.0, Y = 0.5, RP2 = 1.0).
Download figure:
Standard image High-resolution image3.2. The Production of COMs on Ice
While the larger COMs cannot be detected on granular ices, it is important to consider their abundance prior to desorption into the gas, if it can occur. We can see that the abundances of water and methanol, as shown in Figure 2, always increase with time in both models M43 and M40 because they are continuously formed on dust grains. Since the surface reaction (2) is not the major reaction to form or destroy water or methanol, the abundances of water and methanol do not change with the change in efficiency of this reaction.
The abundances of methyl formate, dimethyl ether, glycolaldehyde, ethanol, and acetaldehyde first increase with time and then reach a plateau at 105 yr in both models M43 and M40. Similarly, although these five COMs can be formed by the recombination of radicals in our surface reaction network, they cannot be formed on grain surfaces by a diffusive process at 10 K because relevant radicals cannot diffuse appreciably on grain surfaces this cold. Instead, they can be formed by similar chain-reaction mechanisms. Acetaldehyde is produced when CH2 combines with atomic H and there is an HCO radical lying below the newly formed CH3. Methyl formate can be produced by a newly formed HCO, which is formed by CH and O, and a CH3O molecule lying below the HCO, while dimethyl ether can be produced by a newly formed CH3 radical and a CH3O radical lying below it. The isomer CH2OH can combine with HCO or CH3 to form glycolaldehyde or ethanol in a similar way to the formation of methyl formate or dimethyl ether. The radical CH2OH itself can be formed by hydrogenation of H2CO and photodissociation of methanol, so the abundance of CH2OH as a function of time in both models M43 and M40 is similar to that of CH3O in model M43, where the surface reaction (2) is efficient. We can also see that because the formation pathways of glycolaldehyde and acetaldehyde are independent of the radical CH3O on the topmost layer, the abundances of glycolaldehyde and acetaldehyde are almost independent of the value of  On the other hand, because the formation mechanisms of methyl formate and dimethyl ether are dependent on the radical CH3O on the topmost layer, the abundances of dimethyl ether and methyl formate in model M40 are more than two orders of magnitude smaller than in model M43. The plateaus of methyl formate, dimethyl ether, glycolaldehyde, ethanol, and acetaldehyde abundances, reached after 105 yr, occur because gas-phase atomic carbon is depleted after 105 yr as shown in Figure 4, while surface CH and CH2 are mainly formed by hydrogenation of accreted C from the gas phase.
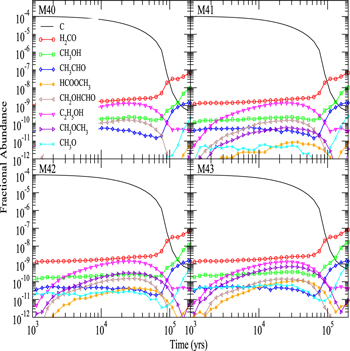
Figure 4. Fractional abundances of gas-phase COMs, methoxy, and atomic carbon as a function of time for models M40, M41, M42, and M43. See Table 2 for a definition of the models.
Download figure:
Standard image High-resolution imageFigure 3 shows that if the product of surface reaction (2) is CH2OH instead of CH3O, methyl formate or dimethyl ether can hardly be formed on grain surfaces in model M431 because only a few methoxy molecules can be formed on the topmost layer of the ice mantle. Moreover, if the CH3O yield of H2CO hydrogenation takes the non-negligible value of 0.5, a moderate amount of methyl formate and dimethyl ether can be formed on grain surfaces in model M432 even if the surface reaction (2) produces CH2OH instead of CH3O. On the other hand, the abundances of surface species other than methyl formate, dimethyl ether, and methoxy in Figure 3 are not much affected by the change of surface reaction (2) products and the CH3O yield of H2CO hydrogenation because the formation of these species is not strongly dependent on the methoxy abundance on the topmost layer. The abundance of surface CH2OH before 2 × 10⁵ yr in model M431 is less than 2 times more than that in model M432 because the CH2OH yield of H2CO hydrogenation in model M431 is 2 times as much as that in model M432. Consequently, the abundances of surface species such as C2H5OH, which require CH2OH as a precursor in model M431, are about a factor of 2 larger than those in model M432.
3.3. The Production of Gaseous COMs
Gas-phase COMs can be produced by gas-phase processes, granular processes followed by nonthermal desorption, or both of the above either in parallel or in series. The fractional abundances of gas-phase COMs, methoxy, and atomic carbon as a function of time for models M40, M41, M42, and M43 are presented in Figure 4. In these models, the efficiency of reactive desorption remains at 0.1, while the efficiency of methoxy production in surface reaction (2) increases from near zero to unity. Similar to the abundances of surface species, the abundances of gas-phase carbon atoms, formaldehyde, methanol, acetaldehyde, ethanol, and glycolaldehyde are independent of the parameter RP, while the abundances of methoxy, methyl formate, and dimethyl ether typically increase as RP becomes larger. Methanol can be continuously produced on grain surfaces via the hydrogenation of CO and then be desorbed efficiently into the gas phase; however, because gaseous methanol can be destroyed by gas-phase C atoms, its abundance maintains only a moderate value and then quickly increases as gaseous C is depleted in all models. Glycolaldehyde is another species that is mainly formed on the grain surface. However, the formation of glycolaldehyde is strongly dependent on the abundance of the surface radical CH, which is mainly produced by hydrogenation of atomic C accreted on grain surfaces. So after 105 yr, when the abundance of gas-phase C quickly drops, the formation rate of glycolaldehyde on the grain surface also quickly drops; thus, the abundance of gas-phase glycolaldehyde also drops quickly. As in the formation of glycolaldehyde, the formation of methyl formate and dimethyl ether on grain surfaces also depends on accreted gas-phase C; however, because these species can also be synthesized in the gas phase, their abundances first drop as gas-phase C is depleted and then increase as the abundances of gas-phase CH3O, CH3OH, and H2CO increase. Similarly, the gas-phase abundance of gaseous ethanol also drops at about 105 yr as gas-phase C is depleted. In addition to the grain-surface formation route, ethanol can be formed by dissociative recombination of C2H5OH , which is produced by two gas-phase radiative association reactions in our gas-grain network:


So, after gaseous C is depleted, unlike glycolaldehyde, the abundance of gaseous ethanol still maintains a small value (a few × 10−11) because of its gas-phase synthetic routes.
From Figure 4, we can also see that gaseous methyl formate and dimethyl ether have very low abundances in model M40. As RP increases, desorbed dimethyl ether and methyl formate molecules become the major source of gas-phase dimethyl ether and methyl formate. In addition, the gas-phase synthetic routes CH3 + CH3O  CH3OCH3 and O + CH3OCH2
  H + HCOOCH3 also become more significant as RP increases because the abundances of gas-phase CH3O and CH3OCH3 increase.
In models M41, M42, and M43 methoxy can be produced both in the gas phase and on the grain surface, while in M40 it is mainly formed in the gas phase. The increase of gas-phase methoxy after 105 yr occurs because gas-phase species that can react with CH3O such as O, N, and C are depleted and because its precursor, methanol, increases in abundance. Acetaldehyde is a COM that can also be synthesized both on dust grains and in the gas phase. The abundance of gas-phase C also must be high enough in order to produce CH3CHO on dust grains as explained above; however, since CH3CHO can also be produced by the reaction

in the gas phase where C2H5 is desorbed into the gas phase by reactive desorption, the abundance of gas-phase CH3CHO is significant at all times in models M40, M41, M42, and M43. Table 4 lists the dominant synthetic routes for gaseous COMs—gas phase or grain surface—for models M40, M41, M42, and M43 at a time of  . The results show that with an efficient chemical desorption mechanism (
 ), synthesis occurs mainly on grains with the exception of acetaldehyde.
Table 4. Dominant Synthetic Mechanism for Gaseous COMs
| Model | M40 | M41 | M42 | M43 | M431 | M432 |
|---|---|---|---|---|---|---|
| H2CO | Both | Both | Both | Both | Both | Both |
| CH3OH | Grain | Grain | Grain | Grain | Grain | Grain |
| HCOOCH3 | ⋯ | Grain | Grain | Grain | ⋯ | Grain |
| CH2OHCHO | Grain | Grain | Grain | Grain | Grain | Grain |
| CH3OCH3 | ⋯ | Grain | Grain | Grain | ⋯ | Grain |
| CH3CHO | Gas | Gas | Gas | Gas | Gas | Gas |
| C2H5OH | Grain | Grain | Grain | Grain | Grain | Grain |
Note. Calculations refer to a time of 5 × 10⁴ yr, close to best fits in L1689b and B1-b. Grain: gas-phase COMs are formed mainly by surface reactions followed by reactive desorption. Gas: gas-phase COMs are formed mainly by gas-phase reactions. Ellipsis points: vanishingly small production.
Download table as: ASCIITypeset image
Similar to model M40, as shown in Figure 5, gaseous methyl formate and dimethyl ether in model M431 have very low abundances because the abundance of methoxy on the topmost layer on the ice mantle is very low. Thus, it is difficult to synthesize methyl formate and dimethyl ether on a grain surface. After we introduce an efficient surface CH3O formation process, i.e., hydrogenation of H2CO, in model M432, the abundances of gaseous methyl formate and dimethyl ether are similar to that in model M43. Generally speaking, the abundances of gas-phase species other than methoxy, methyl formate, and dimethyl ether do not vary much in models M40, M41, M42, M43, M431, and M432. We can also see that the time dependence of gas-phase species in models M432 amd M431 is similar to that in models M43 and M40, respectively.
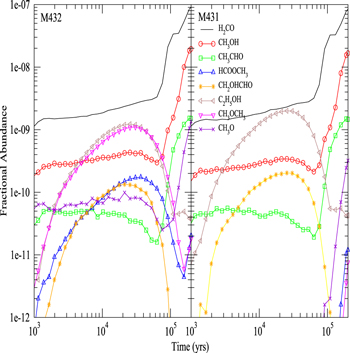
Figure 5. Fractional abundances of gas-phase COMs, methoxy, and atomic carbon as a function of time for models M431 and M432. See Table 2 for a definition of the models.
Download figure:
Standard image High-resolution image3.4. The Influence of Reactive Desorption
The fractional abundances of gas-phase COMs and methoxy as a function of time for models M02, M12, M22, and M32 are presented in Figure 6. In these four models, we fix RP to be 0.5, while P, the efficiency of reactive desorption, takes the values 0, 0.01, 0.03, and 0.05 in models M02, M12, M22, and M32, respectively. The products of surface reaction (2) are fixed to be CH3O and H2O, while hydrogenation of H2CO can only lead to CH2OH. A general feature that is apparent is that as the efficiency of reactive desorption goes from 0 to nonzero, the abundances of COMs become large enough to be displayed in the figure. With no reactive desorption, although there is still an efficient methoxy formation pathway on the topmost layer, the abundances of gas-phase COMs are very low because they or their precursors cannot be synthesized efficiently in the gas phase with our reaction network. However, despite the fact that there is no efficient mechanism to desorb COMs from grain surfaces, a small amount of COMs, especially methanol and acetaldehyde, can be desorbed into the gas phase by photodesorption. In model M12, where the reactive desorption efficiency is 0.01, the fractional abundance of ethanol gains the most, rising from a value below 10−12 to around 10−10, while the abundance of methanol increases by more than one order of magnitude. With the same increase in reactive desorption efficiency, the fractional abundances of acetaldehyde and glycolaldehyde increase from a value below or slightly above 10−12 to a value that is typically around 10−11, while the abundances of methyl formate and dimethyl ether increase from a value below 10−12 to a value that is around 10−11. The fractional abundance of methoxy increases from a value below 10−12 to around 10−12 before 105 yr and then quickly increases further. As P further increases from 0.01 to 0.03 and 0.05, we can see that the abundances of all COMs and methoxy increase further, although generally not as dramatically.
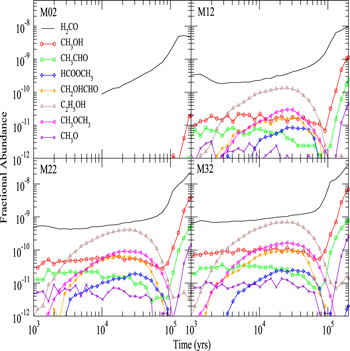
Figure 6. Fractional abundances of gas-phase COMs and methoxy as a function of time for models M02, M12, M22, and M32. See Table 2 for definitions of models.
Download figure:
Standard image High-resolution imageNow, let us consider the time dependence. Overall, we can see that the abundances of all gas-phase species other than formaldehyde in Figure 6 decrease at a time near 105 yr and then some species, such as methanol, can recover. The decrease in the abundance of glycolaldehyde at this time can be explained by the depletion of atomic C in gas phase, as explained in the previous subsection. The slight decrease in the abundance of gas-phase methanol can be explained by the depletion of CO and gas-phase atomic C, which is the major destroyer of methanol in the gas phase. Afterward, as gas-phase species such as O, which can react with atomic H on grain surfaces, are further depleted from the gas phase, it becomes more likely that atomic H can hydrogenate CO to form methanol instead of reacting with species such as O. Moreover, as gas-phase C is depleted, the major destruction process of methanol no longer exists. Thus, the abundance of methanol both on the topmost layer of the ice mantle and in the gas phase increases again. Since methanol is the major precursor of methoxy both on the grain surface and in the gas phase, the abundance of methoxy as a function of time generally follows that of methanol. The decrease of gas-phase methyl formate and dimethyl ether abundances is the outcome of the decrease of the gas-phase methoxy abundance and the depletion of atomic C in the gas phase. We can similarly explain the abundance of gas-phase ethanol and acetaldehyde as a function of time. Table 5 lists the dominant synthetic routes for gaseous COMs—gas phase or grain surface—for models M02, M12, M22, and M32 at a time of 5 × 10⁴ yr. It can be seen that a small nonzero value for the probability of reactive desorption is all that is needed for the efficient production of the COMs, even though acetaldehyde is formed by a sequence of gas-phase reactions following reactive desorption, showing that without desorption of suitable precursors, even gas-phase syntheses may not be efficient. Acetaldehyde can also be formed on dust grain surfaces; however, its formation by surface reactions followed by reactive desorption only accounts for about 5% of its total production.
Table 5. Dominant Synthetic Mechanism for Gaseous COMs. II
| Model | M02 | M12 | M22 | M32 |
|---|---|---|---|---|
| H2CO | Gas | Both | Both | Both |
| CH3OH | Grain | Grain | Grain | Grain |
| HCOOCH3 | ⋯ | Grain | Grain | Grain |
| CH2OHCHO | ⋯ | Grain | Grain | Grain |
| CH3OCH3 | ⋯ | Grain | Grain | Grain |
| CH3CHO | ⋯ | Gas | Gas | Gas |
| C2H5OH | ⋯ | Grain | Grain | Grain |
Note. Calculations refer to a time of  , close to best fits in L1689b and B1-b. Grain: gas-phase COMs are formed mainly by surface reactions followed by reactive desorption. Gas: gas-phase COMs are formed mainly by gas-phase reactions. Ellipsis points: vanishingly small production.
Download table as: ASCIITypeset image
4. COMPARISONS WITH OBSERVATIONS AND PREVIOUS MODELS
It is interesting to see how well our simulation results for COMs and the related radical species agree with observations and the results of previous models. The abundances of COMs in our model M02 are too low to to be interesting for comparison with observation, so they are excluded from our discussion below. There are virtually no methyl formate molecules formed in models M40 and M431, so these two models are also excluded from our discussion. Moreover, no numerical values for abundances of species in the models of Balucani et al. (2015) are reported, so model results in Balucani et al. (2015) are only compared with our results briefly. We focus on comparisons involving the abundances of species in the sources L1689b and B1-b because only the upper limits of the abundances of methoxy, methyl formate, and dimethyl ether in L1544 are available (Vastel et al. 2014).
The comparison with observed values should be made using simulated abundances at the time of best agreement. In order to find this time, one approach is to calculate the confidence parameter ki for each species i (Garrod et al. 2007). The best agreement is then obtained when  , where the sum is for species detected in the astronomical sources, has its maximum value. For rate equation simulations, ki is calculated from the equation

where erfc is the complementary error function, Ri is the simulated fractional abundance of species i,  is the observed abundance of species i, and σ is the standard deviation, which is set to be unity here because we assume the uncertainty of observed abundances to be one order of magnitude. The value of ki increases as the ratio
  approaches unity. However, for UMMMC simulation results, we cannot directly use the above equation to calculate ki because the minimum nonzero fractional abundance of species we can calculate in our models is 4 × 10⁻¹³, so that any fractional abundance smaller than 4 × 10⁻¹³ will be 0 by our MC simulation. The reason why we set the gas-phase fractional abundance resolution to be 4 × 10⁻¹³ is clear now, because the smallest observed fractional abundance of the species of interest is that of CH3O, which is 4.7 × 10⁻¹² as shown in Table 6. So, in order to find the best-fitting time, we first find time points, tj, when the number of species with calculated abundances that differ from their observed values by less than one order of magnitude is a maximum. If there is only one time point tj, then tj is the time of best fit. If there is more than one time point, tj, we then use the above equation to calculate
  at all time points tj, where the sum is only over those species whose calculated abundances differ from their observed values by less than one order of magnitude. The best-fitting time is the time point tn when
  is a maximum. Our new method to find the best-fitting time essentially does not distinguish between bad values and very bad values. One obvious advantage is that the chosen best-fitting time will have the maximum number of species with calculated abundances differing from observed values by less than one order of magnitude. The species in Table 6 are used for analysis. We focus on the time range 5 × 10⁴–2 × 10⁵ yr to find the best agreement time since the so-called early time when calculated abundances of most species agree well with observations lies around 105 yr for cold cores.
Table 6. Fractional Abundances of COMs and Methoxy in Cold Cores and Time of Best Fits
| Source | Observation | Time | HCOOCH3 | CH3OCH3 | CH3CHO | CH3O | CH3OH | H2CO |
|---|---|---|---|---|---|---|---|---|
| or Model | (yr) | |||||||
| Observation | 7.4(−10) | 1.3(−10) | 1.7(−10) | ⋯ | ⋯ | 1.3(−9) | ||
| M1a | 1.3(5) | 4.9(−16) | 2.4(−17) | 3.2(−11) | 5.3(−14) | 5.7(−12) | 9.8(−10) | |
| M10a | 5.1(5) | 3.3(−12) | 1.3(−10) | 6.4(−11) | 8.5(−10) | 2.3(−8) | 5.4(−8) | |
| Model Bb | 2.0(5) | 3.6(−13) | 2.35(−10) | 1.8(−10) | 7.55(−12) | 3.1(−10) | 1.05(−8) | |
| L1689b | M41 | 5.3(4) | 6.8(−12) | 3.9(−11) | 2.3(−11) | 2.0(−12) | 1.6(−10) | 2.6(−9) |
| M42 | 6.3(4) | 3.0(−11) | 1.5(−10) | 1.8(−11) | 1.0(−11) | 1.9(−10) | 3.2(−9) | |
| M43 | 5.3(4) | 9.4(−11) | 4.7(−10) | 1.9(−11) | 2.7(−11) | 2.5(−10) | 2.8(−9) | |
| M432 | 7.6(4) | 7.8(−11) | 3.5(−10) | 2.9(−11) | 2.5(−11) | 3.7(−10) | 5.5(−9) | |
| M12c | 1.9(5) | 0 | 0 | 1.7(−10) | 3.4(−11) | 1.1(−9) | 9.5(−9) | |
| M22 | 5.3(4) | 1.2(−11) | 5.0(−11) | 2.8(−12) | 3.2(−12) | 3.6(−11) | 9.2(−10) | |
| M32 | 5.3(4) | 1.9(−11) | 9.7(−11) | 1.0(−11) | 5.6(−12) | 7.1(−11) | 1.3(−9) | |
| Observation | 2.0(−11) | 2.0(−11) | 1.0(−11) | 4.7(−12) | 3.1(−9) | 4.0(−10) | ||
| M1a | 1.0(6) | 4.2(−15) | 1.8(−12) | 4.7(−12) | 8.5(−11) | 2.5(−9) | 2.9(−9) | |
| M10a | 2.6(5) | 2.0(−12) | 3.7(−12) | 3.7(−11) | 1.5(−10) | 3.3(−9) | 4.8(−8) | |
| Model Bb | 5.0(5) | 1.7(−13) | 5.5(−12) | 4.7(−12) | 1.2(−11) | 2.4(−10) | 8.5(−9) | |
| B1-b | M41 | 5.3(4) | 6.8(−12) | 3.9(−11) | 2.3(−11) | 2.0(−12) | 1.6(−10) | 2.6(−9) |
| M42 | 6.3(4) | 3.0(−11) | 1.5(−10) | 1.8(−11) | 1.0(−11) | 1.9(−10) | 3.2(−9) | |
| M43 | 9.1(4) | 2.5(−11) | 9.8(−11) | 1.4(−10) | 8.4(−12) | 7.0(−10) | 2.0(−8) | |
| M432 | 1.1(5) | 1.6(−11) | 6.8(−11) | 4.8(−10) | 3.7(−11) | 1.6(−9) | 3.4(−8) | |
| M12 | 5.3(4) | 7.2(−12) | 1.1(−11) | 2.4(−12) | 1.2(−12) | 1.3(−11) | 5.9(−10) | |
| M22 | 5.3(4) | 1.2(−11) | 5.0(−11) | 2.8(−12) | 3.2(−12) | 3.6(−11) | 9.2(−10) | |
| M32 | 5.3(4) | 1.9(−11) | 9.7(−11) | 1.0(−11) | 5.6(−12) | 7.1(−11) | 1.3(−9) |
Notes. Observational values are taken from Vasyunin & Herbst (2013b). a(b) denotes a × 10b.
aVasyunin & Herbst (2013b). P is 0.1 and 0.01 in models M10 and M1, respectively. bRuaud et al. (2015). P = 0.01. cFractional abundances computed to be 0 should be interpreted as <4 × 10⁻¹³.Download table as: ASCIITypeset image
Table 6 shows the best-time simulated abundances of gaseous COMs and methoxy in our models M12, M22, M32, M41, M42, M43, and M432, as well as models M1 and M10 of Vasyunin & Herbst (2013b) and model B of Ruaud et al. (2015), along with observed values in the cold cores L1689b and B1-b. The molecules are discussed individually.
- 1.Methanol: The observed abundance of methanol in B1-b is reasonably fit by the values of previous models except Model B. Because of the inclusion of the destruction of gas-phase methanol by atomic C, it is now difficult to reproduce the observed methanol abundance with our models except for models M43 and M432. The time of best fits in models M43 and M432 is later than that in other models so that gas-phase C is more depleted at the time of best fits in these two models.
- 2.Acetaldehyde: The abundance of this species in B1-b is fit reasonably by all models except models M43 and M432, which overproduce it by 1–1.5 orders of magnitude, while models M22 and M32 fail to reproduce the acetaldehyde abundance in L1689b to within an order of magnitude.
- 3.Methoxy: Detected only in B1-b, methoxy has an observed abundance that is reproduced by all of our models. The fractional abundances of methoxy in models M1 and M10 (Vasyunin & Herbst 2013b) are more than one order of magnitude larger than the observed value, while the result in model B (Ruaud et al. 2015) can fit the observation reasonably well. Vasyunin & Herbst (2013b) do not distinguish between methoxy and hydroxymethyl.
- 4.Methyl formate: It is difficult to reproduce the high abundance of methyl formate in L1689b with any models in which the reactive desorption efficiency P is less than 0.1. This statement includes our models M12, M22, and M32, as well as models M1 and B. For our models in which P = 0.1 (M41, M42, M43, and M432), the observed abundance in L1689b can be reproduced only in model M43 and M432, in which RP = 1, but even here the discrepancy is nearly an order of magnitude. For model M10, in which P = 0.1, the observed abundance in L1689b cannot be reproduced. It is easer to understand the lower observed abundance of methyl formate in B1-b. Our models M12, M22, and M32 and model B contain abundances in agreement with the observed values in B1-b, while model M1 (P = 0.01) still fails to reproduce the observed abundance. All models in Table 6 with a higher reactive desorption efficiency of P = 0.1 can mimic the observed abundance of HCOOCH3.
- 5.Formaldehyde: The abundances of this species calculated with model M10 are more than two orders of magnitude larger than the observed values in both B1-b and L1689, while the model B result is more than one order of magnitude larger than the observed value in B1-b. Our model results fit L1689b observations well; however, models M43 and M432 overestimate the formaldehyde abundance in B1-b.
- 6.Dimethyl ether: Model B (Ruaud et al. 2015), which sets the reactive desorption efficiency P to be 0.01, can reproduce the abundance of CH3OCH3 in L1689b, while all other models with P = 0.01 fail. This stems from a very high computed value for the abundance of surface CH3OCH3, which, if correct, might be detectable by infrared absorption. Otherwise, the models that produce reasonable fits to the methyl formate abundance also reproduce observed values for dimethyl ether.
Overall, only our models M43 and M432 can reproduce the abundances of all species in L1689, but these two models fail to reproduce acetaldehyde and formaldehyde abundances in B1-b.
There were also attempts to detect ethanol in B1-b (Cernicharo et al. 2012). However, ethanol has not been detected with a  upper limit to its column density. We estimate the upper limit of the abundance of ethanol to be 6.7 × 10⁻¹². At the time of best fit for B1-b, because ethanol can be efficiently formed on grain surfaces in our models other than M432, simulated ethanol abundances in these models are around 10−10, which is more than one order of magnitude larger than the upper limit of ethanol abundance in B1-b. On the other hand, because the surface synthesis of ethanol almost ceases owing to the depletion of atomic gaseous C in model M432 at the time of best fit, our simulated ethanol abundance drops to 4.5 × 10⁻¹¹, which is still somewhat larger than the upper limit to the abundance in B1-b. Since our simulated ethanol abundances are above the observed upper limit, some important destruction mechanisms may be missing. One possibility is the destruction reaction with atomic carbon, which, although unstudied to the best of our knowledge, may be rapid because the analogous reaction involving methanol is rapid at low temperatures (Shannon et al. 2014). If we assume the rate coefficient of C + C2H5OH to be the same as that of C + CH3OH at 10 K, i.e., about 10−10 cm3 s−1, then we can make an order-of-magnitude estimation of the significance of the reaction C + C2H5OH. The ion-ethanol destruction routes are the major destruction mechanism in our reaction network. Because ethanol is polar, we estimate the ion-ethanol rate coefficient to be 10−8 cm3 s−1. The total fractional abundance of destructive ions is about
  . So if the fractional abundance of C is greater than 10−6, the C + C2H5OH reaction is the dominant destruction mechanism. From Figure 4 we can see that the C + C2H5OH reaction may be the major destruction mechanism before 105 yr because gas-phase C is sufficiently abundant before this time. However, after 105 yr, the ion-ethanol reactions remain the major destruction routes of ethanol because gas-phase C is severely depleted. Our crude estimation can be confirmed by MC simulations. We included the reaction C + C2H5OH
  HCO + C2H5 in the reaction network once again assuming the rate coefficient of C + C2H5OH to be the same as that of C + CH3OH at 10 K. We then ran models M43 and M432 again. The times of best fit are not altered by the new reaction. We found that at these times (9.1 × 10⁴ and 1.1 × 10⁵ yr for models M43 and M432, respectively), the abundance of ethanol drops to about
  in model M43, which is below the observed upper limit, while the abundance of ethanol in model M432 drops only slightly to 1.7 × 10⁻¹¹, which is still above the observed upper limit in B1-b. Nevertheless, the inclusion of the reaction between C and C2H5OH improves the agreement with observation.
Recently, Vastel et al. (2014) studied COMs in L1544. The fractional abundances of methanol and acetaldehyde were found to be ≈6 × 10⁻⁹ and 1 × 10⁻¹⁰, respectively. In addition, upper bounds were estimated for methoxy ( ), methyl formate (1.5 × 10⁻⁹), and dimethyl ether (2 × 10⁻¹⁰). The standard model of Balucani et al. (2015), which sets P = 0.01 and includes new gas-phase COM formation reactions, can reproduce the observed results in L1544 very well, while model B (Ruaud et al. 2015) can also reproduce observed results in L1544, except that the methanol abundance is about one order of magnitude lower than the observed value. At the times of best fit for B1-b, our models M432 and M43 can reproduce the methanol and acetaldehyde abundances in L1544. Moreover, the abundances of methoxy, methyl formate, and dimethyl ether in models M432 and M43 lie below the upper limits of abundances of these species in L1544.
It was also recently found that there is a strong correlation between the abundances of methyl formate and dimethyl ether (Jaber et al. 2014). Specifically, the abundance of methyl formate is almost linearly dependent on the abundance of dimethyl ether in various astronomical sources ranging over five orders of magnitude. It is argued that they may have the same precursor or one species may be the precursor of the other one. The standard model of Balucani et al. (2015) supports the second hypothesis if these two COMs are formed solely in the gas phase. Our models suggest that if they are formed on grain surfaces, then they have the same precursor. The radical CH2 is a precursor of dimethyl ether, while CH is the precursor of methyl formate in our models. Dimethyl ether is formed by the gradual hydrogenation of carbon atoms on top of CH3O, while methyl formate is formed by hydrogenation of carbon atoms to CH on top of CH3O followed by the reaction between CH and O. The radical CH is a precursor of CH2. Moreover, the abundances of radicals CH and CH2 are both dependent on gas-phase C, so the strong correlation between the abundances of methyl formate and dimethyl ether can be explained via the primal precursor C. It is also found (Jaber et al. 2014) that the correlation between the abundances of methyl formate and acetaldehyde is weak, which can be explained by the fact that the gas-phase synthesis of methyl formate requires different precursors from the gas-phase synthesis of acetaldehyde. Moreover, the formation mechanisms of acetaldehyde and methyl formate are not dependent on each other in the gas phase.
5. CONCLUSIONS
We performed UMMMC simulations with an efficient reactive desorption mechanism under physical conditions pertaining to cold cores, where COMs were recently found. The observed abundances of gas-phase COMs and the methoxy radical in the cold cores L1689b and L1544 can be reproduced by our simulations at temperatures as low as 10 K, while most observed gas-phase COM abundances in B1-b can also be reproduced without overestimating the methoxy abundance. Moreover, our models can also explain the strong correlation between the abundances of HCOOCH3 and CH3OCH3 and the weak correlation between the abundances of HCOOCH3 and CH3CHO.
The problem of COM formation in cold cores is linked to the problem of CO2 formation on cold dust grains in our models. COMs can be formed by the same type of chain reactions used to produce CO2 under cold conditions where diffusion of large species does not occur. The CO2 formation on cold dust grains by chain reactions was discussed in the Introduction. Moreover, the formation of surface methoxy on the topmost layer of an ice mantle also relies on this nondiffusive process. The success of our models further shows that nondiffusive chemical reactions should be included in surface reaction networks for better astrochemical modeling. Such processes include our chain-reaction mechanism and the Eley–Rideal and complex mechanisms advocated by Ruaud et al. (2015). Moreover, reactive desorption plays a key role in the nonthermal desorption of large molecules formed on dust grains. Successful experiments on this process are adding to our understanding (Dulieu et al. 2013; Minissale 2014). Experimental results from Minissale (2014) show that reactive desorption efficiency is dependent on surface coverage and varies significantly depending on each specific reaction. On the other hand, the reactive desorption efficiency of chain reactions has never been reported. Chain reactions are different from single reactions in that they are a combination of two reactions, which might enhance reactive desorption efficiency because the energy released by two reactions should be more than that by one single reaction. This effect could be important if the reactive desorption efficiency is low for a single reaction. More experimental work on reactive desorption should be undertaken to help explain COM formation in cold astronomical sources.
We thank the anonymous referee for constructive criticism. Q.C. is a research fellow of the One-Hundred-Talent project of the Chinese Academy of Sciences. E.H. acknowledges the support of the National Science Foundation for his astrochemistry program and support from the NASA Exobiology and Evolutionary Biology program through a subcontract from Rensselaer Polytechnic Institute.