Abstract
We present a model for the broadband radio-to-γ-ray spectral energy distribution of the compact radio source PKS 1718–649. Because of its young age (≃100 yr) and proximity (z = 0.014), PKS 1718–649 offers a unique opportunity to study the nuclear conditions and the jet/host galaxy feedback process at the time of the initial radio jet expansion. PKS 1718–649 is one of a handful of young radio jets with γ-ray emission that has been confirmed by the Fermi/LAT detector. We show that in PKS1718−649 this γ-ray emission can be successfully explained by Inverse Compton scattering of the UV photons, presumably from an accretion flow, off nonthermal electrons in the expanding radio lobes. The origin of the X-ray emission in PKS 1718–649 is more elusive. While Inverse Compton scattering of the IR photons emitted by a cold gas in the vicinity of the expanding radio lobes contributes significantly to the X-ray luminosity, the data require an additional source of X-rays, e.g., a weak X-ray corona or a radiatively inefficient accretion flow, as expected from a LINER-type nucleus, such as that of PKS 1718–649. We find that the jet in PKS 1718–649 has low power, Lj ≃ 2 × 1042 erg s−1, and expands in an environment with density n0 ≃ 3–20 cm−3. The inferred mass accretion rate and gas mass reservoir within 50–100 pc of the galactic center are consistent with estimates from the literature obtained by tracing molecular gas in the innermost region of the host galaxy with SINFONI and the Atacama Large Millimeter/submillimeter Array.
Original content from this work may be used under the terms of the Creative Commons Attribution 4.0 licence. Any further distribution of this work must maintain attribution to the author(s) and the title of the work, journal citation and DOI.
1. Introduction
PKS 1718–649 is a well-known radio source in NGC 6328, which is classified as a low-ionization nuclear emission-line region (LINER) galaxy, with photoionization as the main excitation mechanism of the emission lines (Filippenko 1985). It hosts a supermassive black hole with mass of the order of 108 M⊙ (Willett et al. 2010). The radio source has convex radio spectrum peaking in the GHz range (Tingay et al. 2015), and it belongs to the class of Gigahertz-Peaked Spectrum (GPS) sources (e.g., O’Dea 1998; O’Dea & Siemiginowska 2016; O’Dea & Saikia 2021). GPS sources with radio lobes that show symmetric morphology, as in the case of PKS 1718–649 (Tingay et al. 1997), are known as Compact Symmetric Objects (CSOs; e.g., Wilkinson et al. 1994; Orienti 2016; O’Dea & Saikia 2021). They appear to be smaller versions of classical doubles (i.e., Fanaroff-Riley type II, or FRII, radio galaxies; Fanaroff & Riley 1974). Multi-epoch radio monitoring of the expansion of the lobes of PKS 1718–649 implies that the radio source is very young, tage ≃ 100 yr, and small, with parsec-scale linear radio size (Polatidis & Conway 2003; Angioni et al. 2019). At its redshift of z = 0.0144 (Meyer et al. 2004), it is one of the nearest CSOs with a measured kinematic age known to date (An & Baan 2012).
PKS 1718–649 is currently one of the best-studied examples of a newly born radio source, observed and detected across the whole electromagnetic spectrum, from the radio to the γ-ray bands. The source has been observed spectroscopically in the mid-infrared (MIR) band with Spitzer, and shown signatures typical of both star-forming gas and active galactic nucleus (AGN) gas illumination (Willett et al. 2010). Filippenko (1985) demonstrated that the optical light of the host galaxy of PKS 1718–649 contains a contribution from a nonstellar power-law continuum that might be associated with weak nuclear emission. Siemiginowska et al. (2016) observed PKS 1718–649 with Chandra for the first time in the X-ray band and found that a point source is embedded in the extended X-ray emission, which was studied in detail by Beuchert et al. (2018). The detection of PKS 1718–649 in the γ-ray band was first reported by Migliori et al. (2016), then confirmed by the fourth Fermi/LAT Source catalog (4FGL; Abdollahi et al. 2020). In general, jetted radio sources with jets pointing away from the line of sight, and, in particular, sources that are symmetric in the plane of the sky, are not expected to be strong γ-ray emitters, as opposed to blazars, for which the emission is beamed due to the jet orientation. Indeed, non-blazar-type sources constitute only ∼2% of all AGNs in 4FGL. However, Stawarz et al. (2008) and Ostorero et al. (2010) have posited that CSO high-energy emission, in particular γ-ray emission, is expected due to Inverse Compton (IC) scattering of the ambient low-energy photons off the nonthermal electron populations within the expanding radio lobes inflated by the radio jet. While CSOs are indeed regularly detected in the X-ray band, even in short exposures (e.g., Siemiginowska 2009; Sobolewska et al. 2019a, and references therein), PKS 1718–649 remains one of only a handful of γ-ray emitters with a firm CSO classification to date (Müller et al. 2014, 2016; Migliori et al. 2016; Lister et al. 2020; Principe et al. 2020). 8
An alternative explanation of the compact radio nature of sources like PKS 1718–649 involves confinement by a dense interstellar medium (ISM), rather than a young age (e.g., van Breugel et al. 1984; O’Dea 1998; Dicken et al. 2012). However, in this paper, we choose to explore the youth scenario, motivated by the fact that PKS 1718–649 shows a rather low X-ray absorbing column density NH (Siemiginowska et al. 2016; Beuchert et al. 2018). Moreover, rough estimates suggest that 109–1010 M⊙ gas mass would be required to confine a radio source (O’Dea & Saikia 2021, and references therein), while the estimated gas mass reservoir in PKS 1718–649 is orders of magnitude lower, based on both NH and H2 measurements (Maccagni et al. 2016; O’Dea & Saikia 2021), and multi-epoch radio observations support the constant expansion of the radio lobes in PKS 1718–649 (Angioni et al. 2019).
We study the broadband radio-to-γ-ray emission of PKS 1718–649, and identify the physical processes that dominate the high-energy radiative output of a radio source in formation. We first collect multiwavelength observations of the source, to construct its broadband spectral energy distribution (SED; Section 2). We then model the observed SED in the framework of the expanding radio lobe model of Stawarz et al. (2008; Section 3). We present our results in Section 4, discuss our findings in Section 5, and conclude in Section 6. Throughout the paper, we use the most recent constraints on cosmological parameters to convert the observed fluxes into luminosities (Hinshaw et al. 2013): H0 = 69.3 km s−1 Mpc−1, Ωm = 0.287, implemented as WMAP9 in the astropy.cosmology package (Astropy Collaboration et al. 2013, 2018).
2. Multiwavelength Data of PKS 1718–649
In this section, we summarize the multiwavelength observations of PKS 1718–649. We show the observed SED of the source in Figure 1. We use the observational constraints in Section 4 to differentiate among various models of the broadband SED for PKS 1718–649.
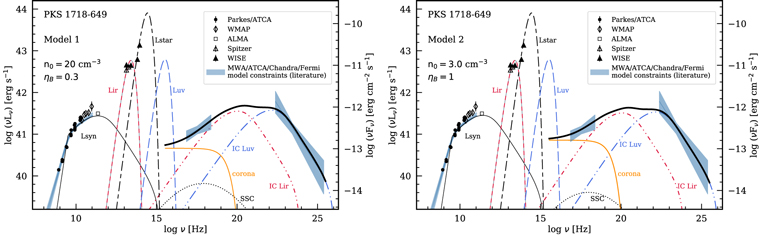
Figure 1. Observed broadband SED of PKS 1718−649 and theoretical models that are able to satisfactorily describe the data. The models are characterized with a moderate departure of the magnetic field from equipartition, ηB
= 0.3 (Model 1, left) and ηB
= 1.0 (Model 2, right). No formal fitting was performed. The model parameters are listed in Tables 1 and 2. The circles show radio data from Bolton & Butler (1975), Wright & Otrupcek (1990), Gregory et al. (1994), Mauch et al. (2003), Tingay et al. (2003), Ricci et al. (2006), Sadler et al. (2006), Healey et al. (2007), Massardi et al. (2008), Murphy et al. (2010), Ojha et al. (2010), and Maccagni et al. (2014). The diamonds show 9 yr WMAP catalog data from Gold et al. (2011). The square shows the ALMA measurement from Maccagni et al. (2018). The open triangles show Spitzer measurements from Willett et al. (2010). The filled triangles show WISE measurements from Cutri et al. (2013), with flux within 8″. The semi-transparent blue lines in the  range show MWA/ATCA radio model constraints (Tingay et al. 2015). The butterfly regions show Chandra and XMM-Newton model constraints on the intrinsic unabsorbed power-law emission (Beuchert et al. 2018) and Fermi/LAT 1σ model constraints (Principe et al. 2021). The broadband model components are as follows: self-absorbed synchrotron radiation (the solid thin black line); three blackbody components representing the IR (the short-dashed line), starlight (the long-short-dashed line), and accretion disk photon fields (the long-dashed line), and their corresponding IC components originating from a single radio lobe. The solid orange line illustrates the contribution of a low-luminosity X-ray nuclear emission (a weak X-ray corona or an ADAF-type emission). The thick black line represents the sum of the IC components and the additional X-ray emission.
Download figure:
Standard image High-resolution image2.1. Radio and Submillimeter
PKS 1718–649 has been thoroughly studied in the radio band, with the Parkes telescope (Bolton & Butler 1975; Gregory et al. 1994), the Very Large Array (Healey et al. 2007), the Australia Telescope Compact Array (ATCA; Wright & Otrupcek 1990; Veron-Cetty et al. 1995; Tingay et al. 1997, 2015; Tingay & de Kool 2003; Ricci et al. 2006; Sadler et al. 2006; Massardi et al. 2008; Murphy et al. 2010; Maccagni et al. 2014), and the Murchison Widefield Array (MWA; Tingay et al. 2015). The source has been detected with the Wilkinson Microwave Anisotropy Probe (WMAP; Bennett et al. 2003; Chen & Wright 2009; Giommi et al. 2009; Massardi et al. 2009; Wright et al. 2009; Gold et al. 2011), and a continuum flux measurement of 0.304 Jy at 230 GHz has been obtained with the Atacama Large Millimeter/submillimeter Array (ALMA; Maccagni et al. 2018). Representative radio to submillimeter flux measurements are collected in Figure 1.
The very long baseline interferometry (VLBI) observations at 4.8 GHz from ground and space revealed a compact double-sided structure with separation of ∼7 mas, corresponding to the projected linear size LS ∼ 2 pc at the redshift of the source, assuming the orientation of the lobes in the plane of the sky (the Southern Hemisphere VLBI Experiment; Tingay et al. 1997; the Highly Advanced Laboratory for Communications and Astronomy, or HALCA; Tingay et al. 2002; the Long Baseline Array; Angioni et al. 2019) and no apparent radio emission from the core (Tingay et al. 2002). Multi-epoch radio monitoring allowed the derivation of the hotspot advance velocity, vh /c ≲ 0.07 (Giroletti & Polatidis 2006), which implies that the kinematic age of the radio source in PKS 1718–649 is ∼100 yr; see also Angioni et al. (2019) who found vh /c = 0.13 ± 0.06 and an age of 70 ± 30 yr. Recent observations of PKS 1718–649 with ATCA and MWA allowed Tingay et al. (2015) to conclude that the radio data of the source are best modeled with an inhomogeneous free–free absorption model (Bicknell et al. 1997). The best fitting models derived by Tingay et al. (2015) for their three observing runs are plotted in Figure 1.
2.2. IR and Optical/UV
The source has been detected in the MIR band with the Wide-field Infrared Survey Explorer (WISE); we include in Figure 1 the four-band fluxes from the AllWISE source catalog published by Cutri et al. (2013). Willett et al. (2010) have reported on Spitzer observations of PKS 1718–649. A 5.2–38 μm MIR spectrum of the source has been obtained, and peakup fluxes of F(16μm) = 49 mJy and F(22μm) = 57 mJy have been measured with 15% measurement error (see Figure 1).
In addition, the authors detected a spectrally resolved [OIV] 25.8 μm line, which allowed them to estimate the mass of the black hole in PKS 1718–649, using the relation of Dasyra et al. (2008),  , which is consistent with the mass that they derived using the Lbulge–MBH relation of Bentz et al. (2009),
  . The MIR view of PKS 1718–649 revealed a moderately dusty environment and a low star formation rate in the host galaxy. The authors argue that a recent merger triggered the AGN activity, but also stripped the star-forming gas from the galaxy.
Veron-Cetty et al. (1995) have argued that the host of PKS 1718–649 resembles a high-luminosity elliptical galaxy with a faint outer spiral structure, which most likely originated in a merger involving a gas-rich spiral in the process of forming an elliptical. Optical spectroscopy of the host galaxy of PKS 1718–649, NGC 6328, is presented in Filippenko (1985). The subtraction of an elliptical galaxy template revealed a weak nonstellar power-law component, classified as a LINER AGN, which was found to contribute approximately half the strength of starlight near 3200 Å.
2.3. High Energies
PKS 1718–649 was observed for the first time in X-rays with Chandra in 2011 for 5 ks as part of our CSO X-ray survey (Siemiginowska et al. 2016). This initial observation revealed that the X-ray spectrum of the point source can be described by an absorbed power-law model with the photon index Γ = 1.6 ± 0.2 and the intrinsic equivalent hydrogen column density NH(z) = (0.8 ± 0.7) × 1021 cm−2, and that it is embedded in diffuse X-ray emission. PKS 1718–649 was then reobserved with Chandra in 2014 for a total time of 50 ks and with XMM-Newton in 2017 for 20 ks. A simultaneous fit to these multi-epoch data allowed Beuchert et al. (2018) to detect the presence of nonvariable emissions, due to photoionized and collisionally ionized plasmas; the former were explained as being due to nuclear irradiation, while the latter being due to supernova activity in the host galaxy. They constrained the photon index to  , finding variability on a timescale of years in the normalization of the power-law emission by a factor of up to ∼2.5, and in NH
(z) in the (3−7) × 1021 cm−2 range. Despite its modest NH
(z), the radio properties of PKS 1718–649, such as its LS and power at 5 GHz, place it on the low–radio power extension of a track occupied by CSOs with NH(z) > 1023 cm−2 in the radio size versus radio luminosity versus NH
(z) diagram (Sobolewska et al. 2019a). Based on this diagram, the X-ray-obscured CSOs appear to have smaller radio sizes, perhaps due to confinement by the environment, compared to the X-ray-unobscured CSOs with the same 5 GHz radio power. Alternatively, the X-ray-obscured CSOs can be seen as being more radio-loud compared to the X-ray-unobscured CSOs with the same linear radio size (see Sobolewska et al. 2019a for details). Thus, the X-ray absorption and radio properties of PKS 1718–649 make it a particularly interesting target for understanding the impact of the environment on the initial radio source evolution.
, finding variability on a timescale of years in the normalization of the power-law emission by a factor of up to ∼2.5, and in NH
(z) in the (3−7) × 1021 cm−2 range. Despite its modest NH
(z), the radio properties of PKS 1718–649, such as its LS and power at 5 GHz, place it on the low–radio power extension of a track occupied by CSOs with NH(z) > 1023 cm−2 in the radio size versus radio luminosity versus NH
(z) diagram (Sobolewska et al. 2019a). Based on this diagram, the X-ray-obscured CSOs appear to have smaller radio sizes, perhaps due to confinement by the environment, compared to the X-ray-unobscured CSOs with the same 5 GHz radio power. Alternatively, the X-ray-obscured CSOs can be seen as being more radio-loud compared to the X-ray-unobscured CSOs with the same linear radio size (see Sobolewska et al. 2019a for details). Thus, the X-ray absorption and radio properties of PKS 1718–649 make it a particularly interesting target for understanding the impact of the environment on the initial radio source evolution.
PKS 1718−649 was the first established CSO detected in the γ-ray band (Migliori et al. 2016). The reported Fermi/LAT test statistics were TS = 36 (σ ≳ 5) and TS = 18.5 (σ = 4.3) in the 0.1–100 GeV and 0.2–100 GeV bands, respectively. The source has been included in 4FGL (Abdollahi et al. 2020), and its γ-ray properties were revised by Principe et al. (2021), who found the 0.1–100 GeV γ-ray flux and slopes of FLAT = (5.3 ± 1.5) × 10−9 ph cm−2 s−1 and ΓLAT = 2.6 ± 0.14, respectively. No significant year-to-year or shorter γ-ray variability was detected from the source.
The confidence regions representing the intrinsic X-ray and γ-ray power-law emissions of the source are shown in Figure 1. We adopted the γ-ray power-law parameters as in Principe et al. (2021). In the X-ray band, we use the photon index and its error, as well as a mean X-ray power-law normalization and its mean error, estimated from the X-ray fits presented in Beuchert et al. (2018). This means that we model only the intrinsic power-law X-ray component arising near the nucleus, and not the extended X-ray emission.
3. Broadband Model
We model the broadband SED of PKS 1718–649 using the dynamical model of Stawarz et al. (2008) to investigate the origin of its high-energy (X-ray/γ-ray) emission. In this model, a set of equations originally considered by Begelman & Cioffi (1989) to describe classical doubles expanding in an ambient medium is employed to characterize the evolution of compact radio sources. In the framework of this model, a relativistic jet with kinetic power Lj propagates in the innermost parts of the host galaxy, with a constant velocity, vh
, into a uniform gaseous medium of constant density ρ = mp
n0. The momentum flux of the relativistic jet is balanced by the ram pressure of the ambient medium spread over some constant area Ah,  . Ultrarelativistic electrons with an initial energy distribution Q(γ) and Lorenz factors
  are injected from the terminal hotspots of the jet into the expanding lobes. The electron population of the lobes undergoes adiabatic and radiative cooling in the course of the source growth, from an initial size
  to LS. Transverse expansion of the source is governed by a scaling law lc
(t) ∝ t1/2, reproducing the initial, ballistic phase of the jet propagation (e.g., Kawakatu & Kino 2006). The lobe’s electrons IC scatter all the ambient low-energy photon populations, which include synchrotron photons, IR (torus) photons, galaxy starlight, and the UV radiation of an accretion flow. We approximate the IR, optical, and UV spectra as blackbody components for the purpose of evaluating the IC radiation of the lobes. The synchrotron radiation is described with a synchrotron self-absorbed model. We refer readers to Stawarz et al. (2008) and Ostorero et al. (2010) for further details of the model.
to LS. Transverse expansion of the source is governed by a scaling law lc
(t) ∝ t1/2, reproducing the initial, ballistic phase of the jet propagation (e.g., Kawakatu & Kino 2006). The lobe’s electrons IC scatter all the ambient low-energy photon populations, which include synchrotron photons, IR (torus) photons, galaxy starlight, and the UV radiation of an accretion flow. We approximate the IR, optical, and UV spectra as blackbody components for the purpose of evaluating the IC radiation of the lobes. The synchrotron radiation is described with a synchrotron self-absorbed model. We refer readers to Stawarz et al. (2008) and Ostorero et al. (2010) for further details of the model.
The model has many parameters. However, high-quality observations of PKS 1718–649 across the electromagnetic spectrum have allowed us to put constraints on the majority of them (Table 1). We use the LS of the radio source, LS = 2 pc, and the hotspot separation velocity, vh = 0.07c, reported by Giroletti & Polatidis (2009; see also Angioni et al. 2019 for a more recent measurement). We note that our model assumes a source with perfectly symmetric morphology. Therefore, the model describes the evolution of one of the two lobes only, with the core–hotspot distance taken as  , and the separation velocity of the hotspot from the core taken as
  . The luminosity of the modeled lobe is then multiplied by a factor of 2 to be compared with the luminosity of the observed lobes.
Table 1. Fixed Parameters of the Broadband SED Model
| Description | Symbol | Value | Unit | References a |
|---|---|---|---|---|
| Geometry of the Radio Source | ||||
| Linear size | LS | 2 | pc | (1) b |
| Hotspot separation velocity | vh | 0.07 | c | (1) b |
| Characteristic Frequencies and Luminosities | ||||
| Radio turnover freq. | νpeak | 3.25 | GHz | (2) c |
| IR band ref. freq. | νIR | 1.87 | 1013 Hz | ... |
| ν Lν @ νIR | LIR | 8.05 | 1042 erg s−1 | (3) |
| Visible band ref. freq. | νstar | 2.0 | 1014 Hz | ... |
| ν Lν @ νstar | Lstar | 1.1 | 1044 erg s−1 | (4) |
| UV band ref. freq. | νUV | 2.45 | 1015 Hz | ... |
| ν Lν @ νUV | LUV | 8.5 | 1042 erg s−1 | (5) |
Notes.
a References: (1) Giroletti & Polatidis (2009); (2) Tingay et al. (2015); (3) Willett et al. (2010); and (4) Filippenko (1985). b We use pc and
  for the core–hotspot LS and the separation velocity (see Ostorero et al. 2010).
c
The average of the νpeak values reported in Tingay et al. (2015).
for the core–hotspot LS and the separation velocity (see Ostorero et al. 2010).
c
The average of the νpeak values reported in Tingay et al. (2015).Download table as: ASCIITypeset image
We fix the radio turnover frequency at the average of the values derived by Tingay et al. (2015) from ATCA observations of the source. We normalize the IR blackbody component using the Spitzer flux at 16 μm (corresponding to the frequency νIR). Given the dominance of starlight at optical frequencies in PKS 1718–649, and the related uncertainties in the galaxy–AGN decomposition performed by Filippenko (1985), for simplicity we fix the V-band and UV luminosities at νstar and νUV
(Lstar, LUV; see Table 1) at values that result in both blackbody components having comparable fluxes at 3200 Å, corresponding to mAB ∼ 18, where  , and fν
is in erg s−1 cm−2 Hz. We note that the blackbody component describing the visible light in our model matches rather well the W1 and W2 WISE measurements of Cutri et al. (2013).
, and fν
is in erg s−1 cm−2 Hz. We note that the blackbody component describing the visible light in our model matches rather well the W1 and W2 WISE measurements of Cutri et al. (2013).
The model assumes that the lobe electrons provide the bulk of the lobe pressure. The electron energy density is Ue
= ηE
p, with ηE
≲ 3. The magnetic field is given by  , with ηB
= UB
/p < 3, where UB
denotes the magnetic field energy density. In this paper, we follow Stawarz et al. (2008) and choose ηE
= 3, and we assume that the lobe electrons are in rough equipartition with the magnetic field and protons (e.g., Orienti & Dallacasa 2008, and references therein). We consider ηB
= 0.3, which implies that the ratio of the model magnetic field energy density to the equipartition magnetic field energy density
, with ηB
= UB
/p < 3, where UB
denotes the magnetic field energy density. In this paper, we follow Stawarz et al. (2008) and choose ηE
= 3, and we assume that the lobe electrons are in rough equipartition with the magnetic field and protons (e.g., Orienti & Dallacasa 2008, and references therein). We consider ηB
= 0.3, which implies that the ratio of the model magnetic field energy density to the equipartition magnetic field energy density  , or B/Beq ∼ 0.3; ηB
= 1 (
, or B/Beq ∼ 0.3; ηB
= 1 ( , or B/Beq ∼ 0.6); and ηB
= 3 (
, or B/Beq ∼ 0.6); and ηB
= 3 ( , or B = Beq).
As discussed in Stawarz et al. (2008), the likely shapes of the initial electron distribution injected into the radio lobes include a power-law function, Q(γ) ∝ γ−s
, or a broken power-law function, with the slope of the distribution changing from s1 to s2 at a given Lorentz factor γb. We test both possibilities. We choose  and
and  .
.
We note that while Tingay et al. (2015) have demonstrated that a proper description of the low-energy radio SED should include inhomogeneous free–free absorption processes, we use the standard synchrotron self-absorbed spectrum. This choice does not affect the final high-energy shape of the γ-ray model SED, because this regime is dominated by IC scattering off high-energy electrons.
Given the above assumptions and observational constraints, we are left with only a handful of free model parameters: (i) the density of the ambient medium in which the lobes expand, n0; (ii) the jet kinetic power, Lj; and (iii) the parameters of the electron energy distribution, Q(γ): the slope s, if Q(γ) is described by a single power-law function, or the slopes s1 and s2, of the lower- and higher-energy parts, and the Lorentz factor corresponding to the break, γb, if Q(γ) is described by a broken power-law function.
4. Results
The expanding radio lobe model can successfully reproduce the bulk of the high-energy emission of PKS 1718–649. The IC scattering of the UV photons (presumably from an inner accretion flow) can account for the Fermi/LAT observational constraints, while the IC scattering of the IR photons detected from the direction of PKS 1718–649, presumably due to the emission of a dusty environment in the galactic center, contributes to the source’s X-ray emission. We found that the contributions to the high-energy emission of PKS 1718–649 coming from the IC scattering of the optical (galaxy) and synchrotron photons are negligible. The variable parameters of our final models are collected in Table 2, and the model SEDs are plotted in Figure 1. Below we describe in detail our modeling rationale and results.
Table 2. Variable Parameters of the Broadband SED Model
| Description | Symbol | Model 1 | Model 2 | Unit | References a |
|---|---|---|---|---|---|
| Injected Electron Population Q(γ) and Jet Kinetic Power | |||||
| Low-energy slope | s1 | 1.9 | 1.85 | (⋆) b | |
| High-energy slope | s2 | 3.2 | 3.2 | (⋆) | |
| Lorentz factor (min) |

| 1 | 1 | (1) | |
| Lorentz factor (break) | γb | 3 | 3 | mp /me | (⋆) |
| Lorentz factor (max) |

| 100 | 100 | mp /me | (2) |
| Jet kinetic power | Lj | 2.2 | 1.7 | 1042 erg s−1 | (⋆) |
| Environment | |||||
| ISM density | n0 | 20 | 3 | cm−3 | (⋆) |
| Electrons | ηE | 3 | 3 | (1) c | |
| Magnetic field | ηB | 0.3 | 1 | (1, ⋆) c | |
| Additional Power-law X-Ray Emission | |||||
| Photon index | Γ | 2.0 | 2.0 | (⋆) | |
| Luminosity (2-10 keV) | L2−10 keV | 6.6 | 8.6 | 1040 erg s−1 | (⋆) |
Notes.
a References: (⋆) this work; (1) Stawarz et al. (2008); and (2) Ostorero et al. (2010). b The radio spectral slope α ≃ 0.7 (Tingay et al. 2015) suggests s1 = 2α + 1 ≃ 2.4 for the evolved electron distribution. c The electron and magnetic field energy densities are parameterized as UE = ηE p and UB = ηB p, where p stands for the expanding cocoon’s internal pressure.Download table as: ASCIITypeset image
Models with Q(γ) in the form of a single power-law function were found to substantially overestimate the γ-ray emission, and they failed to reproduce the observed γ-ray photon index. Thus, we concluded that the Fermi/LAT constraints require the energy distribution of the electrons injected into the lobes of this source to have a broken power-law form.
Beuchert et al. (2018) measured the intrinsic equivalent hydrogen absorbing column density from the direction of PKS 1718–649, and found that it varies in the NH ∼ (3–7) × 1021 cm−2 range. The radii of the regions used in that work to extract the Chandra (14″) and XMM-Newton (40″) energy spectra correspond to ∼4 and ∼12 kpc, respectively, at the redshift of the source. Thus, the location of the intrinsic matter obscuring the nuclear X-rays cannot be determined on a parsec scale in PKS 1718–649, based on the modeling of Beuchert et al. (2018). We checked that with an extraction region size of 15 (∼440 pc at the redshift of the source), approaching the spatial resolution of Chandra, the Chandra data of the source (ObsIDs 16070 and 16623) are still consistent with intrinsic NH ∼ (2−3) × 1021 cm−2. An intrinsic column density of the order of 3 × 1021 cm−2 implies a particle density within 440 kpc of n0 ∼ 2.4 cm−3.
However, we found that models with n0 of this order underestimate the ALMA and WMAP measurements for ηB = 0.3. In particular, the continuum flux at 290 GHz measured by Maccagni et al. (2018) is underestimated by ≳ 30% (see Model A1 in the Appendix, Figure 2, and Table 3). A density an order of magnitude higher, n0 = 20 cm−2, is required to fully account for the observed radio-to-submillimeter band in the broadband SED model of PKS 1718–649 (Model 1, Figure 1). This value of n0 implies that the X-ray NH measured by Beuchert et al. (2018) is distributed uniformly within the central 50–100 pc.
Alternatively, we found that for n0 = 3 cm−3, a good match of the model with the data can be obtained by setting ηB = 1 (Model 2, Figure 1), which brings the physical conditions closer to equipartition than in the case with ηB = 0.3. In the equipartition case, ηB = 3, the soft γ-ray band becomes underestimated by the model, unless the density is set to n0 ≲ 1 cm−3 (Model A2 in the Appendix).
The γ-ray spectrum (both the photon index and normalization) of PKS 1718–649 can be accounted for satisfactorily by Models 1 and 2, with s1 ∼ 1.9, s2 = 3.2, γb = 3 mp /me , and jet kinetic power Lj = (1.7–2.2) × 1042 erg s−1 (Table 2), and the remaining model parameters fixed at the values derived from observations or assumed as described in Section 3. However, these models returned an X-ray photon index that was significantly harder than the observed one, and underestimated the observed X-ray emission. Given that PKS 1718–649 contains a LINER-type AGN, it is possible that a low-luminosity nuclear emission contributes to the X-ray emission of the source. We modeled this with a cutoff power-law function with Γ = 2.0, Ecutoff = 100 keV, and 2–10 keV luminosity of (6.6–8.6) × 1040 erg s−1. We found that the sum of such a power-law component and the IC scattering of the IR photons in the radio lobes was able to fully explain the observed X-ray emission of PKS 1718–649.
5. Discussion
We have explored the applicability of the expanding radio lobe model (Stawarz et al. 2008) to the broadband radio-to-γ-ray SED of one of the youngest, nearest, and most compact symmetric radio sources known to date, PKS 1718–649. Our modeling has allowed us to uncover possible mechanisms responsible for the high-energy emission of the source and to constrain interesting physical parameters of the source, such as the spectrum of the electrons injected from the hotspots into the lobes and the jet kinetic power.
In general, our results suggest the moderate departure, within one order of magnitude, of the magnetic field strength in the radio lobes of PKS 1718–649 from equipartition. We note that such a departure from equipartition is supported by observations of other radio sources (e.g., Ineson et al. 2017; Croston et al. 2018; see also, however, Orienti & Dallacasa 2008).
The equally good matches of Models 1 and 2 with the data indicate that there exists a degeneracy in the expanding radio lobe model, between the density of the ambient medium and the degree to which the magnetic field in the lobes deviates from equipartition, which cannot be broken with the current data. However, the remaining variable model parameters are either virtually identical in Models 1 and 2 (the parameters of the injected electron population and the photon index of the additional X-ray component) or within 30% of each other (the jet power and the 2–10 keV luminosity of the additional X-ray component), as detailed in Table 2 and discussed in Sections 5.1–5.5 below.
In addition, we noted that the strict equipartition case requires that n0 ≲ 1 (Model A2 in the Appendix), which is in conflict with the X-ray measurements (Beuchert et al. 2018; this work), unless the density distribution in the host of PKS 1718–649 follows a profile such that n0 ≲ 1 on the few parsec scale, comparable with the separation between the radio lobes, increasing to n0 ≳ 3 cm−3 on the few hundred kiloparsec scale, corresponding to the 15 extraction region resolved with Chandra.
We show in the Appendix that models with high ηB and high density (Models A3 and A4) have difficulties in accounting for the high-energy emission in PKS 1718–649: the X-ray band becomes dominated by an additional X-ray component in these models, and the soft γ-ray emission is underestimated (given the Fermi/LAT 1σ confidence level model constraints of Principe et al. 2021).
5.1. Origin of the γ-Ray Emission
We found that the properties of the γ-ray emission observed from PKS 1718–649 put strong constraints on the electron distribution Q(γ) injected into the radio lobes. It is required that this distribution has a broken power-law shape, and that it is characterized by a break energy γb = 3 mp /me and a high-energy slope s2 = 3.2. The radio and submillimeter data imply that the lower-energy segment (γ < γb) of Q(γ) has index s1 ∼ 1.9. The lobes expand in a medium with density n0 in the 3–20 cm−3 range for ηB in the 1–0.3 range, i.e., the higher the density, the lower the ηB parameter.
The electron population of the radio lobes evolves during the expansion of the lobes, due to the adiabatic and radiative cooling effects (Stawarz et al. 2008). In the case of a broken power-law injection, the electron spectral continuum steepens at  when compared to the injected one, where Lj,45 ≡ Lj/1045 erg s−1. In our model solutions for PKS 1718 –649, γcr corresponds to ∼.7 mp
/ me
(∼8.8 mp
/me
) or ∼2.6 γb (∼2.9 γb) for ηB
= 0.3 (ηB
= 1.0). The s1 index is close to the canonical spectrum generated by diffusive (first-order Fermi) shock acceleration, and comparable with the low-energy slopes derived by Ostorero et al. (2010) for a sample of eleven GPS/CSO galaxies, known as X-ray emitters, up to 2008. Interestingly, ambient density n0 = 20 cm−3 in Model 1, with ηB
= 0.3, is of the same order as the mean density found by Mukherjee et al. (2016, 2017), who fitted the probability density function of the simulated density of an ISM evolving in the presence of an expanding jet with jet head ≲1 kpc using a modified lognormal function proposed by Hopkins (2013; see also Zovaro et al. 2019).
when compared to the injected one, where Lj,45 ≡ Lj/1045 erg s−1. In our model solutions for PKS 1718 –649, γcr corresponds to ∼.7 mp
/ me
(∼8.8 mp
/me
) or ∼2.6 γb (∼2.9 γb) for ηB
= 0.3 (ηB
= 1.0). The s1 index is close to the canonical spectrum generated by diffusive (first-order Fermi) shock acceleration, and comparable with the low-energy slopes derived by Ostorero et al. (2010) for a sample of eleven GPS/CSO galaxies, known as X-ray emitters, up to 2008. Interestingly, ambient density n0 = 20 cm−3 in Model 1, with ηB
= 0.3, is of the same order as the mean density found by Mukherjee et al. (2016, 2017), who fitted the probability density function of the simulated density of an ISM evolving in the presence of an expanding jet with jet head ≲1 kpc using a modified lognormal function proposed by Hopkins (2013; see also Zovaro et al. 2019).
5.2. Origin of the X-Ray Emission
We have shown that while the γ-ray emission in PKS 1718–649 is consistent with IC scattering of the UV photons from an accretion flow off energetic electrons in the radio lobes, the origin of the X-ray emission is more elusive. We have shown that the IC scattering of the IR ambient photons, likely due to the emission of the dusty environment of PKS 1718–649 resolved with VLT and ALMA (Maccagni et al. 2016, 2018), contributes to the X-ray emission of the source. However, its photon index is harder than that derived from the observations. As a result, the model was found to underestimate the soft X-ray emission of the source. We proposed that an additional component was required to fully explain the observed intrinsic X-ray emission, and we modeled it with a power-law function with photon index Γ = 2.0, 2–10 keV luminosity L2−10 keV = (6.6–8.6) × 1040 erg s−1, and a high-energy cutoff at 100 keV (even though the current data cannot confirm or reject the presence of such a cutoff). Interestingly, these parameters are typical for LINER-type AGNs studied in X-rays (e.g., González-Martín et al. 2009). This additional component may be associated with a weak X-ray corona or a radiatively inefficient nuclear emission (e.g., an advection-dominated accretion flow (ADAF; Ichimaru 1977; Narayan & Yi 1994, 1995a, 1995b; Abramowicz et al. 1995; Chen et al. 1995). The sum of the IC X-ray emission from the radio lobes and low-luminosity nucleus agrees within the errorbars with the X-ray constraints derived by Beuchert et al. (2018), using a single power-law function and interpreted as being due to an X-ray corona (see Figure 1).
However, we stress that the relative contributions of a low-luminosity nucleus and IC scattering of the IR photons in the radio lobes are difficult to constrain with the current data. It is possible that only a fraction of the IR emission measured with Spitzer intersects the expanding radio lobes, given the small size of the radio source in PKS 1718–649 (LS = 2 pc) and the complex structures in the innermost 15 kpc of the host galaxy of PKS 1718–649. Indeed, resolved measurements with ALMA have revealed a CO gas distributed in a complex warped disk, forming a circumnuclear disk at r ≲ 700 pc, and molecular clouds falling onto the central supermassive black hole at r ≲ 75 pc (Maccagni et al. 2018). We estimate that if only half of the IR emission becomes IC scattered in the radio lobes in Model 1 (ηB = 0.3), then our modeling will require a nuclear power-law X-ray component, with L2−10 keV = 5.5 × 1040 erg s−1, which is still well within the range of the 2–10 keV luminosities reported in the literature for LINER-type galaxies.
We note that our broadband model predicts a spectral hardening above 10 keV, where the IC component from the radio lobes dominates over the nuclear emission. This could be tested with observations in the hard X-ray band. In addition, the high-energy SED of PKS 1718–649 peaks in the MeV range, making PKS 1718–649 an ideal target for future MeV-band missions, such as, e.g., AMEGO-X (Fleischhack & Amego-X Team 2022).
5.3. Jet Kinetic Power and Feedback
The jet kinetic power resulting from Models 1 and 2, Lj = (1.7–2.2) × 1042 erg s−1, is in excellent agreement with the upper limit reported by Maccagni et al. (2014; Lj < 2 × 1043 erg s−1). This jet power is lower than the values found for powerful flat-spectrum radio quasars and BL Lacertae sources (e.g., Sambruna et al. 2006; Ghisellini et al. 2009), as well as for FRI/FRII radio galaxies (e.g., Laing & Briddle 2002; Croston et al. 2008, 2009, 2018, and references therein; see also Xu et al. 2009).
The implied magnetic field intensity within the lobes is ∼4.3 mG for ηB = 0.3 and ∼4.0 mG for ηB = 1, in agreement with the expectations for compact young lobes.
We stress that the jet powers resulting from our preferred models (Figure 1, Table 2) and models A2–A4 in the Appendix (Table 3) vary at most by a factor of ∼3, indicating that our estimate of Lj is robust.
Mukherjee et al. (2016, 2017) have shown with numerical simulations that the feedback of low-power jets is significant, because they are confined by the ISM for a longer time than their more powerful counterparts. This affects the ISM density distribution and inhibits star formation. Indeed, Willett et al. (2010) have reported a rather weak star formation rate in PKS 1718–649, 0.8–1.9 M⊙ yr−1, estimated by means of polycyclic aromatic hydrocarbon (PAH) signatures measured with Spitzer. Interestingly, Mukherjee et al. (2017) have argued that jets with power ≲ 1043 erg s−1, such as those of PKS 1718–649, may be too weak to escape the ISM confinement, and too weakly pressurized to prevent an infall of gas back into the initially created central cavity.
5.4. Mass Accretion Rate and Gas Mass Reservoir
We used the relation of Allen et al. (2006) to translate the Lj
resulting from Models 1 and 2 into the Bondi accretion power, Lbondi = (1.9–2.2) × 1043 erg s−1. Assuming an accretion efficiency = 0.1, the Bondi accretion rate is
 .
.
Model 2, with ηB
= 1 and n0 = 3 cm−3, of the order of that we found by modeling the innermost 15 X-ray region around PKS 1718–649, allows for the estimation of a gas mass reservoir within ≃ 440 pc at 1.5 × 10⁷
M⊙.
However, if the intrinsic NH
measured in the X-ray band by Beuchert et al. (2018) is indeed distributed uniformly over a surface area with radius r = 50–100 pc, as suggested by Model 1, with ηB
= 0.3, which favors an ambient density of n0 = 20 cm−3, then the gas mass reservoir within this radius is of the order of (0.3−1.3) × 106
M⊙, providing an ample supply to feed the central black hole. The mass accretion rate and the gas mass reservoir at such levels are compatible with those reported by Maccagni et al. (2018), who inferred the presence of cold clouds falling onto the central black hole within ≲ 75 pc, by studying tracers such as HI, H2, and 12CO (2 − 1) with ALMA and SINFONI (Maccagni et al. 2016, 2018). They found an accretion rate 1.3 × 10⁻³
M⊙ yr M⊙ yr−1, and a mass of the absorbing molecular clouds in the 3 × 10²–5 × 10⁵
M⊙ range.
M⊙ yr−1, and a mass of the absorbing molecular clouds in the 3 × 10²–5 × 10⁵
M⊙ range.
The mass accretion rate that we found, expressed in terms of the Eddington accretion rate, is  , assuming the mean of the two black hole mass estimates in Willett et al. (2010). On the other hand, the UV luminosity in our model, LUV ≃ 8.5 × 1042 erg s−1, implies an accretion rate of the order of
 . Both estimates are consistent with the LINER classification of the active nucleus in PKS 1718–649.
5.5. Transverse Expansion
The transverse size and recent-day transverse expansion velocity resulting from Models 1 and 2 are lc = (2.4–2.6) pc and vc
∼ 0.13 c, respectively. They are larger than their counterpart parameters along the core–hotspot direction (i.e., the core–hotspot distance,  , and the core–hotspot separation velocity,
  ). Thus, the models suggest that the lobes of PKS 1718–649, and other extremely compact radio sources, may be more elongated in the transverse direction than in the direction of the hotspots. Some evidence for this can be seen at least for the northern lobe on the 8.4 GHz VLBI radio maps recently presented by Angioni et al. (2019). Since lc
∝ LS1/2 and vc
∝ LS−1/2, the models predict that eventually the transverse expansion will slow down: in PKS 1718–649, vc
will be comparable to
). Thus, the models suggest that the lobes of PKS 1718–649, and other extremely compact radio sources, may be more elongated in the transverse direction than in the direction of the hotspots. Some evidence for this can be seen at least for the northern lobe on the 8.4 GHz VLBI radio maps recently presented by Angioni et al. (2019). Since lc
∝ LS1/2 and vc
∝ LS−1/2, the models predict that eventually the transverse expansion will slow down: in PKS 1718–649, vc
will be comparable to  , once
  reaches ∼ 10–15 pc, and the source will evolve to a state in which
  .
.
6. Conclusions
We have demonstrated that the expanding radio lobe model by Stawarz et al. (2008) can explain the high-energy emission in PKS 1718–649—the first and one of only a few symmetric young radio sources that have been detected to date in the γ-ray band with Fermi/LAT—as being due to IC scattering of the IR and UV emission off energetic electrons injected into the lobes from the hotspots, assuming a rough equipartition between the magnetic field and particles, and an additional contribution from a weak X-ray corona or an ADAF at the luminosity level expected in LINER-type AGNs. Our results suggest that PKS 1718–649 is destined to evolve into a low-power FRI-type radio galaxy. Low-power jets, like those in PKS 1718–649, are important for the jet/galaxy feedback process, because they struggle to propagate through the ISM on their way out from the host galaxy, and interact with the gas in the host galaxies for a longer time than their more powerful counterparts.
Based on our modeling of PKS 1718–649, we have been able to estimate the magnetic field intensity within the lobes, the shape of the distribution of the evolved electrons within the lobes, the properties of the transverse lobe expansion, the mass accretion rate, and the gas mass reservoir available to feed the black hole.
The expanding radio lobe model has recently been considered by Lister et al. (2020), in a discussion of the high-energy SED of another γ-ray detected CSO, TXS 0128 + 554. The authors reported that the observed Fermi/LAT flux of TXS 0128 + 554 was three orders of magnitude higher than the predicted γ-ray emission from the lobes, and concluded that it most likely originates in the inner jet/core region, rather than in the lobes. Furthermore, Sobolewska et al. (2019b) concluded that the expanding radio lobe model for a set of model parameters considered by Ostorero et al. (2010) for OQ+208, a CSO embedded in a cloud of matter with an intrinsic absorbing column density of the order of 1024 cm−2 (but with no γ-ray detection to date), appears to overestimate the level of X-ray emission measured from a joint modeling of Chandra, XMM-Newton, and NuSTAR data. Thus, it remains to be determined if the model of expanding radio lobes provides a universal explanation for the X-ray and γ-ray emission of CSOs and other GPS galaxies, or whether these sources form a heterogeneous population with respect to the origin of their high-energy emission.
M.S. and A.S. were supported by NASA contract NAS8-03060 (Chandra X-ray Center). M.S. acknowledges partial support from the NASA contracts 80NSSC18K1609 and 80NSSC19K1311. Partial support for this work was provided by the NASA grants GO1-12145X and GO4-15099X. L.O. acknowledges partial support from the INFN grant InDark and the Italian Ministry of Education, University and Research (MIUR), under the Departments of Excellence grant L.232/2016. Ł.S. was supported by Polish National Science Center grant 2016/22/E/ST9/00061. This research has made use of NASA’s Astrophysics Data System Bibliographic Services. The authors thank Rafał Moderski, for making his numerical code for expanding radio lobes available for this study, Mitchell Begelman, for multiple discussions on young radio sources, and the anonymous reviewer for insightful comments on the manuscript.
Appendix
Supplementary model solutions are presented in Figure 2, and supplementary model parameters are listed in Table 3 (see the discussion in Section 5).
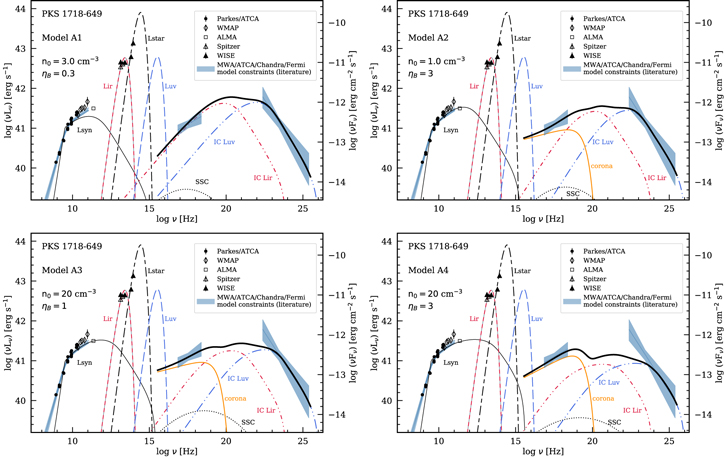
Figure 2. The same as Figure 1, but for Model A1, with n0 = 3.0 cm−3 and ηB = 0.3; Model A2, with n0 = 1.0 cm−3 and ηB = 3; Model A3, with n0 = 20 cm−3 and ηB = 1; and Model A4, with n0 = 20 cm−3 and ηB = 3. See Tables 1 and 3 for the model parameters.
Download figure:
Standard image High-resolution imageTable 3. Variable Parameters of the Supplementary SED Models
| Description | Symbol | Model A1 | Model A2 | Model A3 | Model A4 | Unit | References a |
|---|---|---|---|---|---|---|---|
| Injected Electron Population Q(γ) and Jet Kinetic Power | |||||||
| Low-energy slope | s1 | 2.1 | 1.8 | 1.9 | 1.9 | (⋆) b | |
| High-energy slope | s2 | 3.3 | 3.2 | 3.2 | 3.1 | (⋆) | |
| Lorentz factor (min) |

| 1 | 1 | 1 | 1 | (1) | |
| Lorentz factor (break) | γb | 3 | 3.5 | 6 | 12 | mp /me | (⋆) |
| Lorentz factor (max) |

| 100 | 100 | 100 | 100 | mp /me | (2) |
| Jet kinetic power | Lj | 5.5 | 1.2 | 1.2 | 0.7 | 1042 erg s−1 | (⋆) |
| Environment | |||||||
| ISM density | n0 | 3 | 1 | 20 | 20 | cm−3 | (⋆) |
| Electrons | ηE | 3 | 3 | 3 | 3 | (1)c | |
| Magnetic field | ηB | 0.3 | 3 | 1 | 3 | (1, ⋆)c | |
| Additional Power-law X-Ray Emission | |||||||
| Photon index | Γ | not required | 1.9 | 1.9 | 1.8 | (⋆) | |
| Luminosity (2–10 keV) | L2–10 keV | n/a | 1.3 | 1.3 | 1.7 | 1041 erg s−1 | (⋆) |
Notes.
a References: (⋆) this work; (1) Stawarz et al. (2008); and (2) Ostorero et al. (2010). b The radio spectral slope α ≃ 0.7 (Tingay et al. 2015) suggests s1 = 2α + 1 ≃ 2.4 for the evolved electron distribution. c The electron and magnetic field energy densities are parameterized as UE = ηE p and UB = ηB p, where p stands for the expanding cocoon’s internal pressure.Download table as: ASCIITypeset image
Footnotes
- 8