Abstract
We report the timing results with Insight-HXMT observations of X-ray binary IGR J19294+1816 during its 2019 type I outburst at the decline phase shortly following its peak. We analyze the light curves and power density spectrum of the 2019 observations and reveal a peak at νNS ∼ 80.2 mHz, corresponding to X-ray pulsations from the neutron star. In addition, a significant quasi-periodic oscillation (QPO) feature is observed at νQPO ∼ 30.2 mHz from 10 to 50 keV, with the rms amplitude increasing with energy. Furthermore, we detect two QPOs at frequencies of ∼51.1 and 113.7 mHz (corresponding to sidebands near νNS ± νQPO) in the range 25–50 keV, exhibiting an rms amplitude of around 12%. Wavelet analysis also shows multiple QPOs at the frequencies of ∼30 mHz, 50 and 110 mHz, which have transient behaviors. The centroid frequencies of ∼30 mHz remain nearly constant for different luminosities. Our research identifies IGR J19294+1816 as the second strong magnetic field pulsar with significant sideband signals around the spin frequency. We explore various physical origins that could explain the presence of multiple QPOs.
Original content from this work may be used under the terms of the Creative Commons Attribution 4.0 licence. Any further distribution of this work must maintain attribution to the author(s) and the title of the work, journal citation and DOI.
1. Introduction
X-ray pulsars in high-mass X-ray binaries (HMXBs) are composed of a highly magnetized rotating neutron star and a high-mass companion star. The accreted matter transfers on to the neutron star unaffected by the highly magnetic field lines until the Alfvén radius, where the pressure of the magnetic field balances the ram pressure of the infalling plasma. With magnetic pressure dominating the accreting gas, the flow of infalling gas is channeled along magnetic field lines to the surface of a neutron star and forms “hot spots” near two magnetic poles (V. Shvartsman 1971). A majority of the HMXBs are known to be Be/X-ray binaries (BeXBs), in which young optical companions are spectral type O or B (L. Maraschi et al. 1976). The X-ray emission in such systems during outbursts is produced when the compact object accretes from a quasi-Keplerian disk around the equator of the rapidly rotating Be star. Such a mechanism explains normal (type I) outbursts with X-ray luminosity LX ∼ 1035–1037 erg s−1. Occasionally, they can produce a giant outburst (type II), which could occur at any orbital phase and reach a peak luminosity higher than 1038 erg s−1 (P. Reig 2011).
Timing and spectral properties of radiation generated by accreting compact objects carry information about physical and geometrical properties of these HMXBs. Over the following decades, many observational properties of X-ray pulsars were established, including accreting torque evolution and reversals (S. Mereghetti et al. 2015; C. Malacaria et al. 2020), measurements of cyclotron resonance scattering features (CRSFs) in their X-ray spectra (R. Staubert et al. 2019), and detections of quasi-periodic oscillation (QPOs) from power spectra (H. Manikantan et al. 2024). Detailed analysis of the emission in different luminosity states allows us to investigate physical processes occurring near the neutron star and at the boundary between the accretion disk and pulsar magnetosphere.
QPOs have been detected in approximately a dozen out of ∼100 known accreting X-ray pulsars. These QPOs are primarily concentrated in the low-frequency range from ∼10 mHz to ∼1 Hz, which are called mHz QPOs (M. James et al. 2010; J. Devasia et al. 2011). Substantial observational data on mHz QPOs have been accumulated; however, we have no common understandings of the physics origin. The QPOs at 0.2–0.5 Hz in RX J0440.9+4431 occur during the pulse profile’s right wing and likely originate from hard X-ray flares (P. Li et al. 2024; C. Malacaria et al. 2024). Two mHz QPOs in Her X-1, with distinct luminosity dependencies, likely arise from the beat frequency near the Alfvén and corotation radii and magnetic disk precession, respectively (W. Yang & W. Wang 2025). The multiple QPOs in 4U 0115+63 might be caused by instabilities in swirling flows, which are influenced by factors such as viscosity and magnetic fields (Y. Ding et al. 2021). Additionally, QPOs observed in sources such as EXO 2030+375 (L. Angelini et al. 1989), 4U 1901+03 (M. James et al. 2011), V0332+53 (J. L. Qu et al. 2005), and SAX J2103.5+4545 (S. Inam et al. 2004) would be associated with the rotation of the inner accretion disk. Besides, several key issues remain unresolved, such as the nature of frequency variations, the mechanisms behind the appearance and disappearance of QPOs, and their relationship with less coherent variability. Therefore, further investigation of mHz QPO properties will significantly contribute to advancing theoretical research.
IGR J19294+1816 was first detected during an outburst in 2009 by the IBIS/ISGRI instrument aboard the INTEGRAL Gamma-ray Observatory (M. Turler et al. 1997). This new BeXB at a distance of d = 11 ± 1 kpc was determined by spectral analysis with infrared photometry in 2018 (J. J. Rodes-Roca et al. 2018). Long-term flux variability with an orbital period of about 117.2 days was discovered by the Swift/BAT monitor (R. H. D. Corbet & H. A. Krimm 2008). Pulsations at 12.4 s were detected from this bright source using Swift observations (J. Rodriguez et al. 2009). A QPO feature at 0.032 ± 0.002 Hz with an rms fractional amplitude of ∼18% was first detected during a 2019 type I outburst observed by AstroSat and XMM-Newton, and a positive correlation of the QPO rms amplitude with energy is exhibited (G. Raman et al. 2021; H. Manikantan et al. 2024). IGR J19294+1816 is also remarkable because it exhibits both a QPO and a 40 keV CRSF, implying a magnetic field strength of 4.6 × 10¹² G (S. S. Tsygankov et al. 2019; G. Raman et al. 2021).
In this paper, we report the detailed results of the timing analysis of the X-ray pulsar IGR J19294+1816 during the 2019 type I outburst observed with Insight-HXMT. We focus on the QPOs by wavelet analysis and power density spectrum (PDS) methods. Section 2 outlines the observations and data reduction procedures. In Section 3, we present the timing results, including the pulse profiles and multiple QPO features identified with the PDS and wavelet methods. The possible physical mechanisms responsible for the QPOs are discussed in Section 4.
2. Observations
The Hard X-ray Modulation Telescope (Insight-HXMT) is the first Chinese X-ray astronomical satellite launched on 2017 June 15. Insight-HXMT consists of three main instruments: the High Energy X-ray telescope (HE) operating in 20–250 keV with a geometrical detection area of 5100 cm2 (C. Liu et al. 2020), the Medium Energy X-ray telescope (ME) operating in 5–30 keV with a geometrical detection area of 952 cm2 (X. Cao et al. 2020), and the Low Energy X-ray telescope (LE) covering the energy range 1–15 keV with a geometrical detection area of 384 cm2 (Y. Chen et al. 2020). Insight-HXMT was triggered with six observations (proposal ID: P0214056) from 2019 October 23 to 30 during the type I outburst of IGR J19294+1816, with a total exposure time of ∼40 ks. The Insight-HXMT Data Analysis Software (HXMTDAS) v2.04 is used to analyze data (more details on the analysis were introduced in previous publications; e.g., W. Wang et al. 2021; X. Chen et al. 2021). To take advantage of the best-screened event file to generate the high-level products, including the energy spectra, response file, light curves, and background files, we use tasks he/me/lepical to remove spike events caused by electronic systems and he/me/legtigen to select the good time interval (GTI) when the pointing offset angle is <0 04, the pointing direction above Earth is >10°, the geomagnetic cutoff rigidity is >8 GeV, and the South Atlantic Anomaly (SAA) did not occur within 300 s. Tasks helcgen, melcgen, and lelcgen are used to extract X-ray light curves with 128−1 s time bins. We use the XSPEC v12.12.0 software package (K. Arnaud 1996) included in HEASoft v6.29 for spectral fitting and error estimation.
In Figure 1, the average photon counts per second of IGR J19294+1816, which present the type I outburst lasting about 7 days monitored by Insight-HXMT, are shown, and the pointing observations cover the decrease phase of the outburst. During the observations, the source shows a 2–100 keV luminosity range of LX ∼ (1.5–3) × 1037 erg s−1 at 11 kpc, as estimated by fitting the Insight-HXMT spectra with the model  .
.
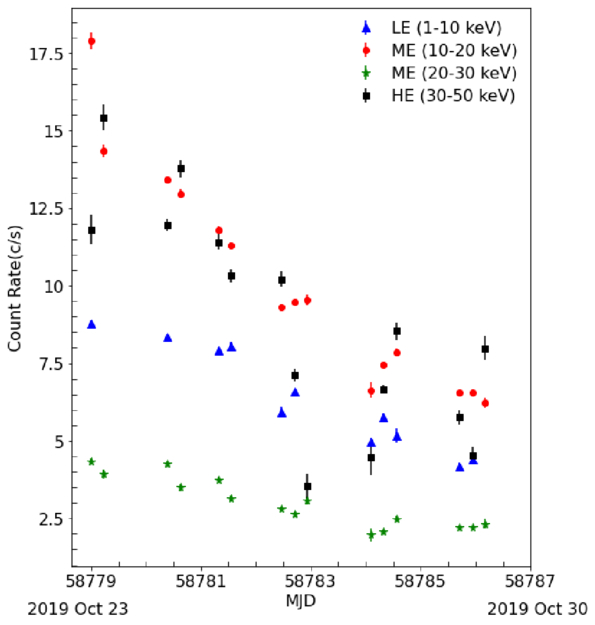
Figure 1. Average photon counts per second with a time resolution of 20,000 s during the Insight-HXMT observations from 2019 October 23 to October 30 for 1–10 keV, 10–20 keV, 20–30 keV, and 30–50 keV.
Download figure:
Standard image High-resolution image3. Data Analysis and Results
3.1. Pulse Profiles
The count statistics obtained from Insight-HXMT allowed us to search for the pulsed period with a binning of 128−1 s by using the efsearch method. The uncertainties of the spin period are estimated by folding the light curve with a large number of periods around the approximate period by maximizing χ2 and determined using the Gaussian function. The spin period is determined at ∼12.486(0.004) s for all ObsIDs based on the barycenter-corrected light curve. We created the energy-resolved pulse profiles by folding the light curves across different energy bands using the pulse period for each ObsID. Example pulse profiles over various energy bands for ObsID P021405600201 are presented in Figure 2. The entire energy band was resolved into various subintervals as 1–10 keV, 10–20 keV, 20–30 keV, and 30–50 keV. The pulse profile displays a broad single peak that spreads across the entire phase range, with an indication of a potential additional component emerging on the right side of the peak. Consistent with previous reports (G. Raman et al. 2021), a secondary peak, with an intensity approximately 70% that of the primary peak, located on its left side, is particularly notable below 10 keV. Energy-dependent features in the pulse profile have been observed in many accretion-powered X-ray pulsars, such as 4U 1909+07 (G. K. Jaisawal et al. 2013), 4U 0115+63 (S. Tsygankov et al. 2007), and EXO 2030+375 (W. Yang et al. 2024). An interpretation suggests that this could be attributed to the observer being expected to detect emission from two distinct regions at low energies but only from a single region at high energies, with low-energy X-ray photons being emitted from the upper regions of the accretion column and high-energy photons originating from areas near the neutron star surface (A. Lutovinov & S. Tsygankov 2009). Changes in the pulse profile with photon energy can also be affected by local absorption due to asymmetric matter distribution, multiple emission components, and gravitational light bending (A. Mushtukov & S. Tsygankov 2024).
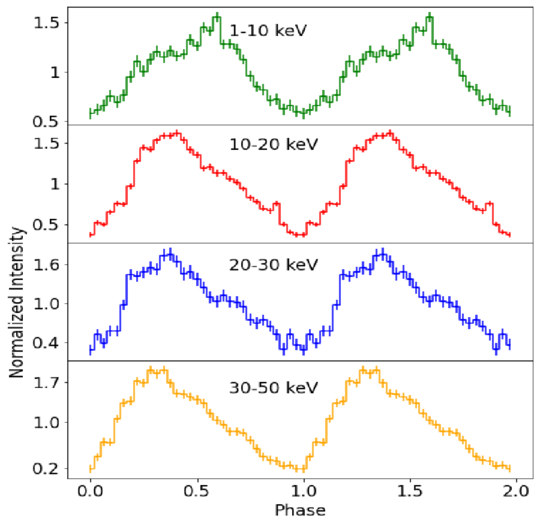
Figure 2. Pulse profiles of IGR J19294+1816 obtained from Insight-HXMT data in different energy bands for ObsID P021405600201. Zero-phase was chosen arbitrarily to match the minimum in the profile.
Download figure:
Standard image High-resolution image3.2. Power Density Spectrum
Inspired by the initial report of the ∼30 mHz QPO in IGR J19294+1816 detected by AstroSat during the 2019 outburst (G. Raman et al. 2021), we also carefully checked the light curves of IGR J19294+1816 observed by Insight-HXMT. We first carried out background-subtracted processes on the extracted light curves obtained from each payload and exposure. Powspec from HEASOFT was employed to calculate the PDS for each observation, using a time interval of 512 s and a corresponding time resolution of 128−1 s. A final PDS was generated with the average of all the power spectra. The PDSs were normalized to ensure that their integral is equal to the square of the rms fractional variability and rebinned geometrically by a factor of 1.03. To characterize quasi-periodic variability, we carried out the PDS fitting using the XSPEC fitting package. Our PDS model includes several Lorentzian components that are characterized by a broadband noise, a spin frequency peak at ∼0.08 Hz and its harmonic at ∼0.16 Hz, as well as multiple QPO features. The best-fitted parameters obtained from optimal models are presented in Table 1.
Table 1. All the QPO Parameters Obtained from the Best-fitting PDS in Different Energy Bands
| ObsID | Energy | QPO Parameter | Value |
|---|---|---|---|
| (keV) | |||
| 10–20 | νqpo1 (mHz) | 30.4(6) | |
| Q-factor | 12.6(9) | ||
| rms (%) | 8.4(20) | ||
| 25–50 | νqpo1 (mHz) | 30.2(1) | |
| Q-factor | 5.5(4) | ||
| 0201 | rms (%) | 15.1(20) | |
| νqpo2 (mHz) | 51.1(21) | ||
| Q-factor | 7.5(4) | ||
| rms (%) | 12.6(29) | ||
| νqpo3 (mHz) | 113.6(35) | ||
| Q-factor | 3.8(1) | ||
| rms (%) | 14.5(17) | ||
| 0401 | 10-20 | νqpo1 (mHz) | 31.4(10) |
| Q-factor | 6.8(3) | ||
| rms (%) | 15.8(25) | ||
Note. The ObsID shows the last four digits of P02140560.
Download table as: ASCIITypeset image
We first investigate the energy dependence of QPO features by creating PDSs for different energy bands: 10–20 keV for ME data and 25–50 keV for HE data. Furthermore, the average photon count rate is below 10 counts s−1 in 1–10 keV for these six observations, preventing us from analyzing the PDS in low-energy bands. The PDSs for ME and HE observations of ObsID P021405600201 are presented in Figure 3. The average QPO centroid frequency was determined to be 0.0304 ± 0.0006 Hz, and the QPO width has a value of ∼0.003 Hz in 10–20 keV. The QPO centroid frequency is 0.0302 ± 0.0001 Hz with a width of ∼0.005 Hz in 25–50 keV. The quality factor  (where v represents the frequency of the QPO and △v represents the full width at half-maximum (FWHM)) is calculated to be ∼13 and ∼6 for ME and HE, respectively. Additionally, the white-noise-subtracted rms value shows a notable increase, rising from ∼8% at 10–20 keV to ∼14% at 25–50 keV. A positive correlation of the QPO rms amplitude with energy is consistent with G. Raman et al. (2021). We detected ∼30 mHz QPOs beyond 25 keV, whereas such QPOs were not significantly observed above 30 keV previously. For ObsID P021405600401, where the QPO was also detected at 10–20 keV, the average QPO centroid frequency was determined to be 0.0314 ± 0.0010 Hz and the width of QPO to be ∼0.004 Hz. For other ObsIDs, the lack of clear QPOs may be attributed to the low count rate, and the traditional Fourier transform is not sensitive to nonstationary signals.
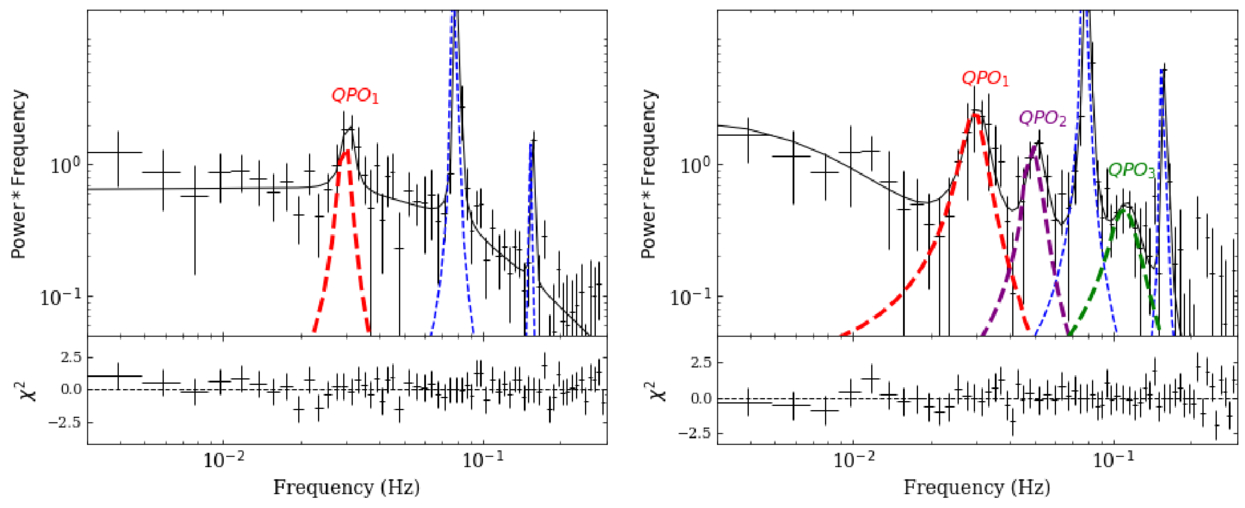
Figure 3. PDSs of IGR J19294+1816 for the Insight-HXMT observations (ObsID P021405600201) of 10–20 keV (left panel) and 25–50 keV (right panel). The solid black lines correspond to the best-fit model with a multi-Lorentzian function. The sharp peaks corresponding to the neutron star’s spin period of 12.48 s and its harmonics are indicated by the blue dotted line. The QPO signals νQPO1 ∼ 30 mHz, νQPO2 ∼ 50 mHz, and νQPO3 ∼ 110 mHz are represented with red, purple, and green dotted lines, respectively.
Download figure:
Standard image High-resolution imageAt 25–50 keV, the PDS for ObsID P021405600201 shows a new QPO below the main pulsation at 0.0511 ± 0.0021 Hz with a width of ∼0.007 Hz and an rms value of 12% ± 3%. Furthermore, an additional QPO above 0.05 Hz would be present, which allowed us to add an additional Lorentzian function to the model, with a central frequency at 0.113 ± 0.004 Hz and with the width of the Lorentzian function fixed at 0.03 Hz, and the χ2 values changed from 111 (61 dof) to 85 (59 dof) with a classical F-test probability of 3.8 × 10⁻⁴ for the model with the addition of a 0.11 Hz QPO. However, the classical F-test could give incorrect results when testing extra components like QPO peak features in power spectra (R. Protassov et al. 2002). To address this problem, we followed the methodology adopted in previous studies (K. Atapin et al. 2019) to check the significance. We simulated 10,000 PDSs based on the model without the additional Lorentzian component at ∼0.11 Hz, using the XSPEC fakeit command with model parameters fixed at observed best-fitting values. Each simulated PDS was then fitted with two models that add and do not add the Lorentzian component to obtain the simulated F-statistics. By comparing the simulated F-statistics with the observed F-statistics, we derived a corresponding p-value of 2 × 10⁻⁴. We speculate that this phenomenon is consistent with the Fourier frequency-shifting theorem, which implies that the QPO can modulate the amplitude of the main pulsation, leading to the formation of symmetric sidebands in the power spectrum. This effect has been observed in X-ray pulsar 4U 1626–67 (J. M. Kommers et al. 1998; R. Sharma et al. 2025).
3.3. Wavelet Analysis
To test whether the poor approximation for the QPO is due to intrinsic variations of its centroid frequency, we execute the pycwt1 package to compute the continuous wavelet transform, defined as

where  is a discrete Fourier transform of our signal (1–10 keV for LE data, 10–20 keV for ME data, 25–50 keV for HE data, with time resolution of 128−1 s) and
  is the Morle wavelet basis function (see Table 1 of C. Torrence & G. P. Compo 1998). The scaling parameter s in the wavelet transform is similar to the scaling factor in the Fourier transform, as it represents each frequency component (in our case,
  , where N represents the length of the frequency spectrum obtained after performing the Fourier transform; s0 is the smallest scale of the wavelet, which is twice the value of 128−1; and the spacing between discrete scales represented by Δj and the default value is 1/12). The shift parameter n can be considered as the time, which is not present within the Fourier transform. A more comprehensive introduction to wavelet analysis and its applications in X-ray light curves can be found in W. Yang & W. Wang (2025) and A. Ghosh et al. (2023). Four sections of the wavelet power spectra are shown in Figure 4. Three effects can be observed:
- 1.The QPO appears in the first 100 s and reappears after 200 s in the LE bands. The mHz QPO in the ME bands, with a constant frequency near 30 mHz, persists throughout the entire duration of the GTI. For the HE bands, there is also a QPO near 30 mHz lasting about 600 s in the early stage and another 200 s oscillation in the later stage.
- 2.The light curve shows that the photon count rate varies several times with the onset of the oscillation, as the ME count rate fluctuates between ∼10 and ∼20 and the HE count rate fluctuates between ∼10 and ∼30 (shown in the bottom panel).
- 3.The oscillations caused by the ∼30 mHz QPO signal modulate the amplitude of the coherent pulsations, and are detected at ∼50 mHz and ∼110 mHz in HE bands, and the detections of ∼50 mHz with the 1.2 ks observations reach the expected levels of red noise at the 95% significance level. The ∼110 mHz QPO signals were detected in 10–20 keV. The 30 mHz QPO lasts longer than the ones at ∼50 and 110 mHz.
We compute the time-averaged wavelet power over the entire GTI to quantify the QPO features globally. The central frequency of the QPO and the FWHM are fitted by the Lorentzian function. The quality factor (Q-factor) and R-factor are estimated accordingly.
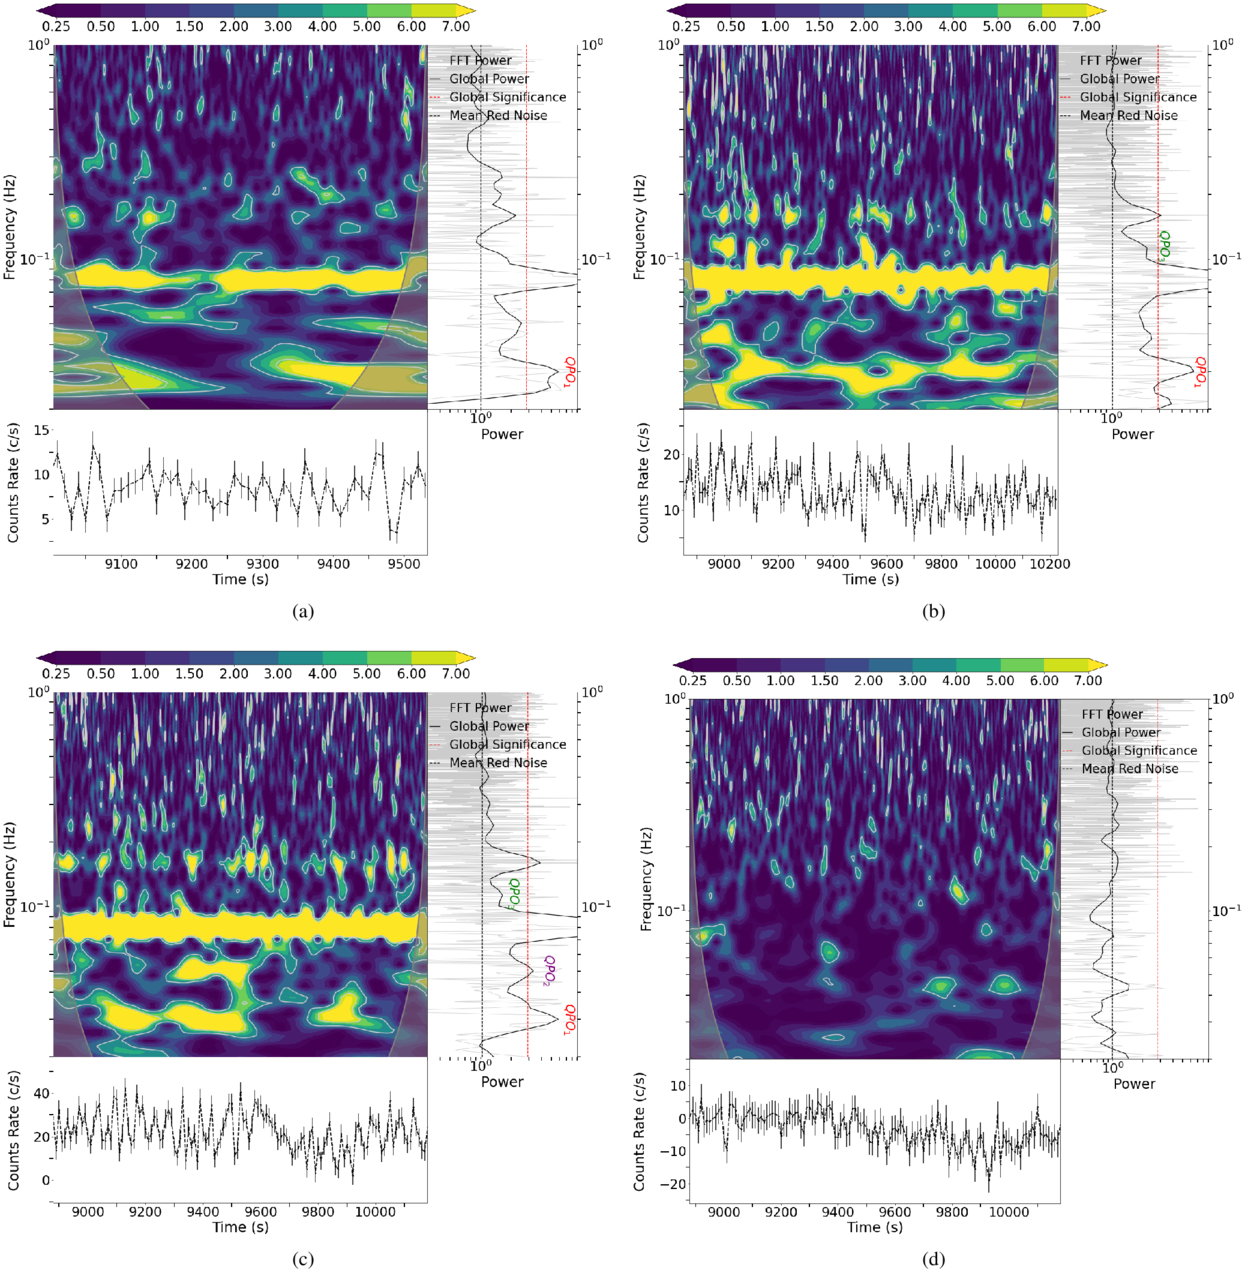
Figure 4. Wavelet power (main panel) and its global wavelet power spectrum (right panel) and count rates (lower panel) with 10 s bins for ObsID P021405600201 in MJD 58781.15 of (a) 1–10 keV, (b) 10–20 keV, (c) 25–50 keV, and (d) 50–100 keV. Gray lines in wavelet power refer to the 95% confidence spectrum, and the region where edge effects are significant is marked with a gray curved line. A color bar of the contour plot is presented on the top side, and the value scale represents the local wavelet power. The solid black line in the global wavelet is the time-averaged power, which is compared to the power spectra of red-noise random processes (black dashed lines) and red noise at the 95% significance levels (red dashed lines). Three QPO signals of νQPO1 ∼ 30 mHz, νQPO2 ∼ 50 mHz, and νQPO3 ∼ 110 mHz in the wavelet power spectra are labeled in red, purple, and green, respectively. The ∼30 mHz QPO signals are found below 50 keV. The ∼110 mHz QPO signals were detected in 10–20 keV, and both the ∼50 and 110 mHz QPO signals were detected in 25–50 keV. Above 50 keV, the background becomes dominant, leading to the disappearance of both the pulsations and the QPO.
Download figure:
Standard image High-resolution imageThe R-factor is the power of the global wavelet spectrum relative to the global 95% confidence spectrum:

To identify significant signals for further analysis, we select QPOs with R-factors exceeding 1.0 and GTIs longer than 500 s. In Table 2, we present detailed information for all QPO signals detected in each observation, including the energy band, count rate, exposure time, and properties of QPO1 ∼ 30 mHz, QPO2 ∼ 50 mHz, and QPO3 ∼ 110 mHz.
Table 2. Summary of Global Parameters of QPOs Observed in IGR J19294+1816 with Insight-HXMT during the 2019 Outburst
| ObsID | Energy | Count Rate | Start | Exposure | QPO1 Centroid Frequency | Q-factor | R-factor | QPO2 Centroid Frequency | Q-factor | R-factor | QPO3 Centroid Frequency | Q-factor | R-factor |
|---|---|---|---|---|---|---|---|---|---|---|---|---|---|
| (keV) | (counts s–1) | (MJD) | (s) | (mHz) | (mHz) | (mHz) | |||||||
| 0201 | 25–50 keV | 26.50(81) | 58781.08 | 1297 | 32.8(4) | 6.24(18) | 1.19(10) | ⋯ | ⋯ | ⋯ | ⋯ | ⋯ | ⋯ |
| 21.84(77) | 58781.15 | 1288 | 30.7(6) | 5.29(19) | 1.76(9) | 51.6(3) | 6.07(8) | 1.22(3) | 109.0(32) | 2.55(19) | 0.55(2) | ||
| 25.66(76) | 58781.21 | 1261 | 32.9(6) | 4.57(14) | 1.80(8) | 49.3(3) | 5.41(7) | 1.19(3) | ⋯ | ⋯ | ⋯ | ||
| 10–20 keV | 13.19(34) | 58781.08 | 1320 | 33.6(4) | 6.46(13) | 1.27(7) | 60.1(6) | 3.59(9) | 1.19(2) | ⋯ | ⋯ | ⋯ | |
| 12.86(46) | 58781.15 | 1223 | 30.0(4) | 6.38(17) | 2.13(8) | ⋯ | ⋯ | ⋯ | 104.2(61) | 3.12(24) | 0.85(6) | ||
| 12.91(38) | 58781.21 | 1439 | 32.7(3) | 4.36(8) | 2.25(4) | 48.0(7) | 4.52(15) | 1.15(5) | ⋯ | ⋯ | ⋯ | ||
| 1–10 keV | 8.20(28) | 58781.15 | 529 | 28.9(6) | 5.55(19) | 1.96(11) | ⋯ | ⋯ | ⋯ | ⋯ | ⋯ | ⋯ | |
| 0301 | 25–50 keV | 22.42(76) | 58782.14 | 1379 | 35.1(5) | 6.75(15) | 1.85(9) | 49.5(4) | 4.30(7) | 0.92(2) | ⋯ | ⋯ | ⋯ |
| 10–20 keV | 11.63(31) | 58782.14 | 1097 | 32.5(8) | 3.69(17) | 1.65(9) | ⋯ | ⋯ | ⋯ | ⋯ | ⋯ | ⋯ | |
| 11.14(30) | 58782.21 | 1439 | 32.5(8) | 5.32(24) | 1.25(13) | ⋯ | ⋯ | ⋯ | ⋯ | ⋯ | ⋯ | ||
| 0401 | 25–50 keV | 16.30(75) | 58783.20 | 938 | 32.0(2) | 6.53(8) | 1.31(4) | 58.3(8) | 5.66(16) | 1.11(7) | ⋯ | ⋯ | ⋯ |
| 10–20 keV | 9.11(29) | 58783.20 | 1200 | 32.3(5) | 6.87(19) | 1.02(11) | ⋯ | ⋯ | ⋯ | ⋯ | ⋯ | ⋯ | |
| 8.95(30) | 58783.27 | 1200 | 32.1(3) | 5.26(9) | 1.99(4) | ⋯ | ⋯ | ⋯ | ⋯ | ⋯ | ⋯ | ||
| 1–10 keV | 6.12(26) | 58783.17 | 600 | 28.5(8) | 4.75(21) | 1.79(12) | ⋯ | ⋯ | ⋯ | ⋯ | ⋯ | ⋯ | |
| 0402 | 25–50 keV | 18.12(82) | 58783.31 | 841 | 31.6(6) | 5.01(10) | 1.34(7) | ⋯ | ⋯ | ⋯ | ⋯ | ⋯ | ⋯ |
| 10–20 keV | 9.33(31) | 58783.38 | 1313 | 31.3(6) | 4.06(14) | 2.53(8) | 50.9(11) | 3.69(23) | 0.81(7) | ⋯ | ⋯ | ⋯ | |
| 1–10 keV | 6.84(27) | 58783.38 | 779 | 30.4(8) | 7.79(35) | 1.65(17) | ⋯ | ⋯ | ⋯ | ⋯ | ⋯ | ⋯ | |
| 0403 | 25–50 keV | 13.81(79) | 58783.44 | 1220 | 29.5(2) | 7.19(9) | 1.67(4) | ⋯ | ⋯ | ⋯ | ⋯ | ⋯ | ⋯ |
| 13.68(81) | 58783.47 | 747 | 29.9(3) | 6.95(13) | 1.30(5) | 50.2(3) | 7.49(7) | 1.47(4) | ⋯ | ⋯ | ⋯ | ||
| 10–20 keV | 8.90(30) | 58783.44 | 1200 | 29.9(5) | 2.13(8) | 1.37(3) | ⋯ | ⋯ | ⋯ | ⋯ | ⋯ | ⋯ | |
| 10.10(33) | 58783.47 | 779 | 32.1(3) | 3.86(7) | 1.21(3) | 54.5(5) | 4.36(8) | 1.01(4) | ⋯ | ⋯ | ⋯ | ||
| 9.68(30) | 58783.51 | 1020 | 30.2(5) | 4.95(13) | 2.21(7) | ⋯ | ⋯ | ⋯ | ⋯ | ⋯ | ⋯ | ||
| 0501 | 25–50 keV | 13.07(76) | 58784.92 | 1231 | 32.5(6) | 5.08(22) | 1.38(8) | ⋯ | ⋯ | ⋯ | ⋯ | ⋯ | ⋯ |
| 8.48(76) | 58784.99 | 1276 | 31.6(5) | 4.00(22) | 1.48(4) | ⋯ | ⋯ | ⋯ | ⋯ | ⋯ | ⋯ | ||
| 10–20 keV | 6.49(27) | 58784.92 | 1260 | 32.3(4) | 8.05(20) | 1.45(11) | ⋯ | ⋯ | ⋯ | ⋯ | ⋯ | ⋯ | |
| 7.73(28) | 58784.99 | 1290 | 32.9(6) | 3.92(17) | 1.45(6) | ⋯ | ⋯ | ⋯ | ⋯ | ⋯ | ⋯ | ||
| 0502 | 25–50 keV | 17.75(75) | 58785.10 | 1415 | 32.3(3) | 4.53(8) | 2.04(3) | 44.8(5) | 4.67(10) | 1.23(4) | 111.4(54) | 2.86(31) | 0.67(6) |
| 10–20 keV | 7.01(28) | 58785.03 | 1320 | 31.2(6) | 2.60(16) | 1.30(4) | ⋯ | ⋯ | ⋯ | ⋯ | ⋯ | ⋯ | |
| 8.16(28) | 58785.10 | 1439 | 34.4(4) | 7.02(14) | 3.12(9) | 45.9(18) | 3.79(23) | 1.16(7) | ⋯ | ⋯ | ⋯ | ||
| 7.56(28) | 58785.17 | 1499 | 31.0(3) | 5.17(10) | 2.00(5) | 48.1(9) | 3.41(19) | 1.11(8) | ⋯ | ⋯ | ⋯ | ||
| 0601 | 25–50 keV | 14.17(77) | 58786.45 | 1138 | 31.6(3) | 8.31(13) | 1.50(8) | ⋯ | ⋯ | ⋯ | ⋯ | ⋯ | ⋯ |
| 10–20 keV | 6.26(28) | 58786.45 | 1169 | 30.4(2) | 7.60(10) | 1.31(5) | ⋯ | ⋯ | ⋯ | ⋯ | ⋯ | ⋯ | |
| 0602 | 10–20 keV | 6.82(26) | 58786.64 | 899 | 29.3(6) | 5.96(21) | 1.51(12) | 44.8(6) | 4.81(13) | 1.05 | ⋯ | ⋯ | ⋯ |
Note. Q: quality factor; R: relative to the global 95% confidence spectrum. The ObsIDs are the last four digits of P02140560.
Download table as: ASCIITypeset image
Figure 5 illustrates the relationship between QPO1 frequency and average count rate from these GTI data. We can see that the centroid frequency of the QPO shows variations in the range of 29–35 mHz. The correlation between the two quantities is very weak, with Pearson correlation coefficients of 0.49 and 0.26 in HE and ME, respectively. The average QPO centroid frequency remains consistent in hard X-ray bands, with mean values of 31.7 ± 0.5 mHz for ME and 31.9 ± 0.4 mHz for HE. Below 10 keV, the average QPO centroid frequency is found to be ∼29 mHz. However, the low statistical significance and short GTIs in the LE data only show three data points for detections of mHz QPOs, so that it is difficult to study the QPO centroid frequency variation pattern with different energy bands.
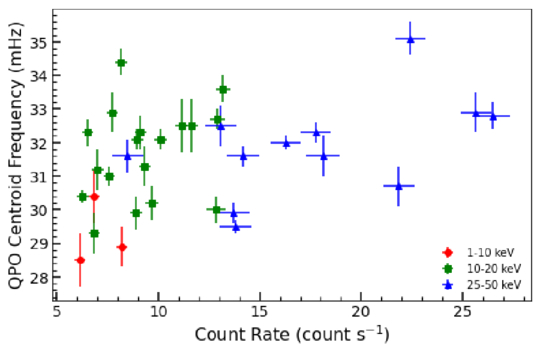
Figure 5. Centroid frequency of QPO1 vs. the average count rate corresponding to the GTI data.
Download figure:
Standard image High-resolution image4. Discussion and Conclusions
In this work, we have presented a detailed timing analysis of IGR J19294+1816 during its 2019 type I outburst by using Insight-HXMT observations. Narrow peaks corresponding to the spin period of the accretion-powered pulsar are clearly seen in PDSs and wavelet spectra. Multiple QPO frequencies at ∼30, 50, and 110 mHz were also detected during these observations. The ∼30 mHz QPO feature with ∼10% rms and quality factor of ∼8 is detected in the PDSs and wavelet power spectra, and two QPOs at ∼50 and 110 mHz have a quality factor of ∼5 and ∼3, respectively. Here we present the possible theoretical explanations for the multiple X-ray mHz QPOs in IGR J19294+1816.
QPOs are traditionally understood to arise from the interaction of matter in the accretion disk with the magnetosphere of a compact object (P. Ghosh & F. Lamb 1979). The magnetic stresses are unable to dominate the flow in the accretion disk at radii greater than the Alfvén radius. In neutron star X-ray binaries, the surface magnetic field strength differs between HMXBs and low-mass X-ray binaries (LMXBs). HMXBs generally possess surface magnetic fields on the order of 1011–1013 G, whereas LMXBs exhibit significantly weaker surface fields, typically around 108–1010 G. As a result, in HMXBs the strong magnetic field remains capable of disrupting the accretion disk even at relatively large radii, thereby giving rise to oscillations at lower frequencies. We can therefore expect to detect mHz QPOs in such systems for both transient and persistent X-ray pulsars (M. James et al. 2010). In addition, these QPOs can show transient behaviors. Q. Liu et al. (2022) reported the detection of ∼40 mHz QPOs in Cen X-3, which was not present throughout observations in 2020; a 0.04 Hz QPO in 4U 1626–67 only appeared during the torque reversal to the spin-down state (R. Sharma et al. 2025); and a QPO feature in KS 1947+300 appeared only near the end of the 2001 outburst (M. James et al. 2010). The QPO features can also reappear and vanish multiple times with almost unchanged luminosity and spectral shape over short timescales (see details in Y. Ding et al. 2021 and W. Yang & W. Wang 2025).
Various models have been proposed to explain the characteristics of mHz QPOs in HMXBs; two notable models are the Keplerian Frequency Model (KFM; M. Van der Klis et al. 1987) and the Beat Frequency Model (BFM; M. A. Alpar & J. Shaham 1985). In the KFM, QPOs result from the inhomogeneities in the inner accretion disk at the Keplerian frequency. Thus, the Keplerian frequency is νk = νQPO. However, the KFM is only applicable when the neutron star’s spin is slower than that of the inner accretion disk at the radius where the QPO-generating inhomogeneity is located, since a faster-rotating neutron star would generate centrifugal forces that inhibit accretion. The QPO frequency due to the BFM is attributed to the modulation in mass accretion rate onto the neutron star’s poles at the beat frequency between the spin frequency and the Keplerian frequency of the inner edge of the accretion disk, according to νQPO = νk − νspin.
For IGR J19294+1816, the spin frequency νspin = 80 mHz is higher than the QPO frequency range ( 29–35 mHz), meaning that the KFM is not applicable in this case. Then, we consider the QPO generation occurring near the Alfvén radius RA (P. Ghosh & F. Lamb 1979), to check whether the BFM is suitable. The value of RA is estimated assuming a magnetic field strength of 4.6 × 10¹² G (G. Raman et al. 2021), a measured 2–100 keV luminosity in the range of LX = (1.5–3.0) × 1037 erg s−1, a neutron star radius of 106 cm, and a mass of 1.4 M⊙, with Λ = 1 for spherical accretion and Λ = 0.1 for disk accretion (P. Becker et al. 2012). Under these conditions, the Alfvén radius is found to be in the range of ∼4.8 × 107 cm to 5.8 × 108 cm. The radius corresponding to the Keplerian frequency at 110 mHz as the inner edge of the accretion disk is ∼(7.1–7.3) × 108 cm. Given the inherent uncertainties and model-dependent assumptions in estimating RA, the discrepancy between these two radii may be not significant. Frequencies of QPO1 detected within the range of 29–36 mHz (see Figure 5) do not vary with source luminosities, and the ∼30 mHz QPO is transient, lasting longer than the 110 mHz QPO. These properties pose a challenge for the BFM. Therefore, we consider alternative explanations for the generation of the QPOs.
Another possible explanation considering such low-frequency mHz QPOs is the magnetic disk precession model suggested by A. Shirakawa & D. Lai (2002). In this scenario, the inner region of the accretion disk experiences magnetic torques that can induce warping and precession of the disk. Under typical conditions in X-ray pulsars, these torques can overcome viscous damping, allowing the precessional instability to develop and potentially give rise to mHz QPOs. The precessional frequency of the QPO, as described by Equation (27) in A. Shirakawa & D. Lai (2002), is

where α is the accretion disk viscosity parameter and L37 represents the X-ray luminosity in units of 1037 erg s−1. For this calculation, We assume α = 0.023, a value chosen based on the model fits performed by J. Roy et al. (2019) for the source 4U 0115+63. The obtained value (∼10 mHz) is smaller than ∼30 mHz.
The detection of two QPOs at 50 and 110 mHz is not a harmonic of the primary 30 mHz QPO but follows the relationship νspin ± νqpo during the decline phase of the 2019 outburst. Similar features were observed in 4U 1626–67 (J. M. Kommers et al. 1998,R. Sharma et al. 2025). They suggested that sidebands arise as a result of the Fourier frequency-shifting theorem: for a simple sine wave  , if the amplitude of this sine wave
  changes over time with frequency nv, the Fourier transform will no longer have a single “spike” but will also have additional frequency components around the central frequency ns ± nv forming sidebands. The presence of the symmetric sidebands at ∼50 and 110 mHz suggests that the instantaneous amplitude of the coherent pulsations contains a term proportional to the ∼30 mHz QPO signal. The sideband structure provides remarkably constraining information on the ∼30 mHz QPOs. We no longer insist that the QPO frequency corresponds to the Keplerian frequency at the inner edge of the disk, and we follow the suggestion proposed by J. M. Kommers et al. (1998) that explains the presence of QPO signals, symmetric sidebands in a pulsar system. We also propose that a large, coherent structure (referred to as a “blob”) of material orbits the neutron star at a frequency approximately matching the QPO centroid frequency around 30 mHz. During each orbit, a portion of the blob occasionally passes through the line of sight between the neutron star and the observer. This occasionally quasi-periodic reduction in pulsar beam intensity produces transient symmetric sidebands centered around the spin frequency. As the blob moves along its orbit, it absorbs X-rays from the pulsar beam and then scatters them out of the line of sight, giving rise to the direct 30 mHz QPO signal. From our wavelet analysis, sidebands appear more prominently in the HE band, which may be due to the fact that the power of the sidebands typically depends on the amplitude of the modulated signal. The pulse profile shows a higher amplitude in the HE band (see Figure 2), making the modulation of the pulse beam by the blob more significant. It remains unclear why a single reprocessing structure with limited spatial extent would persist within the accretion disk despite the differential rotation of nearby Keplerian orbits and how this structure modulates the pulsar beam with a quasi-periodic variability at ∼30 mHz, exhibiting dissimilar behavior for the sidebands over short timescales.
To study the origins of the QPOs ranging from 29 to 36 mHz in this source, one could examine whether the intensity of its amplitude is related to the accretion rate. If the amplitude intensity is dependent on the accretion rate, the blob would modulate the pulsar beam and scatter X-ray photons out of the line of sight, serving as the primary driver of this instability. Further theoretical or simulation studies will be required in the future to better understand the origin of this instability.
Acknowledgments
We acknowledge the referee for useful comments and suggestions that improved the manuscript. This work is supported by the the NSFC (No. 12133007) and the National Key Research and Development Program of China (grant Nos. 2021YFA0718503, 2023YFA1607901).