Abstract
Galaxies covering several orders of magnitude in stellar mass and a variety of Hubble types have been shown to follow the radial acceleration relation (RAR), a relationship between  , the observed circular acceleration of the galaxy, and
  , the acceleration due to the total baryonic mass of the galaxy. For accelerations above
  ,
,  traces
  , asymptoting to the 1:1 line. Below this scale, there is a break in the relation such that
  . We show that the RAR slope, scatter, and the acceleration scale are all natural consequences of the well-known baryonic Tully–Fisher relation (BTFR). We further demonstrate that galaxies with a variety of baryonic and dark matter (DM) profiles and a wide range of dark halo and galaxy properties (well beyond those expected in Cold Dark Matter (CDM) theory) lie on the RAR if we simply require that their rotation curves satisfy the BTFR. We explore conditions needed to break this degeneracy: subkiloparsec resolved rotation curves inside of cored DM-dominated profiles and/or outside
  could lie on BTFR but deviate in the RAR, providing new constraints on DM.
1. Introduction
The Tully–Fisher relation (Tully & Fisher 1977) is a well-studied empirical relationship between the observed luminosities and rotational velocities of galaxies. While this particular form of the relation appears to break down at low masses (Persic & Salucci 1991), McGaugh et al. (2000) and others have shown that the baryonic Tully–Fisher relation (BTFR) between total baryonic mass ( , where M* is the stellar mass and
  the cool/warm interstellar medium (ISM) mass of the galaxy) and circular velocity (
 being the true, model-inferred circular velocity
  measured within the flat portion of the rotation curve) exhibits a tighter correlation extending to dwarf masses. Using 21 cm rotation curves from a large sample of galaxies with
  , McGaugh (2005) fits
  with
with  , b = 4, and
  lognormal scatter.
The BTFR was historically challenging to explain within the framework of Lambda Cold Dark Matter (ΛCDM) galaxy formation simulations, as models that simply convert most of the baryons into stars predict a different slope (b = 3) and normalization from that observed. However, more recent simulations accounting for stellar feedback processes have shown this removes low angular momentum gas and suppresses star formation in low-mass halos, in a manner which dramatically improves the agreement with the BTFR (Brook et al. 2012; Hopkins et al. 2014; Crain et al. 2015; Sales et al. 2017).
Recently, McGaugh et al. (2016) and Lelli et al. (2017, hereafter L17) have described a generalization of the BTFR, the radial acceleration relation (RAR). The RAR is a relationship between the observed gravitational acceleration  (with Vc observed at radius r), and the acceleration (assuming a spherical potential) due to the enclosed baryonic mass in the same radius,
  . Essentially, the RAR plots the BTFR at every point along each galaxy’s rotation curve. At high acceleration (
 ),
),  , as expected if the highest-density regions are baryon dominated. At low acceleration,
  with a slope of
  in the outskirts of massive galaxies and dwarfs (possibly flattening further still for lower-mass dSphs; see Figures 8–10 in L17). A fit that interpolates between both regimes is given by L17 as
  (with a ∼0.1–0.15 dex scatter, rising toward lower masses).
The functional form of the RAR and value of the scale  has led some authors (McGaugh et al. 2016; Milgrom 2016, L17) to suggest the acceleration discrepancy is due to an alternative law of gravity, specifically the Milgrom (1983) form of Modified Newtonian Dynamics (MOND) that fits such a functional form and value of
  to individual rotation-curve measurements. Others have argued the relation is a natural consequence of ΛCDM and that simulated galaxies with standard gravity+DM follow the relation (Chan 2017; Keller & Wadsley 2017; Ludlow et al. 2017).
However, we show in this paper that the RAR is not an entirely new property of galaxies, but its slope, scatter, and acceleration scale follow directly from the BTFR. We demonstrate that for a wide variety of galaxy or DM halo properties, requiring the galaxy lie on BTFR forces it to obey the RAR over its entire (measured) radial extent. We then identify the extreme systems/radii that must be measured to break this degeneracy.
2. Basic Scalings
First, we consider simple scalings that demonstrate that the RAR scalings follow from the BTFR, independent of the physical origins of the anomalous acceleration. At high acceleration (exclusively the inner regions of more massive galaxies) the RAR has  , consistent with gravity being Newtonian and from baryons alone. This follows trivially if high-acceleration (high-density) regions are baryon dominated, i.e., DM cannot become arbitrarily dense.
At low acceleration (large radii in most galaxies) the RAR asymptotically approaches  . But consider that the observed BTFR3
is
. But consider that the observed BTFR3
is  , where
  is (by definition) measured on the flat part of the rotation curve, so
  over a large range of r. If we make the simple assumption that we are outside the range where
  (i.e., the baryonic mass is starting to converge), then
  /
/
![${r}^{2}\,=G{\mathscr{A}}{({V}_{c}^{2}[r]/r)}^{2}=(G{\mathscr{A}}){g}_{\mathrm{obs}}^{2}$](https://content.cld.iop.org/journals/0004-637X/882/1/46/revision1/apjab311bieqn34.gif) . So we obtain exactly
. So we obtain exactly  where
where  (using the measured
  ).
).
This also explains the small scatter of the RAR. In the baryon-dominated region all scatter should be measurement error or physical noise (e.g., nonspherical corrections). At low acceleration if we assume a galaxy deviates from the BTFR by a factor δ (mass  ), then repeating the above gives
  , so the logarithmic scatter (including both that from measurement error and from scatter in galaxy scaling relations) propagated throughout the entire extent of the RAR, once again assuming that the baryonic mass is converged, is the scatter of the BTFR, reduced by a factor 1/2 (from the square root).
Low accelerations may also occur in the inner regions of dwarf galaxies—in some cases where the rotation curve is still rising. Although this will not be true for the majority of points on the RAR, we consider this as one of our special cases in Section 4, including the conditions and radii required for the relation to break down.
3. Example and Constraints on Mass Profiles
Previous studies (e.g., Di Cintio & Lelli 2016; Santos-Santos et al. 2016; Keller & Wadsley 2017; Ludlow et al. 2017; Navarro et al. 2017) have considered how the positions of galaxies would vary along the RAR according to different feedback and cooling models within a ΛCDM framework. Similarly, Desmond (2017) shows that the shape, normalization, and scatter at high acceleration can be reproduced using a basic ΛCDM abundance-matching model. Here, we consider a purely empirical approach—with variations in galaxy properties such as galaxy and halo masses, radii, and profile shapes, many of them well outside the scope of any acceptable ΛCDM model—to demonstrate that the small scatter is not unique to ΛCDM but generic to any models that reproduce the BTFR. Initially, we consider the effect of the observed scatter in galaxy half-mass–radius ( ), baryonic mass (
 ),4
halo virial mass (
),4
halo virial mass ( ), and concentration (c) on the scatter of the RAR. Consider simple two-component (baryon+dark) models: for example, take a (spherical) DM halo with a Navarro–Frenk–White (NFW; Navarro et al. 1997) profile
  , with scale radius
  (
( the virial radius and c the concentration), normalized by the total mass
  inside
  . Add a baryonic component with an exponential surface density profile (
 ), with total mass
  .
.
If desired, typical galaxy properties can be estimated from observed scalings.5
We will use these as a starting point but in fact treat these parameters as essentially free and vary them in turn. Starting from a fiducial case, we first vary  ,
,  ,
,  , and c each independently and only within the observed scatter of each parameter, while keeping all other properties fixed. This is shown in Figure 1 where, for each model, we then calculate
  from the enclosed mass (
 ) profile, where the full rotation curve (calculated for
  ) is a combination of DM+baryonic components:
  . We then apply this crucial step: we require that the rotation curve obey the BTFR. Specifically, we require that
  (which we approximate as the maximum of the total Vc, or value at
  if it continues rising at larger radii) is equal to
  (with the measured
  from L17).6
This essentially removes one degree of freedom from the models (e.g., the absolute mass scale at a given
from L17).6
This essentially removes one degree of freedom from the models (e.g., the absolute mass scale at a given  is fixed by this assumption), but the sizes of baryons and DM, their mass ratios, and their profile shapes (essentially all parameters that determine the shape of the rotation curve) remain freely varied. The fact that each of the lines in Figure 1 lie nearly on top of each other as well as on top of the observed best-fit RAR suggests that the scatter in the RAR is nearly completely specified by the scatter in the BTFR itself, rather than through the effect that additional scatter in these parameters has on
  measured over the entire radial extent of the galaxy.
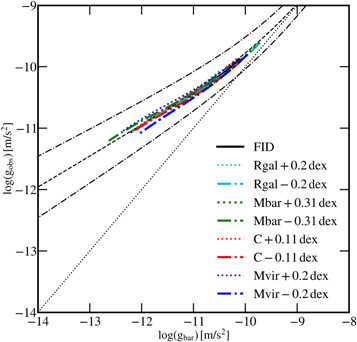
Figure 1. Radial acceleration relation for our fiducial galaxy model plotted throughout the radial range  , along with the relation given by including scatter in
  ,
,  ,
,  , and c taken from observations (see footnote 2). The scatter in
  is taken as the scatter in
  , while the scatter in
  is taken as the scatter at low mass for maximal effect. We compare the observed best fit (dashed black lines) and 95% (
 ) inclusion interval (dashed–dotted black) and
  (dotted black). By imposing that that the model profile lie on the observed BTFR, all lines lie nearly on top of each other, and on top of the observed best-fit relation. This demonstrates that the scatter in the RAR is dominated by the scatter in the BTFR itself, rather than the scatter in observed relations explicitly.
Download figure:
Standard image High-resolution imageFigure 2 demonstrates that galaxies with a much wider variety of properties than observed will fall within observed scatter on the RAR if they also satisfy the BTFR. Following the procedure outlined above, we now vary  ,
,  ,
,  ,
,  , and c wildly according to the values listed in Table 1 and the caption of Figure 2 so, e.g., our models do not lie on any observed relations; we then covary
  and
and  along the observed relation (model MbRg), then
  and
and  along the standard cosmological relation (model MvRv), then we covary
  ,
,  , c,
, c,  ,
,  all along the observed scaling laws together (model MmRrC). Next we consider varying the mass profile of DM or baryons; e.g., for DM modifying NFW to a cored-pseudo-isothermal (CIS;
  ), isothermal (SIS;
  ), cored-NFW (CNFW;
  ), or Hernquist (1990) (HERN;
  ) profile (for baryons we consider the same set with
  ). For illustrative purposes we also consider an intentionally unphysical model (SIN) where the density varies wildly and repeatedly with radius between zero and some maximum value:
  . The RAR for the sinusoidal baryonic profile can be seen in the lower right panel of Figure 2 as a tight cluster of purple points near
  . Despite its unphysical nature, it easily falls within the observed RAR scatter.
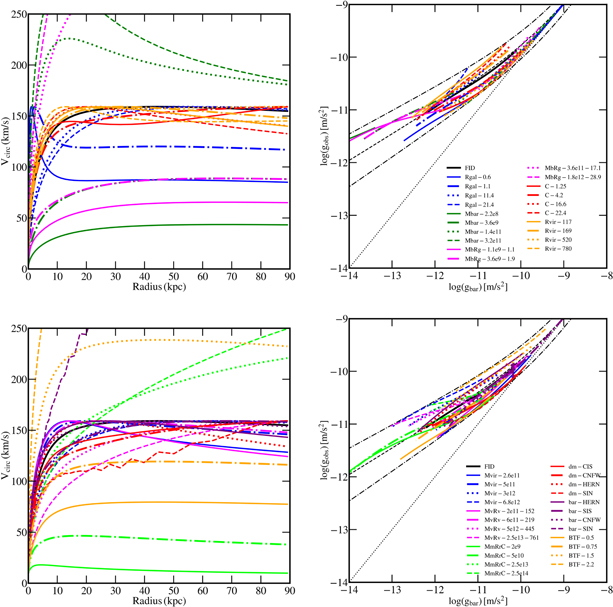
Figure 2. Left: rotation curves for the different baryon+DM models listed in Table 1. Upper and lower panels plot different subsets varying different parameters, as labeled. Right: location of each point in the rotation curve at left, plotted on the RAR throughout the radial range  . We compare the observed best fit (dashed black lines) and 95% (
 ) inclusion interval (dashed–dotted black) and
  (dotted black). Despite enormous (often unphysical) variations in profile shapes, sizes, baryon-to-DM masses, and more, all lie within the observed range. The only condition we impose is that the model profile lies on the observed BTFR.
Download figure:
Standard image High-resolution imageTable 1. Summary of Models Used in Figure 2
| DM Profile | Baryonic Profile |

|

|

|

|

|
BTF Norm Coeff | |
|---|---|---|---|---|---|---|---|---|
| FID | NFW | EXP | 1.0 | 260.1 | 8.3 | 3.6 | 5.7 | 1 |
| Rgal–X | NFW | EXP | 1.0 | 260.1 | 8.3 | 3.6 | X | 1 |
| Mbar–X | NFW | EXP | 1.0 | 260.1 | 8.3 |

|
5.7 | 1 |
| MbRg–X–Y | NFW | EXP | 1.0 | 260.1 | 8.3 |

|
Y | 1 |
| C–X | NFW | EXP | 1.0 | 260.1 | X | 3.6 | 5.7 | 1 |
| Rvir–X | NFW | EXP | 1.0 | X | 8.3 | 3.6 | 5.7 | 1 |
| Mvir–X | NFW | EXP |

|
260.1 | 8.3 | 3.6 | 5.7 | 1 |
| MvRv–X–Y | NFW | EXP |

|
Y | 8.3 | 3.6 | 5.7 | 1 |
| MmRrC–2e9 | NFW | EXP | 0.002 | 32.8 | 15.6 | 0.0007 | 0.1 | 1 |
| MmRrC–5e10 | NFW | EXP | 0.05 | 95.9 | 11.3 | 0.03 | 1.3 | 1 |
| MmRrC–2.5e13 | NFW | EXP | 25.0 | 760.5 | 6.0 | 13.1 | 9.5 | 1 |
| MmRrC–2.5e14 | NFW | EXP | 250.0 | 1533.6 | 4.8 | 21.3 | 12.5 | 1 |
| dm_CIS | CIS | EXP | 1.0 | 260.1 | 16.6 | 3.6 | 5.7 | 1 |
| dm_CNFW | CNFW | EXP | 1.0 | 260.1 | 8.3 | 3.6 | 5.7 | 1 |
| dm_HERN | HERN | EXP | 1.0 | 260.1 | 8.3 | 3.6 | 5.7 | 1 |
| dm_SIN | SIN | EXP | 1.0 | 260.1 | 4.2 | 3.6 | 5.7 | 1 |
| bar–HERN | NFW | HERN | 1.0 | 260.1 | 16.6 | 3.6 | 4.0 | 1 |
| bar–SIS | NFW | SIS | 1.0 | 260.1 | 8.3 | 3.6 | 22.8 | 1 |
| bar–CNFW | NFW | CNFW | 1.0 | 260.1 | 8.3 | 3.6 | 1.7 | 1 |
| bar–SIN | NFW | SIN | 1.0 | 260.1 | 8.3 | 216.0 | 40.0 | 1 |
| BTF–X | NFW | EXP | 1.0 | 260.1 | 8.3 | 3.6 | 5.7 | X |
Note. Fiducial (FID) is an L⋆ galaxy in a DM halo with an NFW DM and exponential (EXP) baryonic profile, with virial mass  and radius
  , concentration c, baryonic mass
  , and half-mass–radius
  , as labeled. The profile is normalized to have
  a multiple (BTF norm coeff) of the observed BTFR. Where one or two parameters are varied, we label Name—X–Y (e.g.,
  keeps all values fixed as shown, but varies
  according to the label in Figure 2).
Download table as: ASCIITypeset image
For the models in Figure 1 with varied parameters, we intentionally vary them until we find extremal values where the predicted RAR lies at the edge of the observed 95% inclusion contour. For example, our Mbar- (Rgal-) series tells us that  of galaxies with
  must have
  (
( ). The actual observed scatter in the
  relation at this mass is just
  , much smaller than this range (likewise for sizes). This can be seen by comparing the scatter in the RAR obtained by adding the observed scatter to these relations (Figure 1) to the scatter in the RAR from a much wider range of values (Figure 2). The actual observed scatter barely moves our fiducial model off of the best-fit line, while many unphysical values still follow the RAR within its 2σ observed scatter. Similarly the allowed
  ,
,  , and c range at a given
  range is much larger than obtained in cosmological simulations (at
  ,
,  ,
,  ,
,  ). We can vary the mass profiles (of DM and/or baryons) well beyond those observed in galaxies or cosmological simulations (with inner slopes from
  and outer from
  ). Of course, these allowed parameter ranges should be taken as maximal limits, because we have imposed that the systems lie on the BTFR, i.e., by re-normalizing the curves, we de facto adjust the parameters themselves and so the resulting range of values listed above will be much larger than the true physical limits. We have plotted the acceleration over quite a large radial extent (
 ). If we were to increase the radial range over which we measure the acceleration, the allowed ranges would decrease. What we have shown is that the BTFR is much more important for the RAR than any other varied galaxy property here. In other words, other correlations like size–mass, concentration–mass, or
  , and mass profile shapes, do not (within reasonable physical values) play a significant role in the RAR, provided BTFR.
We see this directly by simply varying the location of models with respect to the BTFR: our BTF_ systematically changes the normalization  of the BTFR used to normalize the rotation curves. As expected this directly shifts the position in the RAR; moreover, the 95% range observed in the RAR corresponds almost exactly to the 95% range in the observed BTFR.
We note that we do not use the same definition of  used in L17 or McGaugh et al. (2016). However, many of the messier rotation curves we explore in this work, where there is a low-radius peak in Vc or if the rotation curve is still rising, would likely have been thrown out of both the BTFR and RAR analyses. The fact that our result still holds for these galaxies only serves to strengthen our conclusions. Nonetheless, as a check, we investigate the effect of changing the radius at which the curves are normalized to the BTFR in Figure 3. Here we have extended the radial range out to
  in order to show the effect of forcing the curves to lie on the BTFR at extreme radii. We look at a range of radii from
  , including normalizing the rotation curve at
  as in Sales et al. (2017). As can be seen in Figure 3, the fiducial curve lies within the observed scatter of the RAR for all radii at which we take
  . Only if we normalize the curve below this radius, do we see any deviation from the observed RAR. This strongly suggests that our results remain robust despite our different definition of
  .
.
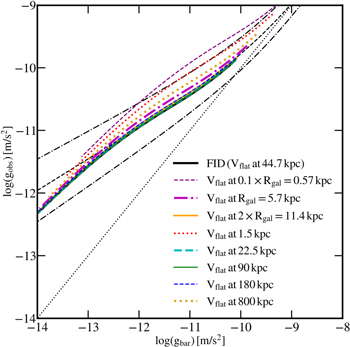
Figure 3. Radial acceleration relation for our fiducial model with different locations for where we measure  . The observed best fit (dashed black) and 95% (
 ) inclusion interval (dashed–dotted black) and
  (black dotted) are shown for comparison. The thick lines show the RAR for
  , where we have expanded the radial range for illustrative purposes. Only if we normalize the curves at
  do we see any significant deviation beyond the observed scatter in the RAR.
Download figure:
Standard image High-resolution image4. Breaking the RAR
Can galaxies deviate from the RAR in a manner that provides new information beyond their location on the BTFR? At high accelerations  (where
  ), deviations from the RAR would require a dark component to dominate the acceleration over baryons; this in turn requires a minimum DM acceleration
  , which would require DM collapse to surface densities
  (denser than typical GMCs) on ∼kiloparsec scales. This is ruled out by lensing and other constraints (and is not expected for standard collisionless particle–CDM candidates; Rubin et al. 1980; Keeton & Madau 2001).
At intermediate accelerations,  , we are very close to the radii where the BTFR relation is measured (each point on the BTFR is a point on RAR at about this
  )—so any deviation in the RAR is equivalent to a deviation from the BTFR.
At weak accelerations  (where
  ), the fact that the RAR plots all radial points makes it possible that a galaxy could lie on the BTFR and still deviate in the RAR. Recall, at the radius r0 where the BTFR is measured, the galaxy must also lie on the RAR (i.e.,
 ![${g}_{\mathrm{obs}}({r}_{0})=\langle {g}_{\mathrm{obs}}({g}_{\mathrm{bar}}[{r}_{0}])\rangle \approx \sqrt{{g}_{\mathrm{bar}}({r}_{0}){g}_{\dagger }}$](https://content.cld.iop.org/journals/0004-637X/882/1/46/revision1/apjab311bieqn169.gif) ). However, as we extrapolate to
). However, as we extrapolate to  or
or  , a deviation can occur. Noting
  =
=![$\,({M}_{\mathrm{enc}}[\lt r]/{M}_{\mathrm{enc}}[\lt {r}_{0}]){({r}_{0}/r)}^{2}\,{g}_{\mathrm{obs}}({r}_{0})$](https://content.cld.iop.org/journals/0004-637X/882/1/46/revision1/apjab311bieqn173.gif) (similar for
(similar for  ) we can write the ratio of
  at some radius r to that expected if the galaxy lay exactly on the RAR (
 ) as
) as ![${g}_{\mathrm{obs}}/\langle {g}_{\mathrm{obs}}\rangle =[{M}_{\mathrm{enc}}(r)/{M}_{\mathrm{enc}}({r}_{0})]$](https://content.cld.iop.org/journals/0004-637X/882/1/46/revision1/apjab311bieqn177.gif)
![${[{M}_{\mathrm{bar}}({r}_{0})/{M}_{\mathrm{bar}}(r)]}^{1/2}({r}_{0}/r)$](https://content.cld.iop.org/journals/0004-637X/882/1/46/revision1/apjab311bieqn178.gif) .
.
Now consider r ≪ r0: this can be seen in the thick lines of Figure 4, where the RAR is plotted for a model galaxy with the fiducial parameters except for varying density profiles over the radial range  . If the system becomes very dense at small radii (i.e., has a steep cusp),
  will increase, giving the high-acceleration regime above. NFW-type DM profiles (
 ) and exponential-type (constant inner-surface-brightness) baryonic profiles (thick cyan line) produce zero deviation (
 ) as
) as  . Deviations are maximized for flatter ρ profiles (where rotation curves rise as steeply as possible), so consider the case where both DM+baryons have a core (
 ) out to some radius
  (where the system is close to BTFR)7
; then
(where the system is close to BTFR)7
; then  . So to deviate by more than a factor of
  , at weak accelerations) from the median observed RAR, one must measure the RAR at
  . This can be seen in the thick dark magenta line in Figure 4, where both the observed and baryonic accelerations
  , at low radii, and thus trace the 1:1 line. Models with cored baryonic profiles and cuspy dark profiles (e.g., HERN-CIS, thick green line) have
  at the center while
  . Although Figure 4 shows the profiles for an
  galaxy, because dark matter (DM) cores are observed only in low-mass galaxies, observationally detecting this deviation likely requires subkiloparsec resolution of the rotation curve. The existence of cores may explain why there appears to be a flattening of the relation in observed dwarfs (L17, their Figure 12). It is interesting to note that the largest deviations occur for
  —approximately the ratio of halo to baryonic (stellar) mass for which core formation is likely to be most efficient (Di Cintio et al. 2014).
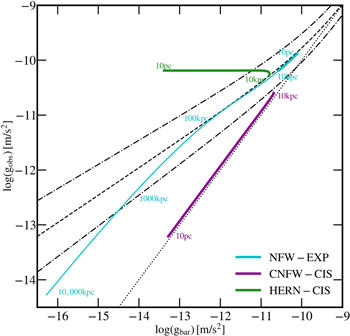
Figure 4. Radial acceleration relation for our fiducial model with different baryonic and nonbaryonic density profiles chosen to highlight the behavior at small and large radii. The observed best fit (dashed black) and 95% ( ) inclusion interval (dashed–dotted black), and
  (black dotted) are shown for comparison. The thick lines show the RAR for
  for the NFW (EXP), CNFW (CIS), and HERN (CIS) dark matter (baryonic) profiles (cyan, dark magenta, and green lines, respectively), while the thin line shows the NFW (EXP) profile for
  . The numbers highlight various radii at which the points on the
  relation are calculated. At large r, the NFW (EXP) model (cyan line) and in fact all models with exponential baryonic profiles and dark profiles that fall off as
  eventually fall off the RAR at large radius. At small r, those same models do not deviate from the RAR because both profiles approach constant values as
  . Profiles that have cores in both the dark and baryonic component (similar to the CNFW-CIS, thick dark magenta line) deviate from the RAR by tracing the 1:1 line because both observed and baryonic acceleration profiles go
  at small radii. Models with cored baryonic profiles and cuspy dark profiles (e.g., HERN-CIS, thick green line) have
  at the center while
  .
.
Download figure:
Standard image High-resolution imageConversely, consider  : at large radii
  so
so ={V}_{c}^{2}(r)/{V}_{c}^{2}({r}_{0})$](https://content.cld.iop.org/journals/0004-637X/882/1/46/revision1/apjab311bieqn206.gif) , and deviations are maximized if the total density profile (dominated by DM) is falling steeper than isothermal (so rotation curves decline, instead of being flat). This can be seen in the thin cyan line of Figure 4, where the RAR is plotted for a model galaxy with the fiducial parameters and the NFW (EXP) profile for DM (baryonic component) over the radial range
, and deviations are maximized if the total density profile (dominated by DM) is falling steeper than isothermal (so rotation curves decline, instead of being flat). This can be seen in the thin cyan line of Figure 4, where the RAR is plotted for a model galaxy with the fiducial parameters and the NFW (EXP) profile for DM (baryonic component) over the radial range  . Galaxies with DM density profiles that fall off at least as steeply as
  and exponential baryonic profiles have
  , so
, so  deviates progressively from the RAR at larger r. However, the NFW Vc falls very slowly: for
  (where Vc is flat), deviation from the RAR by a factor
  requires going to
  . Given the extensive radial range (
 ) plotted in Figure 2, it is remarkable that the curves all fall within
  of the observed RAR simply by requiring them to lie on BTFR at a single radius.
5. Discussion and Conclusions
We have shown that the observed shape/slope, normalization, and scatter of the RAR derive directly from the observed slope, normalization, and scatter of the BTFR, at least for the large majority of points on the RAR curve, where the baryonic mass is converged. The high-acceleration portion of the relation, where  , merely tracks baryon-dominated regions. The low-acceleration portion follows directly from the observed relation between Vc and
  (the BTFR): although the RAR includes each radial point separately (i.e., Vc(r), not just
  ), the fact that circular velocity is (by definition) smooth (since it depends the integral of enclosed mass) means that if one requires galaxies lie on the BTFR, they automatically produce the RAR from scales ∼1–100 kpc, even if baryonic or DM mass profiles or mass ratios vary wildly. The scatter in the RAR is apparently reduced from the BTFR because the parameters plotted are the square root of the BTFR parameters. As first demonstrated by van den Bosch & Dalcanton (2000), the characteristic acceleration scale,
  , naturally arises within a ΛCDM framework for galaxies that obey the BTFR, without the need for significant fine-tuning. We do not speculate on the physical origin of the acceleration scale
  that separates these, but show that it is mathematically equivalent to the BTFR normalization (
 ), and its seemingly universal value is merely a reflection of the low scatter in the BTFR (which sets the scatter in the normalization of
  ).
).
Other previous studies (Di Cintio & Lelli 2016; Navarro et al. 2017) argued that galaxies that obey the observed scaling relations between  ,
,  , profile shape, and
  , in standard ΛCDM NFW-type DM halos, naturally reproduce the RAR, while others have shown that some cosmological ΛCDM galaxy formation simulations reproduce the RAR (e.g., Keller & Wadsley 2017; Ludlow et al. 2017). Our study shows that, once the BTFR is satisfied, the additional effect scatter in known scaling relations has on the scatter in the RAR is insignificant. These models work because their galaxies obey BTFR; moreover, we consider a much broader range of parameters and show that many nonstandard galaxy or DM properties would also agree with the observed RAR, if they obeyed the same BTFR. To the extent that some models fail to reproduce the RAR (e.g., Ludlow et al. 2017 and references therein), it can be directly identified with a failure to reproduce the BTFR.
We do show it is possible for a galaxy to lie on BTFR, but deviate from the RAR at sufficiently low accelerations (high-acceleration deviations would require nonstandard DM that could reach very high densities). This can occur either (1) in the very centers of cored, DM-dominated galaxies, or (2) at very large radii in NFW halos. However, if the BTFR still applies around the effective radius, this requires measurements of the rotation curve either at very small radii (subkiloparsec,  ) or very large radii (
 ), respectively.
Of course, if the galaxy does not lie on the extrapolated BTFR (at the measured radii), it will not lie on the same RAR. There is likely already evidence for this in the data: L17 (Figures 10 and 11) show that their lowest-mass dSph sample deviates significantly (with constant  independent of
  ). For most of these systems, the measured Vc lies well within the rising portion of the rotation curve if an NFW halo is assumed; for a DM-dominated NFW halo at
  /
/ /
/![$[{r}_{s}^{2}\,2\,\{\mathrm{ln}(1\,+\,c)\,-\,c/(1\,+\,c)\}]\,\approx \,1.4\,\times {10}^{-11}$](https://content.cld.iop.org/journals/0004-637X/882/1/46/revision1/apjab311bieqn232.gif)
 (where the latter uses the observed scalings from Section 3; note
  from the same scalings at these masses)—this agrees surprisingly well with the observed relation.
C.W. is supported by the Lee A. DuBridge Postdoctoral Scholarship in Astrophysics. Support for P.F.H. was provided by an Alfred P. Sloan Research Fellowship, NSF Collaborative Research Grant #1715847, and CAREER grant #1455342. Part of the research was carried out at the Jet Propulsion Laboratory, California Institute of Technology, under a contract with the National Aeronautics and Space Administration.
Footnotes
- 3
The measured value of the BTFR exponent can vary widely in the literature, depending on the specific method used to fit the data (Bradford et al. 2016). We specifically use an exponent of b = 4 because it is the value derived from the very same set of galaxies used in the RAR calculation (McGaugh et al. 2016, L17). Furthermore, changing the exponent is equivalent to changing the BTFR normalization at fixed
 , which we explore in models BTF-.
 - 4
As gas-dominated systems are of the most interest, we take the scatter in
to be the scatter in , which we take from the estimator in Zhang et al. (2009). - 5
Choosing
, we can use the abundance-matching relation from Garrison-Kimmel et al. (2014) (identical to Behroozi et al. 2013 at high mass) to determine . Then (Papastergis et al. 2012) gives (using the same He correction as used in the RAR observations themselves). For massive galaxies () (Lange et al. 2015), and for dwarfs () (Di Cintio & Lelli 2016), where for stars/gas, and we take the mass average for . At fixed , follows immediately from cosmology (here concordance ΛCDM) and (Dutton & Macciò 2014). For an () halo this gives the fiducial parameters in Table 1. - 6
Numerically, we calculate
from the initial profile guess, noting that if we re-normalize the total DM+baryonic masses by a uniform factor f2, we re-normalize by f, so setting we obtain . - 7
Note the scaling above within the core.















