Abstract
We present the discovery and multiwavelength characterization of SRGA J181414.6-225604, a Galactic hard X-ray transient discovered during the ongoing SRG/ART-XC sky survey. Using data from the Palomar Gattini-IR survey, we identify a spatially and temporally coincident variable infrared (IR) source, IRAS 18111-2257, and classify it as a very-late-type (M7–M8), long-period (1502 ± 24 days), and luminous (MK ≈ −9.9 ± 0.2) O-rich Mira donor star located at a distance of ≈14.6+2.9−2.3 kpc. Combining multicolor photometric data over the last ≈25 yr, we show that the IR counterpart underwent a recent (starting ≈800 days before the X-ray flare) enhanced mass-loss (reaching ≈2.1 × 10⁻⁵ M⊙ yr−1) episode, resulting in an expanding dust shell obscuring the underlying star. Multi-epoch follow-up observations from Swift, NICER, and NuSTAR reveal a ≈200 day long X-ray outburst reaching a peak luminosity of LX ≈ 2.5 × 1036 erg s−1, characterized by a heavily absorbed (NH ≈ 6 × 1022 cm−2) X-ray spectrum consistent with an optically thick Comptonized plasma. The X-ray spectral and timing behavior suggest the presence of clumpy wind accretion, together with a dense ionized nebula overabundant in silicate material surrounding the compact object. Together, we show that SRGA J181414.6-225604 is a new symbiotic X-ray binary in outburst, triggered by an intense dust-formation episode of a highly evolved donor. Our results offer the first direct confirmation for the speculated connection between enhanced late-stage donor mass loss and the active lifetimes of symbiotic X-ray binaries.
Original content from this work may be used under the terms of the Creative Commons Attribution 4.0 licence. Any further distribution of this work must maintain attribution to the author(s) and the title of the work, journal citation and DOI.
1. Introduction
Symbiotic binaries consist of a compact object—a white dwarf (WD), neutron star (NS), or black hole (BH)—accreting from the wind of a late-type giant companion (Kenyon 1986; Belczyński et al. 2000). They are broadly classified into two groups, based on their near-infrared (NIR) spectral energy distributions (SEDs): (i) the S-type systems, exhibiting SEDs characteristic of a cool photosphere, with temperature Teff ≈ 3000−4000 K; and (ii) the D-type systems, with SEDs characteristic of warm dust, with Teff ≈ 1000 K (Allen & Glass 1974; Webster & Allen 1975). The recent compilation of Akras et al. (2019) suggests that only ≈15% of known symbiotic stars are identified with D-type SEDs. The spectral classification of symbiotics (Mürset & Schmid 1999), together with light curves from photometric surveys (Whitelock 1987; Gromadzki et al. 2009), suggest that D-type systems contain late-type Mira variables as donor stars (Phillips 2007; Angeloni et al. 2010). Mira symbiotics are known to exhibit long pulsation periods (Whitelock 1987) and thick dust shells that give rise to their dust-dominated SEDs (Muerset et al. 1996; Angeloni et al. 2010).
Symbiotic X-ray binaries (SyXRBs; Masetti et al. 2006; see Kuranov et al. 2015 for a review) form a subclass of the symbiotic binary population, exhibiting X-ray emission extending up to high energies (E ≳ 2.4 keV), produced by optically thick Comptonizing plasma (Masetti et al. 2007b; Luna et al. 2013; Lutovinov et al. 2020) from accretion onto an NS or a BH. SyXRBs are relatively rare among Galactic XRBs, with only about a dozen systems known (Yungelson et al. 2019), all of them believed to contain NSs. The accretion of the companion wind onto the compact object produces relatively low average X-ray luminosity (LX ∼ 1032−36 erg s−1), rendering them difficult to detect in shallow X-ray surveys. Unlike their WD counterparts, the survival of a wide-orbit companion during the supernova (SN) that created the compact object requires fine-tuned mass-loss and kick parameters (Iben et al. 1995), making SyXRBs unique probes of extremes in binary evolution physics.
Binary population synthesis models predict that there are ≈50−1000 SyXRBs in the Galaxy (Lü et al. 2012; Kuranov et al. 2015; Yungelson et al. 2019), compared to roughly a dozen known candidate and confirmed systems. It is generally understood that SyXRBs become conspicuous in the X-ray sky only for a brief fraction of the binary lifetime, when the donor produces a dense wind, a fraction of which is captured by the compact object (Hinkle et al. 2006). The most well known SyXRB, GX 1+4 (LX ∼ 1037−38 erg s−1), indeed has a very-late-type (M6-III) donor at the tip of the red giant branch (Chakrabarty & Roche 1997). While the first SyXRBs were identified as persistent and highly variable X-ray sources, repeated scans of the hard X-ray sky from all-sky surveys are offering new avenues for finding outbursting sources, where the persistent emission is too faint to be detected. Although an understanding of these transient flares (lasting ∼weeks to ∼years) is crucial to establishing their active lifetimes and Galactic demographics, their nature remains poorly constrained.
Previous speculations attribute the accretion variability to the motion of the compact object in an eccentric orbit (Pereira et al. 1999; Masetti et al. 2002; Iłkiewicz et al. 2017), to changes in the donor star's mass-loss properties (Galloway et al. 2002; Masetti et al. 2002; Bozzo et al. 2018), or to changes in the angular momentum of the accreted material near the NS magnetosphere (Postnov et al. 2010; Marcu et al. 2011; Shakura et al. 2012). While temporal characterization of the donor stars offers a promising pathway for directly testing these scenarios, the intrinsically red donor SEDs, together with the heavy dust reddening, preclude detailed optical investigations of the donor variability and its impact on the accretion rate onto the compact object. The timely emergence of deep all-sky hard X-ray surveys, together with NIR time-domain surveys, offers a new opportunity for understanding this population.
In this paper, we present the discovery of SRGA J181414.6-225604, a hard X-ray transient discovered by the Mikhail Pavlinsky ART-XC instrument on board the Spektr-RG (SRG) satellite. Combining archival photometry from time-domain surveys and extensive follow-up in the X-ray, optical, and IR bands, we establish the source as a new D-type Galactic SyXRB, triggered by a recent intense mass-loss episode of a highly evolved Mira-like variable. Section 2 presents the details of the discovery, counterpart identification, and follow-up observations. Section 3 presents an analysis of the spectral and temporal behavior of the X-ray transient. In Section 4, we constrain the nature of the donor star with optical/IR photometry and spectroscopy, while we present evidence for a recent massive dust-obscuration episode in Section 5. We end with a discussion of the nature of the binary system in Section 6, and summarize our findings in Section 7.
2. Observations and Data Reduction
2.1. ART-XC Discovery and IR Identification
The SRG mission (Sunyaev et al. 2021), equipped with the Mikhail Pavlinsky ART-XC (Pavlinsky et al. 2021) and eROSITA (Predehl et al. 2021) instruments, is carrying out the deepest all-sky X-ray survey, revisiting the entire sky every ≈6 months for a total duration of ≈4 yr. On UT 2021-04-01, the ART-XC instrument discovered a bright X-ray source at J2000 coordinates α= 18:14:14, δ = −22:56:04, with a 4–12 keV X-ray flux of ≈4 × 10⁻¹¹ erg cm−2 s−1 (Mereminskiy et al. 2021). The source was localized to a 90% error radius of ≈15″. The source was not individually detected in the two previous ART-XC surveys, to a depth of ≈8 × 10⁻¹² erg cm−2 s−1 in the 4–12 keV band, but it is marginally detected by combining the two epochs (see Section 2.4). The source was also detected by the eROSITA instrument, with an absorbed and hard X-ray spectrum at a flux level of ≈6.4 × 10⁻¹² erg cm−2 s−1 in the 0.5–6 keV band. The eROSITA instrument provided an improved localization of α = 18:14:15.1, δ = −22:56:17.0, with a 95% error radius of ≈9″.
Following the discovery of the X-ray transient, we identified a highly variable IR counterpart within the eROSITA localization region, at a magnitude of J ≈ 10.2−12.5 mag, in the data from the Palomar Gattini-IR (PGIR) NIR time-domain survey (Moore & Kasliwal 2019; De et al. 2020a). The variable NIR source (also known as 2MASS J18141475-2256195) was spatially coincident with the bright mid-infrared (MIR) source IRAS 18111-2257, listed in the SIMBAD database.
15
The PGIR data revealed a long-term NIR brightening coincident with the X-ray flare, suggesting a likely association (De et al. 2021). The association was subsequently supported by a follow-up observation with the Neil Gehrels Swift Observatory (Swift), which localized the X-ray transient to within 08 of the IR source (Heinke et al. 2021).
On UT 2021-04-07, we obtained a very low-resolution optical spectrum of the source with the SED Machine Spectrograph (Blagorodnova et al. 2018) on the Palomar 60 inch telescope. The spectrum was reduced with the pysedm pipeline (Rigault et al. 2019), and exhibited a steep red continuum with broad absorption features consistent with VO and TiO absorption in late-type stars, suggesting that the source was a likely new Galactic SyXRB in outburst. Figure 1 shows an NIR image of the localization region of the X-ray transient, together with the best derived positions from the X-ray discovery and follow-up observations.
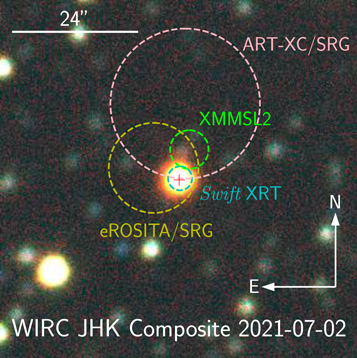
Figure 1. NIR composite false-color image of the field of IRAS 18111-2257, obtained with WIRC on P200. The image shows the 90% confidence localization regions for SRGA J181414.6-225604 reported by ART-XC and eROSITA at the time of discovery, as well as the position obtained from the Swift XRT follow-up campaign. The image is centered on IRAS 18111-2257 (shown with a red cross), which is consistent within 04 of the best-fit location from the Swift XRT observations. The green circle shows the 1σ localization region of a coincident X-ray source reported in the XMM Newton Slew Survey catalog (see the text).
Download figure:
Standard image High-resolution image2.2. Optical/IR Photometry
The highly reddened NIR counterpart of SRGA J181414.6-225604, IRAS 18111-2257, was monitored as part of the regular survey operations of PGIR, and we derived a J-band light curve of the source, as described in the Appendix. In addition, we searched all the publicly available data from time-domain surveys to derive multicolor light curves of the counterpart. As described in the Appendix, the variable source is detected in the o filter of the Asteroid Terrestrial-impact Last Alert System (ATLAS; Tonry et al. 2018) survey, the ri filters of the Zwicky Transient Facility (ZTF; Bellm et al. 2019) survey, the grizy filters of the PanSTARRS (PS1; Chambers et al. 2016) survey, and in the Wide-field Infrared Survey Explorer (WISE) surveys (Wright et al. 2010; Mainzer et al. 2011). Figure 2 shows the optical/IR photometric evolution of the counterpart during 2019–2021, using data from PGIR and ATLAS, which have the highest-cadence observations around the X-ray brightening of the source.
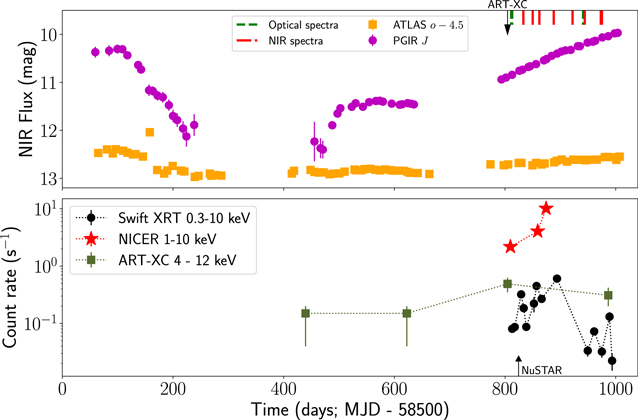
Figure 2. Multiwavelength light curves of SRGA J181414.6-225604 during 2019–2021. Top panel: NIR photometric evolution of the identified counterpart from the PGIR and ATLAS surveys. The black arrow shows the epoch of the first identification of the transient from ART-XC, coincident with the onset of an NIR brightening. Epochs of optical/NIR spectroscopy are also shown. Bottom panel: the X-ray count-rate evolution of SRGA J181414.6-225604, using the data from the SRG survey, as well as the follow-up data from Swift XRT and NICER. The NuSTAR observation epoch is shown with the black arrow on the lower axis.
Download figure:
Standard image High-resolution imageOn UT 2021-04-09, we obtained additional gri follow-up photometry with the rainbow camera on the Palomar 60 inch telescope. The source was only detected in the i filter. On UT 2021-07-02, we obtained multicolor NIR photometry of the source in the J, H, and Ks bands, using the Wide-field Infrared Camera (WIRC; Wilson et al. 2003) on the Palomar 200 inch telescope. We obtained a series of dithered exposures of ≈0.9 s each, which were reduced, stacked, and photometrically calibrated using the pipeline described in De et al. (2020a). Figure 1 shows the multicolor composite NIR image of the source obtained from the WIRC data, and Table 1 provides the complete ground-based photometric data set. Table 2 provides the photometric data set derived from space-based archival/follow-up observations.
Table 1. Ground-based Photometry of IRAS 18111-2257, the Infrared Counterpart of SRGA J181414.6-225604
| MJD | Flux | Instrument/Filter |
|---|---|---|
| Mag | ||
| 58011.29 | 16.46 ± 0.01 | ATLAS/o |
| 58019.28 | 16.34 ± 0.03 | ATLAS/o |
| 58031.73 | 16.48 ± 0.01 | ATLAS/o |
| 58037.71 | 16.41 ± 0.01 | ATLAS/o |
| 58047.89 | 16.39 ± 0.01 | ATLAS/o |
| 58057.49 | 16.41 ± 0.02 | ATLAS/o |
| 58066.53 | 16.40 ± 0.02 | ATLAS/o |
| 58158.67 | 16.33 ± 0.09 | ATLAS/o |
| 58183.22 | 16.43 ± 0.02 | ATLAS/o |
| 58207.51 | 16.38 ± 0.02 | ATLAS/o |
Note. The upper limits are denoted at 3σ confidence. The entire table will be available electronically upon publication.
Only a portion of this table is shown here to demonstrate its form and content. A machine-readable version of the full table is available.
Download table as: DataTypeset image
Table 2. Multi-epoch Photometry of IRAS 18111-2257 from Space-based Instruments
| MJD | Flux | Instrument/Filter |
|---|---|---|
| Mag | ||
| 55279.01 | 5.46 ± 0.15 | WISE/W1 |
| 55461.39 | 5.72 ± 0.15 | WISE/W1 |
| 56743.67 | 5.54 ± 0.24 | WISE/W1 |
| 56923.43 | 6.30 ± 0.16 | WISE/W1 |
| 57105.59 | 6.31 ± 0.19 | WISE/W1 |
| 57282.40 | 5.92 ± 0.17 | WISE/W1 |
| 57469.96 | 5.84 ± 0.18 | WISE/W1 |
| 57644.34 | 5.52 ± 0.21 | WISE/W1 |
| 57837.06 | 5.33 ± 0.22 | WISE/W1 |
| 58004.57 | 5.65 ± 0.19 | WISE/W1 |
Note. The entire table will be available electronically upon publication.
Only a portion of this table is shown here to demonstrate its form and content. A machine-readable version of the full table is available.
Download table as: DataTypeset image
The source was also observed by several surveys prior to 2010, including the original identification of the bright MIR source by the Infrared Astronomical Satellite (IRAS; Neugebauer et al. 1984; Abrahamyan et al. 2015), the Midcourse Space Experiment (MSX; Egan et al. 2003), the Two Micron All-sky Survey (2MASS; Skrutskie et al. 2006), the Deep Near-Infrared Survey of the Southern Sky (DENIS), 16 AKARI (Murakami et al. 2007), and the Spitzer Galactic Legacy Infrared Mid-Plane Survey (GLIMPSE; Benjamin et al. 2003). In Table 3, we provide the reported archival fluxes of the source, along with the approximate dates of observation.
Table 3. Archival Photometry of IRAS 18111-2257
| Survey | Year | Band | Flux (Jy) |
|---|---|---|---|
| IRAS | ≈1983 | 12 μm | 1.77 |
| IRAS | ≈1983 | 25 μm | 0.68 |
| IRAS | ≈1983 | 60 μm | <7.44 |
| IRAS | ≈1983 | 100 μm | <106 |
| MSX_A | ≈1996 | 8.28 μm | 0.98 ± 0.05 |
| MSX_C | ≈1996 | 12.1 μm | 1.21 ± 0.09 |
| MSX_D | ≈1996 | 14.6 μm | 0.80 ± 0.07 |
| 2MASS | ≈1998 | J | 0.74 ± 0.02 |
| 2MASS | ≈1998 | H | 1.73 ± 0.06 |
| 2MASS | ≈1998 | K | 2.30 ± 0.04 |
| DENIS | ≈1998 | J | 0.49 ± 0.04 |
| DENIS | ≈1998 | K | 5.59 ± 1.29 |
| AKARI | ≈2007 | L18 | 0.56 ± 0.02 |
| GLIMPSE | ≈2006 | 4.5μm | 1.03 ± 0.05 |
| GLIMPSE | ≈2006 | 8.0μm | 0.77 ± 0.02 |
Note. In cases where the published magnitudes were available, the magnitudes were converted to fluxes in Jansky, using the published zeropoint fluxes for the respective surveys.
Download table as: ASCIITypeset image
2.3. Optical/IR Spectroscopy
We obtained three epochs of follow-up optical spectroscopy of the source using the Wide-field Spectrograph (WiFeS; Dopita et al. 2010) on the Australian National University (ANU) 2.3 m telescope at Siding Spring Observatory and the Double Spectrograph (DBSP; Oke & Gunn 1982) on the Palomar 200 inch telescope. The WiFeS data were reduced using the PyWiFeS pipeline (Childress et al. 2014), and the DBSP data were reduced using the pyraf-dbsp pipeline (Bellm & Sesar 2016). We obtained a total of eight epochs of NIR spectroscopy using the TripleSpec spectrograph on the Palomar 200 inch telescope (Herter et al. 2008), SpeX on the NASA Infrared Telescope Facility (Rayner et al. 2003; Program 2021A083, PI: De), and the Folded-port Infrared Echellete (FIRE; Simcoe et al. 2008, 2010) spectrograph on the Magellan 6.5 m telescope. The TripleSpec and SpeX data were reduced using the spextool pipeline (Cushing et al. 2004), while telluric and flux calibration were performed using the xtellcor package (Vacca et al. 2003). The FIRE data were reduced, flux-calibrated, and corrected for telluric absorption using the pypeit package (Prochaska et al. 2020). Table 4 summarizes all the epochs of spectroscopy of the source, which are shown by the vertical lines in Figure 2 along the photometric evolution.
Table 4. Spectroscopic Follow-up of SRGA J181414.6-225604 in the Optical and NIR Bands
| UT Date | Instrument | λ Range | R |
|---|---|---|---|
| μm | |||
| 2021-04-08 | ANU 2.3 m + WiFeS | 0.4–0.95 | 3000 |
| 2021-04-09 | P200 + DBSP | 0.36–1.00 | 1000 |
| 2021-04-29 | P200 + TSpec | 1.00–2.46 | 2600 |
| 2021-05-16 | IRTF + SpeX | 0.75–2.55 | 2000 |
| 2021-05-16 | IRTF + SpeX | 2.00–5.35 | 2000 |
| 2021-05-28 | P200 + TSpec | 1.00–2.46 | 2600 |
| 2021-06-23 | IRTF + SpeX | 0.75–2.55 | 2000 |
| 2021-07-27 | P200 + TSpec | 1.00–2.46 | 2600 |
| 2021-08-15 | P200 + DBSP | 0.36–1.00 | 1000 |
| 2021-08-18 | Magellan + FIRE | 0.85–2.49 | 5000 |
| 2021-09-16 | P200 + TSpec | 1.00–2.46 | 2600 |
| 2021-09-18 | Magellan + FIRE | 0.85–2.49 | 5000 |
Download table as: ASCIITypeset image
2.4. X-Ray Coverage from Surveys
As noted in Mereminskiy et al. (2021), an X-ray source is reported in the XMM Newton Slew Survey catalog (Saxton et al. 2008), within the ART-XC localization, as XMMSL2 J181414.6-225613. The reported location of the XMM Slew Survey source, along with its uncertainty, is shown in the NIR image in Figure 1. The spatial coincidence (within ≈2σ ≈ 7 ″) suggests that XMMSL2 J181414.6-225613 is likely associated with SRGA J181414.6-225604. To derive the complete history of the X-ray data at this position, we used the High Energy Light Curve Generator 17 (Saxton et al. 2022) at the location of the IR counterpart. The source position was covered over four epochs in the XMM Slew Surveys, including two epochs of X-ray detection in 2010 and 2015, respectively. The source was also covered by the ROSAT (Voges et al. 1999) and INTEGRAL (Krivonos et al. 2022) sky surveys, but not detected. We summarize the archival X-ray coverage in Table 5.
Table 5. Long-term X-Ray Flux Constraints on SRGA J181414.6-225604 from Wide-area Surveys
| Mission | Date | Energy Band | Count Rate | Observed Flux |
|---|---|---|---|---|
| MJD | keV | ct s−1 | 10−11 erg cm−2 s−1 | |
| ROSAT | 49240.53 | 0.2–2 | <0.04 | <0.11 |
| INTEGRAL | 52640–58850 | 17–60 | ⋯ | <0.3 |
| XMM SL | 52921.62 | 0.2–12 | <1.22 | <1.57 |
| 55295.28 | 0.2–12 | 0.87+0.42 −0.42 | 1.12+0.54 −0.54 | |
| 56730.72 | 0.2–12 | <0.89 | <1.15 | |
| 57279.50 | 0.2–12 | 1.66+0.56 −0.56 | 2.14+0.72 −0.72 | |
| SRG/ART-XC | 58943-59130 | 4–12 | 0.15+0.05 −0.10 | 0.6−0.3 +0.2 |
| 59305-59306 | 4–12 | 0.49+0.14 −0.14 | 2.2+0.6 −0.6 | |
| 59489-59490 | 4–12 | 0.31+0.11 −0.11 | 1.4−0.5 +0.5 |
Note. Count rates were converted to observed X-ray fluxes in the same energy range, assuming a power-law spectrum with a photon index Γ = 1.5 and a column density of NH = 6 × 1022 cm−2.
Download table as: ASCIITypeset image
During the all-sky survey, ART-XC covers the same sky position nearly every 6 months. We reprocessed all the data covering the SRGA J181414.6-225604 position, using the ART-XC pipeline artproducts v0.9 and CALDB version 20200401. The source is clearly detected in the 4–12 keV energy band during the third and fourth surveys (2021 April 1–2 and October 2–3). Although initially undetected, forced photometry of the stacked data from the first two surveys also provides a low-significance (≈3σ) detection of the source at a flux level of ≈6−3 +2 × 10⁻¹² erg cm−2 s−1. We are unable to assess the source variability during the first two surveys, due to its faint flux. Due to the small-number photons detected from the source, we adopt a simple spectral model and calculate all fluxes assuming that the source spectrum is similar to that of the Crab Nebula (for which we used the absorbed power-law model from Madsen et al. 2017). The source flux and its uncertainty intervals are estimated using Bayesian inference for the observed count rate per pixel, given the measured background count rate and the best estimates for the instrument point-spread function (PSF) and vignetting.
2.5. Swift Follow-up
Following the initial detection of SRGA J181414.6-225604 with Swift (Heinke et al. 2021), we requested Target of Opportunity (ToO) monitoring observations (Target ID 14257; PI: De) using the X-ray Telescope (XRT; Burrows et al. 2005) on board Swift (Gehrels et al. 2004). We generated the X-ray light curve of the source using the automated online tool 18 (Evans et al. 2009). The event data were binned over ≈2 days, to track the long-term X-ray evolution of the source, and the light curve is shown in Figure 2. The observation log and derived count rates are given in Table 6. In addition, we examined images from the Ultraviolet Optical Telescope (UVOT; Roming et al. 2005) obtained during the XRT observations. The source is undetected in all of the UVOT images, as expected, given its highly reddened nature. The upper limits are listed in Table 1.
Table 6. X-Ray Follow-up of SRGA J181414.6-225604
| Instrument | Observation ID | MJD | Count Rate | ET |
|---|---|---|---|---|
| ct s−1 | ks | |||
| NICER | 4202090101-2 | 59309.67 | 2.18 ± 0.01 | 11.5 |
| Swift XRT | 14257001 | 59312.87 | 0.08 ± 0.01 | 0.9 |
| Swift XRT | 14257002 | 59317.50 | 0.09 ± 0.01 | 0.7 |
| NuSTAR | 90701314002 | 59324.47 | 1.33 ± 0.01 | 36.3 |
| Swift XRT | 14257004 | 59329.07 | 0.32 ± 0.03 | 0.7 |
| Swift XRT | 14257005 | 59333.70 | 0.18 ± 0.02 | 0.9 |
| Swift XRT | 14257006 | 59338.33 | 0.09 ± 0.01 | 0.8 |
| Swift XRT | 14257008 | 59352.22 | 0.22 ± 0.07 | 0.2 |
| Swift XRT | 14257009 | 59356.85 | 0.45 ± 0.04 | 0.9 |
| NICER | 4202090103-6 | 59358.95 | 4.06 ± 0.03 | 8.2 |
| Swift XRT | 14257011 | 59366.11 | 0.27 ± 0.03 | 0.6 |
| NICER | 4202090107-8 | 59374.19 | 10.14 ± 0.04 | 7.5 |
| Swift XRT | 14257012 | 59393.88 | 0.61 ± 0.06 | 0.4 |
| Swift XRT | 14257014 | 59449.44 | 0.03 ± 0.01 | 0.9 |
| Swift XRT | 14257015 | 59461.01 | 0.07 ± 0.01 | 0.8 |
| Swift XRT | 14257016 | 59474.90 | 0.03 ± 0.01 | 1.0 |
| Swift XRT | 14257017 | 59488.79 | 0.13 ± 0.03 | 0.2 |
| Swift XRT | 14257018 | 59493.42 | 0.02 ± 0.01 | 0.7 |
Note. We tabulate the instrument, the average date of the observation (we binned multiple visits of NICER obtained within ≈4 days), the estimated count rate, and the total exposure time (ET).
Download table as: ASCIITypeset image
2.6. NICER Follow-up
SRGA J181414.6-225604 was observed by the X-ray Timing Instrument on board the Neutron Star Interior Composition Explorer (NICER; Gendreau et al. 2016) shortly after its discovery (Bult & Gendreau 2021). Following the brightening of the X-ray transient detected in Swift, we requested two additional epochs of ToO follow-up around the peak of the X-ray flare via DDT requests. Table 6 provides an overview of the NICER observations. We started our data reduction with the unfiltered event lists (ufa files), which we processed using the nicerl2 task, as per the guidelines given in the NICER data analysis threads. 19 We used HEASoft version 6.29 c with NICER calibration data (xti20210707). For nicerl2, we used default values for all the parameters, except for underonly_range, overonly_range, and overonly_expr, which were set to “−”, “−”, and NONE, respectively. This retains all the good time intervals (GTIs) that could have high optical light leak and/or particle background, but are later screened based on the criteria that hbgcut < 0.05 and s0cut < 2.0, as recommended by Remillard et al. (2022). Here, hbgcut and s0cut represent the net count rates in the 13−15 keV and 0.0−0.2 keV bands, respectively, after subtracting the background contribution.
Allowing data with all possible values of undershoots and overshoots initially, then screening later based on hbgcut and s0cut values, would ensure that we were not inadvertently excluding any good exposures. This procedure yielded a total exposure of roughly 26 ks. NICER consists of 52 co-aligned detectors known as focal plane modules (FPMs). During a given GTI, some detectors can be “hot/bad,” in the sense that they behave anomalously compared to the rest of the FPMs. This can happen temporarily, due to optical light leakage into these detectors or due to other factors. A given detector is marked as hot/bad for a given GTI if: (1) its observed low-energy noise peak, i.e., 0.0−0.2 keV count rate, is more than four standard deviations above the median 0.0−0.2 keV value; or (2) the observed in-band 0.4−1.0 keV count rate is more than two standard deviations above the median 0.4−1.0 keV of all detectors. We then generate combined responses for the GTI excluding these hot/bad detectors. We use the ni3C50 background model (Remillard et al. 2022) to estimate the background. The final background-subtracted light curve normalized to 50 FPMs is shown in Figure 2.
2.7. NuSTAR Follow-up
We obtained one epoch of Director’s Discretionary Time (DDT) ToO follow-up (PI: K. De; Sequence ID 90701314002) of SRGA J181414.6-225604 using the NuSTAR hard X-ray telescope (Harrison et al. 2013). Table 6 provides a summary of the NuSTAR observation. The data from the two FPMS were processed using the NuSTAR Data Analysis Software (nustardas) V2.1.1 and the 20211202 CALDB. The nupipeline command was used to produce cleaned event files, using the default parameters. Barycentric correction was performed on the event files, using the barycorr task and the clock offset correction file, version V128 (Bachetti et al. 2021). Light curves and spectra for the source were generated by extracting events within a radius of 60″, centered at the position of the source, using nuproducts. Background events were selected from a region of 100″, located away from the source in the same part of the detector. Light curves were generated with the Stingray package V0.3 (Bachetti et al. 2021), using the barycentered event lists.
3. The X-Ray Characteristics
3.1. Broadband Spectral Analysis
We begin the discussion of the X-ray properties of SRGA J181414.6-225604 with the broadband spectral analysis. We use the NICER and NuSTAR observations near the first detection of the outburst in 2021 April (see Table 6) to perform a joint fit. Although not strictly simultaneous, there is little spectral variability between the NICER and NuSTAR observations, and we fit them together to well constrain the broadband continuum and absorption column density. The fitting was carried out using the xspec package (Arnaud 1996), version 12.12.0. For NuSTAR, the individual FPMA and FPMB spectra produced by nuproducts were grouped with ftgrouppha, to have at least 20 counts per bin in order to fit them with χ2 statistics. We included data in the 3.0−30.0 keV energy range, since the spectra/observations become background-dominated at higher energies. The NICER data were similarly binned to include at least 20 counts per bin. We include NICER data in the 0.7–8.0 keV range, since the source is heavily absorbed at lower energies and comparable to the background at higher energies. The uncertainties of the model parameters are presented at the 68% confidence level. The derived parameters for the models are discussed below and given in Table 7.
Table 7. Comparison of the Best-fit Parameters Used to Model the Broadband X-Ray Spectrum of SRGA J181414.6-225604
| Model 2: edge∗Tbabs∗(pcfabs∗(highecut∗powerlaw + Gauss) + apec) | |||
|---|---|---|---|
| χ2/d.o.f. = 257.9/226, Pnull = 0.06 | |||
| Component | Parameter | Value | Unit |
| const | CNi | 0.88+0.02 −0.02 | ⋯ |
| const | CNuB | 1.04+0.02 −0.02 | ⋯ |
| edge | E | 1.844 (fixed) | keV |
| edge | τ |

| ⋯ |
| Tbabs | NH |

| 1022 cm−2 |
| pcfabs | NH |

| 1022 cm−2 |
| pcfabs | CF |

| ⋯ |
| highecut | Ecut |

| keV |
| highecut | Efold |

| keV |
| powerlaw | Γ |

| ⋯ |
| Gauss | LineE |

| keV |
| Gauss | Sigma |

| keV |
| apec | kT |

| keV |
| apec | norm |

| cm−5 |
| Model 3: edge∗Tbabs∗(pcfabs∗(compTT + Gauss) + apec) | |||
| χ2/d.o.f. = 250.4/223, Pnull = 0.10 | |||
| Component | Parameter | Value | Unit |
| const | CNi |

| ⋯ |
| const | CNuB |

| ⋯ |
| edge | E | 1.844 (fixed) | keV |
| edge | τ |

| ⋯ |
| Tbabs | NH |

| 1022 cm−2 |
| pcfabs | NH |

| 1022 cm−2 |
| pcfabs | CF |

| ⋯ |
| compTT | T0 |

| keV |
| compTT | kT |

| keV |
| compTT | τ |

| ⋯ |
| Gauss | LineE |

| keV |
| Gauss | Sigma |

| keV |
| apec | kT |

| keV |
| apec | norm |

| cm−5 |
Note. For each model, the NuSTAR FPMA constant was set to 1, while the scaling constants for the NICER and NuSTAR FPMB spectra were allowed to vary. We show the best-fit χ2 values and null-hypothesis probability for each model above the parameter tables. CF denotes the covering fraction for the pcfabs model. The apec model norm is related to the emission measure (EM) of the ionized region as  , where D is the distance to the source.
Download table as: ASCIITypeset image
A preliminary analysis of the X-ray spectra suggested a heavily absorbed power-law spectrum for SRGA J181414.6-225604 (Bult & Gendreau 2021; Heinke et al. 2021; Mereminskiy et al. 2021). Bult & Gendreau (2021) also noted a low-energy excess in the NICER spectra, which was attributed to a possible unrelated source in the field of view. However, the Swift XRT images do not show any other source within the NICER field. We thus first attempted to fit the 0.7−30.0 keV spectrum using a simple absorbed power-law model (Tbabs ∗ powerlaw), using the wilms interstellar abundances (Wilms et al. 2000). We allowed for a varying normalization between NICER and NuSTAR, and the standard cross-calibration constant between the two NuSTAR modules. The resulting model is constant ∗ Tbabs ∗ powerlaw (Model 1). We performed spectral fitting with χ2 minimization, and the resulting residuals are shown in Figure 3. The best-fit model suggests a high column density of NH ≈ 7.2 ×1022 cm−2, consistent with preliminary reports, and a photon index of Γ ≈ 2.2. However, the power-law fit is poor overall, with χ2/d.o.f ≈2097.84/239, and leaves clear positive residuals below ≈2 keV and between ≈5−10 keV, and negative residuals above ≈15 keV. The residuals also reveal a feature at 6.4 keV. We do not discuss this model further.
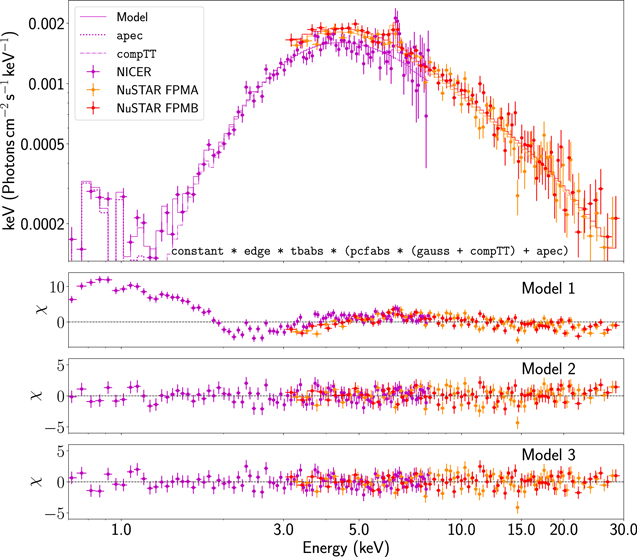
Figure 3. Broadband X-ray spectral modeling of SRGA J181414.6-225604. The top panel shows the data along with the preferred physical model, consisting of a Comptonized plasma with seed photons, a lower-energy BB component, and a 6.4 keV Fe line. The bbody and compTT model contributions to the final model are shown separately. The lower panels show the residuals with respect to the different models attempted, as listed in Table 7. Model 1 is a simple absorbed power-law model that does not provide a good description of the data (see the text).
Download figure:
Standard image High-resolution imageWe then attempted a more complex phenomenological model, consisting of a cutoff power law, implemented using highecut ∗powerlaw, for the high-energy emission component, where the high-energy rollover (Ecut) for the power law takes effect at a variable cutoff (Efold) energy (Model 2). We used an apec (Smith et al. 2001) component to model the low-energy excess. 20 Corroborating evidence for the presence of an optically thin plasma component is clearly detected in subsequent NICER spectra, and is discussed in Section 3.2. We fixed the apec abundance to 1.0, thus assuming a Wilms et al. (2000) composition. We found improved fits by adding a partial absorber (pcfabs) to the high-energy component, in addition to Tbabs. 21
A clear 6.4 keV excess is also seen in the residuals from the simple power-law fit, which we model using a Gauss component in the fit. Due to the limitations of the F-test for line-emission features (Protassov et al. 2002), we simulate its significance using the simftest command in xspec, which suggests a null-hypothesis probability of <0.01. We further note a systematic feature at ≈1.8−1.9 keV, which is clearly detected as an absorption edge in subsequent NICER spectra at higher fluxes (see Section 3.2). We identify this feature as the Si K-edge at 1.844 keV, which is detected in many highly absorbed X-ray binaries (Schulz et al. 2016). We include this feature in the fit using the edge component in xspec, keeping the energy fixed and the optical depth as a variable parameter. The addition of the edge indeed results in an improved fit; simulations for the F-test suggest a null-hypothesis probability of <0.03. The resulting model (Model 2) residuals are shown in Figure 3, and provide a better fit than the power-law model, with χ2/d.o.f.= 257.9/225 (Table 7).
Since these models are empirical in nature, we tried a physically motivated interpretation by fitting a Comptonization model, compTT (Titarchuk & Lyubarskij 1995). The best-fit model (Model 3) indicates a seed photon temperature of ≈1.0 keV and a plasma temperature of ≈7.5 keV for the comptt component, while the low-energy apec component has a temperature of ≈0.6 keV. The model provided an acceptable fit (χ2/d.o.f.= 250.43/223). The derived parameters for the Comptonized plasma are similar to several known SyXRBs (Masetti et al. 2002, 2007b; Enoto et al. 2014; Bozzo et al. 2018). We thus adopt this as the working model for SRGA J181414.6-225604. We compute the integrated absorbed and unabsorbed X-ray fluxes of the source using the cflux component in xspec, added to the best-fit spectral model. Placing the cflux component before the foreground Tbabs absorber, we obtain absorbed fluxes of  erg cm−2 s−1 and
  erg cm−2 s−1 in the 0.8−8.0 and 3.0−30.0 keV ranges, respectively. Placing the cflux component after the Tbabs absorber, we derive unabsorbed X-ray fluxes of
  erg cm−2 s−1 and
  erg cm−2 s−1 in the 0.8−8.0 and 3.0−30.0 keV ranges, respectively.
3.2. Spectral Evolution
We attempted to fit the two subsequent epochs of NICER spectra using the same Comptonization model discussed in the joint analysis, and were able to obtain acceptable fits. We list the derived parameters in Table 8, noting that the high-energy comptt component is relatively poorly constrained due to the absence of higher-energy coverage. In Figure 4, we show the NICER spectra in the 0.9−9.0 keV range for the three epochs. The low-energy apec component is present in all the spectra, while we see a clear hardening of the spectra with increasing X-ray flux. Similar hardenings of the X-ray spectra with increasing flux have previously been observed in other SyXRBs (Masetti et al. 2002; Enoto et al. 2014).
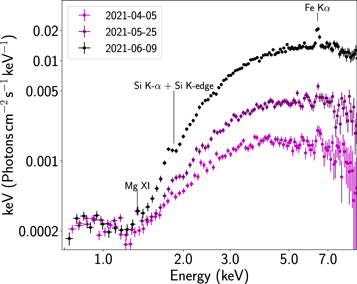
Figure 4. Spectral evolution of SRGA J181414.6-225604 during the 2021 outburst, observed by NICER. We show the unfolded Fν spectra, assuming a flat power-law model with Γ = 0, to avoid artificially introducing sharp features from the model assumption. Prominent atomic features are marked.
Download figure:
Standard image High-resolution imageTable 8. Evolution of the Best-fit Model Parameters for SRGA J181414.6-225604 as Observed with NICER
| NICER Epoch 2 (2021-05-25): | |||
|---|---|---|---|
| χ2/d.o.f. = 126.67/95, Pnull = 0.02 | |||
 erg cm−2 s−1 erg cm−2 s−1
| |||
| Component | Parameter | Value | Unit |
| edge | τ |

| ⋯ |
| Tbabs | NH |

| 1022 cm−2 |
| pcfabs | NH |

| 1022 cm−2 |
| pcfabs | CF |

| ⋯ |
| compTT | T0 |

| keV |
| compTT | kT |

| keV |
| compTT | τ |

| ⋯ |
| Gauss | LineE |

| keV |
| Gauss | Sigma |

| keV |
| apec | kT |

| keV |
| apec | norm |

| cm−5 |
| NICER Epoch 3 (2021-06-29): | |||
| χ2/d.o.f. = 115.68/102, Pnull = 0.17 | |||
 erg cm−2 s−1 erg cm−2 s−1
| |||
| Component | Parameter | Value | Unit |
| edge | τ |

| ⋯ |
| Tbabs | NH |

| 1022 cm−2 |
| pcfabs | NH |

| 1022 cm−2 |
| pcfabs | CF |

| ⋯ |
| compTT | T0 |

| keV |
| compTT | kT |

| keV |
| compTT | τ |

| ⋯ |
| Gauss | LineE |

| keV |
| Gauss | Sigma* |

| keV |
| apec | kT |

| keV |
| apec | norm |

| cm−5 |
Note. The parameters correspond to the adopted Model 3 in Table 7. For each model, we show the best-fit parameters, their uncertainties, the resulting χ2, as well as the estimated absorbed 0.8–8.0 keV fluxes (as FX).
Download table as: ASCIITypeset image
The subsequent NICER observations also show evidence of unresolved emission and absorption features that are well detected in the spectra with higher signal-to-noise ratios. In the data taken around UT 2021-05-25, we find an unresolved emission line around 1.34 keV, which coincides with a known feature of Mg xi. The feature is strongest at this epoch (Figure 4), but is also visible in the other two epochs at lower significance. The variability argues against a possible origin in background Galactic ridge X-ray emission (Revnivtsev et al. 2006). This emission line suggests the presence of an optically thin plasma emission component, and is well fit by the adopted apec component. The NICER spectrum near the peak of the 2021 outburst (around UT 2021-06-09) shows a strong absorption feature near the Si K-edge, while a lower-significance feature is detected in the earlier epochs. The derived optical depth of the Si K-edge is variable across the epochs, although we cannot rule out unresolved contamination with the nearby Si Kα emission line in these low-resolution spectra.
There is clear variability in the narrow Fe Kα line. The line is detected in all epochs, as confirmed with the F-test, which suggests null-hypothesis probabilities of ≈3 × 10⁻³ and ≈10−11 in the second and third epochs, respectively. The line center is consistent with the rest wavelength and is unresolved (Sigma <140 eV; the spectral resolution of NICER). This suggests that it does not arise from reflection from the inner part of the disk (García et al. 2011); it may come from reflection off colder gas at larger distances, or from the extended thermally emitting plasma. Based on the best-fit parameters, we find the broadband hardening to be associated with increasing optical depth for the Comptonizing plasma toward the peak of the outburst. We also note a variable covering fraction for the partial absorber, while the Tbabs absorber remains roughly constant.
3.3. Temporal Variability
SRGA J181414.6-225604 exhibits dramatic X-ray variability on timescales of minutes to weeks. As in Figure 2 and Section 3.2, the X-ray transient was observed to brighten and harden for ≈100 days after the initial discovery, followed by a drop to its near-quiescent flux level over the next ≈100 days. The individual NICER observations obtained during the brightening provide strong constraints on the short-term variability. Figure 5 shows the X-ray light curve of the source in the soft (1−3 keV) and hard (3−10 keV) bands during the three epochs of NICER observations. All epochs are characterized by brief periods of rapid X-ray activity, where the source flux varies by ≳5× over timescales of ∼minutes. The short timescale variability is nearly identical in the hard and soft bands, as indicated by the relatively constant hardness ratio as the count rate changes by factor of ≈10×. A similar “colorless” variability is known in several SyXRBs (Masetti et al. 2002; Enoto et al. 2014). We also searched for the presence of X-ray bursts, by binning the NICER light curve at 1 s time resolution, but did not find any bursts.
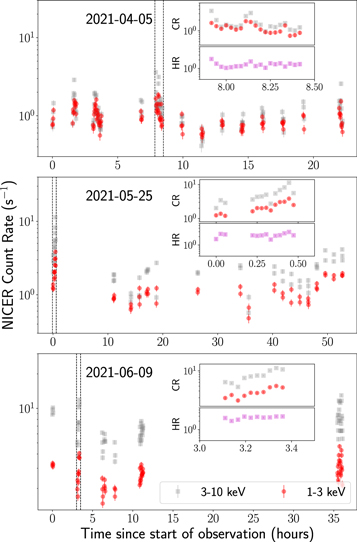
Figure 5. The short-term variability in SRGA J181414.6-225604, as observed with NICER. In each panel (showing the mean date of observation), we plot the light curve binned to 100 s time resolution over multiple visits of NICER. The insets show zoom-ins of the light curves around the time ranges (marked with vertical dashed lines) with high X-ray activity. In each of the insets, we also show the variability of the hardness ratio (HR; in magenta) below the count rate (CR) light curve.
Download figure:
Standard image High-resolution imageTo search for the presence of pulsed emission, we used the complete NICER event list (corrected to barycentric time relative to the JPLEPH.DE200 ephemeris, as per the default in the FK5 reference frame) and created a mean power spectral density (PSD) from 10−3 Hz to 10 Hz. We averaged power spectra of segments of 1000 s each, with a time resolution of 0.1 s. Figure 6 shows that the source exhibits a strong red noise–dominated PSD. We searched for the presence of a pulsation by fitting the red noise component with a power law and searching for excess power after normalizing the PSD by the red noise component (van der Klis 1989; Israel & Stella 1996). The magenta dotted line in Figure 6 shows the 3σ threshold for the detection of a signal, accounting for the expected noise distribution in the averaged PSD. No pulsations are detected at the 3σ level, corresponding to an upper limit on the fractional pulsation amplitude of ∼1% at ∼10 Hz and ∼20% at ∼10−3 Hz. A similar pulsation analysis of the NuSTAR data also did not reveal pulsations at the 3σ level, although the constraints are less stringent, due to the lower number of counts.
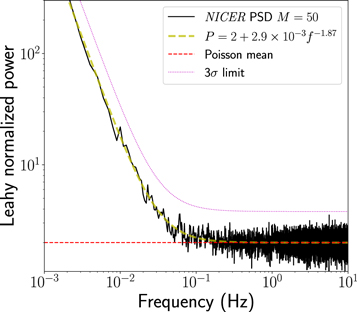
Figure 6. Normalized power spectrum of the combined NICER data set, obtained by averaging M = 50 segments of 1000 s each. The Poisson mean curve shows the expected power value for pure white noise. We also show the best-fit power-law description of the red noise component, together with the 3σ upper-limit curve for the presence of a pulsation superimposed on the red noise.
Download figure:
Standard image High-resolution image4. The IR Counterpart
4.1. Localization and Association
At the time of discovery, the best-fit position of SRGA J181414.6-225604 was reported from the eROSITA instrument with an error radius of ≈9″, which included the position of the variable IR counterpart IRAS 18111-2257. We used the Swift XRT data to derive a higher-precision position of the X-ray source. Using all the XRT event data obtained post discovery, we used the online XRT products tool
22
(Evans et al. 2009) to derive an enhanced position using stars in the UVOT field of view (Goad et al. 2007). The best-fit position is α = 18:14:14.74, δ = −22:56:19.1, with an error radius of ≈24. Figure 1 shows an NIR image of the field overlaid with the X-ray localization regions from ART-XC, eROSITA, and Swift. The best-fit position is squarely consistent with the position of IRAS 18111-2257.
IRAS 18111-2257 is reported in the 2MASS Point Source Catalog (Skrutskie et al. 2006) as 2MASS J18141475-2256195, with NIR magnitudes of J = 8.32 ± 0.07, H = 6.93 ± 0.04, and Ks = 6.15 ± 0.02, and it is coincident within ≈04 of the position of the X-ray source. The IR source is one of the brightest and reddest sources in the nearby field, making the spatial association with SRGA J181414.6-225604 very probable. Following Kaplan et al. (2007), we use the 2MASS catalog to estimate a spatial density of ≈7 × 10⁻⁶″−2 for sources brighter than Ks
= 6.5 in a 10 × 10 arcmin2 region around the source. This suggests a random probability of ≈3 × 10⁻⁶ for the X-ray transient being spatially coincident within ≈0
4 of the bright IR source. Similarly, using the PGIR archival data, we derive a chance coincidence probability of ≈4 × 10⁻⁵ for the X-ray transient being coincident within 0
4 of a variable 2MASS source brighter than J = 10.0 mag. Together with the temporal coincidence of the IR and X-ray brightening, we conclude that the IR source is very likely the IR counterpart of SRGA J181414.6-225604. Hereafter, we refer to the IR counterpart of SRGA J181414.6-225604 as IRAS 18111-2257.
4.2. Spectral Type
In Figure 7, we show the two epochs of low-resolution (R ≈ 1000) optical spectra of IRAS 18111-2257 obtained with DBSP. The most prominent absorption features are identified with sharp TiO and VO absorption bandheads, typically seen in late M-type stars (Lançon et al. 2007). The inset in Figure 7 shows the higher-resolution spectrum obtained with WiFeS, zoomed in around 8200 Å. The source does not exhibit strong Na absorption around 8200 Å, which is characteristic of late M-type dwarfs (Cushing et al. 2005), suggesting that the counterpart is a luminous giant or supergiant.
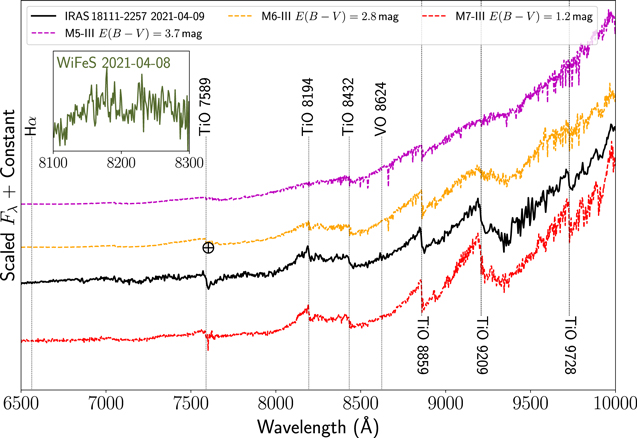
Figure 7. Comparison of the low-resolution optical spectra of IRAS 18111-2257 with the spectral standards from the VLT X-Shooter Spectral Library (Gonneau et al. 2020). The standard spectra were artificially extinguished with additional reddening (using the Cardelli et al. 1989 extinction law, with RV = 3.1), as indicated in the legend, to match the spectral slope of IRAS 18111-2257 for easier comparison. The inset shows a higher-resolution contemporaneous optical spectrum from WiFeS, zoomed in around the region of the Na 8200 Å feature. The deep TiO and VO absorption bandheads suggest a spectral type of at least M6–M7, while the absence of strong Na 8200 Å absorption (Cushing et al. 2005) constrains the luminosity class to a giant. The three optical spectra from Table 4 are available in machine-readable format as the data behind the figure.(The data used to create this figure are available.)
Download figure:
Standard image High-resolution imageIt is well established that the TiO band strengths correlate well with the spectral type of late-type giants, with deeper bands corresponding to later and cooler spectral types (e.g., Ramsey 1981; Kenyon & Fernandez-Castro 1987). To identify the spectral type, we compare our spectra to the optical spectra of late-type (M5–M7) cool giants in the recent Very Large Telescope (VLT) X-Shooter Spectral Library Data Release 2 (Gonneau et al. 2020), in Figure 7. The steep red continuum of the source is inconsistent with the typical colors of cool giants, and hence an additional dust extinction was applied to the library spectra for easier comparison. As shown, the deep TiO absorption features suggest the spectral type to be >M6–M7.
Figure 8 shows the NIR spectrum of IRAS 18111-2257 compared to a star of the same spectral type (as inferred from the optical spectrum) in the IRTF spectral library (Rayner et al. 2009). The spectrum shows clear signatures of broad water absorption features around ≈1.4 and ≈2.0 μm, which are only seen in the very extended atmospheres of large-amplitude pulsating Mira variables (amplitude δ V > 1.7 mag; Matsuura et al. 1999; Lançon & Wood 2000). We measure the H2O absorption index, defined in Blum et al. (2003), as ≈8%, suggesting that the source is a Mira asymptotic giant branch (AGB) star, since supergiants show absorption indices of <6% (Messineo et al. 2021). Compared to the reddened spectrum of the comparison star, IRAS 18111-2257 exhibits a large excess in K band, suggestive of the presence of warm circumstellar dust, as seen in D-type symbiotic binaries and consistent with the steep reddened optical spectrum.
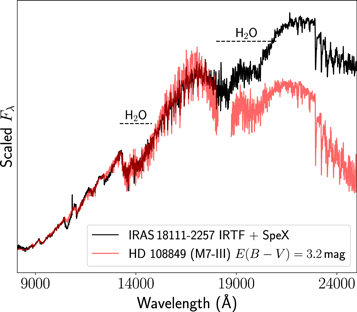
Figure 8. The NIR spectrum of IRAS 18111-2257 compared with a star of the same spectral type (HD 108849; as inferred from the optical spectrum) from the IRTF library (Rayner et al. 2009). The comparison star’s spectrum has been reddened with extinction (indicated in the legend), as in the case of the optical spectra. The reddening was applied to match the slope of the J- and H-band spectra, but consistently leaves a large excess in K band (while a larger value of extinction is inconsistent with the J- and H-band continuum slope), likely suggesting the presence of warm dust. Prominent water absorption features are visible and marked.
Download figure:
Standard image High-resolution imageFigure 9 shows the NIR spectrum of IRAS 18111-2257, zoomed in on the individual JHK bands. The J-band spectrum is dominated by absorption bandheads of TiO at 0.97 μm, 1.1 μm, and 1.25 μm, and VO bandheads at 1.046 μm and 1.325 μm. The TiO bandheads near 1.25 μm become discernible at spectral types M7 or later (Wright et al. 2009) for cool giants, while the VO features are known to become prominent at very low effective temperatures of Teff ≲ 3200 K (spectral type M6 or later; Hinkle et al. 1989; Joyce et al. 1998). The strong TiO bandhead detected here at 1.1 μm is not seen in the spectra of known red supergiants (RSGs), while we also do not detect strong CN features around the 1.09 μm characteristics of RSGs (Messineo et al. 2021), further arguing against a supergiant classification. The presence of VO, instead of the characteristic double absorption bands of ZrO in J band, confidently identifies the source as an M-type star, instead of an S- or C-type AGB star (Hinkle et al. 1989). We identify a strong emission line of He i λ 10833 Å on top of the stellar continuum in J band. We discuss the properties of this feature in Section 5.4.
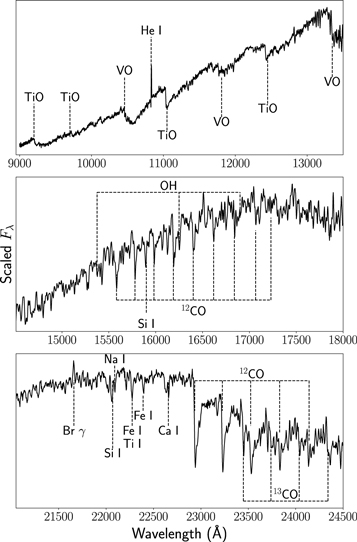
Figure 9. Identifications of prominent spectral features in the NIR spectra of IRAS 18111-2257. The top, middle, and bottom panels show spectra in the J, H, and K bands, respectively.
Download figure:
Standard image High-resolution imageIn H band, we identify Si i 1.59 μm, numerous absorption features of the 12CO second-overtone series, as well as OH molecular features blended with the CO series. The strong CO second-overtone features corroborate the classification of the source as a luminous giant, since these features are not seen in M-type dwarfs (Rayner et al. 2009). The most prominent features in K band are the first-overtone absorption series of 12CO and 13CO. These features are known to be particularly strong in giants and supergiants (Rayner et al. 2009). In addition, we identify strong absorption features from Na i, Si i, and Ca i in the K-band spectra. While the equivalent widths of these atomic absorption features can be used to constrain the spectral type and luminosity class of the star (e.g., Ramirez et al. 1997), the large K-band dust excess and water absorption makes this measurement unreliable (Blum et al. 2003; Messineo et al. 2021). Overall, the spectroscopic signatures of (i) strong water absorption, (ii) deep TiO, VO, and CO features, and (iii) weak/absent CN lines suggest the IR counterpart to be a very-late-type (M7–M8) O-rich Mira AGB star, akin to the class of D-type symbiotic binaries.
4.3. Variability
Figure 10 shows the long-term multiwavelength light curve of IRAS 18111-2257 over the last ≈12 yr. The source exhibits clear variability from the shortest (g band) to the longest (W2 band) wavelengths. The W1 light curve shows variability with an amplitude of ≈0.7 mag, while the W2 light curve exhibits lower variability of ≲0.5 mag. The J-band data from the PGIR data between 2019 and 2021 show the largest amplitude variability, with a steep drop of ≈2 mag over ≈100 days in 2019 being followed by a gradual brightening in 2020 and 2021. The source is also systematically fainter in J band (by at least ≈2 mag) compared to the reported magnitudes for 2MASS (from 1998), even accounting for the full variability amplitude observed in the PGIR data. The source is also fainter in H and K band when comparing the WIRC and 2MASS magnitudes. The ATLAS o band and ZTF r band exhibit smaller-amplitude (≲0.7 mag) drops in 2019 compared to J band.
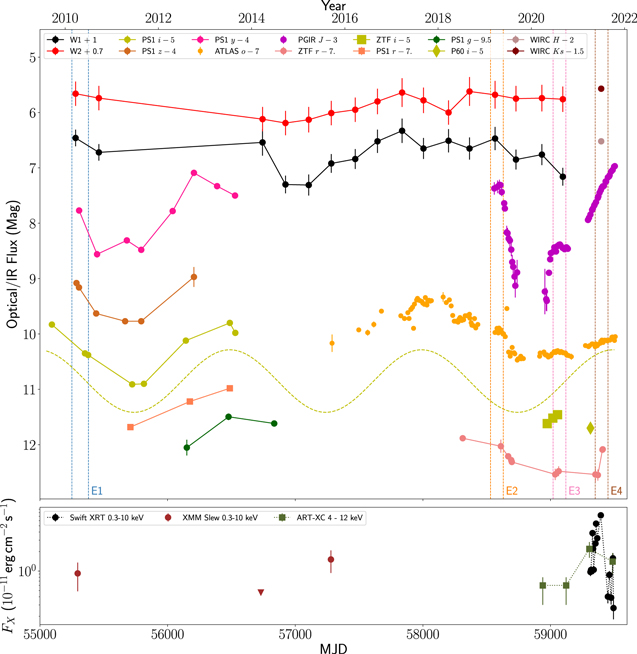
Figure 10. Long-term multicolor light curves of IRAS 18111-2257 (top), along with the long-term X-ray evolution, as combined from archival XMM Newton data and recent SRG and follow-up data (bottom). For reference, the yellow dashed line in the top panel shows the best-fit 1502 day sinusoidal period overlaid next to the PS1 i-band and ATLAS o-band data (offset by 0.5 mag from the i-band light curve). The dashed vertical lines show the date ranges (and corresponding epoch names) over which the photometric data were combined to perform the multi-epoch dust modeling in Section 5.
Download figure:
Standard image High-resolution imageThe PS1 data between 2010 and 2014 show a long-term brightening and fading in all the filters. Given the identification of spectroscopic features similar to Mira variables, we examine the presence of a possible periodicity. Combining the ATLAS o-band light curve between MJD 57000 and 58600 (prior to the onset of the abrupt fading episode in 2019) with the PS1 i-band light curve, we fit the photometry with a sinusoidal function allowing for a different amplitude between the two filters, but requiring a constant period and phase. 23 We thus derive a period of 1502 ± 24 days. The amplitude is ≳1 mag in i band, suggesting that the variability is associated with the fundamental-mode pulsations seen in Mira variables (Wood & Sebo 1996). However, the likely period lies among the longest-known Galactic Mira variables (Soszyński et al. 2009; Menzies et al. 2019). We note that the recent optical data in r and i bands from ZTF also show evidence of the same periodicity, but are systematically fainter than the corresponding PS1 magnitudes detected ≈10 yr ago, even after accounting for the observed variability amplitudes.
4.4. Distance and Foreground Extinction
The spectroscopic diagnostics, as well as the likely detection of a ≈1500 day photometric periodicity, suggest that IRAS 18111-2257 is a long-period pulsating Mira variable. However, the presence of a thick circumstellar dust shell dominating the NIR SED makes the estimation of its luminosity from spectroscopic techniques nontrivial (e.g., Ramirez et al. 1997), which is commonly the case for D-type symbiotics (Hinkle et al. 2013). Gaia Early Data Release (EDR) 3 (Gaia Collaboration et al. 2021) reports a parallax of −0.3236 ± 0.1498 mas, while the corresponding distance estimate in the Bailer-Jones catalog (Bailer-Jones et al. 2021) is 6.0−11.7 kpc (16th−84th percentile confidence). However, Gaia EDR3 also reports astrometric_gof_al ≈12 and astrometric_excess_noise_sig ≈77, which, together with the >2σ negative parallax, suggests a very poor (and likely unreliable) astrometric solution.
Next, Mira variables are known to exhibit a period–luminosity (PL) relation (Feast et al. 1989; Wood 2000), which has been previously used to estimate the distances to symbiotic Miras (Whitelock 1987; Gromadzki et al. 2009). Using the Whitelock et al. (2008) PL relation for O-rich variables suggests an intrinsic absolute magnitude of MK
= −9.9 ± 0.2 mag. However, we caution that the PL relation at such long periods remains debated (Ita & Matsunaga 2011; Yuan et al. 2017), and we do not discuss it further here, but note that many “normal” long-period (>1000 days) O-rich Miras are found to lie on the extrapolation from shorter periods (Whitelock et al. 2003). Using the recent calibration of bolometric luminosity as a function of pulsation period for very-long-period O-rich Miras from Groenewegen et al. (2020), we estimate a bolometric luminosity of Mbol = −6.85 ± 0.40 ( ).
).
We then use the period–color relation from Whitelock et al. (2000) to estimate the total (interstellar + circumstellar) extinction, and derive E(J − K) = 0.31 ± 0.25 mag (E(B − V) ≈0.50 ± 0.40 mag), based on the 2MASS magnitudes. Based on recent 3D dust maps (Bovy et al. 2016; Green et al. 2019), the Galactic dust extinction in this direction is estimated to be E(B− V) ≈ 0.9−1.3 mag for sources farther than 3 kpc away. The 2MASS colors are then roughly consistent with the expected interstellar extinction and intrinsic colors of Miras. We thus take the 2MASS measurements to represent the star prior to its current obscured state (see Section 5). We adopt the foreground extinction as E(B − V) = 0.7 ± 0.6 mag, corresponding to AK
= 0.22 ± 0.17 mag, placing this source at  kpc, based on the Mira period–luminosity–color relations. The estimated distance and sky location places the source in the Norma arm, on the other side of the Galactic center. The total extinction along this line of sight is AK
≈ 0.5 mag (Schlafly & Finkbeiner 2011), consistent with the source being located within the Galaxy.
kpc, based on the Mira period–luminosity–color relations. The estimated distance and sky location places the source in the Norma arm, on the other side of the Galactic center. The total extinction along this line of sight is AK
≈ 0.5 mag (Schlafly & Finkbeiner 2011), consistent with the source being located within the Galaxy.
5. A Recent Dust-obscuration Episode
5.1. Long-term SED Evolution
IRAS 18111-2257 exhibits variability on timescales of ∼days to ∼years (Figure 10). In this section, we analyze the variability of the source and provide evidence for massive dust-obscuration episodes over the last ≈20 yr, which have progressively obscured the underlying Mira variable. We begin by showing the broadband photometric SEDs 24 of the counterpart at three different epochs, separated by ≈10 yr, in Figure 11. The NIR and MIR data for the first epoch capture the peak and Rayleigh–Jeans tail of the SED, which can be well described by a blackbody (BB) of temperature T ≈ 2000 K. The apparent BB temperature is consistent with the typical effective temperatures of late-type Mira variables at similar J − K color and spectral type (Haniff et al. 1995; Feast 1996). Since the 2MASS colors also suggest relatively small circumstellar reddening (Section 4.4), we adopt 2000 K as the average effective temperature of the underlying unobscured star as observed around the year 1998.
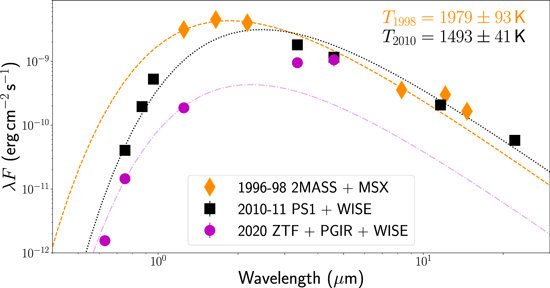
Figure 11. Long-term SED evolution of IRAS 18111-2257. We show the broadband photometric SEDs of the source at three epochs, separated by ≈10 yr, corresponding to the epoch of 2MASS (year ≈1998), the first WISE and PS1 surveys (year ≈2010; E1 in Figure 10), and the last NEOWISE sky survey (year ≈2020; E3 in Figure 10), respectively. The photometry was corrected for interstellar extinction, assuming E(B−V) ≈ 0.7 (Section 4.4), using the Cardelli et al. (1989) extinction law, with RV = 3.1. For each epoch, we also show the best-fit BB curve and the corresponding best-fit temperature. The 2020 SED is not well described by a BB curve, and hence we nominally show the best-fit curve without a corresponding temperature.
Download figure:
Standard image High-resolution imageThe 2010 SED is characterized by a fainter and colder (T ≈ 1500 K) broadband continuum compared to 1998. There are noticeable deviations from a simple BB model, which we analyze in Section 5.2. The 2020 epoch exhibits major differences when compared against both the 1998 and 2010 epochs, characterized by a red SED peaking at ≳5 μm. In addition, the 2020 SED deviates significantly from a single BB model, and we do not attempt to derive a corresponding BB temperature. The source flux has faded >10× in J band compared to the 2MASS epoch. Comparing against the long-term light curve in Figure 10, the dramatic fading was clearly associated with a sudden large-amplitude (≳2 mag) drop in the J-band flux in late 2019. Such a sudden large dimming is inconsistent with the smooth pulsations in O-rich Miras; however, the observed drop and reddening is strikingly similar to the sporadic dust-formation episodes seen in some symbiotic and C-rich Miras (e.g., Jurkic & Kotnik-Karuza 2012; Ita et al. 2021).
5.2. DUSTY Modeling
With the evidence for recent dust obscuration in IRAS18111-2257, based on both the temporal and spectral characteristics, we turn to detailed multi-epoch modeling of the source SED using the radiative transfer code DUSTY (Ivezic & Elitzur 1997). DUSTY solves the radiative transport through a dust shell, including dust absorption, scattering, and emission, and assuming spherical symmetry. We model the SEDs at four different epochs, listed in Table 9, to track the evolution of the mass-loss rate and dust parameters of the underlying Mira star. The four epochs were selected to ensure that the wavelength coverage extends from the BB Wien tail of the unobscured star (to constrain the extinction law) to the MIR bands (≳4 μm; to constrain the dust emission). While DUSTY uses self-similarity and scale invariance to reduce the input parameters, we applied additional constraints, based on the inferred stellar parameters.
Table 9. Derived Dust Parameters from the Multi-epoch DUSTY Modeling of IRAS 18111–2257
| Epoch | L |

| amax | τ | Td | rin | ve |
|---|---|---|---|---|---|---|---|
| 104 L⊙ | 10−6 M⊙ yr−1 | μm | (λ = 0.55 μm) | K | au | km s−1 | |
| 1996-1998 (E0) | 4.0+0.1 −0.1 | 8.3+2.1 −1.6 |

|

|

|

|

|
| 2010-2011 (E1) |

|

|

|

|

|

|

|
| 2019 (E2) |

|

|

|

|

|

|

|
| 2020 (E3) |

|

|

|

|

|

|

|
Note. The parameters  (the mass-loss rate) and ve
(the terminal outflow velocity) are calculated by DUSTY as part of the radiative wind acceleration solution, while the other parameters were varied to minimize the least-squares residuals from the observed data. The mass-loss rates are derived assuming a gas-to-dust mass ratio of 200 and a dust grain bulk density of 3 g cm−3.
(the mass-loss rate) and ve
(the terminal outflow velocity) are calculated by DUSTY as part of the radiative wind acceleration solution, while the other parameters were varied to minimize the least-squares residuals from the observed data. The mass-loss rates are derived assuming a gas-to-dust mass ratio of 200 and a dust grain bulk density of 3 g cm−3.
Download table as: ASCIITypeset image
We model the central star as a BB with T = 2000 K, as derived in the previous section, and adopt a distance of 14.6 kpc. We assume the dust grains to be composed of warm silicates, as in O-rich AGB stars (Ossenkopf et al. 1992), with a Mathis, Rumpl, & Nordsieck (MRN) grain size distribution (∝ a−3.5; Mathis et al. 1977). We set the minimum grain size to amin = 0.005 μm and allow for a variable maximum grain size amax. In all cases, we first attempt to fit the SED with amax = 0.25 μm, as in standard interstellar grains (Draine 2003), but change amax if no acceptable fits are found. The radial density profile is adopted to be an r−2 power law, corrected for radiative acceleration in AGB winds (Elitzur & Ivezić 2001). The resulting free parameters of the model are the maximum grain size (amax), the dust optical depth at 0.55 μm (τV ), the shell thickness (Y) as a multiplicative factor of the inner radius (rin ), the dust temperature at the inner edge of the shell (Td ), and the luminosity (L).
We attempted several different values for the thickness of the shell Y (in the range ≈2–1000), but did not find it to significantly affect the derived parameters, and fixed it at Y = 5. This was expected, since we primarily model the NIR and MIR data (λ ≲ 10 μm), where the emission is dominated by the hottest and innermost part of the shell (Kotnik-Karuza et al. 2007). Due to limited historical data, we do not attempt to include the effects of the Mira pulsations in the multi-epoch modeling, for simplicity, but note that the stellar effective temperature can change by ≈300 K (Reid & Goldston 2002); however, the large SED changes modeled here cannot be explained by temperature variations.
We then used a python wrapper on the DUSTY code to perform least-squares fitting using the Markov Chain Monte Carlo library emcee (Foreman-Mackey et al. 2013). The fitting was performed via minimization of the likelihood function, defined using the χ2 of the model fit, and allowing for underestimated uncertainties. 25 We assumed flat priors for the fitted parameters, and the convergence of the posterior sampling chains was ensured (Foreman-Mackey et al. 2013). The best-fit parameters were derived using the median of the posterior sample distribution, while their confidence intervals are derived from the 16th–84th percentile (68% confidence) interval of the distributions. The derived parameters and their uncertainties are listed in Table 9 and discussed here.
5.2.1. 1998: An Optically Thin, Distant, and Cool Dust Shell
Our best-fit model for the observed SED in 1998 is shown in Figure 12. The SED can be well described by a largely unobscured (τ ≈ 0.6) stellar BB spectrum, with a maximum grain size corresponding to interstellar grains (Mathis et al. 1977). The MSX MIR data show clear evidence for an excess around ≈9−11 μm, corresponding to silicate emission features, consistent with our assumption of the dust composition. The relatively small excess of the feature over the continuum constrains the optical depth to be small, consistent with our assumption of an unobscured star observed in the NIR bands. The silicate emission feature suggests a cool dust temperature of ≈260 K, located at a distance of ≈300 au from the star. The inferred shell parameters are strikingly similar to the cool dust shells detected in D-type symbiotic stars (Angeloni et al. 2010; Hinkle et al. 2013).
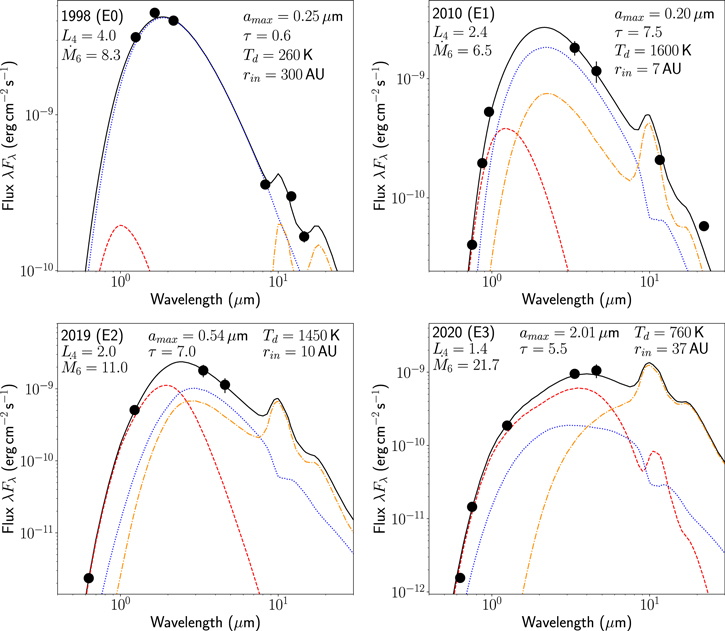
Figure 12. Modeling of the multi-epoch SEDs of IRAS 18111-2257. In each panel, we show the SED of the source at different epochs (as indicated), along with best-fit models from DUSTY (Ivezic & Elitzur 1997). The black solid lines show the total flux model, the orange dotted–dashed lines show the dust emission, while the red dashed and blue dotted lines show the scattered and attenuated stellar emission, respectively. The derived parameters for the model are also indicated in each panel—L4 indicates the luminosity of the star in units of 104 L⊙ and M6 denotes the derived mass-loss rate in units of 10−6 M⊙ yr−1.
Download figure:
Standard image High-resolution image5.2.2. 2010: Detection of a Warm Dust Shell
The 2010 SED shows clear deviations from the best-fit model derived for 1998, but can still be explained with a nearly interstellar grain size distribution. In particular, the steep drop in flux from NIR to optical wavelengths suggests significant circumstellar extinction and a higher dust optical depth of τ ≈ 7.6. The WISE MIR photometry beyond ≈10 um exhibits clear excess over a simple BB curve (e.g., Figure 11), coincident with the silicate and continuum emission from a dust shell. However, the large dust optical depth (from the optical–NIR SED), together with the flux drop from the W3 to W4 bands, constrains the dust shell to be warm, with a temperature of ≈1600 K, consistent with typical silicate dust sublimation temperatures. Unlike the cool distant dust shell detected in 1998, the warm dust shell is located close to the star at ≈10 au, suggesting that it may have been recently formed. The slow formation of such warm dust shells is consistent with what is seen in many D-type symbiotic stars (Whitelock et al. 1983; Shenavrin et al. 2011), and also with what has been suggested to be a unique feature of symbiotic Miras (Hinkle et al. 2013).
5.2.3. 2019: Evidence for Progressive Obscuration
The 2019 SED is derived from combining the earliest detections of the source in the PGIR and ZTF surveys with the MIR data from NEOWISE. Compared to the 2010 epoch, the source faded further in the optical r band (Figure 10), while the MIR WISE emission remained at a similar level. In particular, combining the ZTF optical data and the PGIR NIR data, the models required a change in the maximum dust grain size to simultaneously describe the shallower extinction law and the relatively stable MIR emission. While the optical depth remained similar, we derive a higher mass-loss rate, suggesting that the star likely underwent increased dust production and mass loss between 2010 and 2019, obscuring the stellar optical–NIR flux, as seen in the long-term light curves. Evidence for such grain growth under increased mass loss and dust production has also been detected in other symbiotic Miras (e.g., Jurkic & Kotnik-Karuza 2010).
5.2.4. 2020: A Rapid Dust-obscuration Episode
The 2020 SED data were obtained after the dramatic fading observed in 2019. The observed 2019 fading had the largest amplitude in J band, compared to the optical bands, while the W1 band also exhibited a minor fading. The shallower optical–NIR extinction law uniquely constrains the grain size distribution, requiring it to extend to a larger size of amax ≈ 2.0 μm. Such large grain sizes were also inferred in DUSTY modeling of the sudden obscuration episodes of the symbiotic Mira RR Tel (Jurkic & Kotnik-Karuza 2012). The rising flux in the MIR up to the W2 band requires the dust to be cooler (≈750 K) than at earlier epochs, and located farther away from the star, at ≈40 au. The changes in the dust properties are accompanied by a large increase in the mass-loss rate, confirming our suggestion of a dust-obscuration episode. The inferred source bolometric luminosity is ≈25% fainter than that in 2019, which is likely due to the dust formation occurring near the minimum of the long-term pulsation cycle, as typically seen in other types of pulsating stars (Willson 2000).
5.3. Grain Growth and the Peculiar Color Evolution
The J-band dimming in IRAS 18111-2257 during the 2019 dust-obscuration episode exhibits a peculiar color evolution. The dimming has a larger amplitude in the NIR J band, compared to the optical r and o bands, while static dust-extinction laws universally suggest larger extinction at shorter wavelengths (Draine 2003). As noted from the DUSTY modeling, the post-obscuration SEDs also require much larger dust grains. The growth of grains during dust formation changes the optical properties of the grains over the duration of the event, suggesting a likely connection with the peculiar color evolution. In order to understand this connection, we show in Figure 13 the color–magnitude diagram of the 2019–2021 dimming in IRAS 18111-2257, using PGIR and ATLAS data (which have the highest cadences).
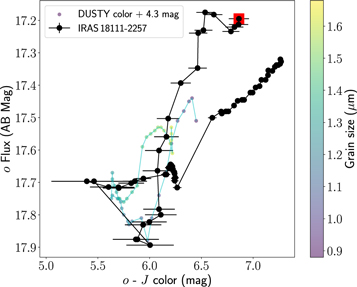
Figure 13. The evolutions of the flux and color of IRAS 18111-2257 during the dust-formation episode in 2019. The black dots show the observed color–magnitude evolution, as derived from PGIR and ATLAS data. The red square shows the start of the PGIR coverage in 2019. The colored dots show the simulated color evolution as a function of grain size, derived from a grid of models with single-sized dust grains, created using DUSTY.
Download figure:
Standard image High-resolution imageIRAS 18111-2257 initially becomes bluer while fading, turns around in a loop during the obscuration minimum, then becomes redder while brightening from the dust dip. Similar color peculiarities have also been discussed in dust-formation episodes of the R Coronae Borealis variables (Efimov 1988a; Pugach 1991), C-rich Miras (Ita et al. 2021), and even noted for the dimming in the O-rich symbiotic nova PU Vul (Efimov 1988b). To understand this phenomenon, we created a grid of DUSTY models to simulate the effect of dust growth on the source colors. Although we assume a power-law grain size distribution for the individual epochs for the DUSTY modeling discussed thus far, the grain extinction evolution may be dominated by specific size ranges during these transient episodes. For simplicity, and motivated by the observed evolution of the dust properties between 2019 and 2020 (Table 9), we thus created a model grid, varying only the properties of the dust (temperature fixed at Td = 1000 K) with (i) single-sized grains ranging from ≈0.5 μm to ≈2.0 μm, and (ii) the optical depth changing from τ = 7.0 to τ = 5.5.
We perform synthetic photometry on the resulting spectrum grid to simulate the expected color–magnitude diagram, and also show it in Figure 13. Since, in our simple approximation, we do not include the contribution from the static dust distribution prior to the fading (epoch E3; DUSTY does not support multiple grain size distributions), there are differences in the absolute values of the color during the event. However, we find striking similarities in the color–magnitude “loop” observed around the minimum of the dust-obscuration event. In reality, the optical depth of the layer, the luminosity of the Mira (which is pulsating), and the dust temperature are changing during this event, and hence we do not expect to find perfect agreement between this model and the data. Nevertheless, as demonstrated in previous works (Efimov 1988a, 1988b), the change in the dust optical properties during grain growth provides a good explanation for the observed color evolution in the dust-formation episode in IRAS 18111-2257.
5.4. The He i Outflow Signature
The NIR spectra of IRAS 18111-2257 exhibit a strong He i λ 10833 Å feature, with a P-Cygni profile. Figure 14 shows the evolution of the line across our spectral sequence. From the highest-resolution FIRE spectra, we find that the blueshifted line absorption extends to velocities of ≈100−120 km s−1. Chakrabarty et al. (1998) discovered a similarly high-velocity (≈250 km s−1) wind in the SyXRB GX 1+4, although it was unclear if the line arose from the donor star atmosphere or from an accretion disk wind. The He i NIR line is detected in many bright giants (O’Brien & Lambert 1986), and with line profiles ranging from pure absorption to P-Cygni shapes (Dupree et al. 2009). The line is formed high in the chromosphere and shown to be a good tracer of bulk motion in the outer atmosphere, where the gas flow is close to the escape speed (Dupree et al. 1992).
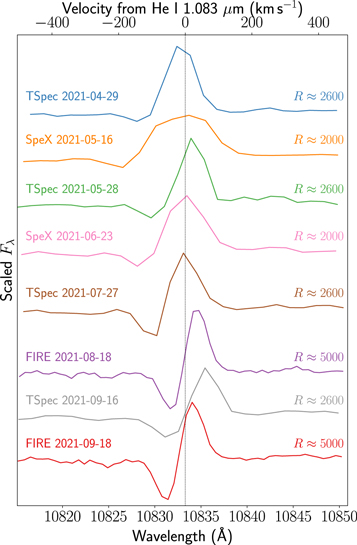
Figure 14. Evolution of the He i 10833 Å P-Cygni profile in the spectral sequence of IRAS 18111-2257. We show the NIR spectra, zoomed in to the region of the line, and indicate the instrument, date, and spectral resolution of the observations. The eight NIR spectra from Table 4 are available in machine-readable format as the data behind the figure.(The data used to create this figure are available.)
Download figure:
Standard image High-resolution imageChakrabarty et al. (1998) pointed out that the inferred wind velocity in GX 1+4 was much larger than the typical wind speeds in red giants (≈10−30 km s−1; Höfner & Olofsson 2018). They suggested that the UV/X-ray radiation from the hot NS in GX 1 + 4 may contribute to accelerating the outflow to high speeds, since the line is also detected in other symbiotic stars (e.g., Bensammar et al. 1988). Dupree et al. (2009) carried out a survey of the λ 10833 line in field giants, and found velocities as high as ≈90−120 km s−1 in several objects, suggesting that fast outflows may be common. The He i λ 10833 transition lower state is ≈20 eV above the ground state, and hence it is unlikely to be photoionized by cool photospheres. Indeed, Dupree et al. (2009) showed that the outflows are detected only in stars hotter than ≈4500 K. With a photospheric temperature of ≲2500 K in IRAS 18111-2257, however, the source of the He i ionization remains unclear.
The hot radiation from the compact object may lead to ionization of the donor star's wind, similar to the scenario discussed in Chakrabarty et al. (1998). Alternatively, our conclusion of recent dust formation in IRAS 18111-2257 brings forward another possibility. Dust formation has been extensively monitored in the R Coronae Borealis stars (Clayton 1996), where the He i line is ubiquitously detected only around the epochs of dust formation (Clayton et al. 2013). During these phases, it has been suggested that the outflowing dust cloud shocks the surrounding gas, collisionally excites the transition, and radiatively accelerates it outward to velocities higher than the stellar escape speed (Eyres et al. 1999). The resulting velocities are expected to be ∼100 km s−1 for AGB stars with L ∼ 104 L⊙ (Castor 1981), although optical depth effects reduce the terminal velocities to ≈10−30 km s−1 in the steady-state winds of AGB stars (Elitzur & Ivezić 2001).
In the case of IRAS 18111-2257, the derived terminal velocities from the DUSTY solution (Table 9) are ≈40 km s−1 around the epochs of dust formation, similar to the observed maximum absorption in the P-Cygni profile. Since the maximum observed absorption speed is ≈2−3× higher than the derived terminal velocities, it is possible that the highly variable mass-loss rates and rapid grain growth around these epochs accelerate a fraction of the material to higher speeds, as discussed in Elitzur & Ivezić (2001). Specifically, as the visual optical depth decreases during dust formation (Table 9), the longer-wavelength radiation is shifted to shorter wavelengths, while the rapid grain growth makes the dust grains more effective at absorbing this emerging radiation and accelerating the surrounding gas with it. We thus suggest that radiative acceleration and collisional excitation during the dust-formation episode could also explain the high-velocity He i outflow observed in IRAS 18111-2257. In the case of the R Coronae Borealis stars, the line is observed to persist at nearly constant strength and velocity up to ≈100 days after the obscuration event, since it likely takes time for the far-away outer wind to decelerate (Clayton et al. 2013). For the AGB star considered here, the relevant length scales are at least ≈10× larger, suggesting that the He i line could persist for ∼1000 days. Continued monitoring of the feature, as well as higher-resolution spectroscopy to infer its velocity and optical depth evolution (e.g., Clayton et al. 2003; Dupree et al. 2009), can test the proposed scenario.
6. Discussion
We have thus far discussed the identification and multiwavelength characterization of SRGA J181414.6-225604, a Galactic hard X-ray transient that exhibits: (i) a heavily absorbed X-ray spectrum dominated by an optically thick Comptonized plasma at high energies (>2 keV) and a collisionally ionized plasma at low energies; (ii) X-ray variability characterized by “colorless” flares on timescales of ∼minutes and longer-term hardening with increasing flux on timescales of ∼weeks; (iii) a bright IR counterpart consistent with a luminous pulsating ≈M8-type O-rich Mira variable; and (iv) evidence for an intense dust-obscuration episode starting ≈800 days prior to the peak of the X-ray brightening. In this section, we combine the multiwavelength properties of the source to constrain the nature of the transient, and discuss the implications for the broader SyXRB population.
6.1. Origin of the X-Ray Emission
The broadband X-ray spectrum of SRGA J181414.6-225604 can be well described by heavily absorbed Comptonized emission, with a seed photon temperature of ≈1 keV and a plasma temperature of ≈7.5 keV. The spectral shape of the Compton cloud is consistent with a very compact accreting object, likely to be an NS or a BH, surrounded by a corona of hot electrons emitting hard X-rays by the Comptonization of soft seed photons. The case for a WD accretor is very unlikely, due to the hard X-ray emission extending out to ≳30 keV, as detected with NuSTAR (Masetti et al. 2007b; Luna et al. 2013). Furthermore, the inferred broadband X-ray flux, together with the estimated distance for the IR counterpart (≈15 kpc), suggest a peak X-ray luminosity of ≳2.5 × 1036 erg s−1, much more luminous than accreting WDs (≲1034 erg s−1; Mukai 2017).
Although we do not detect pulsations or X-ray bursts, the derived spectral parameters are consistent with previously known SyXRBs hosting NSs (Masetti et al. 2002, 2007b, 2007a; Enoto et al. 2014; Kitamura et al. 2014). However, X-ray bursts among SyXRBs are rare and have been detected from only one source (IGR J17445-2747; Mereminskiy et al. 2017; Shaw et al. 2020). In the case that the accretor is an NS, the seed photon component may arise from a localized hotspot on the surface of the NS, possibly produced by magnetically channeled accretion onto its surface (Masetti et al. 2002; Kitamura et al. 2014). We caution that the limited duration for the X-ray follow-up would not be sensitive to the very long spin periods (∼hours) of some known SyXRBs, and can be masked by the stochastic accretion-related variability (e.g., Enoto et al. 2014; Figure 5). The pulsed emission may also be washed out by geometric effects or by the bright Comptonizing cloud (Titarchuk et al. 2002).
The X-ray temporal and spectral variability offers additional insights into the accretion process. The transient brightened for ≈100 days after discovery and has nearly faded back to its quiescent level seen prior to the ART-XC discovery. The source became harder during its brightening phase, as typically seen in other SyXRBs, and is consistent with accretion from a wind with a low specific angular momentum (Smith et al. 2002; Wu et al. 2002). The variable column density and covering fraction of the partial absorber in our spectral modeling across the epochs (Table 8) suggest accretion inhomogeneties affecting the spectrum on timescales of ≈weeks. On the other hand, the spherically symmetric Tbabs component exhibits relatively constant NH across all the epochs, suggesting that it is associated with a constant contribution from circumbinary material. For the estimated optical depth of the dust shell around the donor in the most recent epoch (τV ≈ 5), the corresponding AV ≈ 5.5 mag implies a hydrogen column density of ≈1.2 × 1022 cm−2 (Güver & Özel 2009), consistent with the Tbabs component. The pcfabs component exhibits a ≈3× larger column density, suggesting enhanced absorption close to the compact object.
We consider two alternative possibilities for explaining the short-term variability (∼minutes). Since the hardness ratio remains nearly constant, the short-term variability cannot be attributed to a variable covering fraction or column density, since we would expect spectral shape changes, as the estimated column from our spectral modeling is too low to be opaque to X-ray photons at ≈1−10 keV. Thus, we speculate that variable accretion at a constant covering fraction and column density arising from the donor wind may explain the observed variations. Alternatively, we suggest that these variations may be attributed to the changing Comptonization of the thermal seed photons. Specifically, even if the thermal seed component remains roughly constant, a variable Comptonization fraction at a constant plasma temperature can produce changes in the integrated luminosity of the comptt component, with only minor changes to its spectral shape. Since the spectral modeling demonstrates that the optical depth is high and the spectrum is dominated by the Comptonized emission at ≳1 keV, the observed achromatic variations may reflect the changing luminosity and constant spectral shape of the comptt component.
6.2. A Dense Ionized Nebula around the Compact Object
The broadband spectral analysis reveals a soft flux excess (below ≈1 keV) that we model with an optically thin collisionally ionized plasma (apec) component. The model is motivated by the detection of strong emission lines coincident with the transitions of Mg and Si in the NICER spectra. The derived fits suggest a plasma temperature of ≈0.6 keV and indicate that this component is located outside the dense partially absorbing cloud, and thus is relatively extended compared to the central X-ray-emitting region around the compact object. Collisionally ionized plasmas are commonly observed in the X-ray spectra of dense shocks in colliding wind binaries and SNe (e.g., Chakraborti et al. 2012; Oskinova et al. 2017). Taking the estimated distance of the counterpart, the derived normalization of the apec component suggests an emission measure of ≈2 × 1057 cm−3. If we take the relevant size for the extended apec emission region to be of the order of the inferred dust shell (∼10 au), we derive a required particle density of ∼107 cm−3, assuming nH ≈ ne . The effective column density arising from the apec component is then ∼10 au × 107 cm−3 ∼ 1021 cm−2, and much smaller than the cold absorber column. In Section 6.4, we show that the derived particle density is consistent with an ionized nebula formed from ejected material from the donor star.
Supporting the presence of a surrounding gas cloud, the X-ray spectra show multiple narrow emission and absorption features. We detect prominent and variable narrow Fe Kα emission in all the epochs, characteristic of wind-fed systems, where the line is produced by the X-ray fluorescence of the companion wind material. We do not find evidence for spectral residuals suggestive of cyclotron lines, as seen in some accreting pulsars (Staubert et al. 2019) and possibly even in an SyXRB (Bozzo et al. 2018). A striking feature noted in the NICER spectral analysis is the presence of a strong Si K-edge that we modeled using an additional edge component. The improvement in the spectral fit suggests that the gas surrounding the compact object contains an overabundance of Si, 26 which is known to be depleted into silicate dust grains in the interstellar medium (ISM; Draine 2003; Schulz et al. 2016). The edge exhibits a variable optical depth, as is visually apparent in the multi-epoch spectra (Figure 4).
Following Schulz et al. (2016), the measured (excess) optical depth of the Si edge (relative to the ISM) can be related to the total Si abundance, using

where τSi is the optical depth of the edge, Az is the expected abundance (per hydrogen atom) in the ISM, x is the total Si abundance relative to ISM composition, and σz is the absorption cross section. Using the assumed Wilms et al. (2000) ISM abundances, τSi ≈ 0.3 measured from the brightest NICER spectrum, and a corresponding total NH ≈ 5 ×1022 cm−2 (Table 8), we find that the material surrounding the accretor contains ≈2.5× Si abundance relative to the normal ISM. However, we caution that scattering effects are known to alter the simple absorption edge profiles used in xspec (Corrales et al. 2016), which can affect the inferred abundance (Schulz et al. 2016); such effects are only probed with higher-resolution spectroscopy. Nevertheless, we conclude that multiple diagnostics in the X-ray spectra securely demonstrate the existence of a dense dust/gas cloud enshrouding the binary system.
6.3. A Mira Donor Star Exhibiting Intense Mass Loss
The classification of the donor star as a very-late-type pulsating AGB star offers a novel addition to the growing population of Galactic SyXRBs. The majority of previously known SyXRBs (Table 1 in Yungelson et al. 2019) contain early M-type donors consistent with red giants, in addition to some sources where the donor has been suggested to be an RSG (Gottlieb et al. 2020; Hinkle et al. 2020). The brightest known source, GX 1+4, also has an M6-III red-giant donor that is nearly overflowing its Roche lobe and powering the luminous X-ray emission (Chakrabarty & Roche 1997). The classification of the donor in the SyXRB Scutum X-1 was recently revised from an RSG (Kaplan et al. 2007) to a long-period Mira variable (De et al. 2022) similar to SRGA J181414.6-225604. XTE J1743-363 was also suggested to host a >M7-type donor star, and likely a pulsating variable on the AGB (Smith et al. 2012). In the X-ray band, both Sct X-1 and XTE J1743-363 exhibit similar behavior as SRGA J181414.6-225604, including ∼100 day long flares (Smith et al. 2012), as well as variability on timescales of ∼hours (Sguera et al. 2006; Kaplan et al. 2007). However, the donor photometric variability in XTE J1743-363 remains unconstrained.
The pulsation period of ≈1500 days and the O-rich composition provide strong constraints on the evolutionary stage of the donor star and binary system. Such long-period Miras are rare, likely because they are in a very short-lived evolutionary phase (Marigo et al. 2017) or they are realized only among the rarer massive AGB stars (Feast 2009). Indeed, there are <20 candidate Miras in the Milky Way with periods >1000 days (Menzies et al. 2019), confirming their rarity. However, Figure 2 shows that our combined photometric data set over the last ≈12 yr supports the presence of a coherent ≈1502 day period, already covering ≈3 cycles of the Mira pulsation. As in Groenewegen & Sloan (2018), we employ the relationship derived in Groenewegen & Jurkovic (2017), based on Cepheid models (Bono et al. 2000), between the luminosity (≈2 × 10⁴ L⊙), temperature (≈2000 K), metallicity (assuming Z ≈ 0.015), and mass for fundamental-mode pulsators, to estimate a current mass of ≈5.2 M⊙ for the Mira variable, making it a massive AGB star. The simpler period-mass–radius relationship in Wood (1990) provides a similar estimate of ≈5.5−8.0 M⊙, depending on the adopted radius. 27
Thanks to multi-epoch archival photometric data, as well as high-cadence monitoring near the X-ray flare, we present strong evidence for an intense dust-obscuration episode in IRAS 18111-2257, starting ≈800 days prior to the observed X-ray brightening. In addition, the long ≈25 year baseline between 2MASS, PS1, WISE, and PGIR allows us to observe a dramatic transition in the appearance of the donor star, from a relatively unobscured stellar SED (i.e., an S-type system) to a heavily dust-obscured Mira (i.e., a D-type system). The secular change is accompanied by an increase in the mass-loss rate (indicated by the DUSTY modeling) and suggests that the donor star is possibly at the onset of a thermal pulse (Herwig 2005). The long pulsation period and high inferred mass point to a relatively young system, with age ≲100 Myr (Marigo et al. 2017); comparing the inferred current mass to the grid of intermediate-mass AGB models in Doherty et al. (2015), we estimate an initial mass of ≈6 M⊙ and an age of ≈90 Myr, if the donor is indeed entering the first thermal pulse.
6.4. The Nature of the Accretion Flare and Binary System
The coincidence of the dust formation (Section 5.2) with the observed X-ray flare in 2021 suggests that the enhanced mass loss provides additional fuel for accretion onto the compact object, which likely caused the X-ray brightening. This allows us for the first time to constrain the binary orbit in an SyXRB, together with the accretion mechanism, by comparing the properties of the mass-loss episode and the observed X-ray flare. The Swift monitoring shows that the X-ray outburst reached its maximum luminosity at td ≈ 800 days from the start of the dust-obscuration episode in 2019. If we take the He i P-Cygni signature as an estimate of the terminal wind velocity (vt ≈ 100 km s−1, accelerated by the dust production or X-ray emission; Section 5.4), the compact object is likely located a ∼ vt × td ≈ 55 au from the donor star.
Assuming the mass ratio (q) of the binary system to be ≈4, and assuming the compact object to be a ≈1.3 M⊙ NS 28 and the donor to be a 5 M⊙ AGB star, the Roche lobe radius for the donor would be ≈23 au, larger than the estimated photospheric radius (≲6 au) of the unobscured star, suggesting that the system would be nominally undergoing wind accretion. However, our DUSTY modeling shows that the intense dust-obscuration episode in 2020 results in the formation of an expanding dust envelope. The densest inner region of the dust shell is observed to expand from ≈10 au in 2019 to ≈40 au in 2020, thus nearly reaching the location of the compact object shortly prior to the start of the X-ray brightening.
For the assumed shell thickness (Y = 5), the entire binary system is likely already engulfed in the dust shell prior to the X-ray brightening, consistent with the strong Si overabundance observed in the X-ray spectra. We can constrain the particle density in this region by approximating the wind density profile with standard r−2 dependence at large distances from the star, as we also confirmed from the radial density profile produced from the DUSTY model. The mass-loss rate is then related to the radial density profile as:

For a distance of ≈50 au from the donor to the compact object, we estimate a gas particle number density of ≈1.1 × 107 cm−3. This density is similar to what we estimate for the low-energy apec component observed in the X-ray spectra, suggesting that the ionization of the dense Mira wind near the compact object provides a good explanation for the extended collisionally ionized plasma detected around the compact object.
For the low–angular momentum dusty wind of the donor star, the accretion is expected to take place directly onto the compact object, without the formation of a disk (Smith et al. 2002; Wu et al. 2002). Following Yungelson et al. (2019), we can estimate the expected accretion rate, assuming the Bondi–Hoyle–Lyttleton formalism. The compact object captures material within a characteristic Bondi radius given by

where RB
is the Bondi radius, Mc
≈ 1.3 M⊙ is the mass of the compact object assumed to be an NS, cs
is the sound speed,  , vorb is the relative orbital velocity, and vw
is the wind velocity. For the wide apparent orbit and cool wind considered here, we ignore the NS orbital velocity and sound speed of the gas relative to the much faster wind velocity, resulting in RB
≈ 0.25 au. The accretion rate onto the compact object is then
, vorb is the relative orbital velocity, and vw
is the wind velocity. For the wide apparent orbit and cool wind considered here, we ignore the NS orbital velocity and sound speed of the gas relative to the much faster wind velocity, resulting in RB
≈ 0.25 au. The accretion rate onto the compact object is then

where  is the Bondi accretion rate and
  the donor mass-loss rate. Taking the enhanced mass-loss rate from the donor, estimated from the 2020 epoch (
 M⊙ yr−1), we derive an accretion rate of
  M⊙ yr−1. Assuming that a fraction
 of the rest-mass energy of this material is emitted by the compact object during the X-ray flare peak (LX ≈ 2.5 × 1036 erg s−1), we estimate
≈ 0.3, similar to the expected conversion efficiency for accretion onto an NS (
∼ 0.2). A lower conversion efficiency would be required if the ejected dust shell were focused by the Roche potential into the plane of the binary system (Shagatova et al. 2021). If we assume that the wind velocity prior to dust formation was close to that estimated by DUSTY prior to the onset of dust formation (E1; 2010–11) for a steady-state wind (Table 9), the ≈4× lower mass-loss rate would both reduce the mass-transfer rate onto the NS as well as reduce the accretion efficiency, due to the larger magnetospheric radius at low accretion rates (Kuranov et al. 2015). We summarize the proposed scenario for the X-ray flare in SRGA J181414.6-225604 in Figure 15.
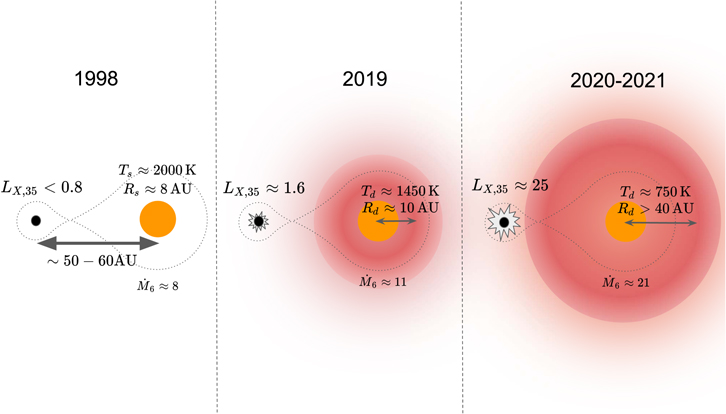
Figure 15. Proposed model for the enhanced mass-loss and X-ray activity in SRGA J181414.6-225604. We show depictions of the binary system for three epochs, as inferred from our modeling. The left configuration shows the expected state of the binary near the epoch of 2MASS, consisting of an unobscured late-type giant with a temperature Ts
, radius Rs
, and mass-loss rate  6 (in units of 10−6
M⊙ yr−1). The donor star fits well inside its Roche lobe (shown by the dotted lines), as it orbits a distant compact object that has a faint X-ray accretion luminosity LX, 35 (in units of 1035 erg s−1), as constrained by INTEGRAL archival hard X-ray data. In the middle configuration, the compact object is marginally brighter in the X-ray around the epoch of the first ART-XC survey, as the donor star shows evidence for an elevation in the mass-loss rate and the progressive formation of a warm dust shell, with an inner radius Rd
and temperature Td
. The shell has a thickness ratio of ≈5, and we only show the inner dense region here for clarity. In the right configuration, the donor undergoes a dramatic dust-dimming episode in 2019–2020, as it ejects an expanding gas/dust shell that slowly expands beyond the Roche lobe, cools, then reaches the compact object. The enhanced gas supply causes a ≈15 × X-ray flux brightening on the compact object, while also enshrouding it in gas and silicate dust directly detected in the X-ray spectra.
6 (in units of 10−6
M⊙ yr−1). The donor star fits well inside its Roche lobe (shown by the dotted lines), as it orbits a distant compact object that has a faint X-ray accretion luminosity LX, 35 (in units of 1035 erg s−1), as constrained by INTEGRAL archival hard X-ray data. In the middle configuration, the compact object is marginally brighter in the X-ray around the epoch of the first ART-XC survey, as the donor star shows evidence for an elevation in the mass-loss rate and the progressive formation of a warm dust shell, with an inner radius Rd
and temperature Td
. The shell has a thickness ratio of ≈5, and we only show the inner dense region here for clarity. In the right configuration, the donor undergoes a dramatic dust-dimming episode in 2019–2020, as it ejects an expanding gas/dust shell that slowly expands beyond the Roche lobe, cools, then reaches the compact object. The enhanced gas supply causes a ≈15 × X-ray flux brightening on the compact object, while also enshrouding it in gas and silicate dust directly detected in the X-ray spectra.
Download figure:
Standard image High-resolution image7. Summary
We have presented the discovery and detailed multiwavelength characterization of the Galactic hard X-ray transient SRGA J181414.6-225604, discovered by the Mikhail Pavlinsky ART-XC instrument on board the SRG satellite. In summary, we show that:
- 1.The X-ray transient exhibited a ≈100 day brightening to peak, following its discovery (as observed with Swift), reaching a peak luminosity of ≈2.5 × 1036 erg s−1, followed by fading nearly to its quiescent (≈10× fainter) flux level. In addition, the source is observed to exhibit short-timescale “colorless” flares, changing by ≈5× in flux over timescales of ≲1 hr.
- 2.The modeling of the broadband X-ray spectroscopy from NICER and NuSTAR reveals a highly absorbed spectrum, with emission extending out to ≳30 keV. The properties are consistent with the Comptonization of low-energy seed photons by a hot plasma around an NS or BH accretor. The source spectrum becomes harder as it brightens during the X-ray flare.
- 3.We do not find any evidence for pulsations or bursts that would confidently suggest the presence of an NS accretor. We detect the presence of a low-energy excess, likely exhibiting emission lines of Mg and Si, which we model as an optically thin collisionally ionized plasma, with a temperature of ≈0.6 keV.
- 4.Imprinted on the broadband X-ray spectrum, we detect narrow and variable Fe Kα emission, likely arising from the X-ray fluorescence of relatively distant material. We also identify an excess of Si K-edge absorption, which we interpret as an overabundance of silicate dust around the system.
- 5.Spatially coincident with the X-ray transient, we identify a bright and heavily obscured IR source, IRAS 18111-2257, which we demonstrate as showing correlated temporal variability, using data from the PGIR survey.
- 6.With optical/IR spectroscopy of the counterpart, we classify the star to be a very-late-type (M7–M8), pulsating (P ≈ 1500 days), and luminous (MK ≈ −10) Mira variable on the AGB, located at a distance of ≈15 kpc. The X-ray properties and the IR identification suggest that SRGA J181414.6-225604 is a new Galactic SyXRB.
- 7.Collating optical/IR photometric data from the last ≈25 yr, we show that the IR source has undergone dramatic reddening, likely associated with enhanced mass loss and dust production. In particular, the PGIR J-band data conclusively show evidence of an intense fading episode of the counterpart in 2019, ≈800 days prior to the X-ray flare.
- 8.We model the multi-epoch optical-to-MIR SEDs of the source with DUSTY, to show that the dramatic fading observed in the NIR can be explained by an intense dust-obscuration episode of the donor star, characterized by the formation of large dust grains (reaching sizes of a ≈ 2.0 μm) and increased mass loss (reaching
 ≈2.1 × 10⁻⁵
M⊙ yr−1).
≈2.1 × 10⁻⁵
M⊙ yr−1). - 9.The temporal coincidence of the enhanced mass loss with the X-ray flare suggests a causal connection, and we show that the observed timescales and the peak luminosity of the X-ray outburst are consistent with a wide-orbit (∼50 au) compact object undergoing spherical Bondi accretion from the enhanced mass-loss episode.

While the known SyXRBs have been suggested to be undergoing either Roche lobe overflow (GX 1+4) or steady wind accretion (e.g., 4U 1954+31, 4U 1700+24), SRGAJ181414.6-225604 presents the unique case of a system where the orbit is wide enough such that the steady wind accretion results in only very faint X-ray emission. The intense mass-loss episode associated with the dust-formation episode makes it conspicuous in the X-ray sky, and presents the first unambiguous identification of the long-speculated connection between donor mass loss and X-ray activity in SyXRBs. Interestingly, the carbon star companion to the SyXRB CXOGBS J173620.2-293338 also shows evidence for dust-obscuration episodes in its light curve (Hynes et al. 2014); however, there are no constraints on the long-term X-ray behavior of the source. SRGA J181414.6-225604 demonstrates the unique potential of combining long-term IR and X-ray time-domain surveys to reveal a holistic picture of X-ray outbursts in SyXRBs, which are now being revealed as the dominant contribution to the population of faint X-ray transients in the Milky Way (Bahramian et al. 2021).
Similar to SRGA J181414.6-225604, there is likely a large population of quiescent NSs/BHs with wide-orbit companions that are otherwise unremarkable. As the donor stars evolve to later stages, X-ray activity caused by enhanced mass loss and dust formation may thus be ubiquitous in wide-orbit SyXRBs. In fact, sporadic dust-formation episodes are rare among O-rich evolved stars (Bedding et al. 2002), but are known among many symbiotic O-rich Miras (Munari 1988; Munari & Whitelock 1989; Jurkic & Kotnik-Karuza 2010). Given the typical large dust grain sizes formed during this period, NIR surveys are ideally suited to detecting the dramatic fading episodes. Thus, by combining deep hard X-ray surveys like ART-XC with long-term optical/NIR monitoring from deep surveys like WINTER (Lourie et al. 2020) and the Vera C. Rubin Observatory (Ivezić et al. 2019), it may soon be possible to “predict” the onset of accretion outbursts for all Galactic symbiotics by searching for dust-forming bright IR sources coincident with X-ray counterparts.
We thank the anonymous referee for a careful reading of the manuscript and for providing valuable feedback that helped to improve its contents. We thank T. Maccarone, D. Rogantini, P. Pradhan, R. Remillard, and M Guenther for valuable discussions. We thank the Swift, NICER, and NuSTAR teams for approving the Target of Opportunity observations of the transient. Support for this work was provided by NASA through the NASA Hubble Fellowship grant #HST-HF2-51477.001, awarded by the Space Telescope Science Institute, which is operated by the Association of Universities for Research in Astronomy, Inc., for NASA, under contract NAS5-26555.
PGIR is generously funded by Caltech, Australian National University, the Mt Cuba Foundation, the Heising-Simons Foundation, and the Bi-national Science Foundation. PGIR is a collaborative project among Caltech, Australian National University, University of New South Wales, Columbia University, and the Weizmann Institute of Science. This work is based on data from the Mikhail Pavlinsky ART-XC X-ray telescope on board the SRG observatory. The SRG observatory was built by Roskosmos in the interests of the Russian Academy of Sciences, represented by its Space Research Institute (IKI) in the framework of the Russian Federal Space Program, with the participation of the Deutsches Zentrum für Luft und Raumfahrt (DLR). The SRG spacecraft was designed, built, launched, and is operated by the Lavochkin Association and its subcontractors. The science data are downlinked via the Deep Space Network Antennae in Bear Lakes, Ussurijsk, and Baykonur, funded by Roskosmos. The ART-XC team thank the Russian Space Agency, the Russian Academy of Sciences, and State Corporation Rosatom, for the support for the SRG project and the ART-XC telescope, and the Lavochkin Association (NPOL) and partners for the creation and operation of the SRG spacecraft (Navigator). This paper includes data gathered with the 6.5 m Magellan Telescopes located at Las Campanas Observatory, Chile. We acknowledge the Visiting Astronomer Facility at the Infrared Telescope Facility, which is operated by the University of Hawaii under Cooperative Agreement no. NNX-08AE38A with the National Aeronautics and Space Administration, Science Mission Directorate, Planetary Astronomy Program. The authors wish to recognize and acknowledge the very significant cultural role and reverence that the summit of Maunakea has always had within the indigenous Hawaiian community.
The work of I.M., A.L., and A.S. was supported by the Russian Science Foundation grant 19-12-00423. R.S. acknowledges grant No. 12073029 from the National Science Foundation of China. C.P. acknowledges financial support from the Swiss National Science Foundation (SNF).
Facilities: ROSAT, INTEGRAL, XMM Newton, SRG: ART-XC, NICER, Swift, NuSTAR, PO: 0.3 m (PGIR), PO: 1.2 m (ZTF), PO: 1.5 m (SED Machine), PO: Hale (DBSP, TripleSpec), PanSTARRS, NEOWISE, IRTF (SpeX), Magellan: Baade (FIRE), SSO: ATT (WiFeS).
Software: spextool (Cushing et al. 2004), xtellcor (Vacca et al. 2003), pypeit (Prochaska et al. 2020), nustardas (V2.1), Stingray (V0.3; Bachetti et al. 2021), xspec (Arnaud 1996), emcee (Foreman-Mackey et al. 2013), DUSTY (Ivezic & Elitzur 1997), HEAsoft (v6.29c; HEASARC 2014).
Appendix: Multi-epoch Optical/IR Photometry
A1. Ground-based Optical/NIR Photometry
Given the location of the optical/NIR counterpart in a crowded Galactic plane field, we used forced photometry on difference images from ground-based time-domain surveys to derive multicolor light curves. For the PGIR data, the reference image creation took place prior to MJD 58800, and hence we used PSF photometry on the PGIR difference images (using the method described in De et al. 2020b) for subsequent data. To derive absolute J-band fluxes, the difference fluxes were offset to the nonsubtracted J-band flux estimated from contemporaneous aperture photometry on the science images near the brightness maximum of the source (where the relative flux contamination from nearby sources would be minimum). For data taken prior to the reference creation, we used aperture photometry on science images using an 87 aperture. All reported mags are in the 2MASS Vega system.
We retrieved forced photometry at the source location from ATLAS survey data using the public photometry service. 29 The source is not detected in the c filter, but a variable source is clearly detected in the redder o filter. We derived an o-band light curve for the source using difference photometry fluxes offset to the observed flux level in direct photometry near the epochs where the source was brightest. The derived fluxes were converted to AB mag using a zeropoint flux of 3631 Jy.
The source was also observed in the survey operations of ZTF. The light curve derived from the public forced photometry (Masci et al. 2019) service 30 was found to be noisy, due to the very faint optical flux, and hence we derived the photometry using a custom pipeline. We retrieved the ZTF gri science images of the field and used archival stacked images from the PS1 survey as template images for carrying out image subtraction (as described in De et al. 2020c), followed by forced PSF photometry at the source location. The absolute flux level was calibrated using the source optical fluxes in the PS1 stacked catalog and converted to AB mag. The source is not detected in the ZTF g filter, but a variable source is detected in both the r and i filters.
The source was also observed at multiple epochs during the PS1 surveys. For the redder i, z, and y bands, we accumulated the PS1 single-epoch detection photometry from Data Release 2. For the g- and r-band PS1 data, where the source is much fainter, we retrieved the single-epoch PS1 image cutouts to perform subtractions, followed by forced photometry, as in the case of the ZTF images. The PS1 flux measurements are also reported in AB mag. Since the source is slowly evolving, we binned the source flux over periods of ≈7 days when creating the light curves from all the surveys, and the complete ground-based light curve is provided in Table 1.
A2. MIR WISE Photometry
IRAS 18111-2257 is a bright MIR source, and it is reported in the WISE catalogs of the primary four-band Cryo all-sky survey, the three-band Cryo survey, as well as the NEOWISE survey, post the reactivation of the mission (Wright et al. 2010; Mainzer et al. 2011). We retrieved single-epoch photometry for the source from the AllWISE and NEOWISE reactivation catalog. Each “visit” of the source consists of several flux measurements taken within a few days, and we derived an average magnitude for the visit by taking the median of all the good-quality measurements (qual_frame >0, qi_fact >0, saa_sep >0, and moon_masked=0). The standard deviation of the flux measurements per visit is taken as the uncertainty of the flux.
The source is nominally brighter than the saturation threshold of WISE in the W1 and W2 bands. As explained in the WISE Data Release document, 31 photometry for saturated sources is derived by fitting the wings of the nonsaturated regions of the PSF, but this has been observed to be biased in the post-Cryo phase. We applied the recommended corrections to the W1 and W2 photometry on the NEOWISE data, as well as propagating the relevant uncertainties. Since the flux bias for saturated sources in the four-band and three-band Cryo mission was observed to be small (<0.05 mag), we did not apply corrections to the AllWISE photometry. However, we conservatively adopt uncertainties of 15% and 23% for the single-epoch AllWISE W1 and W2 photometry, respectively, as per the estimated uncertainties in the bias correction. The complete WISE light curve of the source after the correction of the aforementioned instrumental effects is given in Table 2.
Footnotes
- 15
- 16
- 17
- 18
- 19
- 20
Due to the very high absorption column, alternative attempts at fitting the low-energy component with BB (bbody) or disk (diskbb) emission produced fits that were poorer or produced unreasonably large luminosity/radii for optically thick components.
- 21
Placing the apec and the high-energy component behind the same absorbing column produces unphysically high luminosity for the apec component. We therefore suggest that the high-energy emission component exhibits a higher absorption column.
- 22
- 23
The choice of fitting the PS1 i band together with the ATLAS o band is motivated by the similar wavelength coverage of the two filters, as well as the desire to obtain the longest well-sampled baseline, between 2010 and 2022. We fix the phase and keep the amplitude variable between the filters, since O-rich Mira pulsations exhibit strong amplitude dependence, but very weak phase dependence, with wavelength (Iwanek et al. 2021).
- 24
We do not use the ATLAS o filter for SED fitting, since it has a very wide bandpass, covering the r and i bands, where the effective extinction varies rapidly. We use r- and i-band photometry instead, where available.
- 25
As defined in the emcee online documentation at https://emcee.readthedocs.io/en/stable/tutorials/line/.
- 26
Since interstellar Si abundances are already included in the Tbabs and pcfabs components, improvements in the fit after including additional edges suggests an overabundance.
- 27
We estimate the radius to be ≈(8−10) × 1013 cm, based on the estimated bolometric luminosity near 2019 and the assumed stellar temperature.
- 28
The constraints on the binary configuration and mass accretion process do not change substantially if we assume a 10 M⊙ BH.
- 29
- 30
- 31