Abstract
Although large polycyclic aromatic hydrocarbons (PAHs) are likely to be responsible for IR emission of gaseous and dusty regions, their neutral experimental high-resolution gas-phase IR spectra—needed to construct accurate astronomical models—have so far remained out of reach because of their nonvolatility. Applying laser desorption to overcome this problem, we report here the first IR spectra of the jet-cooled large PAHs coronene (C24H12), peropyrene (C26H14), ovalene (C32H14), and hexa(peri)benzocoronene (C42H18) in the 3–100 μm region. Apart from providing experimental spectra that can be compared directly to astronomical data, such IR spectra are crucial for assessing the accuracy of theoretically predicted spectra used to interpret interstellar IR emission. Here we use the experimental spectra to evaluate the performance of conventional calculations using the harmonic approximation, as well as calculations with an anharmonic (GVPT2) treatment. The harmonic prediction agrees well with the experiment between 100 and 1000 cm−1 (100 and 10 μm) but shows significant shortcomings in the combination band (1600–2000 cm−1, 6.25–5 μm) and CH-stretch (2950–3150 cm−1, 3.4–3.17 μm) regions. Especially the CH-stretch region is known to be dominated by the effects of anharmonicity, and we find that large PAHs are no exception. However, for the CH out-of-plane region (667–1000 cm−1, 15–10 μm) the anharmonic treatment that significantly improves the predicted spectra for small PAHs leads to large and unrealistic frequency shifts, and intensity changes for large PAHs, thereby rendering the default results unreliable. A detailed analysis of the results of the anharmonic treatment suggests a possible route for improvement, although the underlying cause for the large deviations remains a challenge for theory.
Original content from this work may be used under the terms of the Creative Commons Attribution 4.0 licence. Any further distribution of this work must maintain attribution to the author(s) and the title of the work, journal citation and DOI.
1. Introduction
Polycyclic aromatic hydrocarbons (PAHs) are by now generally accepted to be responsible for the IR emission referred to as aromatic infrared bands (AIBs) observed from gaseous and dusty regions in the interstellar medium (ISM; Gillett et al. 1973; Allamondola et al. 1985; Tielens 2008). Much effort has thus been put into analyzing the IR emission spectra and determining the size distribution and structure of the PAHs in the ISM (Tielens 2013). Although in general IR spectroscopy is an effective tool for structure elucidation (Bakels et al. 2020), when considering the conditions of the ISM combined with that of the heterogeneity of the mixture, it is challenging—and in fact as yet not possible—to identify specific species in the ISM. A more detailed insight into the IR spectroscopic properties of directly relevant PAHs is imperative to interpret the interstellar IR emission.
Interstellar PAHs absorb UV radiation from a nearby star, resulting in the excitation of rovibronic levels of electronically excited states. Internal conversion to the electronic ground state populates highly excited vibrational levels of the ground state that subsequently relax to the vibrational ground state by emitting IR photons through a vibrational cascade (Allamandola et al. 1989; Mackie et al. 2018). As it is not trivial to produce the UV-pumped IR emission spectra of the PAHs of interest under the relevant conditions (Cook et al. 1998; Kim & Saykally 2002, 2003), current state-of-the-art analyses rely on theoretical models (Bauschlicher et al. 2018; Mackie et al. 2018). Such analyses have led to the conclusion that the astronomically relevant PAHs typically have 50–150 carbon atoms organized in a compact structure (Ricca et al. 2012). PAHs that meet these characteristics have been designated as grandPAHs (Andrews et al. 2015). Currently used models are, however, only validated with smaller PAHs and may require optimization for larger molecules (Candian & Mackie 2017).
These theoretical models should include accurate frequency and intensity predictions and be validated by laboratory experiments preferably carried out under cold and gas-phase conditions, e.g., in a molecular beam experiment. Difficulties producing a sufficient amount of gas-phase molecules to seed into a molecular beam by resistively heating the sample have so far restricted cold, gas-phase spectroscopy to smaller PAHs (Maltseva et al. 2015, 2016, 2018). To overcome these problems, we make use here of laser desorption (Meijer et al.1990) to bring a sufficient amount of molecules into the gas phase and subsequently entrain and cool them in a molecular beam. This approach thus enables us to record high-resolution, cold, gas-phase IR spectra of much larger PAHs than have been reported so far.
In the present study we report on the IR absorption spectra of the large and compact PAHs coronene (C24H12), peropyrene (C26H14), ovalene (C32H14), and hexa(peri)benzocoronene (C42H18). Experimental IR spectra in the range between 3 and 100 μm are obtained under cold and isolated conditions and compared to, where available, state-of-the-art anharmonic calculations. As a result of its accessibility with ground-based telescopes, the CH-stretch 3 μm region is a well-studied region. Our recent studies on smaller PAHs have shown that this region is dominated by Fermi resonances, which considerably complicate its analysis (Maltseva et al. 2015, 2016, 2018). The CC-stretch region between 5 and 10 μm (1000–2000 cm−1) shows most activity from cationic species, while neutral large PAHs dominate the 15–10 μm (667–1000 cm−1) CH out-of-plane range (Tielens 2008). This range is most diagnostic for the structure of PAHs. As shifts of only a few wavenumbers are observed for different astronomical objects, a correct interpretation requires accurate reference spectra (Hony et al. 2001; Matsuura et al. 2014). Longer-wavelength, far-IR regions contain weak bands, but since these bands are associated with unique global modes with molecule-specific IR frequencies, they provide clear fingerprints of the size and global structure of the PAHs from which they originate (Mulas et al. 2006). Laboratory spectroscopic studies of large PAHs in this region are therefore important to support the interpretation of new observational searches (Ricca et al. 2012).
2. Methods
Experiments were performed using a laser desorption molecular beam apparatus (Rijs & Oomens 2015) located at the FELIX laboratory in the Netherlands (Oepts et al. 1995). Coronene (97%) was purchased from Sigma-Aldrich, ovalene (99.6%) and peropyrene (99.5%) were purchased from Kentax, while hexa(peri)benzocoronene was synthesized using the procedure described by Liu et al. (2011). The compounds were, without further purification, mixed with carbon black in a 1:1 ratio, after which a graphite sample bar was pressed into the mixture. A slightly focused 1064 nm laser beam (10 Hz, Polaris Pulsed Nd:YAG Laser, NewWave Research) with a typical energy of 1 mJ per pulse was used to desorb the molecules while translating the sample bar, thereby providing a fresh sample at every shot. The sample bar was placed in front of the nozzle of a pulsed valve (Jordan Co.) covering about half the orifice, and the desorbed molecules were picked up by an argon jet (10 Hz, 8 bar backing pressure). The expanding gas pulse was skimmed before being crossed with three laser beams to perform IR–UV ion dip spectroscopy: one IR laser to probe the ground-state vibrational frequencies, and two UV/VIS lasers perpendicular to the molecular beam to perform 1 + 1′ resonance-enhanced multiphoton ionization (REMPI). IR light was provided by the free electron laser FELIX for spectroscopy between 100 and 2000 cm−1 counterpropagating the molecular beam or by a high-resolution OPO laser (Laser Vision) covering the 2950–3150 cm−1 region perpendicular to the molecular beam. The bandwidth of FELIX is 0.5%–1% of the IR frequency, while the bandwidth of the OPO is approximately 0.1 cm−1. The idler frequency of the OPO was calibrated continuously during measurements using a HighFinesse WS-7 wavelength meter. Excitation and ionization laser beams were provided by an Nd:YAG laser-pumped dye laser (Innolas Spitlight, Lioptec) and a 193 nm ArF excimer laser (Neweks), respectively. The ions were detected in a reflectron time-of-flight mass spectrometer (Jordan Co.). In our experiments we used excitation frequencies of 24,187.7 cm−1 for coronene ( ; Kunishige et al. 2017), 21,455.9 cm−1 for ovalene (
 ; Amirav 1981), and 23,074.7 cm−1 for hexa(peri)benzocoronene (feature a; see Kokkin et al. 2008). The REMPI excitation spectrum of peropyrene has not been measured in previous studies and is reported in the Appendix (Figure A1). From this spectrum it can be concluded that the
  transition occurs at 23,166.2 cm−1, which has been the frequency used for the IR–UV ion dip experiments on this compound. For each of these electronic transitions a typical FWHM of about 1 cm−1 was observed. The IR lasers were operated at half the repetition rate of the REMPI lasers in order to collect alternating IR-on/IR-off ion yields.
Results of harmonic calculations on coronene, ovalene, and hexa(peri)benzocoronene were retrieved from the NASA Ames PAH IR spectroscopic database (PAHdb; Bauschlicher et al. 2018). The anharmonically calculated spectrum of coronene was taken from the study of Mulas et al. (2018), while the anharmonic spectra of ovalene, hexa(peri)benzocoronene, and peropyrene were calculated using GVPT2 (Frisch et al. 2016) as incorporated into the Gaussian16 suite of programs, employing the B3LYP/Jun-cc-pVDZ or B3LYP/N07D level of theory with a superfine grid and very tight optimization (Frisch et al. 2016). For ovalene we found that the standard anharmonic treatment resulted in unrealistic frequency shifts and intensity changes of fundamental bands in the CH out-of-plane region. To resolve this, we recomputed the anharmonic treatment but skipped modes 55, 58, and 62 and simply applied a scaling factor of 0.96 to these particular modes. This is discussed in more detail in Section 3.7. All displayed calculated spectra have been convoluted with a 1 cm−1 FWHM Gaussian in the 3 μm region and a Gaussian with an FWHM of 1% of the frequency in the 5–100 μm region, roughly corresponding to the FELIX laser bandwidth.
3. Results and Discussion
The IR absorption spectra of jet-cooled coronene, ovalene, hexa(peri)benzocoronene, and peropyrene in the 3 μm (OPO, 2950–3150 cm−1) and the 5–100 μm (FELIX, 100–2000 cm−1) regions are shown in Figure 1. Since the width of the peaks in the FELIX region is determined by the bandwidth of FELIX, narrower line widths are observed in the far-IR than in the mid-IR region. The bandwidth of the OPO laser, on the other hand, is approximately 0.1 cm−1, meaning that the observed line width of about 1 cm−1 is a result of the population distribution over rotational states, which is in line with the observed band widths of the electronic transitions. A rough estimate of the rotational temperature leads to a ballpark figure of 2 K, indicating that even with such large molecules effective cooling is possible. A list of the observed transitions is provided in the Appendix (Table A1).
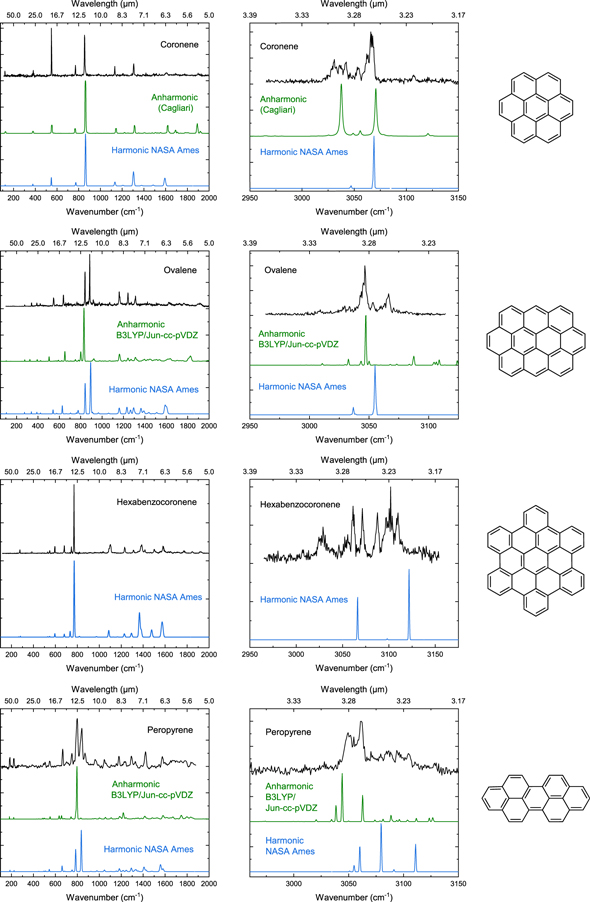
Figure 1. IR absorption spectra of coronene, ovalene, hexa(peri)benzocoronene, and peropyrene in a molecular beam (black), together with predicted spectra using the harmonic approximation (blue) and including anharmonic effects (green). The harmonically calculated spectra have been retrieved from the NASA Ames PAH IR spectroscopic database (PAHdb; Bauschlicher et al. 2018), the anharmonic calculation of coronene was taken from the Cagliari database (Mulas et al. 2018), and the (default) anharmonic calculations of ovalene and peropyrene have been performed in the present study. The spectral regions discussed in this article include the CH-stretch (2950–3150 cm−1, 3.4–3.17 μm), combination band (1600–2000 cm−1, 6.25–5 μm), and CH out-of-plane (667–1000 cm−1, 15–10 μm) regions, as well as the far-IR region at lower frequencies (longer wavelengths) than that.
Download figure:
Standard image High-resolution image3.1. General Comparison to Harmonic Calculations
Figure 1 compares experimentally recorded IR spectra with spectra predicted by harmonic and anharmonic calculations. This figure shows that the most intense bands in the FELIX region associated with the CH out-of-plane modes at approximately 800 cm−1 are well predicted using the harmonic approximation. However, as shown in Figure 2, the combination bands observed in the experimental spectrum between 1600 and 2000 cm−1 are not reproduced, as they are per definition absent at this level of theory. For this reason Boersma et al. analyzed the astronomical PAH emission bands that fall in this region using a combination of laboratory measurements and anharmonic computations (Boersma et al. 2009). On average, the region below 1000 cm−1 is better predicted than the region between 1000 and 1600 cm−1 (difference of 0.6% and 1.3%, respectively). Similar to what was observed for smaller PAHs, the 3 μm region of these large PAHs is dominated by Fermi resonances and combination bands. These lead to the observation of many more bands than predicted by harmonic theory and cause a large discrepancy between experiment and theory. Since the 3 μm and the 5–6 μm regions are much more influenced by anharmonicity, it is clear that the interpretation of the IR emission in these regions should be based on models that incorporate resonances and are able to predict combination bands.
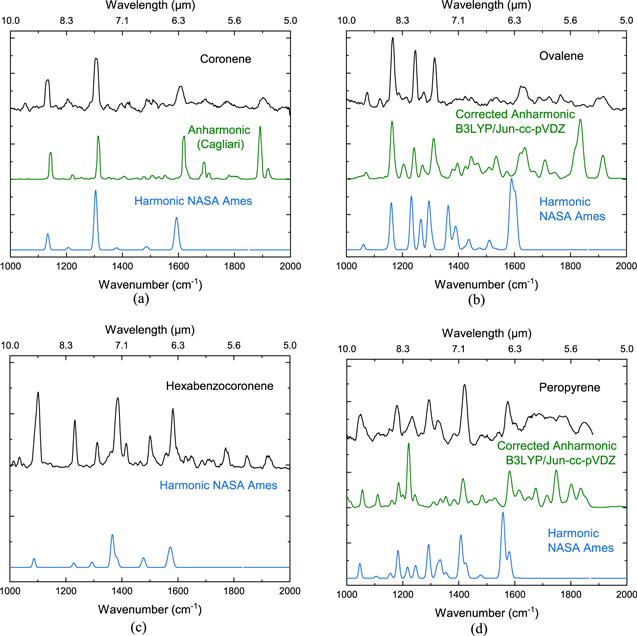
Figure 2. Zoom-in of the IR absorption spectra of coronene, ovalene, hexa(peri)benzocoronene, and peropyrene in a molecular beam (black), together with predicted spectra using the harmonic approximation (blue) and including anharmonic effects (green). The harmonically calculated spectra have been retrieved from the NASA Ames PAH IR spectroscopic database (PAHdb; Bauschlicher et al. 2018), the anharmonic calculation of coronene was taken from the Cagliari database (Mulas et al. 2018), and the anharmonic calculations of ovalene and peropyrene have been performed in the present study.
Download figure:
Standard image High-resolution image3.2. General Comparison to Anharmonic Calculations
Anharmonic calculations account for combination bands and resonances and should therefore result in a more accurate prediction of the IR spectra of PAHs. In previous experiments we showed how anharmonic calculations can be used to obtain, for relatively small PAHs, an accurate description (<0.5%) of the FELIX region including the combination bands (1600–2000 cm−1). More extensive research has been performed on the evaluation of anharmonic calculations in the 3 μm region, also for relatively small PAHs, for which the improvement on anharmonic treatment has led to a significant reappraisal of the interpretation of astronomical observations (Maltseva et al. 2015, 2016, 2018). Here, anharmonic calculations have been performed for ovalene and peropyrene using Gaussian16 GVPT2 (Barone et al. 2010, 2014). Such calculations are not possible for coronene and hexa(peri)benzocoronene since an anharmonic treatment of symmetric top molecules has not yet been implemented in Gaussian16. For coronene we therefore resort to the anharmonic spectrum reported by Mulas et al. (2018), but for hexa(peri)benzocoronene anharmonic spectra are for the moment out of our reach. In the following sections we will discuss for each of these compounds in more detail the comparison between experimental and theoretically predicted spectra.
3.3. Coronene
Comparison of the anharmonically predicted spectrum of coronene with the experimental spectrum in Figure 1 shows good agreement, especially in the combination band region (1600–2000 cm−1) as can be seen more clearly in Figure 2. The most intense peak in the spectrum, the CH out-of-plane band at 854.6 cm−1, is not shifted significantly upon anharmonic treatment. The same applies to other bands in this region. The band at 549 cm−1 is about four times more intense in our experiments than predicted in both the harmonic and anharmonic calculations. Interestingly, we find in the far-IR that the frequency of the band observed in the experimental spectrum at 121 cm−1, which is associated with the drumhead mode, is 4% off in the anharmonic calculation but only 1% in the harmonic one. Since the potentials of these low-frequency modes are quite shallow, this difference most probably is the result of inaccurate anharmonic constants.
In the region between 1000 and 2000 cm−1 the three largest bands at 1132, 1306, and 1607 cm−1 are well described by both harmonic and anharmonic calculations (see Figure 2). However, in agreement with the activity in the experimental spectrum the anharmonic analysis gives rise to many small features in this region that are not present in the harmonic approximation, although an unambiguous assignment of each individual feature is challenging. It is gratifying as well to find that the experimentally measured combination bands at 1694, 1774, and 1903 cm−1 agree relatively well with the predictions by Mulas et al. (2018).
The 3 μm region shows an impressive improvement on including anharmonicity. Especially notable is the 3030 cm−1 band in the anharmonic calculations, which accounts for the intensity observed in this region in the experiment, although experimentally this intensity is distributed over three close-lying bands. We tentatively conclude that this discrepancy is caused by Coriolis resonances since coronene possesses degenerate vibrational states but rotation−vibration coupling is not included in the anharmonic approximation made by Mulas et al. Providing further support for the validity of these anharmonic calculations are the smaller bands observed experimentally at 3054 and 3107 cm−1, which, albeit slightly shifted, are nicely predicted by these calculations.
3.4. Hexabenzocoronene
The experimental IR spectrum of hexabenzocoronene is compared only to harmonic theory, since the anharmonic treatment of symmetric tops is not implemented in Gaussian16. Reducing the symmetry by a small perturbation of the atomic masses was not sufficient to circumvent this issue. Experimental and theoretical IR spectra are displayed in Figure 1. Features that attract interest include the far-IR peak at 276.8 cm−1, which is assigned to a mode in which the central ring moves out of the plane. The deviation of the predicted frequency from the experimental one is 1.6%, which is relatively large compared to other modes below 700 cm−1 whose frequencies fall within 0.3% of experimental values.
The most intense band in the spectrum at 770 cm−1, corresponding to the CH out-of-plane bending mode, agrees well with harmonic theory, as was the case for coronene. The bands between 1000 and 1600 cm−1 are all predicted at a lower frequency than experimentally observed, differences ranging from 4 up to 30 cm−1. The combination bands between 1500 and 2000 cm−1 are well resolved for hexabenzocoronene, as are most bands in the 3 μm region. Due to the high symmetry of hexabenzocoronene, only three doubly degenerate CH-stretch transitions are IR active in the harmonic approximation. Clearly, this is in contrast with the experiment where at least eight transitions are observed with significantly (red)shifted frequencies.
3.5. Ovalene
In the case of ovalene, the far-IR frequencies are well predicted by the harmonic NASA Ames PAHdb spectra, the average deviation being less than 0.5%. The CH out-of-plane bend region with the most intense bands between 800 and 900 cm−1 is somewhat less accurate but still within 1%. Significant deviations from the harmonic predicted spectrum occur above 1100 cm−1. Particularly eye-catching are the bands predicted to occur at 1363 cm−1 and two around 1600 cm−1, which are completely absent in the experimental IR spectrum.
Comparison of the experimental IR spectrum in the FELIX region with the anharmonic spectrum reveals large discrepancies. Upon anharmonic treatment the main fundamental transitions are shifted by an unrealistically large amount, and they experience large intensity changes. For example, harmonic calculations predict a band at 879 cm−1 with an intensity of 58 km mol−1, which is in good agreement with the experiment. In the anharmonic calculation this band shifts to 536 cm−1 and is predicted to have an intensity of only 0.1 km mol−1. Further inspection of the bands indicates that these unrealistic changes all correspond to C and H out-of-plane bending modes. Since these modes are extensively involved in combination bands and resonances, one would at first expect that the combination band region and 3 μm region would also be affected by the incorrect anharmonic description of these modes. Nevertheless, it appears that the position of the main band in the 3 μm region is improved upon including anharmonicity, which in general leads to a qualitatively better agreement with the experiment. The large shifts that occur upon anharmonic treatment are discussed further in Section 3.7.
3.6. Peropyrene
Comparison of the experimental IR spectrum with the harmonic calculations shows a good agreement of the two most intense bands in the 100–2000 cm−1 region, although their intensities are reversed (see Figure 1). The band observed experimentally at 837 cm−1 matches well with harmonic theory, while the second-largest band is slightly off (experimentally at 797 cm−1 vs. harmonic theory at 785 cm−1). The far-IR peaks agree well with theory with an average deviation of 0.6%, as was the case for coronene, hexabenzocoronene, and ovalene.
Anharmonic treatment of the peropyrene spectrum leads to large discrepancies with the experimental spectrum in the CH out-of-plane bending region. In addition, the 1000–1600 cm−1 region is not significantly improved by the anharmonic treatment. Although the frequencies of the bands observed experimentally at 1420 and 1576 cm−1 are slightly improved, the overall description is better in the harmonic approximation. Due to the bandwidth of FELIX, the 1600–1900 cm−1 region is not well resolved. Importantly, though, the activity in this region, which is absent in the harmonic calculations but clearly observed in the experimental spectrum, is reproduced by the anharmonic calculations. Similar to ovalene, the 3 μm region in improved qualitatively by including anharmonicity, but an assignment of individual bands is not clear-cut. Similar to coronene and ovalene, a significant portion of the intensity is found to the red of the harmonically predicted bands.
3.7. Anharmonic Calculations on Large PAHs
To understand why the anharmonic treatment of the larger PAHs ovalene and peropyrene leads to large and unrealistic changes in their IR absorption spectra, we performed the same procedure on other archetypal small and large PAHs. This study includes naphthalene, anthracene, phenanthrene, acenaphthene, pentacene, benzo[ghi]perylene, isoviolanthrene, anti-dipyrenylene, and syn-dipyrenylene, as well as the nitrogen-containing PAHs quinoline and isoquinoline. Since the fundamental transitions in the 100–1600 cm−1 region—and especially the more intense bands—are well predicted using the harmonic approximation, we have plotted in Figures 3(a) and (b) the anharmonically calculated frequencies as a function of the harmonic frequencies for smaller PAHs and larger PAHs, respectively, taking 22 carbon atoms as dividing small and large.
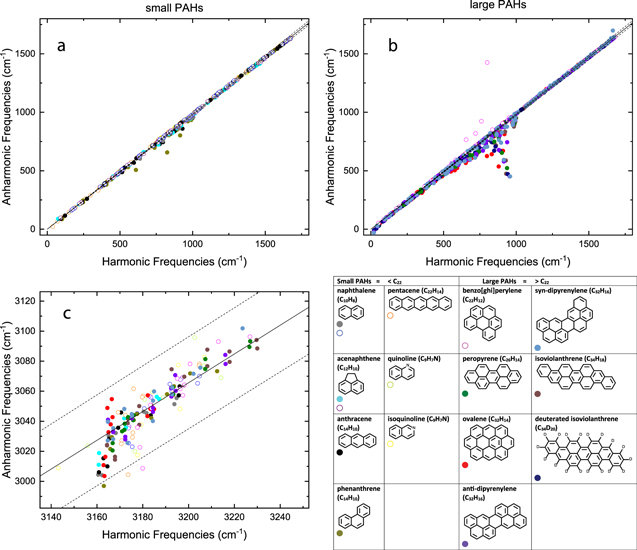
Figure 3. Fundamental anharmonic frequencies as a function of harmonic frequencies for (a) small and (b) large PAHs in the far- and mid-IR regions and (c) small and large PAHs in the 3 μm region. The solid line is a linear fit, and the dotted lines indicate a 1% deviation. Filled and open circles correspond to calculations with the Jun-cc-pVDZ and N07D basis sets, respectively.
Download figure:
Standard image High-resolution imageFor small PAHs we observe a linear relationship between harmonic and anharmonic frequencies, in line with the generally accepted use of a scaling factor to correct harmonic frequencies. No significant (>1%) deviation from the linear relation is observed. Phenanthrene is in this respect an exception, but the affected modes are IR-inactive. In general, the larger PAHs show a similar linear relationship, but large deviations are observed for modes with frequencies between 750 and 1000 cm−1. We find that the unrealistically large frequency shift that was observed in the anharmonic calculations on ovalene and peropyrene is also present in the calculations on other large PAHs, but absent in anharmonic calculations on smaller PAHs. Concurrently with these large frequency changes, also large changes in intensity occur, e.g., the mode at 879 cm−1 of ovalene loses almost all of its intensity after the anharmonic treatment. These modes correspond for all investigated PAHs with C and H out-of-plane bending vibrations. Modes in the 3 μm region, on the other hand, behave regularly, with almost all fundamental anharmonic frequencies being within a 1% deviation from a linear relationship with the harmonic frequencies.
In order to overcome these clear inadequacies of the anharmonic treatment, we have removed the anharmonic contributions of selected modes and instead simply scale the frequencies of these modes. In the case of ovalene these concern modes 55, 58, and 62, with modes 55 and 62 corresponding to the bands with the highest intensity in the region up to 2000 cm−1. Mode 58 is the most affected mode in this region in terms of frequency. For peropyrene we similarly find that the modes with the highest intensity (modes 39 and 42) need to be removed from the anharmonic treatment. In the harmonic framework, these modes include out-of-plane displacements of both C and H atoms. The results of this alternative treatment are shown in Figure 4. Zoom-ins of the 1000–2000 cm−1 region with the corrected anharmonic treatment are displayed in Figure 2. For ovalene we observe that—besides the modes that are removed from the anharmonic treatment—also the bands between 1000 and 2000 cm−1 are slightly affected. In contrast, the 3 μm region is not affected by removal of the three modes in the anharmonic analysis. The zoom-in of the 1000–2000 cm−1 region of ovalene shows a large improvement with respect to the harmonic approximation. In the case of peropyrene, our alternative anharmonic treatment only minimally affects the 1000–2000 cm−1 region and the 3 μm region (see Figure 4). A significant improvement is, however, observed in the bands in the 600–750 cm−1 region, directly to the red of modes 39 and 42. Similar to what was found for the 3 μm and mid-IR regions of small PAHs (Maltseva et al. 2015, 2016, 2018), we thus conclude that for large PAHs an anharmonic treatment is a suitable and necessary route for improving predicted IR spectra, with an important caveat that one needs to eliminate unrealistic frequency and intensity changes in the 750–1000 cm−1 region.
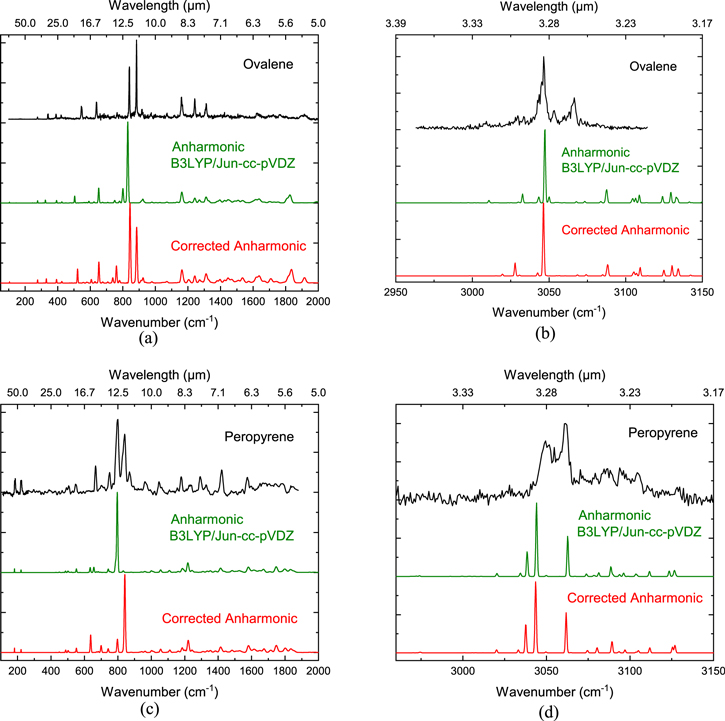
Figure 4. IR absorption spectrum of ovalene and peropyrene in a molecular beam (black), together with predicted spectra using the anharmonic treatment in Gaussian16 (green). Large, unrealistic frequency shifts and intensity changes are corrected for by taking modes 55, 58, and 62 out of the anharmonic analysis of ovalene and modes 39 and 42 in the case of pyropyrene (red).
Download figure:
Standard image High-resolution imageIt is interesting to notice that other recent studies (Bauschlicher2016; Karadakov 2016; Fortenberry et al. 2017; Lee & Fortenberry 2020) also report on problems with calculating frequencies of out-of-plane bending modes of systems that include C=C bonds. In these studies, harmonic calculations gave rise to imaginary frequencies for geometries for which these modes should have real frequencies. In our harmonic calculations on large PAHs we do not encounter such imaginary frequencies and also find that the low-frequency peaks in the far-IR are relatively well predicted using harmonic theory. Instead, the unrealistically large intensity changes and frequency shifts of the out-of-plane bending modes only arise after anharmonic analysis. It is nevertheless remarkable that the modes for which this occurs are the same kind of modes discussed by Lee & Fortenberry (2020) for benzene-like molecules, namely, modes where both C and H atoms move out of the plane, suggesting that there is link between these two issues.
4. Astrophysical Implications
The present study has investigated the 3–100 μm (100–3150 cm−1) IR spectra of coronene, ovalene, hexa(peri)benzocoronene, and peropyrene under astronomically relevant conditions, that is, at low temperatures and under isolated conditions. These are larger PAHs with different geometries and edge topologies that come close to the size of PAHs concluded to be dominantly responsible for the AIBs (Ricca et al. 2012; Andrews et al. 2015). Previously, gas-phase high-resolution IR spectra of small PAHs have been used to validate anharmonic calculations, and the incorporation of anharmonicity was proven to be essential. However, larger PAHs have so far remained out of reach both from an experimental point of view and from the application of high-end anharmonic theoretical methods. The present study thus provides the first direct lead to assessing the suitability of theoretical methods to predict IR spectra of large PAHs and their application in astronomical models.
First, we find that the experimental IR spectra of larger PAHs confirm the conclusion drawn from previous experiments on small PAHs that far-IR modes are not by default anharmonic but can be calculated harmonically with a comparable accuracy as with more expensive anharmonic treatments. In quantitative terms we show that the frequencies of the main CH out-of-plane features in the region below about 1000 cm−1 are computed on the harmonic level of theory within 0.6% of their experimental values. This is an important conclusion since this region is also the spectral region in the interstellar IR emission where most characteristic bands are attributed to neutral PAHs.
Second, the bands that are located above about 1000 cm−1 are largely affected by anharmonicity. In the combination band region (1600–2000 cm−1), where no intensity is predicted using the harmonic approximation, and especially in the 3 μm region (2950–3150 cm−1), the spectra are dominated by anharmonicity. The combination band region is relatively accurately predicted for coronene by Mulas et al., and also in the 3 μm region a qualitative improvement can be observed for ovalene and peropyrene. For all large PAHs studied here we find that anharmonicity results in an average redshift of the CH-stretch peaks and that its inclusion is necessary to come to a realistic comparison with the experimental spectrum.
Third, the symmetry of coronene and hexabenzocoronene impedes the anharmonic treatment in Gaussian16. Quite unexpectedly, we find that an anharmonic treatment of PAHs with a lower symmetry such as ovalene and peropyrene results in unrealistically large frequency shifts and intensity changes of C and H out-of-plane bending modes between about 700 and 1000 cm−1. This renders the default GVPT2 calculations in Gaussian16 unreliable. Our studies show that an alternative treatment in which the anharmonic contributions from the most affected modes are not taken into account avoids such problems. Interestingly, we find that removal of these modes leaves the anharmonicity-dominated 3 μm region almost unaffected. Although incorporating anharmonicity is thus key for a proper analysis of AIBs, our studies show that this should be done with much care when considering larger PAHs.
5. Conclusions
Laser desorption opens up the possibility of bringing large PAHs in the gas phase and studying them under cold and isolated conditions. Using IR–UV ion dip spectroscopy, mass-selective IR spectra of neutral PAHs have been obtained that can be used to validate theoretical methods that are crucial for the modeling and subsequent interpretation of astronomical studies of interstellar IR emission. Previous studies have focused on small PAHs and mainly on their CH-stretch region. In contrast, the present work gives access to PAHs with astronomically relevant sizes and covering the 3–100 μm region. We have found that the anharmonic treatment that is beneficial for smaller PAHs results in unrealistic, large frequency shifts and intensity changes of C and H out-of-plane bending modes of large PAHs between about 10 and 13 μm. These bands are, on the other hand, relatively well predicted using the harmonic approximation. In the far-IR region global modes are located that are unique for individual PAH species and that may allow for discrimination of specific PAHs. These modes appear to be well described within the harmonic approximation, and their anharmonic treatment does not lead to significant improvements. Anharmonicity remains, however, also for larger PAHs the dominating factor that absolutely needs to be taken into account to come to a proper description of the combination band (5–6 μm) and CH-stretch region (3 μm).
This work was supported by the Netherlands Organization for Scientific Research (NWO) and is part of the Dutch Astrochemistry Network (DAN) II (project No. 648.000.029). The authors thank the FELIX laboratory team for their experimental assistance and scientific support and also acknowledge the Nederlandse Organisatie voor Wetenschappelijk Onderzoek (NWO) for the support of the FELIX Laboratory and SURFsara for their computational resources. Last but not least, we would like to thank Bernard Postema for his technical assistance during the experiments, Alessandra Candian for fruitful discussions regarding anharmonic calculations, and Hans Sanders for the synthesis of hexabenzocoronene.
Appendix
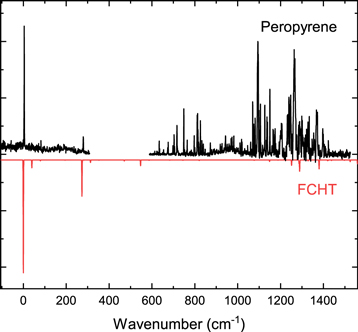
Figure A1. 1 + 1′ REMPI excitation spectrum of peropyrene. Energies are given with respect to the 0–0 transition at 23,166.2 cm−1.
Download figure:
Standard image High-resolution imageTable A1. Experimentally Measured Bands of Coronene, Ovalene, Hexa(peri)benzocoronene, and Peropyrene Compared to the Harmonic and Anharmonic Theoretically Predicted Bands
| Exp (cm−1) | Rel. Int. | Harmonic NASA Ames (cm−1) | Rel. Int. | Anharmonic (cm−1) | Rel. Int. | ||
|---|---|---|---|---|---|---|---|
| Coronene | |||||||
| 121.1 | 0.004 | 122.6 | 0.03 | 126 | 0.03 | ||
| 381.1 | 0.03 | 377.7 | 0.04 | 379 | 0.04 | ||
| 549.2 | 0.61 | 548 | 0.16 | 553 | 0.16 | ||
| 770.1 | 0.21 | 773.2 | 0.07 | 767 | 0.09 | ||
| 854.6 | 1.00 | 862.8 | 1.00 | 862 | 1.00 | ||
| 1132.1 | 0.19 | 1134 | 0.07 | 1143 | 0.10 | ||
| 1208.1 | 0.08 | 1207 | 0.01 | 1222 | 0.01 | ||
| 1306.4 | 0.35 | 1304 | 0.16 | 1315 | 0.15 | ||
| 1607.1 | 0.23 | 1593 | 0.07 | 1619 | 0.19 | ||
| 1694 | 0.09 | 1692 | 0.10 | ||||
| 1774.4 | 0.09 | 1783 | 0.04 | ||||
| 1902.8 | 0.12 | 1889, 1892, 1895, 1918, 1920 | 0.26 | ||||
| 3024.88 | 0.14 | ||||||
| 3030.83 | 0.52 | ||||||
| 3036.62 | 0.29 | ||||||
| 3041.75 | 0.29 | ||||||
| 3053.72 | 0.28 | ||||||
| 3062.84 | 0.51 | ||||||
| 3066.84 | 1.00 | ||||||
| 3107.13 | 0.11 | ||||||
| Ovalene | |||||||
| 276.0 | 0.03 | 274.5 | 0.03 | ||||
| 340.4 | 0.05 | 338.8 | 0.04 | ||||
| 389.9 | 0.06 | 390.0 | 0.03 | ||||
| 421.8 | 0.05 | 423.5 | 0.02 | ||||
| 546.6 | 0.18 | 541.2 | 0.08 | ||||
| 577.5 | 0.04 | 575.4 | 0.01 | ||||
| 638.3 | 0.21 | 627.8 | 0.16 | ||||
| 765.2 | 0.09 | 759.7 | 0.02 | ||||
| 779.4 | 0.07 | 777.2, 773.9 | 0.07 | ||||
| 839.2 | 0.69 | 841.4 | 0.59 | ||||
| 884.0 | 1.00 | 892.90 | 1.00 | ||||
| 918.7 | 0.25 | 910.0 | 0.03 | ||||
| 973.8 | 0.14 | 965.4 | 0.02 | ||||
| 1073.4 | 0.12 | 1061.0 | 0.01 | ||||
| 1120.5 | 0.08 | 1147.0 | 0.00 | ||||
| 1165.4 | 0.71 | 1159, 1165 | 0.12 | ||||
| 1245.8 | 0.53 | 1232.0 | 0.13 | ||||
| 1277.7 | 0.13 | 1294.0 | 0.11 | ||||
| 1315.3 | 0.56 | 1363.0 | 0.11 | ||||
| 1421.0 | 0.49 | ||||||
| 1533.5 | 0.22 | ||||||
| 1630.5 | 0.53 | 1588, 1604 | 0.28 | ||||
| 1689.0 | 0.18 | ||||||
| 1723.8 | 0.17 | ||||||
| 1765.5 | 0.18 | ||||||
| 1909.9 | 0.26 | ||||||
| 3008.67 | 0.08 | ||||||
| 3029.28 | 0.16 | ||||||
| 3033.62 | 0.14 | ||||||
| 3046.11 | 1.00 | ||||||
| 3053.22 | 0.20 | ||||||
| 3065.77 | 0.52 | ||||||
| Hexa(peri) benzocoronene | |||||||
| 276.8 | 0.05 | 281.2 | 0.01 | ||||
| 530.5 | 0.02 | 529.2 | 0.01 | ||||
| 548.0 | 0.05 | 547.7 | 0.01 | ||||
| 594.4 | 0.12 | 595.1 | 0.05 | ||||
| 680.7 | 0.18 | 681.2 | 0.04 | ||||
| 746.1 | 0.11 | 734.3 | 0.08 | ||||
| 770.1 | 1.00 | 771.3 | 1.00 | ||||
| 819.2 | 0.03 | 818.3 | 0.01 | ||||
| 1035.4 | 0.08 | ||||||
| 1098.9 | 0.67 | 1086 | 0.04 | ||||
| 1232.1 | 0.26 | 1228 | 0.04 | ||||
| 1312.0 | 0.16 | 1293 | 0.05 | ||||
| 1384.0 | 0.75 | 1366 | 0.32 | ||||
| 1414.9 | 0.17 | 1382 | 0.09 | ||||
| 1501.7 | 0.26 | 1477 | 0.09 | ||||
| 1582.4 | 0.61 | 1569 and 1577 | 0.24 | ||||
| 1628.2 | 0.06 | ||||||
| 1647.6 | 0.10 | ||||||
| 1686.3 | 0.06 | ||||||
| 1709.0 | 0.07 | ||||||
| 1726.0 | 0.05 | ||||||
| 1772.4 | 0.18 | ||||||
| 1847.3 | 0.09 | ||||||
| 1923.5 | 0.12 | ||||||
| 3007.2 | 0.04 | ||||||
| 3028.6 | 0.64 | ||||||
| 3046.1 | 0.06 | ||||||
| 3055.3 | 0.27 | ||||||
| 3061.4 | 0.37 | ||||||
| 3071.5 | 0.36 | ||||||
| 3087.5 | 0.40 | ||||||
| 3100.2 | 1.00 | ||||||
| 3109.2 | 0.50 | ||||||
| Peropyrene | |||||||
| 182.40 | 0.04 | 181.80 | 0.01 | 181.43 | 0.00878 | ||
| 186.00 | 0.05 | 186.00 | 0.04 | ||||
| 221.80 | 0.08 | 223.50 | 0.03 | 220.7 | 0.006829 | ||
| 492.90 | 0.03 | 495.40 | 0.01 | 486.5 | 0.007805 | ||
| 506.10 | 0.05 | 509.70 | 0.02 | 501.6 | 0.007805 | ||
| 548.50 | 0.07 | 544.30 | 0.06 | 551.7 | 0.025366 | ||
| 666.70 | 0.19 | 661.00 | 0.14 | ||||
| 749.80 | 0.16 | 751.90 | 0.04 | ||||
| 772.00 | 0.06 | ||||||
| 797.00 | 1.00 | 785.00 | 0.55 | ||||
| 837.20 | 0.94 | 836.10 | 1.00 | ||||
| 869.20 | 0.16 | ||||||
| 965.40 | 0.22 | 978.70 | 0.02 | 961.3 | 0.00878 | ||
| 1018.50 | 0.02 | ||||||
| 1050.50 | 0.45 | 1047.00 | 0.01 | 1155.8 | 0.273171 | ||
| 1112.00 | 0.25 | 1105.00 | 0.00 | 1108.1 | 0.204878 | ||
| 1155.00 | 0.11 | 1156.00 | 0.01 | 1161 | 0.107317 | ||
| 1179.10 | 0.81 | 1183.00 | 0.07 | 1187.4 | 0.4 | ||
| 1231.90 | 0.28 | 1218.8 | 1 | ||||
| 1267.50 | 0.07 | ||||||
| 1293.60 | 0.50 | 1292.00 | 0.09 | 1309.6 | 0.11 | ||
| 1326.90 | 0.95 | 1335.00 | 0.04 | ||||
| 1384.60 | 0.29 | 0.00 | 1383.9 | 0.15 | |||
| 1420.40 | 0.93 | 1407 | 0.11 | 1415 | 0.53 | ||
| 1482.80 | 0.76 | 1478 | 0.01 | 1484.3 | 0.263415 | ||
| 1542.60 | 0.12 | 1526.1 | 0.517073 | ||||
| 1576.10 | 1.16 | 1558 | 0.17 | 1581.6 | 1.073171 | ||
| 1598.50 | 0.13 | 1580 | 0.07 | 1613.5 | 0.204878 | ||
Note. Frequencies in cm−1 and normalized intensities.