Abstract
Fast radio bursts (FRBs) are high-energy, short-duration phenomena in radio astronomy. Identifying their host galaxies can provide insights into their mysterious origins. In this paper, we introduce a novel approach to identifying potential host galaxies in three-dimensional space. We use FRB 20190425A and GW190425 as examples to illustrate our method. Recently, due to spatial and temporal proximity, the potential association of GW190425 with FRB 20190425A has drawn attention, leading to the identification of a likely host galaxy, UGC 10667, albeit without confirmed kilonova emissions. We search for the host galaxy of FRB 20190425A with a full CHIME localization map. Regardless of the validity of the association between GW190425 and FRB 20190425A, we identify an additional potential host galaxy (SDSS J171046.84+212732.9) from the updated GLADE galaxy catalog, supplementing the importance of exploring the new volume. We employed various methodologies to determine the most probable host galaxy of GW190424 and FRB 20190425A, including a comparison of galaxy properties and constraints on their reported observation limits using various kilonova models. Our analysis suggests that current observations do not definitively identify the true host galaxy. Additionally, the kilonova models characterized by a gradual approach to their peak are contradicted by the observational upper limits of both galaxies. Although the absence of optical emission detection raises doubts, it does not definitively disprove the connection between the gravitational wave (GW) and FRB.
Original content from this work may be used under the terms of the Creative Commons Attribution 4.0 licence. Any further distribution of this work must maintain attribution to the author(s) and the title of the work, journal citation and DOI.
1. Introduction
Fast radio bursts (FRBs) are bright millisecond-duration radio bursts originating at cosmological distances (D. R. Lorimer et al. 2007). To date, nearly a thousand cases of FRB have been detected (J. Xu et al. 2023). These bursts are broadly categorized as repeating and apparently nonrepeating in observations. The origin of FRBs is still unknown, although the repeating FRB 20200428A has been traced back to a magnetar, i.e., SGR J1935+2154, in the Milky Way (C. D. Bochenek et al. 2020; CHIME/FRB Collaboration et al. 2020). And there have been the X-ray emissions from this magnetar that coincide with FRB 20200428A (e.g., S. Mereghetti et al. 2020; C. K. Li et al. 2021). Currently, many models have been proposed to explain the origin of FRBs. They can be derived into two kinds: repeating models and catastrophic models (see E. Platts et al. 2019; D. Xiao et al. 2021, 2022; B. Zhang 2023, for an overview and references there in). The former usually invokes a neutron star (NS) as the center engine of the FRB to explain repeating FRBs. The latter generally refers to compact star merger events such as binary neutron stars (BNS) or NS-BH (BH means black hole).
Identifying the host galaxy of FRB sources is crucial to understanding their origins. Thanks to the implementation of radio telescope arrays such as the Australian Square Kilometre Array Pathfinder (ASKAP) radio telescope (A. W. Hotan et al. 2021) and the Deep Synoptic Array (DSA, J. Kocz et al. 2019), the positioning accuracy of FRBs has now achieved subarcsecond precision. At present, about 50 FRB host galaxies have been found, mainly because of their precise localization, close proximity, or their repeating properties that allow radio telescopes to locate them accurately (e.g., S. Chatterjee et al. 2017; K. W. Bannister et al. 2019; B. Marcote et al. 2020; C. W. James et al. 2022; S. Bhandari et al. 2023; C. J. Law et al. 2024). Following the localization of FRBs, researchers can search for a potential host galaxy with the galaxy catalog by the PATH method (K. Aggarwal et al. 2021). This method employs a Bayesian approach to calculate the probability that a galaxy is the host of an extragalactic transient source. It uses the sky coordinates and uncertainties of the transient source, along with the galaxy's flux and FRB radial offsets. However, this method only evaluates the probability that a galaxy is the host galaxy on a two-dimensional plane, and such results may not be accurate enough. The accuracy of the results will be improved if the distance of the source is taken into account. For an FRB source, its dispersion measure (DM)—the integral of the free electron number density along the propagation path—can serve as a distance proxy (e.g., K. Ioka 2003; S. Inoue 2004; W. Deng & B. Zhang 2014; Y.-P. Yang & B. Zhang 2016). The DM is primarily contributed by our Galaxy, the intergalactic medium, and the host galaxy of the FRB source. However, the error in DM is too large for it to be a reliable third-dimensional indicator, as it is challenging to determine the contribution of the host galaxy and account for plasma density fluctuations in the intergalactic medium (K. Ioka 2003; M. McQuinn 2014; M. Jaroszynski 2019). It would be preferable to obtain the distance to the FRB source using other methods, such as the luminosity distance derived from gravitational waves (GWs).
Since the advanced Laser Interferometer Gravitational-Wave Observatory (LIGO; LIGO Scientific Collaboration et al. 2015) detected the first GW event, i.e., GW150914 (B. P. Abbott et al. 2016), many GW events have been observed in the past decade, contributing significantly to our understanding of the universe (B. P. Abbott et al. 2019; R. Abbott et al. 2021, 2023). The second generation GW detectors, e.g., LIGO, Virgo (F. Acernese et al. 2015), and KAGRA (K. Somiya 2012; Y. Aso et al. 2013; T. Akutsu et al. 2018; Kagra Collaboration et al. 2019), are designed to probe high frequency (∼10–1000 Hz) GW signals whose main astrophysical sources are compact binary coalescences (CBCs). Theoretical predictions suggest that when these systems include an NS, they can generate intense electromagnetic (EM) radiation.
The first BNS merger was detected by LIGO as GW170817 (B. P. Abbott et al. 2017a) on 2017 August 17, and hereafter associated counterparts were detected across the EM spectrum: a coincident short gamma-ray burst (GRB) 170817A (A. Goldstein et al. 2017; V. Savchenko et al. 2017), an optical counterpart AT 2017gfo (I. Arcavi et al. 2017; D. A. Coulter et al. 2017; V. M. Lipunov et al. 2017; M. Soares-Santos et al. 2017; N. R. Tanvir et al. 2017; S. Valenti et al. 2017) that resembled a kilonova (KN), as well as X-ray (D. Haggard et al. 2017; R. Margutti et al. 2017; E. Troja et al. 2017) and radio (G. Hallinan et al. 2017) counterparts that resembled off-axis jets. By combining GW170817 with various types of EM counterparts, this event has become a valuable tool for advancing research in astrophysics and cosmology (e.g., B. P. Abbott et al. 2017b, 2018). However, we should note that the detection of the EM counterpart for GW170817 involved several fortuitous factors. Notably, this event occurred at a relatively close distance, only 40 Mpc, resulting in an acceptable localization by LIGO (approximately 20 square degrees at a 90% confidence level). It is worth noting that LIGO's detection range for BNS mergers can extend beyond this range, and in a broader spatial context, the precision of LIGO's localization may not be as high. This is exemplified in another BNS-generated GW event, GW190425 (B. P. Abbott et al. 2020a), for which there were no EM counterparts (such as a KN or a GRB) detected due to its considerable distance ( ) and poor GW localization (8284 square degree at 90% confidence level).
In addition to GW localization, if other signals coincide with GWs and are well localized, they can serve as excellent EM triggers together with GWs. As such, FRBs could potentially serve as the EM counterparts of some GW events because they both are related to compact stars. The coproduction of GW and FRB is hypothesized to be explained by the “blitzar” mechanism (B. Zhang 2014). When a BNS merger produces a supramassive NS and then collapses into a black hole, the closed magnetic field lines will break away from the NS and be ejected, its so-called “blitzar.” This process could produce an FRB (H. Falcke & L. Rezzolla 2014; E. R. Most et al. 2018). This mechanism can also explain the internal X-ray plateaus observed in some long and short GRBs (B. Zhang 2014). In a recent study, A. Moroianu et al. (2023) explored the potential correlation between GW190425 and an apparently nonrepeating FRB event, FRB 20190425A (CHIME/FRB Collaboration et al. 2021). FRB 20190425A has an accurate localization of R.A. = 255 72 ± 0
 14 and decl. = 21
 52 ± 0
 18 with 1σ uncertainty. According to the dispersion measure of FRB 20190425A (DMobs = 127.8 pc cm−3), they give a maximum redshift of
  , corresponding to a luminosity distance of dL < 200 Mpc. Furthermore, the FRB signal reached Earth 2.5 hr later than the GW signal, a delay consistent with the expected lifetime of a supermassive NS (ranging from hundreds to thousands of seconds). Therefore, the GW and FRB were coincident in their localization, burst time, and distance. And A. Moroianu et al. (2023) found that a high correlation probability, i.e., the unrelated chance probability of a coincidence between FRB 20190425A and GW190425 in the searched databases is estimated to be 0.0052 (2.8σ). However, M. Bhardwaj et al. (2024a), D. Radice et al. (2024), and I. Magaña Hernandez et al. (2024) argue that GW190425 and FRB 20190425A cannot be associated. M. Bhardwaj et al. (2024a) even contends that remnants of the BNS merger cannot account for the formation of more than 1% of the FRB sources. Despite this, the close localization, burst time, and distance between GW190425 and FRB 20190425A suggest that intriguing connections may exist.
The localization accuracy of FRB 20190425A was significantly better than that of GW190425. If their association is valid, the improved FRB localization, along with the precise GW luminosity distance, would substantially enhance the chances of mapping EM emissions. This was investigated in A. Moroianu et al. (2023): according to the 1σ uncertainty of CHIME localization and the 1σ upper limit of the LIGO luminosity distance, they found only one galaxy, i.e., UGC 10667, as a potential host for both GW190425 and FRB 20190425A. F. H. Panther et al. (2023) searched for potential host galaxies of FRB 20190425A using the NASA Extragalactic Database, and they confirmed that UGC 10667 is the most probable host galaxy. However, we note that the localization map of FRB 20190425A adopted in F. H. Panther et al. (2023) is not consistent with CHIME,4 which may potentially lead to the erroneous selection or omission of galaxies for subsequent EM analysis. M. Bhardwaj et al. (2024b) searched for the host galaxy of the FRB 20190425A in the more complete DESI catalog with CHIME baseband data, and they also confirmed that UGC 10667 is the only galaxy within the 2σ localization region of the FRB. However, DESI may also be incomplete.
If the association between GW190425 and FRB 20190425A is confirmed, the host galaxy of GW190425 can be identified, which will aid in detecting KN radiation. This rapidly drew widespread attention from the astronomical community, and a KN search campaign was immediately carried out (e.g., M. W. Coughlin et al. 2019; O. M. Boersma et al. 2021; K. Paterson et al. 2021). For instance, S. J. Smartt et al. (2024) conducted an optical follow-up search using ATLAS (J. L. Tonry et al. 2018) and Pan-STARRS (K. C. Chambers et al. 2016). They covered 24.9% and 41.2% of GW190425 localization within 6.0 hr after the GW detection, respectively, as well as imaging the galaxy UGC 10667 3.5 hr after the FRB 20190425A. Despite not detecting any optical counterparts, they compared their observational limits with various KN models and found that certain models could meet these limits, making it impossible to conclude whether the galaxy is the host based solely on the absence of KN radiation.
Moreover, combined with host galaxy redshift information, a GW event can be a bright standard siren to constrain the Hubble constant. Current data from the early universe, as indicated by the cosmic microwave background (CMB), report the latest Hubble constant H0 of 67.4 ± 0.5 km s−1 Mpc−1 (Planck Collaboration et al. 2020). In contrast, a recent result from Type Ia supernova (SN Ia) observations, probing the late universe, suggests H0 = 73.04 ± 1.04 km s−1 Mpc−1 (A. G. Riess et al. 2022). The significant disparity between these two measurements, exceeding 4σ, goes beyond a level of chance, leading to what is known as the “Hubble tension” (e.g., A. G. Riess 2020; B. Y. D. V. Mazo et al. 2022; L. Perivolaropoulos & F. Skara 2022; M. Kamionkowski & A. G. Riess 2023). Given this discrepancy, a third independent observation to measure H0 becomes crucial in resolving this conundrum. GWs are independent of early and late universe observations and are expected to help alleviate the Hubble tension.
In this paper, we assume an association between GW190425 and FRB 20190425A, and use it as an example to show how we search and analyze potential host galaxies. We believe that these studies need to take into account the completeness of the galaxy sample. Therefore, we decided to search for the host galaxy in the updated GLADE+ galaxy catalog (G. Dálya et al. 2022). Referring to Figure 4 in G. Dálya et al. (2022), it is clear that the completeness of the GLADE+ catalog exceeds 90% at the distance of GW190425. In the meantime, the host galaxy of the KN (AT 2017gfo), NGC 4993, is close to the peak of the B-band absolute magnitudes in the GLADE+ galaxy catalog. Consequently, the absence of fainter galaxies in the GLADE+ catalog suggests it is improbable for these galaxies to serve as hosts of KN. However, we cannot entirely rule out the possibility that the origin of FRB 20190425A is not within the GLADE+ galaxy catalog. Additionally, beyond the PPATH method employed by F. H. Panther et al. (2023), we introduce a novel Ptmd approach for galaxy prioritization, which balances additional constraints from the GW channel. Using the localization maps of FRB 20190425A from CHIME and GW190425 from LIGO, we identified several potential host galaxies. This is achieved by calculating the probabilities PPATH and Ptmd and fitting these galaxies to known FRB host galaxy models. Additionally, we fit KN models to their reported observational limits to further constrain the host galaxy candidates. Finally, we report the Hubble constant constrained by combining the H0 posterior from GW170817 and GW190425 with the potential host galaxies.
2. Identification of Host Galaxy
2.1. Probability of Host Galaxy
To assess the likelihood of a galaxy being the true host of an FRB, researchers frequently employ the “PATH” methodology developed by K. Aggarwal et al. (2021). This approach is grounded in a Bayesian framework, amalgamating the localization probability of an FRB inferred from radio observations with prior assumptions regarding the magnitudes of FRB host galaxies, radial offsets, and the probability that the actual host remains unobserved. For example, F. H. Panther et al. (2023) employed this method in the selection process, identifying galaxy UGC 10667 as having the highest probability of being the host of FRB 20190425A, while opting to overlook the potential radial offsets for each considered host galaxy, because the FRB localization uncertainty is much larger than the angular extent of the candidate host galaxies. Meanwhile, the process of prioritizing target galaxies associated with GW detections closely resembles that of FRBs, emphasizing factors such as GW probability and luminosity distributions, as detailed in S. Yang et al. (2019), notably in their Section 3.1.
In our study, assuming the validity of the GW-FRB association, we integrate information from both signals. Specifically, we leverage the luminosity distance derived from the GW signals and the localization data from the FRB side. This comprehensive amalgamation of data enables us to establish a new criterion incorporating distance constraints from GW signals, enhancing the precision in the identification of potential host galaxies. Our approach involves synthesizing diverse data points from GW and FRB signals, culminating in a new criterion that integrates distance constraints from GW signals to refine the identification process of likely host galaxies.
We establish a novel criterion termed “Trigger-Magnitude-Distance” (TMD) to depict the posterior probability of candidate host i. This criterion is defined as follows:

where pt, pm, and pd represent priors on the trigger probability, magnitude, and distance of the galaxy, respectively. In this paper, we assume that the GW and FRB probability are equally weighted, thus:

Here, pFRB = 1 − CLCHIME, where CLCHIME is the localization confidence level at the position of the candidate galaxy. pGW represents the probability of a galaxy being the host of a GW signal.
For the term pm, we followed S. Yang et al. (2019), that is, mapping selected GLADE+ galaxies into celestial sphere with the HEALPIX tool (K. M. Górski et al. 2005), weighted by galaxy luminosity,5 and smoothed with a Gaussian corresponding to each galaxy's reported radius. This yields a luminosity distribution map, and pm is subsequently derived at the reported position of the particular galaxy.
The term pd considers the potential association of a galaxy with GW triggers, taking into account distance information. Specifically, the LIGO-VIRGO-KAGRA collaboration releases the 3D localization for an individual GW candidate, presenting the distance likelihood along with the 2D probability distribution in each direction. Consequently, pd is depicted as the probability density function of the candidate galaxy concerning the GW distance estimation in the same direction.
2.2. Searching for Potential Hosts
By employing the intersecting localization regions of GW190425 and FRB 20190425A, we conducted a search within the updated GLADE+ galaxy catalog (G. Dálya et al. 2022) for galaxies with redshift z < 0.066 . We found more than 1000 candidate galaxies, represented by orange open circles in Figure 1. We calculated and normalized the probability (Ptmd) for each of them and found 81 galaxies with reasonable Ptmd. The probability density function (PDF) and the cumulative distribution function (CDF) of their Ptmd values are illustrated in Figure 2. A comprehensive map, denoted as Ptmd, is subsequently normalized to represent the probability of a galaxy matching various trigger information and being sufficiently luminous to host a KN. In Figure 2, both the collective and individual Ptmd values for all potential host galaxies are displayed. The black step line represents the cumulative Ptmd of these potential hosts. The orange, green, and red dashed lines correspond to cumulative Ptmd values of 0.73561, 0.95451 (∼2σ), and 0.99749 (∼3σ), respectively. Observing the cumulative contribution of the top 14 galaxies, it is evident that it encompasses approximately 2σ. In contrast, the number of galaxies between 2σ and 3σ is disproportionately high, with considerably lower values of Ptmd. Hence, the top 14 galaxies are adequate for this study. Their names are presented in both golden and bronze colors, indicating their classification into the respective golden sample or bronze sample (see Section 2.3). According to our method, we identified an additional galaxy (SDSS J171046.84+212732.9) as being a possible host galaxy for GW190425 and FRB 20190425A.
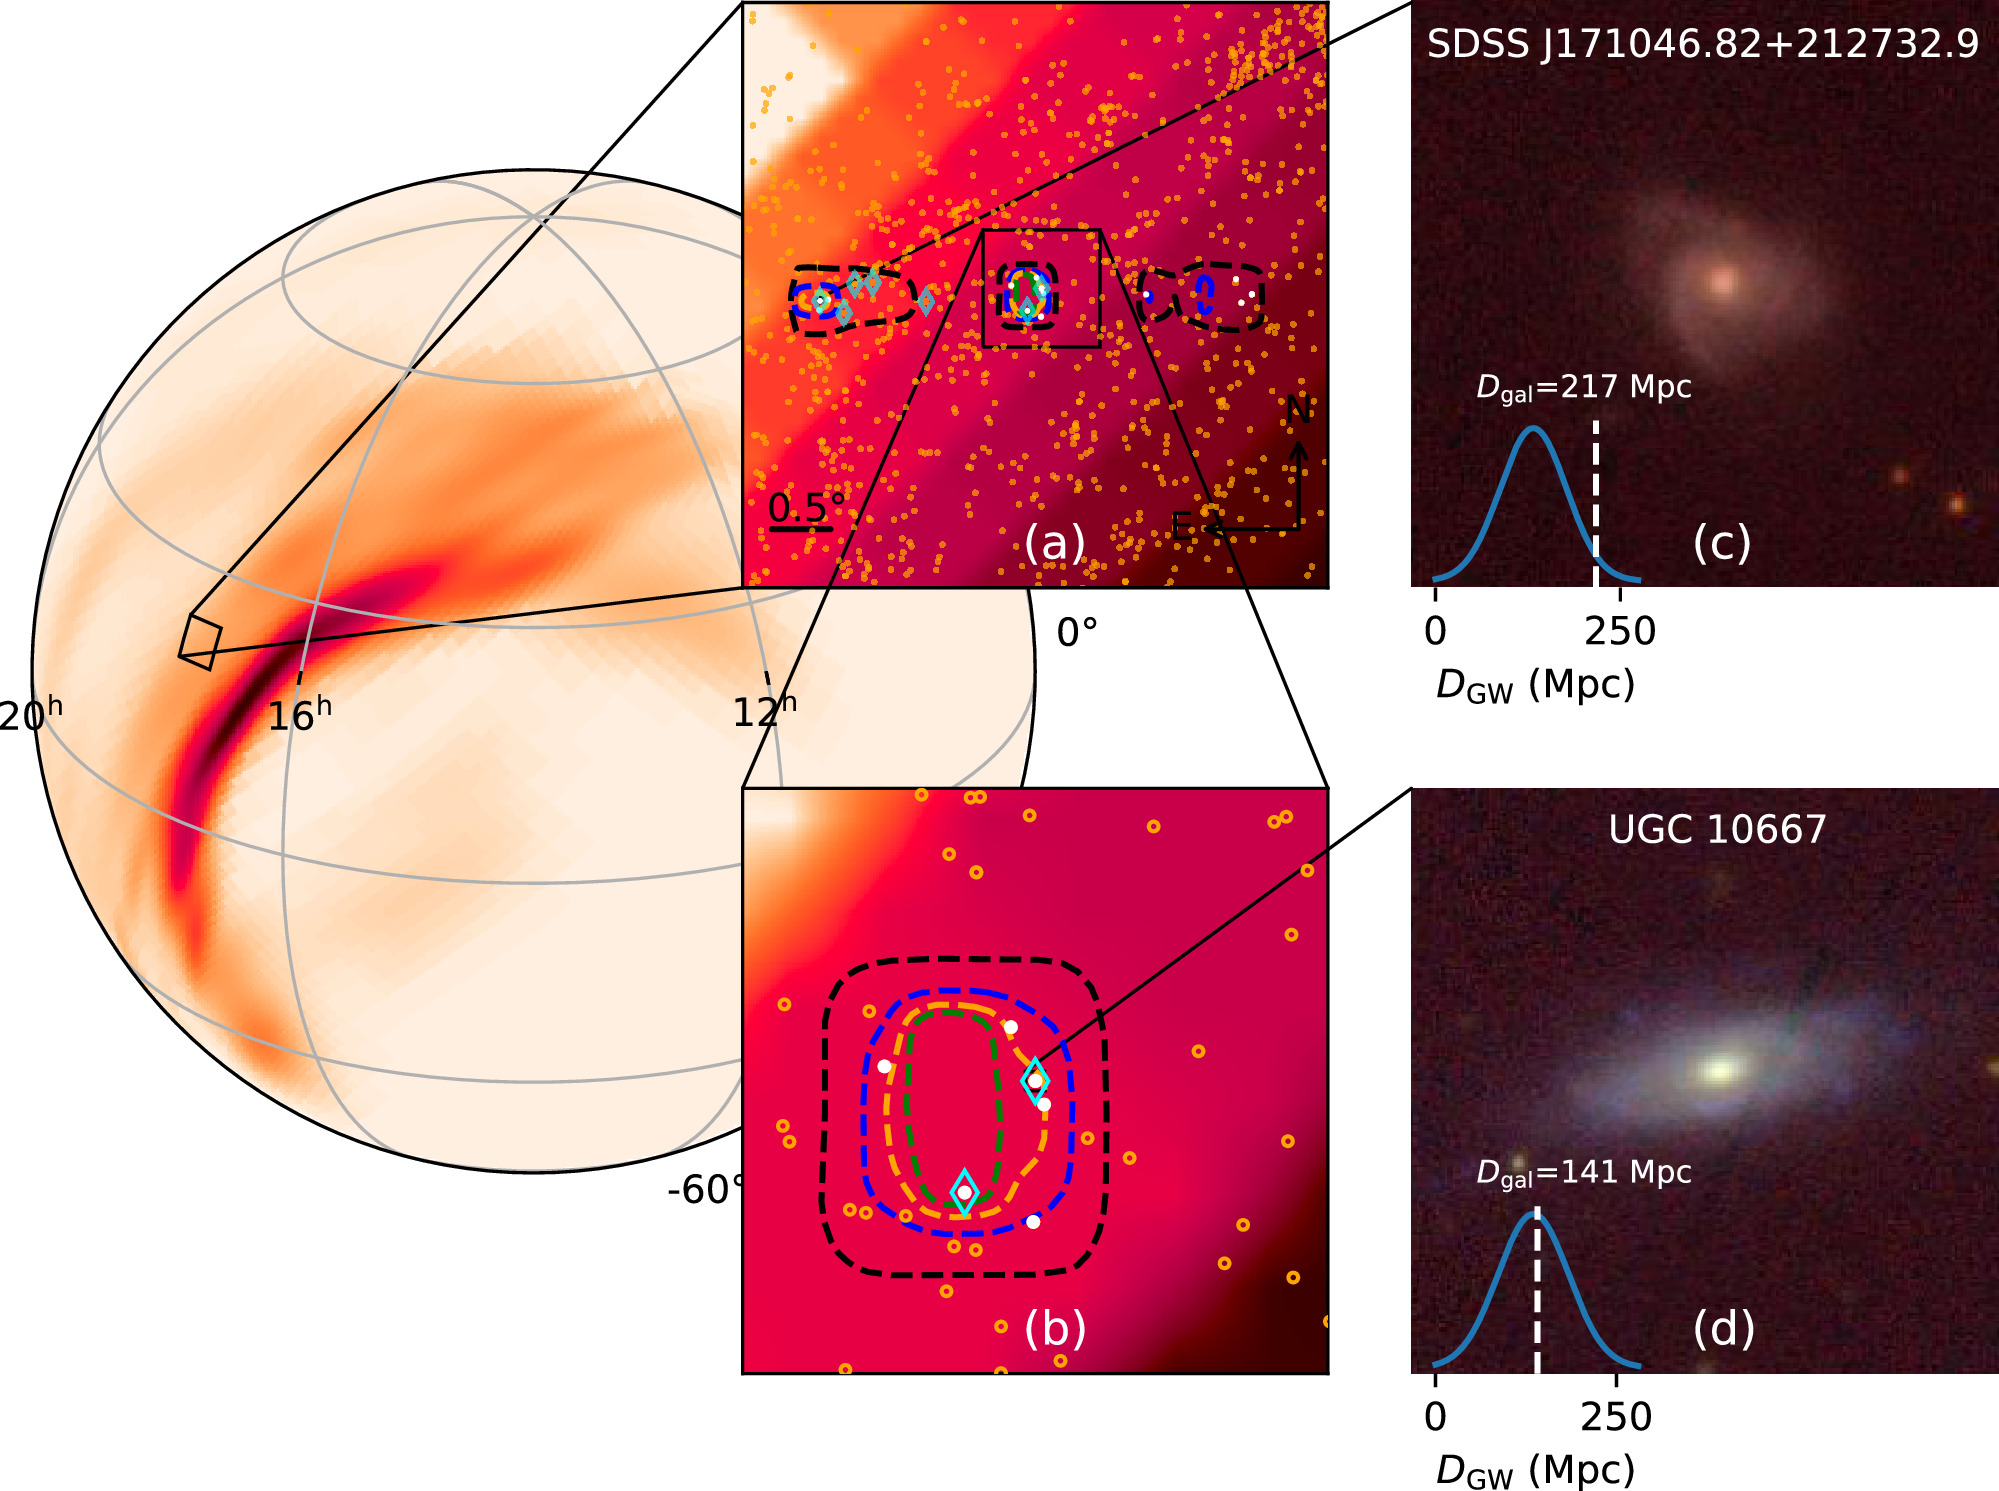
Figure 1. The positions of the selected galaxies along with GW190425 and FRB 20190425A in a two-dimensional spherical coordinate system. Panel (a) provides a close-up of the GLADE galaxies (open orange circles) that meet our criteria. The colored boxes indicate different confidence level regions of FRB 20190425A and the shaded region represents the probability of GW190425. Panel (b) shows a zoom-in view containing UGC 10667. The galaxies shown as white points enclosed in cyan diamonds are the most probable galaxies selected by this study and F. H. Panther et al. (2023), respectively. Panels (c) and (d) present archived PS1 colored images of SDSS J171046.82+212732.9 and UGC 10667, respectively. Blue lines denote the probability distribution function of dL estimated by GW190425. White dashed lines are the dL of galaxies, which are calculated with spectroscopic redshifts and a flat ΛCDM cosmology.
Download figure:
Standard image High-resolution image
Figure 2. The probability of all potential host galaxies. The upper panel displays the cumulative Ptmd of these galaxies with a black step line, while the lower panel shows their individual Ptmd. The orange, green, and red dashed lines correspond to cumulative Ptmd values of 0.73561, 0.95451 (approximately 2σ), and 0.99749 (approximately 3σ), respectively. The names of these top 14 galaxies are displayed in golden and bronze colors, representing their classification into the golden sample or bronze sample.
Download figure:
Standard image High-resolution imageAs shown, the significant contribution originated from the top 14 galaxies (listed in Table 1) with the highest Ptmd. This yielded a probability of 0.95451 (∼2σ), prompting us to retain these galaxies for further investigations. In panels (a) and (b) of Figure 1, these selected 14 galaxies are localized as white points. For comparison, the selected galaxies in F. H. Panther et al. (2023) are overlaid with open cyan diamonds. The dashed overlaid boxes and shaded colors indicate the various confidence level regions of FRB 20190425A and GW190425.
Table 1. The Candidate Host Galaxies of GW190425 and FRB 20190425A
| Identifier | R.A.(J2000) | Decl.(J2000) | Redshift | MB | pGW ∗ 10−6 | pFRB | pd | Ptmd | PPATH |
|---|---|---|---|---|---|---|---|---|---|
| UGC 10667 | 255.66248 | 21.57674 | 0.03122 | −20.44 | 3.80 | 0.36195 | 0.00810 | 0.58757 | 0.17108 |
| SDSS J171046.82+212732.9 | 257.69510 | 21.45914 | 0.04734 | −20.73 | 3.14 | 0.47314 | 0.00145 | 0.14804 | 0.39793 |
| SDSS J170310.06+212309.7 | 255.79194 | 21.38603 | 0.04789 | −18.04 | 3.80 | 0.65994 | 0.00178 | 0.02570 | 0.01230 |
| SDSS J171048.21+212253.8 | 257.70092 | 21.38162 | 0.05026 | −20.08 | 3.14 | 0.27481 | 0.00078 | 0.02555 | 0.06907 |
| SDSS J165518.73+212637.8 | 253.82806 | 21.44384 | 0.03089 | −17.94 | 4.32 | 0.03115 | 0.00709 | 0.00502 | 0.00052 |
| SDSS J170239.90+212008.9 | 255.66629 | 21.33583 | 0.02556 | −16.83 | 3.80 | 0.07786 | 0.00730 | 0.00408 | 0.00041 |
| SDSS J165530.04+213843.2 | 253.87520 | 21.64535 | 0.04871 | −19.53 | 4.32 | 0.02032 | 0.00205 | 0.00408 | 0.00225 |
| SDSS J170249.74+214008.3 | 255.70726 | 21.66898 | 0.03527 | −18.68 | 3.80 | 0.27999 | 0.00698 | 0.07735 | 0.01072 |
| SDSS J170345.46+213605.3 | 255.93946 | 21.60147 | 0.04428 | −18.77 | 3.80 | 0.21238 | 0.00294 | 0.02675 | 0.00901 |
| SDSS J165455.49+213054.2 | 253.73125 | 21.51508 | 0.04660 | −21.38 | 4.32 | 0.01524 | 0.00277 | 0.02285 | 0.06914 |
| SDSS J170235.08+213211.5 | 255.64620 | 21.53655 | 0.05232 | −18.37 | 3.80 | 0.36261 | 0.00078 | 0.00844 | 0.00971 |
| SDSS J171028.78+212816.4 | 257.61995 | 21.47125 | 0.05043 | −18.67 | 3.14 | 0.34436 | 0.00075 | 0.00838 | 0.01301 |
| SDSS J165847.87+213119.5 | 254.69946 | 21.52210 | 0.04813 | −18.54 | 4.26 | 0.08809 | 0.00216 | 0.00743 | 0.00286 |
| SDSS J171011.06+213858.5 | 257.54611 | 21.64959 | 0.01479 | −19.11 | 3.14 | 0.02123 | 0.00315 | 0.00326 | 0.00137 |
Note. The sum of Ptmd of these 14 galaxies is ~2σ. All galaxies are located in 99% localization confidence of the CHIME localization with redshift z < 0.06. The results presented in the top half of the table correspond to the golden sample, whereas the bottom half represents the bronze sample. Given are object name, R.A. and decl., galaxy redshift (spectral redshift for golden sample, and photometric redshift for bronze sample), B-band absolute magnitude MB, prior on GW probability pGW and FRB probability (pFRB = 1 − CLCHIME, where CLCHIME is the localization confidence level), prior of distance of galaxy pd, posterior probability Ptmd as defined by Equation (1), and posterior probability PPATH as defined in F. H. Panther et al. (2023).
Download table as: ASCIITypeset image
Indeed, among these 14 galaxies, UGC 10667 and SDSS J171046.84+212732.9 collectively account for over 70% of the Ptmd probability, making them more likely to be the host galaxy. Following the approach outlined in F. H. Panther et al. (2023), we computed the PPATH probability for these galaxies as well. Interestingly, although UGC 10667 has a higher value of Ptmd compared to SDSS J171046.84+212732.9, it has a relatively lower value of PPATH. Therefore, both galaxies continue to be strong contenders.
For both galaxies, we downloaded the ugriz frames from the Pan-STARRS (PS1) archive and stacked them into colored images using the “Lupton” method (R. Lupton et al. 2004). These images are presented in two panels on the left side of Figure 1. We explored the morphological features of these two galaxies and found that UGC 10667 and SDSS J171046.84+212732.9 are both classified as spiral galaxies. Within the two panels, the blue lines represent the PDF of the luminosity distance (dL) estimated by GW190425, and the white dashed lines indicate the dL values of galaxies calculated using spectroscopic redshifts and a standard ΛCDM cosmology.
Additionally, we consider the radial offset between the potential KN and the core of the galaxy. We quantified the spatial separation between AT 2017gfo and NGC 4993 using the archived Hubble Space Telescope (HST) image7
and assumed that this distance is universally applicable to all KN locations. Specifically, we observe AT 2017gfo having an angular offset of ∼10 4 from the galactic core (see Figure 3), corresponding to a linear diameter of ∼2.5 kpc8
at a luminosity distance of 40.7 Mpc (M. Cantiello et al. 2018). At the distance of GW190425 (that is, 159 Mpc), this offset translates to approximately 2
4 from the galactic core (see Figure 3), corresponding to a linear diameter of ∼2.5 kpc8
at a luminosity distance of 40.7 Mpc (M. Cantiello et al. 2018). At the distance of GW190425 (that is, 159 Mpc), this offset translates to approximately 2 66, equivalent to approximately 1 pixel in the HEALPIX framework with Nside = 1024. Therefore, when calculating the Ptmd of a galaxy, we compute the value of the pixel corresponding to the direction of the galaxy, as well as the values of the surrounding 9 pixels and then take the average.

Figure 3. The archival HST image showing the offset from the kilonova to the host galaxy NGC 4993.
Download figure:
Standard image High-resolution image2.3. Host Galaxy Analysis
To further confirm the host galaxy, we need spectral data of the galaxy. Therefore, we conducted cross-matching within the Sloan Digital Sky Survey (SDSS) DR17 for the 14 GLADE galaxies. Of these, 7 galaxies (including both UGC 10667 and SDSS J171046.84+212732.9) were observed spectroscopically by SDSS, designated as our golden sample (its location and morphology are shown in Figure 4), while the remaining 7 were classified as the bronze sample.

Figure 4. The localization and morphology of the seven galaxies in the golden sample. We exclude the seven other candidates that do not have reliable redshift information. The dashed contours and colors indicate different confidence level regions of FRB 20190425A.
Download figure:
Standard image High-resolution imageTo further pinpoint the actual host galaxy of GW190425 and FRB 20190425A, we performed a comparative analysis of the properties of the golden sample galaxies. We adopted model magnitudes (modelMag) from SDSS DR17 (Abdurro’uf et al. 2022) for galaxies, including multicolors ugriz. After correcting for Milky Way extinction (E. F. Schlafly & D. P. Finkbeiner 2011), these magnitudes were used to fit spectral energy distribution (SED) models to estimate stellar mass. The MAGPHYS stellar population model program (E. da Cunha et al. 2008) was employed for this purpose. The program utilizes a library of stellar evolution and population synthesis models from G. Bruzual & S. Charlot (2003) and performs fitting procedures to ascertain the luminosity of the host stellar population. MAGPHYS computes the total stellar mass and stellar metallicity compared to the solar abundance and star formation rate (SFR) and also computes the light-weighted age of the host stellar population in the r-band. This represents an average age considering all the stars in the galaxy. The specific star formation rate (sSFR) is defined as the SFR divided by stellar mass. MAGPHYS further computes the probability density function across various model values and determines the median, along with the confidence interval corresponding to the 16th to 84th percentile range (equivalent to the 1σ range, assuming a Gaussian distribution). We consider the median as the best estimate of the stellar mass, which is reported in Table 2.
Table 2. Galaxy Properties Estimated Using MAGPHYS Based on Photometric and Spectral Data from SDSS DR17
| Identifier | Stellar Mass | SFR | Stellar Metallicity | Light-weighted Age | Log sSFR |
|---|---|---|---|---|---|

| (M⊙ yr−1) | (Z/Z⊙) |

| (yr−1) | |
| UGC 10667 |

|

|

|

|

|
| SDSS J171046.82+212732.9 |

|

|

|

|

|
| SDSS J170310.06+212309.7 |

|

|

|

|

|
| SDSS J171048.21+212253.8 |

|

|

|

|

|
| SDSS J165518.73+212637.8 |

|

|

|

|

|
| SDSS J170239.90+212008.9 |

|

|

|

|

|
| SDSS J165530.04+213843.2 |

|

|

|

|

|
Note. The errors of all parameters are in 1σ uncertainty.
Download table as: ASCIITypeset image
For UGC 10667, the median stellar mass is 1.8 × 10¹⁰ M⊙, with a range of 1σ that spans from 1.5 × 10¹⁰ to 2.3 × 10¹⁰ M⊙. The results are consistent with M. Bhardwaj et al. (2024b) because we use a similar code and prior. The other galaxy, SDSS J171046.82+212732.9, exhibits a slightly larger stellar mass of 3.6 × 10¹⁰ M⊙, with a range from 2.8 × 10¹⁰ to 4.5 × 10¹⁰ M⊙. Most of our identified galaxies exhibit a stellar mass ranging from 1.7 × 10⁹ to 3.6 × 10¹⁰ M⊙, with stellar population ages around 2–3 Gyr. However, one outlier, SDSS J170239.90+212008.9, stands out as a blue star-forming galaxy based on SDSS colors and the detection of strong emission lines in the spectrum. This aligns with our MAGPHYS fitting results, indicating a high specific star formation rate (sSFR) of approximately 8.4 Gyr−1, a young stellar population age of around 60 Myr, and a low stellar metallicity of about 0.3 Z⊙. Specifically, we presented the SED model fitting results of UGC 10667 and SDSS J171046.82+212732.9 by MAGPHYS in Figures 5 and 6. As shown, the intrinsic properties of galaxies UGC 10667 and SDSS J171046.84+212732.9 are similar, which is consistent with their similar morphological characteristics.
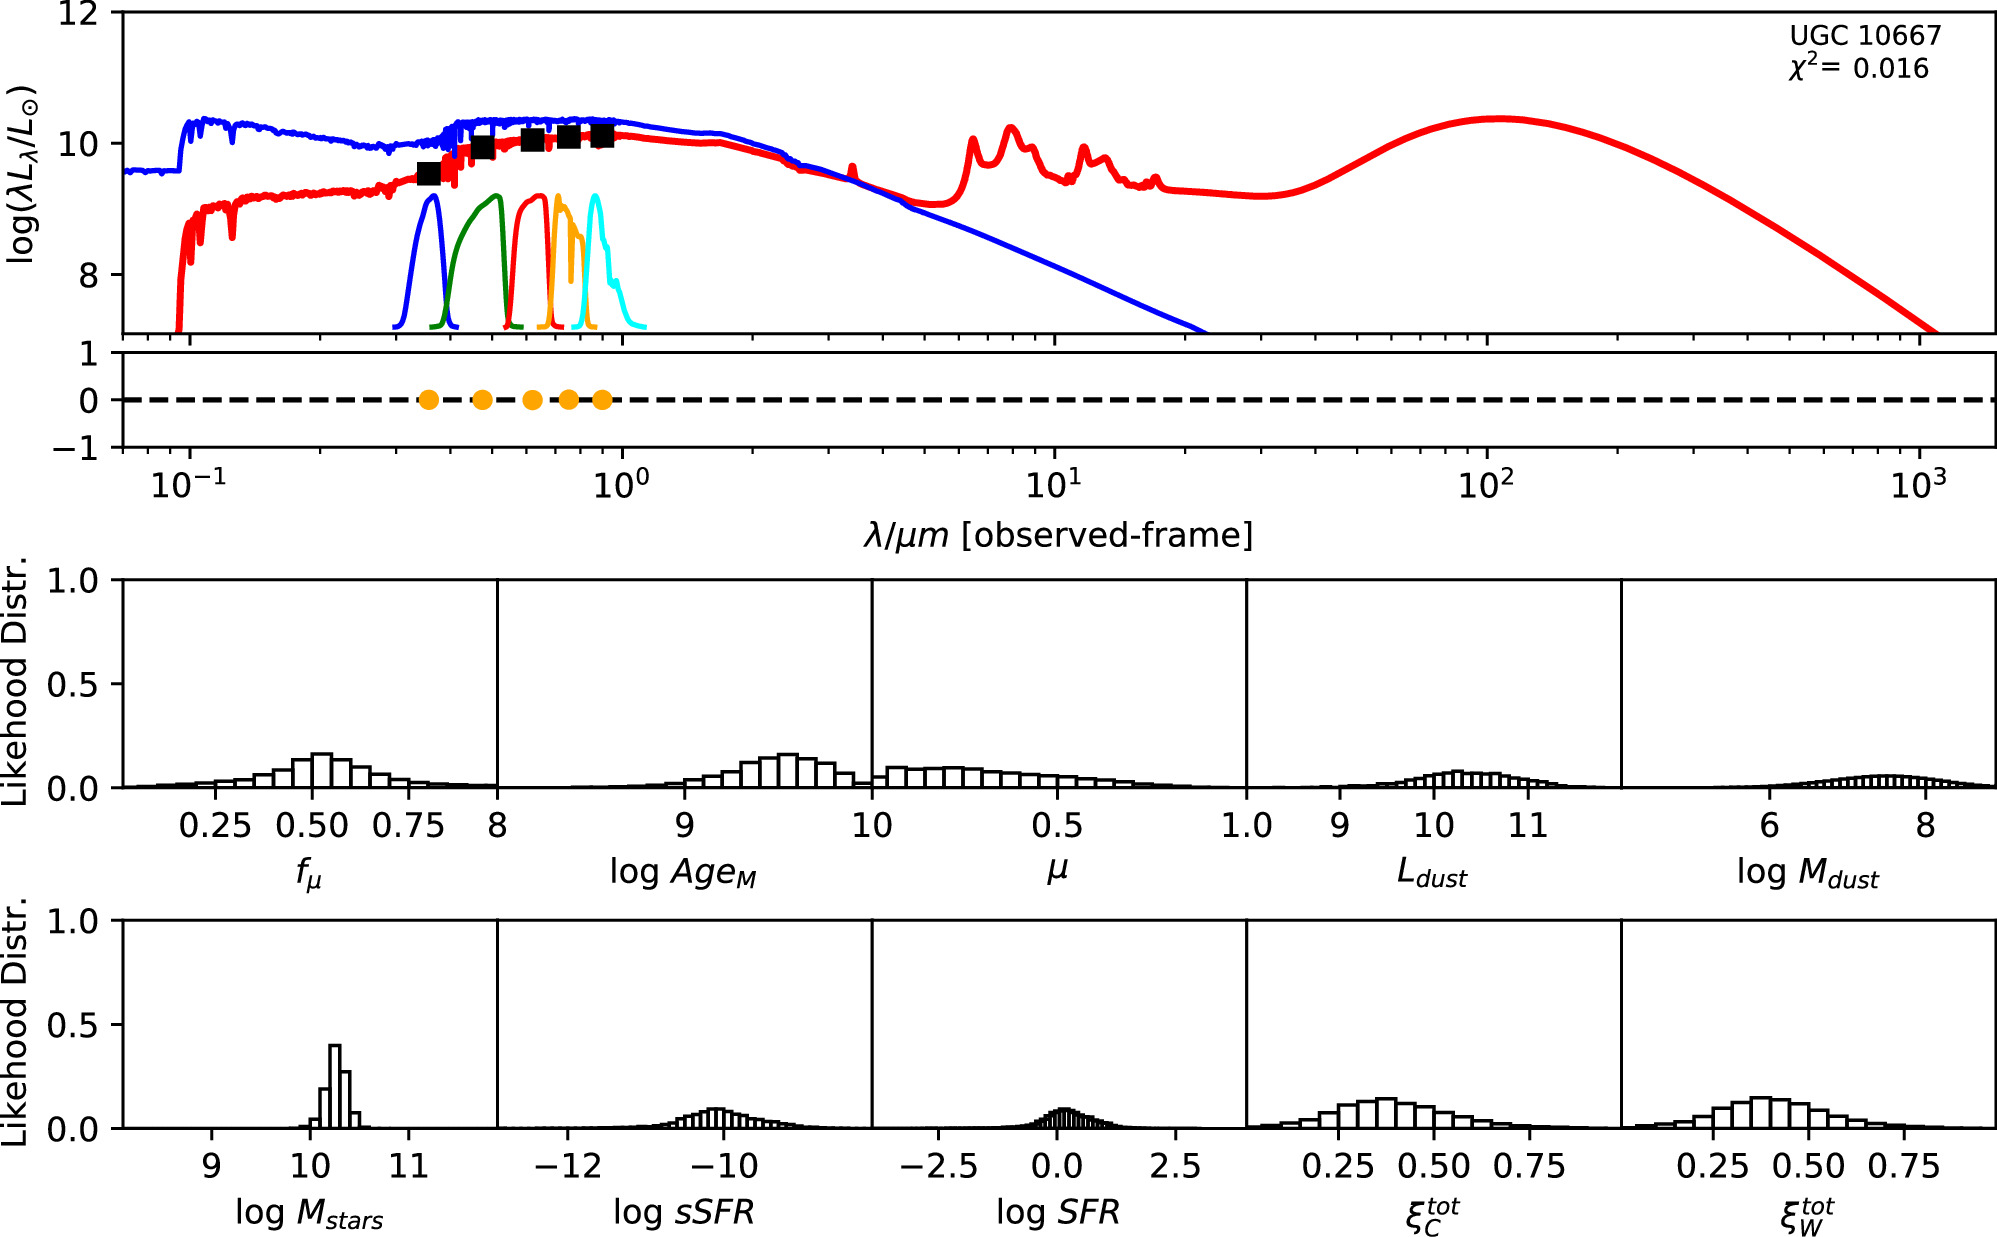
Figure 5. The figure displays the best-fit and likelihood distribution of a sample of stellar evolution and population synthesis models fitted to the photometric data of UGC 10667. The upper panel shows the best-fit model from MAGPHYS (red line) on SDSS DR17 modelMag data (filled black squares) of UGC 10667. The blue line is the predicted unattenuated stellar population SED for the best-fit model. The colored unimodal lines represent the transmission curves of the u, g, r, i, and z filters in the SDSS system. The lower panel shows the residual between the observed and model photometry. The bottom two rows are full likelihood distributions of galaxy properties (The meanings of these galaxy properties can be found in E. da Cunha et al. 2008).
Download figure:
Standard image High-resolution image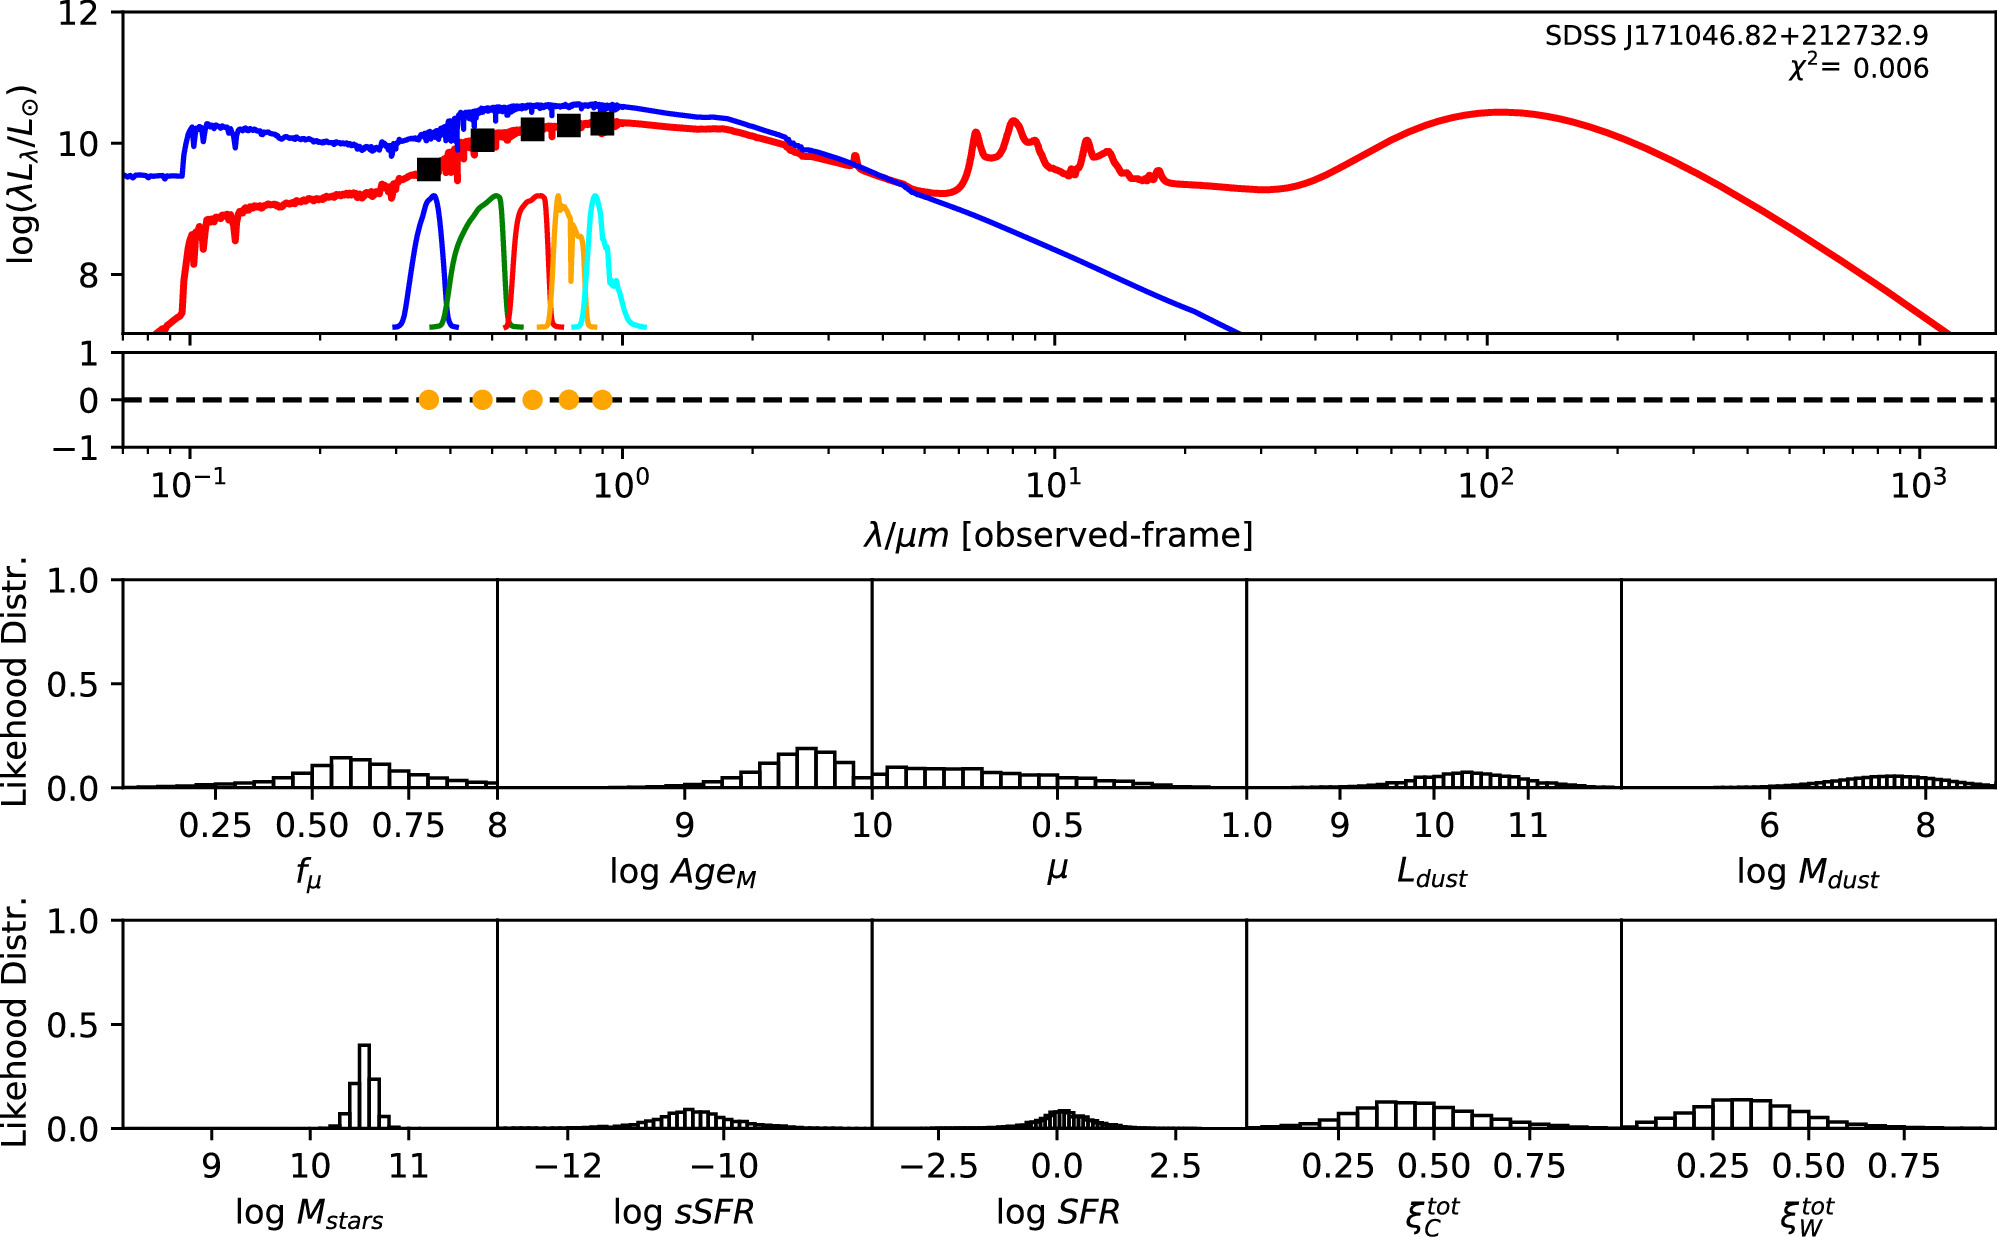
Figure 6. Similar to Figure 5, this figure depicts the corresponding information for SDSS J171046.82+212732.9.
Download figure:
Standard image High-resolution imageIn Figure 7, we illustrate a comparison between our golden sample galaxies and some well-known FRB hosts, which belong to different types with varying star formation histories, focusing on their star formation rate (SFR) and stellar mass. The color in the plot represents the redshift, while the dotted lines denote the boundary that distinguishes between star-forming and quiescent galaxies at various redshifts (J. Moustakas et al. 2013). It is evident that the majority of FRB hosts, as well as UGC 10667 and SDSS J171046.84+212732.9, are characterized as star-forming galaxies. Their SFR predominantly falls within the range of 0.1–10.0 M⊙ yr−1. Apart from this, we did not find any significant clustering or correlations among these FRB hosts. Therefore, similar to most of the literature, we also consider that FRBs may have multiple origins, and the current FRB host sample size is not large enough to distinguish them. Currently, or in the near future, there are powerful telescopes capable of accurately pinpointing the host galaxies of FRBs, such as DSA (C. J. Law et al. 2024) and BURSTT (H.-H. Lin et al. 2022), or ASKAP (A. W. Hotan et al. 2021) and CHIME (CHIME/FRB Collaboration et al. 2021) in combination with outriggers (T. Cassanelli et al. 2024). However, because of the difficulty in obtaining spectral information from galaxies, the number of useful host galaxy samples remains limited. In the future, more powerful telescopes are expected to gather more information on host galaxies, improving our understanding of the origins and classifications of FRBs.
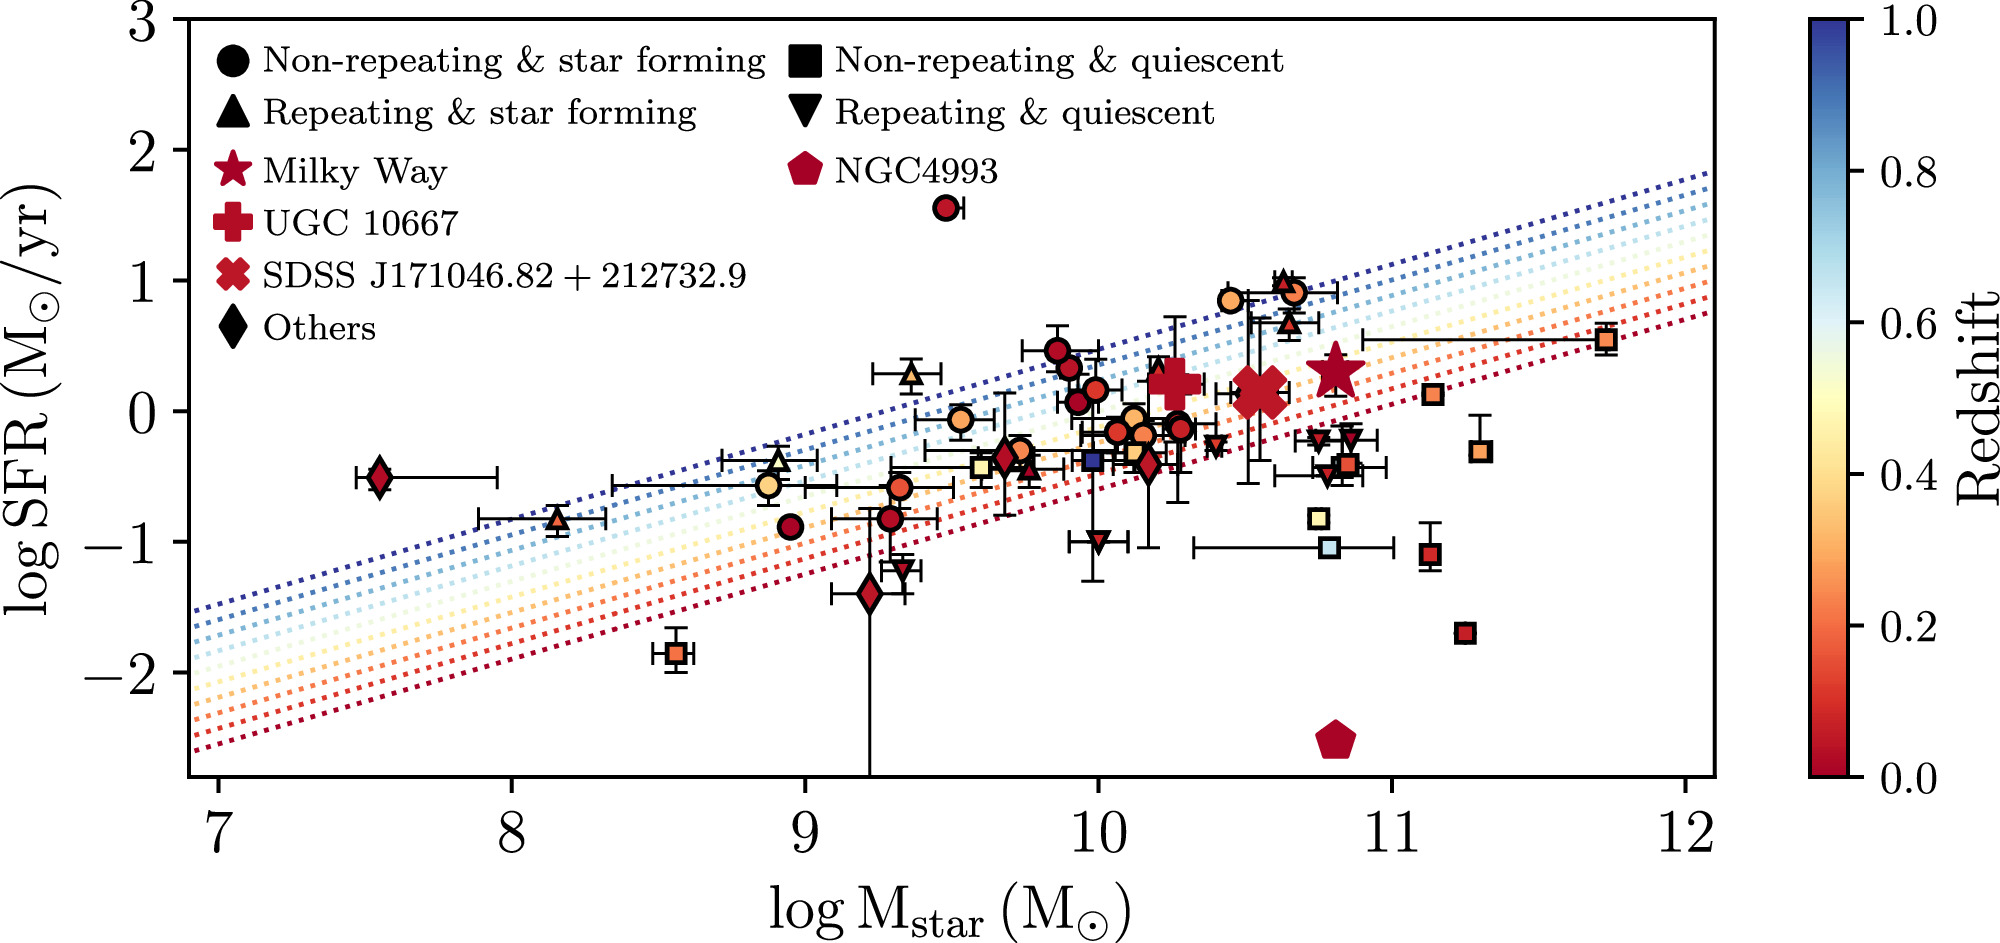
Figure 7. Star formation rate and stellar mass distribution of the host galaxies of 32 apparently nonrepeating and 14 repeating FRBs together with the Milky Way and golden sample galaxies. The different colors of dotted lines and markers represent the redshift. The dotted lines represent the boundary that separates star-forming and quiescent galaxies taken from the PRIMUS survey (J. Moustakas et al. 2013). Circles and triangles represent nonrepeating and repeating FRBs hosted by star-forming galaxies, respectively, while squares and inverted triangles denote the same for quiescent galaxies. The Milky Way, UGC 10667, SDSS J171046.82+212732.9, NGC 4993, and other golden sample galaxies are shown as a star, a plus sign, a cross, a pentagon, and diamonds, respectively. Data on the star formation rate and stellar mass of host galaxies for 32 apparently nonrepeating and 14 repeating FRBs can be found in A. C. Gordon et al. (2023), M. Bhardwaj et al. (2021a, 2021b), S. Bhandari et al. (2022, 2023), V. Ravi et al. (2019), C. J. Law et al. (2020), D. Hiramatsu et al. (2023), A. E. Lanman et al. (2022), C. J. Law et al. (2024), M. Bhardwaj et al. (2024b), S. D. Ryder et al. (2023), E. K. Mahony et al. (2018), A. L. Ibik et al. (2024), D. Michilli et al. (2023), L. N. Driessen et al. (2024), V. Ravi et al. (2023).
Download figure:
Standard image High-resolution imageIn this study, we conducted another comparison by comprehensively examining these two galaxies alongside NGC 4993, i.e., the host galaxy of the KN AT 2017gfo. NGC 4993 is a galaxy with a prominent bulge and a mean stellar mass of (0.3–1.2) × 1011 M⊙. Analysis of its spectral energy distribution indicates negligible star formation activity (M. Im et al. 2017). Despite variations in stellar mass and SFR between UGC 10667, SDSS J171046.84+212732.9, and NGC 4993, these three galaxies exhibit similar mean stellar ages of 2 ∼ 3 Gyr (M. Im et al. 2017), and metallicities spanning from 20% to 100% of the solar abundance (M. Im et al. 2017). These common characteristics align them with some host galaxies of short GRBs (J. F. Graham & A. S. Fruchter 2013; M. Contini 2018; Y.-W. Yu et al. 2022), whose origins are BNS mergers. Therefore, this result tends to support the hypothesis that UGC 10667 or SDSS J171046.84+212732.9 was a possible host galaxy that could have produced a BNS merger, generating GW190425 and subsequently FRB 20190425A.
3. Further Analysis Assuming GW/FRB Association
Though it cannot now be proven, if in fact GW190425 and FRB 20190425A are associated, we use this as an example to determine the most likely host galaxy by searching for KN emission. We further constrain the Hubble constant by combining the redshift information of the host galaxy with the distance estimate from GW190425.
3.1. Constraints on Kilonova Emission
To explore the possibilities of these two galaxies hosting KN events, we constrained their reported observation limits to various KN models as well as compared them to the KN AT 2017gfo. As shown in Figure 8, the inverted triangles in the left panel of Figure 8 represent the 3.5σ limits of the Pan-STARRS1, ATLAS, and ZTF images for UGC 10667 around the time of GW190425 (as listed in Table 1 of S. J. Smartt et al. 2024), while those in the right panel represent the 3.5σ limits of the ATLAS and ZTF images for SDSS J171046.82+212732.9. Those limits are extracted from the ATLAS (J. L. Tonry et al. 2018; K. W. Smith et al. 2020) and ZTF forced-photometry services (F. J. Masci et al. 2019) through the HAFFET program (S. Yang & J. Sollerman 2023; as listed in Table 3). KN exhibits a pronounced blueness in the early stage, which transitions to deep red shortly thereafter. In the optical band, most of the KN emission is concentrated around the r-band, with observations in other bands being similar in brightness or fainter than those in the r-band. Hence, for simplicity, we exclusively present the results for the r-band in Figure 8. For comparison, we overplotted the lightcurve of KN AT 2017gfo with best-fit parameters from M. Nicholl et al. (2021), with the distance adjusted accordingly.
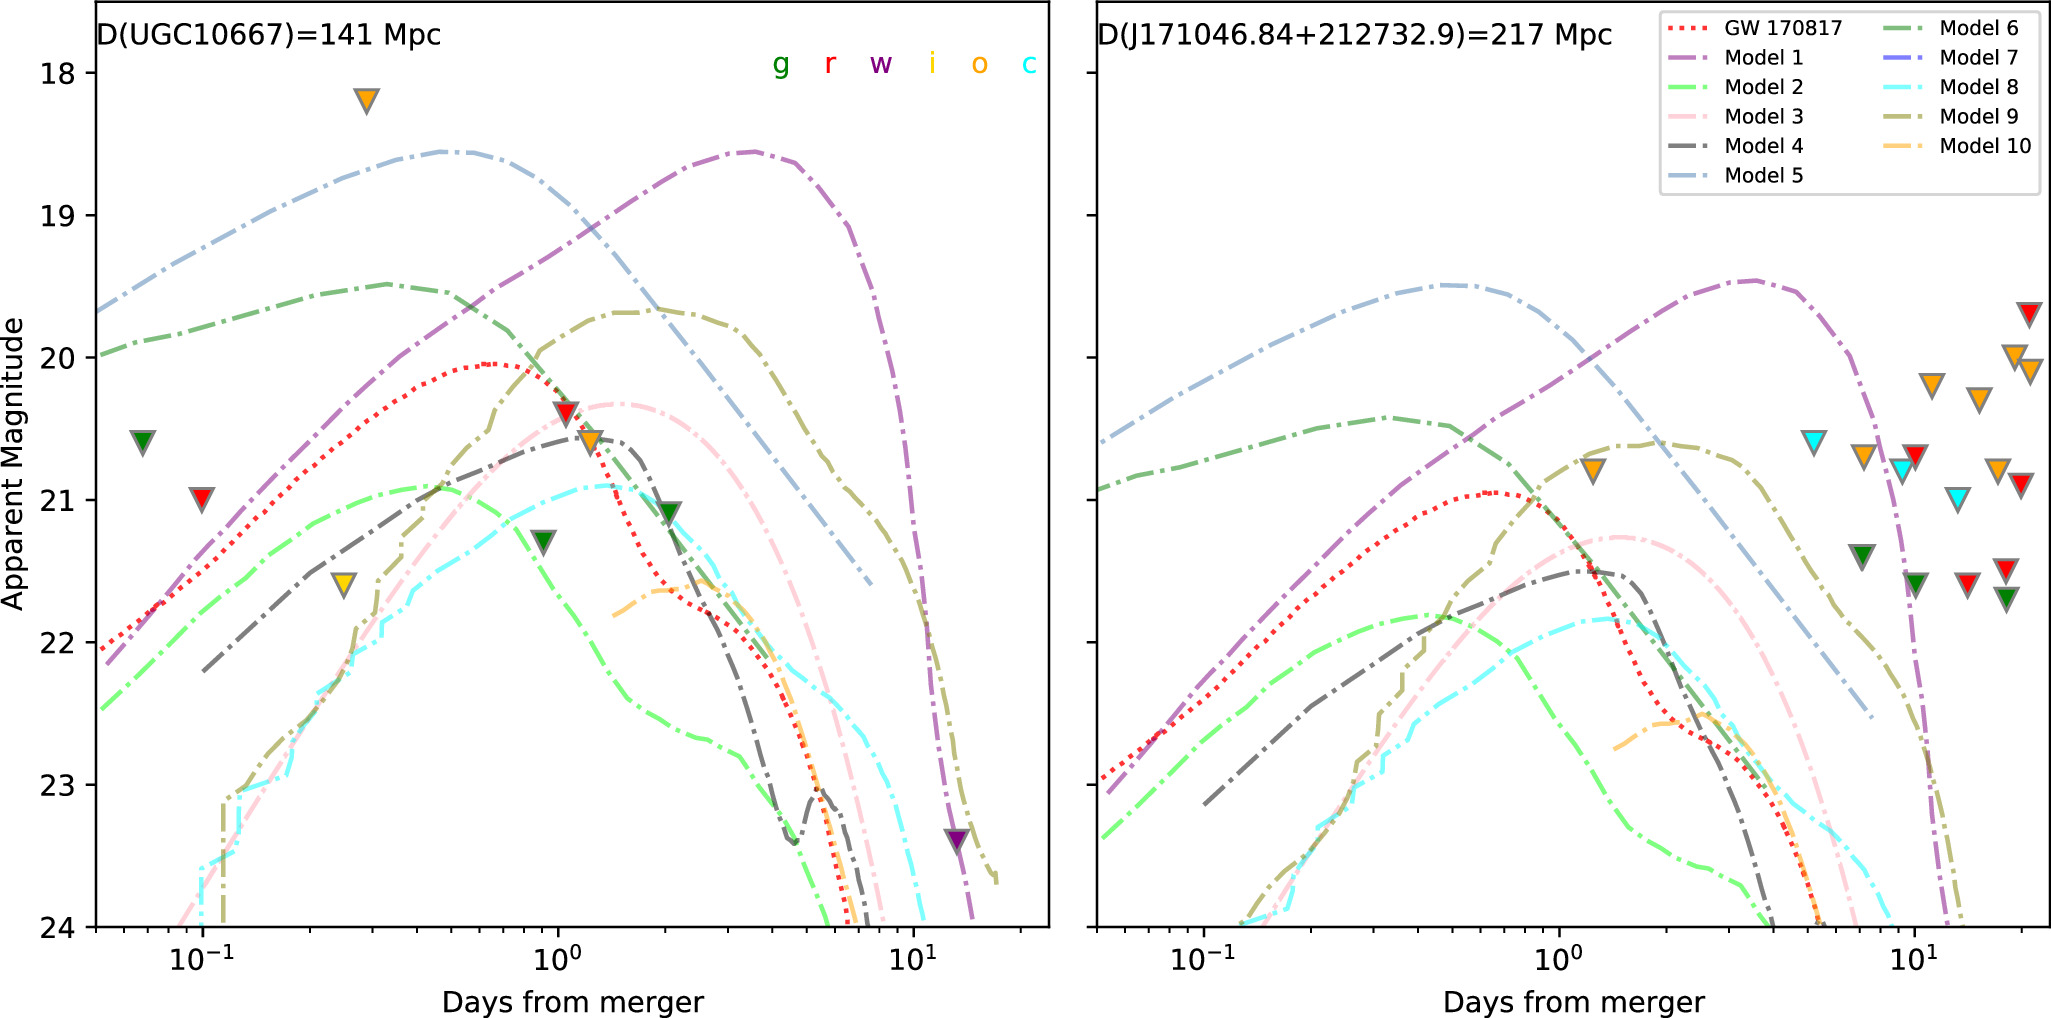
Figure 8. The comparison between kilonova models and observed optical emission of UGC 10667 and SDSS J171046.82+212732.9. In both panels, colored curves represent kilonova lightcurve models described in Section 3.1, all calculated in the r-band and assuming distances to UGC 10667 or SDSS J171046.82+212732.9. The inverted triangles in the left panel denote the 3.5σ limits of the Pan-STARRS1, ATLAS, and ZTF images for UGC 10667 around the time of GW190425, while those in the right panel represent the 3.5σ limits of the ATLAS and ZTF images for SDSS J171046.82+212732.9 during the same period.
Download figure:
Standard image High-resolution imageTable 3. The 3.5σ Limits of the ATLAS and ZTF Images of SDSS J171046.82+212732.9 Around the Time of GW190425
| MJD | Epoch | Telescope | Filter | limit |
|---|---|---|---|---|
| 58599.590000 | +1.24411 | ATLAS | o | >20.8 |
| 58603.550000 | +5.20411 | ATLAS | c | >20.6 |
| 58605.420185 | +7.07430 | ZTF | r | >21.4 |
| 58605.483345 | +7.13745 | ZTF | g | >21.4 |
| 58605.540000 | +7.19411 | ATLAS | o | >20.7 |
| 58607.570000 | +9.22411 | ATLAS | c | >20.8 |
| 58608.380023 | +10.03413 | ZTF | r | >20.7 |
| 58608.402720 | +10.05683 | ZTF | g | >21.6 |
| 58609.530000 | +11.18411 | ATLAS | o | >20.2 |
| 58611.560000 | +13.21411 | ATLAS | c | >21.0 |
| 58612.420197 | +14.07431 | ZTF | r | >21.6 |
| 58613.540000 | +15.19411 | ATLAS | o | >20.3 |
| 58615.480000 | +17.13411 | ATLAS | o | >20.8 |
| 58616.397072 | +18.05118 | ZTF | r | >21.5 |
| 58616.461250 | +18.11536 | ZTF | g | >21.7 |
| 58617.460000 | +19.11411 | ATLAS | o | >20.0 |
| 58618.241771 | +19.89588 | ZTF | r | >20.9 |
| 58619.353113 | +21.00722 | ZTF | r | >19.7 |
| 58619.470000 | +21.12411 | ATLAS | o | >20.1 |
| 58627.377894 | +29.03200 | ZTF | r | >21.4 |
| 58627.410000 | +29.06411 | ATLAS | o | >20.6 |
Note. The epoch represents the time when the image was captured relative to the merger of GW190425.
Download table as: ASCIITypeset image
Various KN models are illustrated as dashed lines. Model 1 is a magnetar-enhanced KN emission model with the same parameters as in S. J. Smartt et al. (2024). Model 2 is the same as AT 2017gfo with a maximum stable NS mass MTOV > 2.63 M⊙. For Models 3 and 4, the assumption is a radioactive-powered emission with an ejecta mass of 10−2 M⊙, an outflow speed v = 0.1c, iron-like opacities, and a thermalization efficiency of 1 (for Model 4) and blackbody emission (for Model 3 P. Lira et al. 1998) with the same values of mass and velocity (B. D. Metzger et al. 2010). Models 5 and 6 are kilonova models of T. Piran et al. (2013). The approximation is that all bolometric luminosity is concentrated in the R band, assuming a BNS merger with MNS = 1.4 M⊙ and a black hole (BH)-NS merger with MNS = 1.4 M⊙ and BH mass of 10 M⊙. This assumes low velocity (0.1c) and low ejecta mass (10−3 M⊙) (J. Barnes & D. Kasen 2013). Model 7 assumes an ejected mass of 10−3 M⊙, a velocity of 0.1c and lanthanide opacity (J. Barnes & D. Kasen 2013). Models 8 and 9 assume an accretion disk mass of 0.03 M⊙ and a remnant hypermassive NS or a remnant NS collapsing into a BH within 100 ms (D. Kasen et al. 2015). Model 10 represents a BH-NS merger with a BH/NS mass ratio of 3, ejected mass of 0.0256 M⊙, velocity v = 0.237c, a hard equation of state for the NS and BH spin of 0.75 (K. Kawaguchi et al. 2016). All models are scaled according to the distances of UGC 10667 and SDSS J171046.82+212732.9, respectively.
While the merger of a BNS system generates a GW signal, it may also give rise to short GRBs and KN. However, no associated GRB and KN were detected by following observations of GW190425 and FRB 20190425A. The absence of prompt emission from a short GRB could be due to the directional nature of its jet, where the narrow opening angle is not aligned with Earth, rendering it unobservable. In contrast, KN emissions are isotropic. So, in principle, we should detect them only if the observations reach deep enough in time. S. J. Smartt et al. (2024) explored the KN emission for UGC 10667 with respect to the BNS merger time window referred to in GW190425 and found no plausible KN emissions. This work used a corresponding method applied to SDSS J171046.84+212732.9 with similar results. Although KN emissions were not ultimately detected, we can still explore whether these galaxies (i.e., UGC 10667 and SDSS J171046.84+212732.9) might have hosted faint KN events, by scaling the KN AT 2017gfo and various KN models to the distance of the galaxy and comparing them to detection limits. We investigated this in Figure 8, using the types of KN models mentioned above. Here, we provide a concise summary of our findings: (1) Similar to the study on UGC 10667 conducted in S. J. Smartt et al. (2024), we found that for SDSS J171046.84+212732.9, KN models involving magnetar-enhanced kilonova emission are ruled out by the optical upper limits, particularly as they slowly approach their peak, i.e., more than 10 days. (2) Even though SDSS J171046.84+212732.9 is farther away, which could better explain the absence of a KN, UGC 10667 still satisfies the majority of KN models. Therefore, the results of KN searching do not provide conclusive evidence to determine which of them is the true host of GW190425 and FRB 20190425A. (3) The detection range of LIGO for BNS mergers is predicted to be more than 100 Mpc (B. P. Abbott et al. 2020b). At such distances, KN would be fainter than most of the current optical surveys based on their current schedules. In the future, with the advent of more powerful telescopes, such as the Rubin Observatory's Legacy Survey of Space and Time (LSST; Ž. Ivezić et al. 2019), much fainter optical limits can be achieved. This will aid in detecting KNe as well as pinpointing the most likely host galaxy.
3.2. Hubble Constant Estimation
Given the fact that current observations cannot definitively identify the real host galaxy, we therefore opt to constrain the Hubble constant using both SDSS J171046.84+212732.9 and UGC 10667. Moreover, for a more comprehensive consideration, a similar procedure is applied to the golden sample galaxies, which cover most of the significance corresponding to the generation of GW190425 and FRB 20190425A. The Bayesian framework for estimating H0 is shown below.
The p(dL, zi∣di) is denoted as the posterior distribution of luminosity distance (dL) and redshift for the GW190425 and the possible ith host galaxies of FRB 20190425A, based on the observation data set di. Our primary objective is to identify an effective model capable of describing the set of luminosity distance and redshift posteriors for N host galaxies. Here, we introduce a conditional prior π(dL, zi∣Λ) for luminosity distance from gravitational-wave detection and redshifts of host galaxies, incorporating the hyperparameters Λ. The hyperposterior distribution of Λ is defined by:

where π(Λ) represents the prior distribution for hyperparameters Λ, while the term  denotes the likelihood function of the data given dL and zi. The hyperparameters Λ are the Hubble constant H0 and the matter density Ωm.
  is the selection effect term, described as
  (B. P. Abbott et al. 2017b; T. Dietrich et al. 2020). The d, constructed by di, refers to the original observations providing measurements of luminosity distance and redshift. The likelihood related to the luminosity distance and redshift posteriors with original observations di is described by E. Thrane & C. Talbot (2019):

Here, π0(dL, zi) is the flat initial prior, a constant, used to derive the luminosity and redshift posterior, and  represents the initial evidence that cancels out during hyperposterior normalization or Bayesian evidence ratio constructions. The simplified likelihood is written as:

The hyperevidence  term in Equation (3) is formulated as:

To practically compute this, we replace the integral over ddL and dzi with a summation using posterior samples of dL and zi, see E. Thrane & C. Talbot (2019). This approach leads to a more tractable expression for the hyperevidence based on the flat initial prior and the canceled initial evidence:

as well as the hyperlikelihood,

Where ni refers to the number of redshift posterior samples (equivalent to those of luminosity distance, employing ni = 104 in this work) for the ith possible host galaxies.
In this work, we adopt a flat Friedmann–Robertson–Walker Universe and consistently employ the ΛCDM model as a reference throughout this study. The expression for the luminosity distance is given by:

where the Hubble parameter, H(z), assumes a dark energy equation of state of w = −1. This parameter is derived as  , with Ωm representing the matter density and ΩΛ = 1 − Ωm denoting the dark energy density. The comoving distance, r(z), is calculated as r(z) = dL/(1 + z). Under the assumption that the luminosity distance obtained by gravitational-wave observation, GW190425, is associated with redshifts from host galaxy candidates of FRB 20190425A, the conditional prior π(dL, zi∣Λ) can be expressed as,
Utilizing Ptmd as weight and incorporating the redshift of the galaxy, the combination of the luminosity distance posterior of GW190425 and the H0 posterior of GW170817 yields an estimate for the Hubble constant as  for the golden sample.9
As shown in Figure 9, by incorporating the contributions from GW190425 and its associated observations, we achieved a notable 30% reduction in the 1σ uncertainty of H0 compared to that of GW170817. If the posterior uncertainty of the luminosity distance of GW is further reduced, we anticipate even more refined outcomes. Given the large uncertainties in our results, it is difficult for them to offer much insight into arbitrating the Hubble tension. While our central value leans slightly toward the CMB result, both the CMB and SN Ia results lie well within our 1σ range. In Figure 10, we provide a comparative analysis of the results obtained in this study with other measurements, such as those from GW170817, CMB, SN Ia, and FRB, as well as some specific BNS mergers with both short GRB observation and probable KN emissions. As shown, most of the results, including ours, have a mean value between 60 and 80 km s−1 Mpc−1.
for the golden sample.9
As shown in Figure 9, by incorporating the contributions from GW190425 and its associated observations, we achieved a notable 30% reduction in the 1σ uncertainty of H0 compared to that of GW170817. If the posterior uncertainty of the luminosity distance of GW is further reduced, we anticipate even more refined outcomes. Given the large uncertainties in our results, it is difficult for them to offer much insight into arbitrating the Hubble tension. While our central value leans slightly toward the CMB result, both the CMB and SN Ia results lie well within our 1σ range. In Figure 10, we provide a comparative analysis of the results obtained in this study with other measurements, such as those from GW170817, CMB, SN Ia, and FRB, as well as some specific BNS mergers with both short GRB observation and probable KN emissions. As shown, most of the results, including ours, have a mean value between 60 and 80 km s−1 Mpc−1.
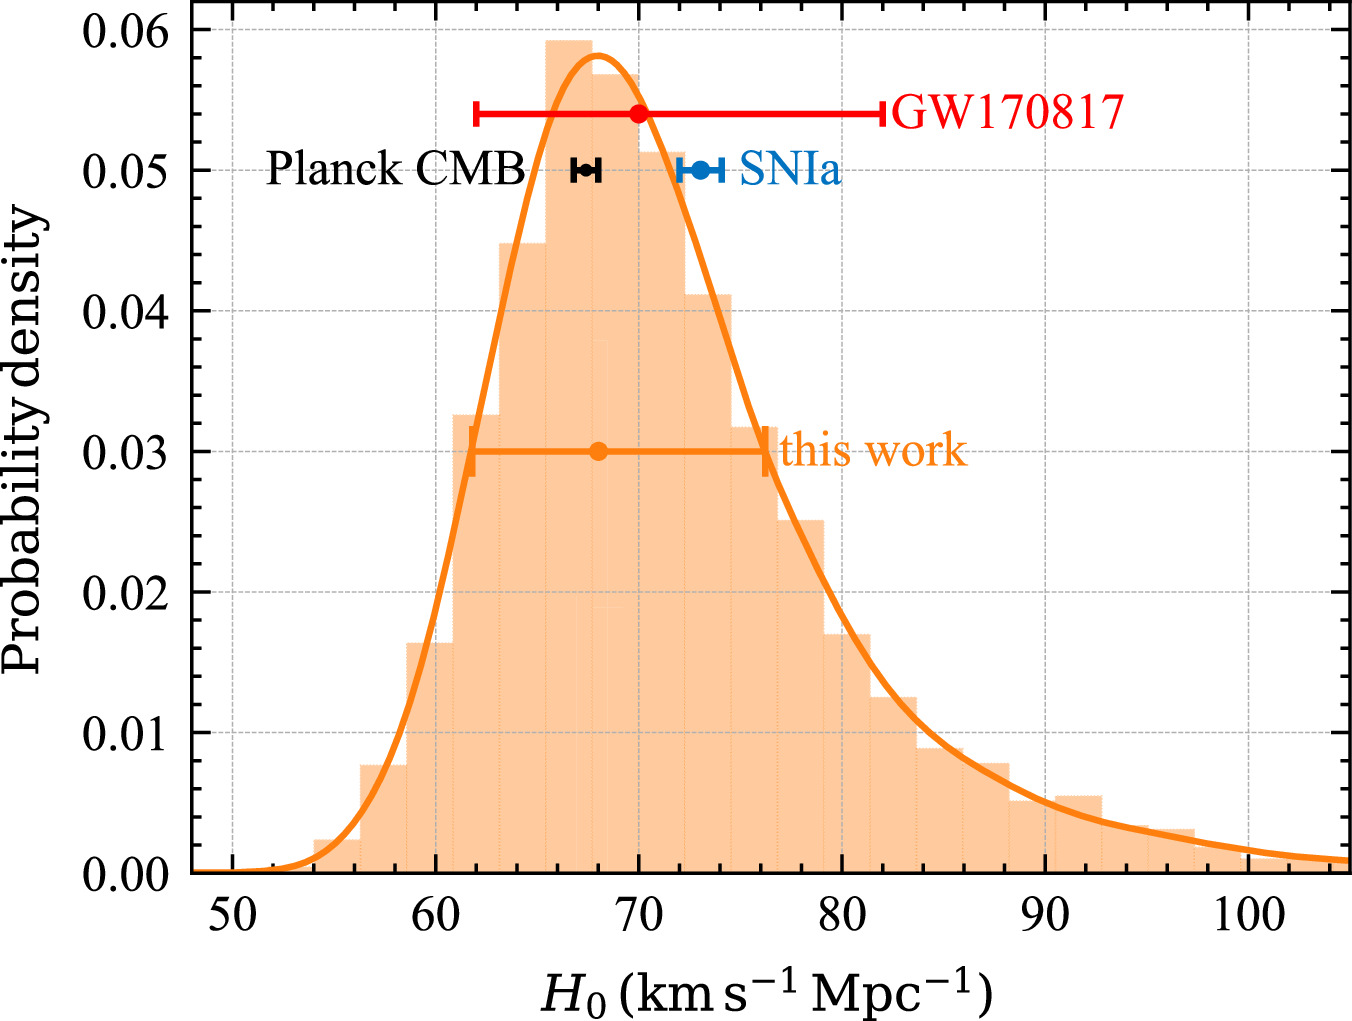
Figure 9. The hyperposterior distribution using 95.5% Ptmd events. The red point and errorbar indicate the result of GW170817 with  km s−1 Mpc−1. The black (blue) point and errorbar correspond to the measurements obtained from CMB (SN Ia) with H0 = 67.4 ± 0.5 (73.04 ± 1.04) km s−1 Mpc−1. The orange lines show the
  km s−1 Mpc−1based on the combination of GW190425, FRB 20190425A, and the H0 posterior of GW170817. All results are at 1σ uncertainty.
Download figure:
Standard image High-resolution image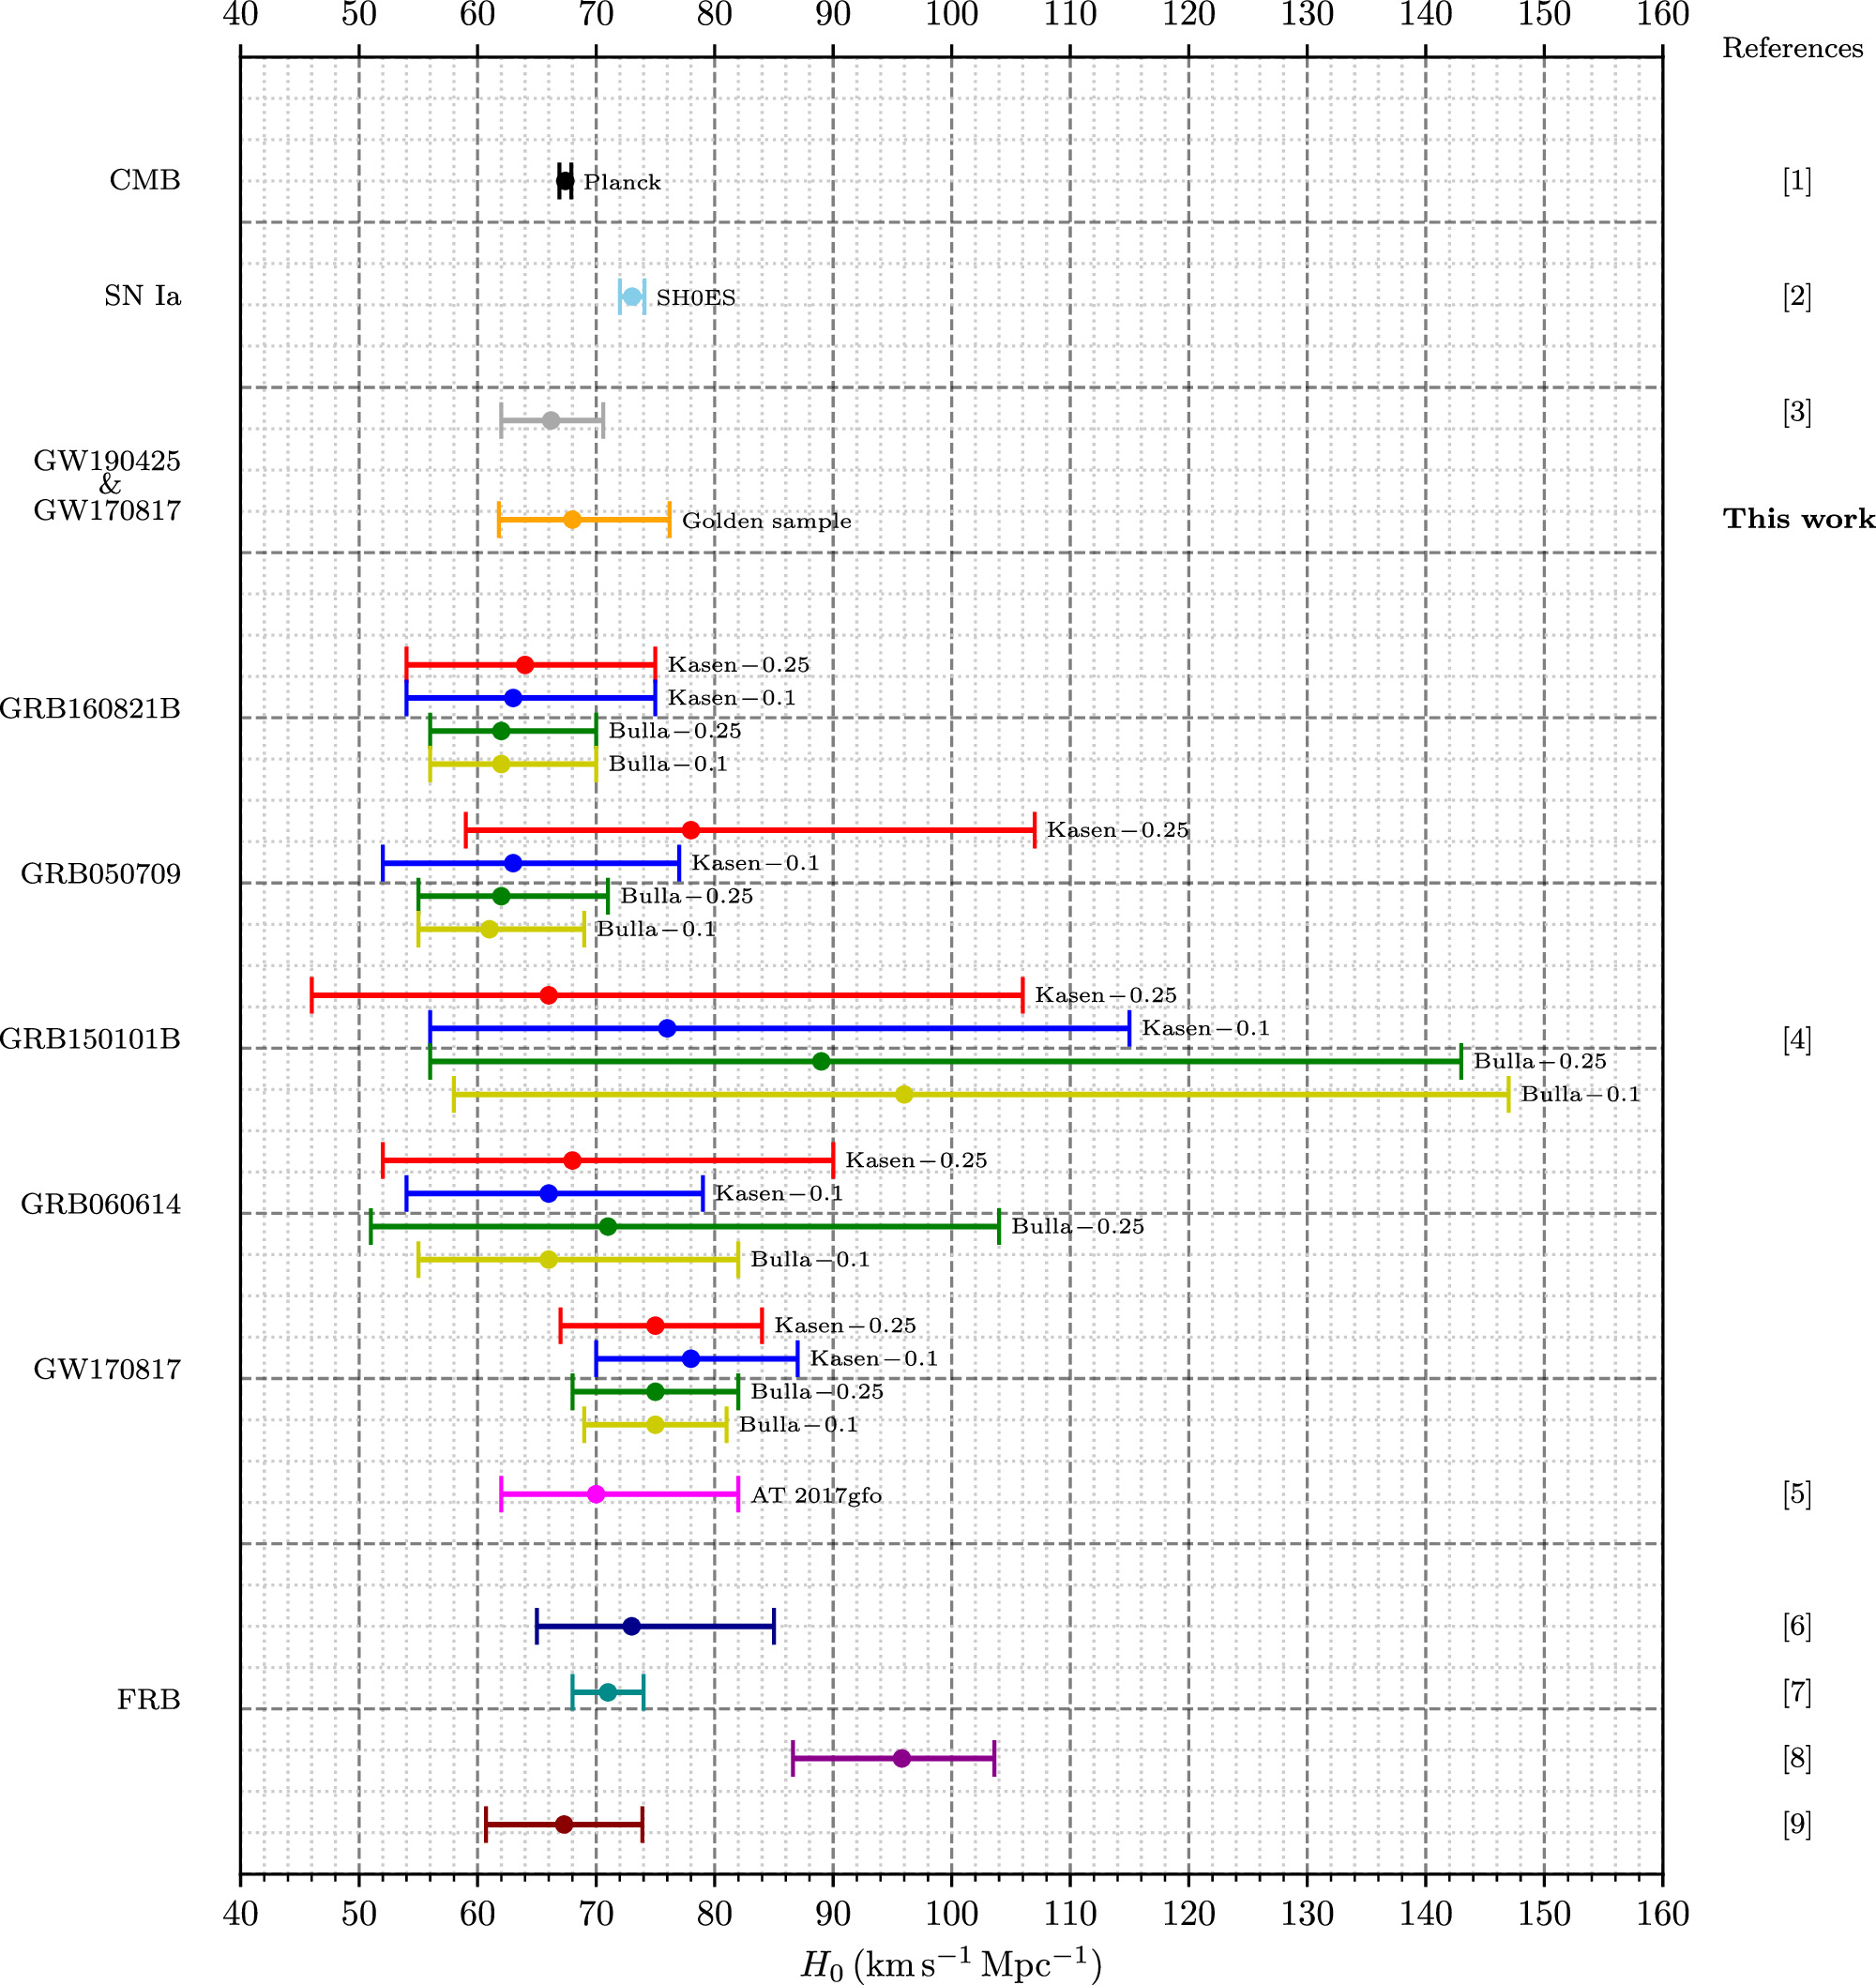
Figure 10. Hubble constant determined by different measurement or kilonova model. The points and errorbars in black and sky blue represent the results from Planck CMB and SH0ES SN Ia, respectively. The gray point and errorbar denote the combined result of GW170817 and GW190425. The orange point and errorbar represent the results of the golden sample in our study, while the red, blue, green, and dark yellow points and errorbars denote the results from light curves associated with short GRBs, assuming that these are attributable to KN with different models. The magenta point and errorbar represent the results of AT 2017gfo and GW170817. The points and errorbars in dark blue, dark cyan, dark magenta, and dark red represent the results obtained using different methods based on the FRB data. All errorbars in the results are presented with an uncertainty of 1σ. References: (1) Planck Collaboration et al. (2020); (2) A. G. Riess et al. (2022); (3) T. Dietrich et al. (2020); (4) M. W. Coughlin et al. (2020); (5) B. P. Abbott et al. (2017b); (6) C. W. James et al. (2022); (7) Y. Liu et al. (2023); (8) J.-J. Wei & F. Melia (2023); (9) J. A. S. Fortunato et al. (2024).
Download figure:
Standard image High-resolution image4. Conclusion
In this paper, we introduce a novel approach to identifying potential host galaxies, using the assumed association of GW190425 and FRB 20190425A as an example to demonstrate our methodology. With the CHIME localization map, we re-searched the host galaxy of FRB 20190425A and found another galaxy, SDSS J171046.84+212732.9, with a significant Ptmd and an even higher PPATH compared to UGC 10667. From the perspectives of Ptmd and PPATH, we cannot distinguish between these two galaxies well. Therefore, we conducted further exploration, such as fitting and comparing them with known FRB host galaxies, and fitting KN models to their reported observation limits. With these attempts, we found that these two galaxies are very similar, e.g., they had similar age, metallicity, and star formation history. Although SDSS J171046.84+212732.9 is farther away, which can better explain the absence of any detected KN emission, UGC 10667 can also satisfy the majority of KN models. Hence, based on the existing observations, we are unable to ascertain which galaxy serves as the actual host galaxy. Consequently, we used both of them (and galaxies with a cumulative Ptmd at 95% after normalization, taking a more comprehensive perspective into account) with their Ptmd as a weight to constrain the Hubble constant. Along with the H0 posterior from GW170817, the combined constraints yield an improved result for H0 at 1σ uncertainty, with  . Although the uncertainty in our results prevents us from arbitrating the tension between SN Ia measurements and the CMB, the inclusion of the redshift of the host galaxy identified through the FRB localization tends to push toward a lower value for H0.
Measurements from CMB and SN Ia are more precise, as they are well observed; however, they do not fall within the same range. The Hubble tension, often attributed to errors, assumptions, or potential new physics, remains a topic of interest. The inclusion of GW observations, especially those with well-localized events, presents a new avenue to explore and refine Hubble constant constraints. In this study, we demonstrate that well-localized GW events (with efforts of FRB localization) can contribute to a more accurate determination of H0, despite lacking plausible EM counterpart measurements. We anticipate that in the future there will be more well-localized GW events, especially those associated with GRB/FRB/KN. The joint constraints from these events on the Hubble constant are expected to improve in precision significantly. Using GW as a standard siren for cosmological constraints will likely yield more achievements as LIGO-Virgo-KAGRA continues its operations. This includes potential contributions to arbitrating the Hubble tension.
Acknowledgments
The authors thank anonymous referees for the thoughtful comments and feedback, which have strengthened this manuscript. D.-C.Q. is supported by the Startup Research Fund of Henan Academy of Sciences No.241841222. S.Y. acknowledges the funding from the National Natural Science Foundation of China under grant No. 12303046, and the Startup Research Fund of Henan Academy of Sciences No.241841217. Z.-Q.Y. is supported by the National Natural Science Foundation of China under grant No. 12305059, the Joint Fund of Henan Province Science and Technology R&D Program No.235200810111, and the Startup Research Fund of Henan Academy of Sciences No.241841224. The ZTF forced-photometry service was funded under the Heising Simons Foundation grant No. 12540303 (PI: Graham).
Footnotes
- 4
- 5
We assume that the mass distribution follows the B-band luminosity.
- 6
The dispersion measure of FRB 20190425A is DMobs = 127.8 pc cm−3, minus the contribution from the intergalactic medium in the Milky Way (DMMW,ne2001 = 79.4 pc cm−3), we get a maximum redshift of
 (assume the flat ΛCDM with parameters from Planck Collaboration et al. 2020).
 - 7
We retrieved observations of AT 2017gfo taken by the Wide Field Camera 3 (WFC3) from the MAST archive (PI: A. Levan). The HST proposal ID is 14804, and the image data is from https://archive.stsci.edu/proposal_search.php?id=14804&mission=hst. We used astrodrizzle to optimally regrid the image and SExtractor (E. Bertin & S. Arnouts 1996) to identify point-like or the center of extended sources.
- 8
This is a projected distance, representing a lower limit on the actual radial distance of the KN from the galaxy nucleus.
- 9
The Hubble constant calculated with only SDSS J171046.84+212732.9 and UGC 10667 closely resemble that of the golden sample, given their substantial contributions to the overall weight of Ptmd. Therefore, we discuss only the result of the golden sample throughout this work.
