Abstract
The 3.3 μm unidentified infrared emission feature is commonly attributed to the C–H stretching band of aromatic molecules. Astronomical observations have shown that this feature is composed of two separate bands at 3.28 and 3.30 μm, and the origin of these two bands is unclear. In this paper, we perform vibrational analyses based on quantum mechanical calculations of 153 organic molecules, including both pure aromatic molecules and molecules with mixed aromatic/olefinic/aliphatic hydridizations. We find that many of the C–H stretching vibrational modes in polycyclic aromatic hydrocarbon (PAH) molecules are coupled. Even considering the uncoupled modes only, the correlation between the band intensity ratios and the structure of the PAH molecule is not observed, and the 3.28 and 3.30 μm features cannot be directly interpreted in the PAH model. Based on these results, the possible aromatic, olefinic, and aliphatic origins of the 3.3 μm feature are discussed. We suggest that the 3.28 μm feature is assigned to aromatic C–H stretch whereas the 3.30 μm feature is olefinic. From the ratio of these two features, the relative olefinic to aromatic content of the carrier can be determined.
1. Introduction
The 3.3 μm emission feature was first discovered in the planetary nebula NGC 7027 (Merrill et al. 1975). The extension of spectral observations to longer wavelengths revealed that the 3.3 μm features is a member of a family of strong bands at 3.3, 6.2, 7.7, 8.6, and 11.3 μm (Russell et al. 1977b), which are now collectively called unidentified infrared emission (UIE) bands. Since these features are too broad to be atomic lines, and without any substructures to qualify as molecular bands, they were believed to arise from mineral solids (Russell et al. 1977a). This seemed a reasonable interpretation at the time because silicate minerals have already been found to be common among evolved stars (Woolf & Ney 1969).
Interestingly, the 3.3 μm UIE feature was almost immediately proposed as originating from the C–H stretching mode of organic compounds (Knacke 1977; Duley & Williams 1979). However, the organic interpretation was largely ignored as organics were considered to be an unlikely component of the interstellar medium at that time. Only after the discovery of a large number of simple gas-phase organic molecules in space through their rotational transitions in the millimeter-wave band was organic compounds being taken seriously by the astronomical community. For the last 30 years, the UIE bands have been commonly attributed to radiatively excited vibrational modes of polycyclic aromatic hydrocarbon (PAH) molecules (Allamandola et al. 1989; Puget & Le’ger 1989).
In spite of the popularity of the PAH model, there are major problems associated with this hypothesis (Kwok & Zhang 2011, 2013). It is well known among chemists that the vibrational modes of PAH molecules spread over wide range of wavelengths, and no specific PAH molecules match the observed wavelengths and band intensities of the astronomical UIE bands (Cook et al. 1996, 1998; Wagner et al. 2000). The detection of 3.4 μm (Merrill et al. 1975) and 6.9 μm (Puetter et al. 1979) bands in many UIE sources also complicates the matter. These two features can be traced to the C–H stretch and C–H in-plane band of aliphatic compounds (Duley & Williams 1981). Although the 3.3 μm band is generally much stronger than the 3.4 μm band, in some sources (e.g., proto-planetary nebulae), the two features can be comparable in strength (Geballe et al. 1992; Goto et al. 2007; Hrivnak et al. 2007).
The laboratory measurements of the 3.3 and 3.4 μm features date back to 1905, when organic molecules containing normal saturated hydrocarbons and benzene were studied with the technique of infrared absorption spectroscopy (Coblentz 1905). The first identification of these bands as due to vibrations of molecules were provided by mechanical models with empirical force constants (Fox & Martin 1937, 1938, 1939, 1940). These interpretations were later confirmed by quantum mechanical ab initio electronic structure calculations (Hehre et al. 1986).
Higher spectral resolution observations of the astronomical 3.3 μm feature show that it is in fact composed of two components: a feature peaking at 3.28 μm and another at 3.30 μm (Tokunaga et al. 1991; Song et al. 2003; Hammonds et al. 2015). The observation that the two components are emitted in different spatial locations suggests that these two components originate from different (although possibly related) chemical species (Candian et al. 2012).
Two explanations have been proposed for the vibrational nature of the 3.3 μm feature. One is based on the PAH model where the 3.28 and the 3.30 μm components arise from “bay” and “non-bay” hydrogen sites of the PAH units (see Figure 3 of Candian et al. 2012). This interpretation is mainly based on the detection of two bands within the range of 3.33–3.21 μm in the experimental gas-phase infrared spectra of some small PAH molecules with bay-type hydrogens in their molecular structures (see Figure 6 of Candian et al. 2012). Alternatively, Chiar et al. (2013) assign an aliphatic origin to the 3.28 μm component and interpret it as the stretching mode of olefinic C−H bonds in amorphous hydrocarbons.
In the PAH hypothesis, the 3.4 μm feature is the result of superhydrogenation of PAH molecules (Schutte et al. 1993). It has also been interpreted as arising from hot bands from anharmonic aromatic C–H stretch, which shifts the 3.3 μm feature to a longer wavelength (Barker et al. 1987). However, theoretical calculations, including anharmonicity, show a simultaneous increase of the width of the 3.3 μm feature, which was not observed (van Diedenhoven et al. 2004). Furthermore, the expected strong overtone bands at the 1.6–1.8 μm region are not detected, making the anharmonicity explanation unlikely (Goto et al. 2003, and references therein).
Most likely, the astronomically observed 3.4 μm feature is aliphatic in nature and arises from C−H stretching modes of methyl and methylene functional groups (Sandford et al. 1991; Goto et al. 2007; Sadjadi et al. 2015a). Distinct components of the 3.4 μm have been observed at 3.40, 3.46, 3.52, and 3.56 μm (Jourdain de Muizon et al. 1986, 1990; Hrivnak et al. 2007).
Another class of molecules in which C–H stretching modes can contribute to the observed 3.3 μm bands are diamondoids. For example, adamantane (C10H16), with a cage-like, full sp3 structure, shows vibrational bands in the 3 μm region in both gas and solid phases (Oomens et al. 2006; Pirali et al. 2007). The C–H stretch of hydrogenated diamonds at 3.43 and 3.53 μm have been detected (Guillois et al. 1999). After the discovery of fullerenes (C60) in the interstellar medium, hydrogenated fullerenes (fulleranes) have also been detected through their C–H stretching modes (Zhang & Kwok 2013).
At an even higher complexity level, many amorphous hydrocarbons show strong spectral features around the 3.3 μm region. The best known examples are hydrogenated amorphous carbon (HAC, Scott & Duley 1996) and quenched carbonaceous composites (QCC, Sakata et al. 1987). The mixed hybridization nature of these materials produces a richer spectrum in the 3.3–3.5 μm region (Wada & Tokunaga 2006).
When heteroatoms are added to the hydrogen-carbon mix, other spectral features can appear. A good example is the sp2 C−H bond in carbonyl group of aldehyde family, with its stretching mode that lies within the range of 3.45−3.77 μm (Socrates 2001). Replacing the carbon atom with the nitrogen in a neutral PAH molecule can cause blueshifts of the 3.3 μm band (Mattioda et al. 2017).
Carbon is a soft atom with the ability to make the variety of classical and non-classical molecular structures and C−H bonds (Minyaev & Minkin 2008). The stretching vibration of the C−H bond in different hybridization and singlet or triplet electronic states spans the wavelength range of 2.8 to 3.7 μm. It is clear from the above discussions that the origin of the 3.3 μm UIE band is far from settled. In this paper, we explore the possible origins of the 3.3 μm feature through a quantum chemical vibrational analysis of 153 molecules ranging in structure from pure PAH molecules to molecules with aromatic cores and aliphatic side groups and pure aliphatic chains.
2. Method
Our calculations are based on density functional theory B3LYP (Becke 1993a; Hertwig & Koch 1997) functions and BHandHLYP hybrid functionals (Becke 1993b) in combination with the polarization consistent basis set PC1 (Jensen 2001, 2002). We obtain the local minimum geometries and the harmonic frequencies of fundamental vibrations of four groups of molecules: PAH (Figure 1), ally PAH (Figure 2), alkyl-PAH (Figure 3), and normal and branched alkane organic compounds (Figure 4). The names and molecular formulas of these molecules are listed in Tables 1–4. The double scaling factors scheme of (Laury et al. 2012) is applied to the DFT harmonic vibrational frequencies. In this scheme, the harmonic frequencies >1000 cm−1 and <1000 cm−1 are scaled by 0.9311 and 0.9352 for BHandHLYP hybrid functionals and 0.9654 and 0.9808 for B3LYP, respectively.
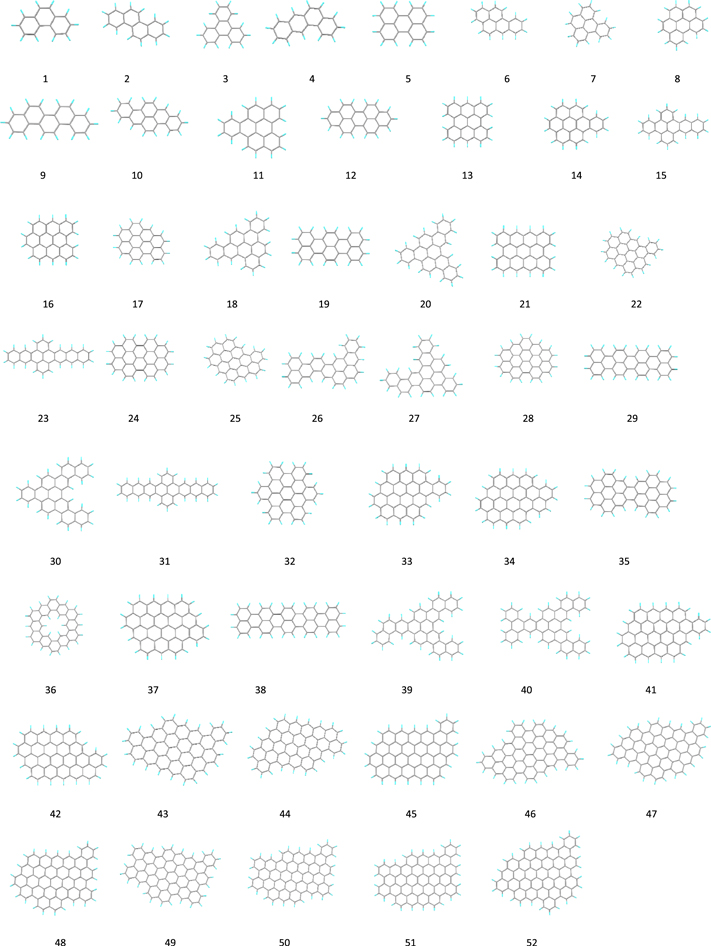
Figure 1. Local minimum geometries of 52 planar neutral PAH molecules with “bay” C–H sites.
Download figure:
Standard image High-resolution image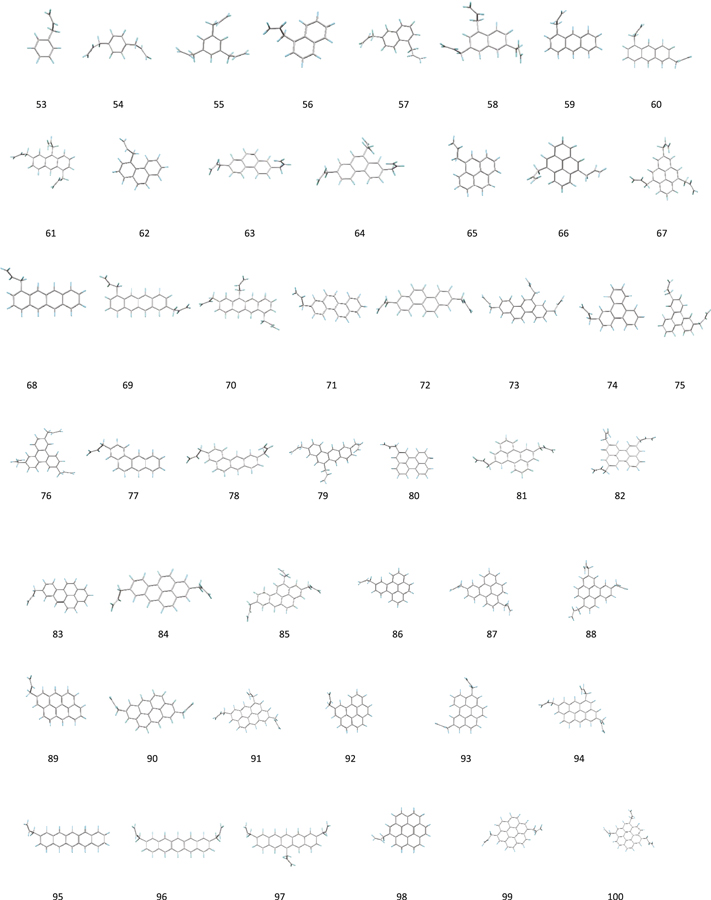
Download figure:
Standard image High-resolution image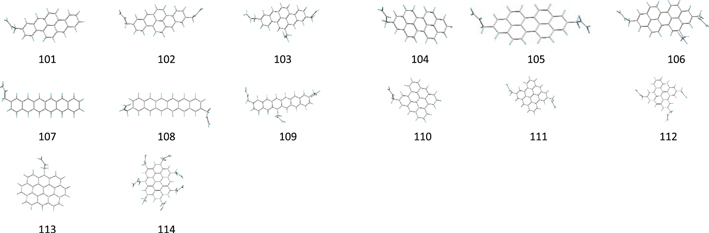
Figure 2. Local minimum geometries of 62 neutral allyl-PAH molecules.
Download figure:
Standard image High-resolution image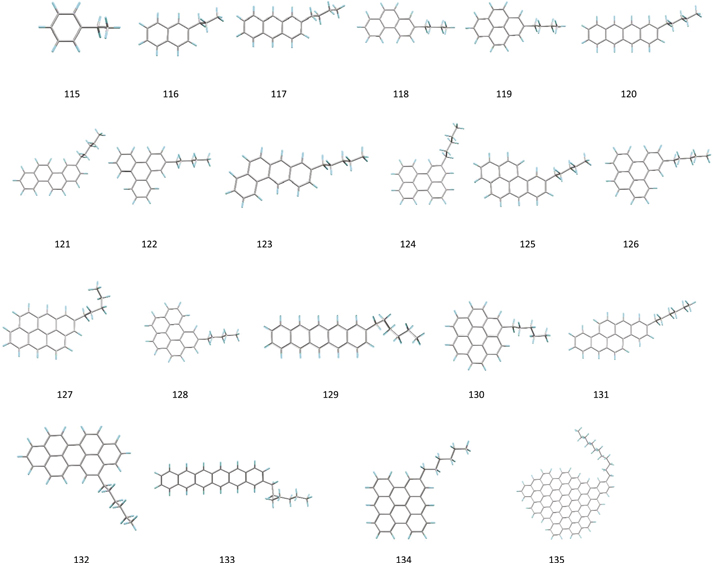
Figure 3. Local minimum geometries of 21 neutral alkyl-PAH molecules. All these molecules are chosen because they have an equal number of aromatic and aliphatic C−H bonds.
Download figure:
Standard image High-resolution image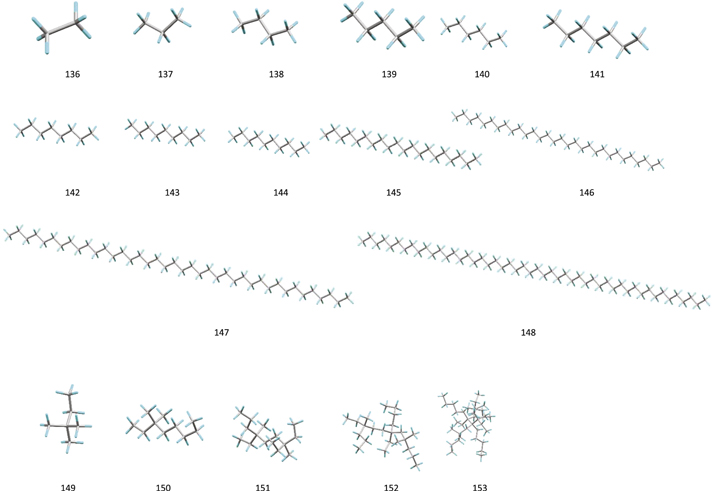
Figure 4. Local minimum geometries of 18 molecules with linear and branched aliphatic sp3 structures.
Download figure:
Standard image High-resolution imageTable 1. Names and Molecular Formulas for PAH Molecules in Figure 1
| No | Name | Formula | Bay% | Abaya,b,c | Anon-baya,b,c | Abay/Anon-bay |
|---|---|---|---|---|---|---|
| 1 | Phenanthrene | C14H10 | 20 | …d | 3.0087 | … |
| 2 | Chrysene | C18H12 | 33 | 5.4323 | 0.0896 | 60.6283 |
| 3 | Triphenylene | C18H12 | 50 | 6.5119 | … | … |
| 4 | Benzo[a]anthracene | C18H12 | 17 | … | 3.3416 | … |
| 5 | Perylene | C20H12 | 33 | 4.4219 | 0.7326 | 6.0359 |
| 6 | Benzo[a]Pyrene | C20H12 | 17 | … | 3.5903 | … |
| 7 | Benzo[e]Pyrene | C20H12 | 33 | … | 0.8320 | … |
| 8 | Benzo-ghi-perylene | C22H12 | 17 | … | 3.8310 | … |
| 9 | PAH62 | C22H14 | 43 | 3.3703 | 0.1518 | 22.2022 |
| 10 | Dibenzo-b-def-chrysene | C24H14 | 29 | 6.5668 | 0.3759 | 17.4695 |
| 11 | PAH65 | C26H14 | 43 | 4.7020 | 0.2967 | 15.8477 |
| 12 | Dibenzo-cd-lm-perylene | C26H14 | 29 | 6.3810 | 9.5837 | 0.6658 |
| 13 | Bisanthene | C28H14 | 29 | … | 3.9149 | … |
| 14 | Bezo-a-coronene | C28H14 | 29 | 4.2570 | 7.1959 | 0.5916 |
| 15 | Dibenzo[fg,st]pentacene | C28H16 | 50 | 4.4276 | 4.9596 | 0.8927 |
| 16 | Dibenzo-bc-ef-coronene | C30H14 | 14 | … | 6.8488 | … |
| 17 | Naphtho[8,1,2abc]coronene | C30H14 | 14 | … | 8.2805 | … |
| 18 | PAH66 | C30H16 | 50 | 5.6046 | 0.2405 | 23.3040 |
| 19 | Terrylene | C30H16 | 50 | … | 6.4576 | … |
| 20 | PAH67 | C34H18 | 56 | 7.3400 | 0.4854 | 15.1215 |
| 21 | Tetrabenzocoronene | C36H16 | 25 | … | 4.5748 | … |
| 22 | benzo[a]ovalene | C36H16 | 25 | … | 8.8417 | … |
| 23 | Dibenzo[hi,yz]heptacene | C36H20 | 40 | 1.1807 | 6.3096 | 0.1871 |
| 24 | Circumbiphenyl | C38H16 | 25 | 6.9933 | 11.1395 | 0.6278 |
| 25 | Naphth[8,2,1,abc]ovalene | C38H16 | 13 | … | 9.1260 | … |
| 26 | PAH64 | C38H20 | 35 | 2.2953 | 1.9427 | 1.1815 |
| 27 | PAH68 | C38H20 | 55 | 5.4204 | 0.3564 | 15.2088 |
| 28 | Phenanthro[3,4,5,6 vuabc]ovalene | C40H16 | 13 | … | 10.9727 | … |
| 29 | Quaterrylene | C40H20 | 60 | 3.9990 | 2.5500 | 1.5682 |
| 30 | PAH69 | C40H22 | 55 | 6.1832 | 0.2588 | 23.8918 |
| 31 | Dibenz[jk,a1b1]octacene | C40H22 | 36 | 1.5360 | 8.4421 | 0.1819 |
| 32 | Hexabenzocoronene | C42H18 | 67 | 5.1698 | 12.5668 | 0.4114 |
| 33 | Honeycomb15 | C46H18 | 22 | … | 9.4177 | … |
| 34 | Honeycomb16 | C48H18 | 22 | … | 8.3141 | … |
| 35 | Dicoronylene | C48H20 | 20 | 6.2168 | 12.2820 | 0.5062 |
| 36 | Kekulene | C48H24 | 25 | 2.1244 | 13.0511 | 0.1628 |
| 37 | Honeycomb17 | C50H18 | 11 | … | 17.8705 | … |
| 38 | Pentarylene | C50H24 | 67 | 4.3661 | 3.5769 | 1.2206 |
| 39 | PAH70 | C50H26 | 50 | 4.7942 | 2.5430 | 1.8853 |
| 40 | PAH71 | C54H28 | 57 | 5.1842 | 0.2294 | 22.5990 |
| 41 | Honeycomb19 | C56H20 | 20 | … | 10.1078 | … |
| 42 | Honeycomb20 | C58H20 | 10 | … | 8.8576 | … |
| 43 | Honeycomb21 | C62H22 | 27 | … | 4.9764 | … |
| 44 | Honeycomb22 | C64H22 | 18 | … | 4.6413 | … |
| 45 | Honeycomb23 | C66H22 | 18 | … | 11.2213 | … |
| 46 | Honeycomb24 | C70H24 | 42 | … | 8.6362 | … |
| 47 | Honeycomb25 | C72H24 | 42 | 2.2637 | 7.4262 | 0.3048 |
| 48 | Honeycomb26 | C74H24 | 42 | 2.3387 | 7.0688 | 0.3308 |
| 49 | Honeycomb27 | C78H26 | 54 | 1.7217 | 0.2593 | 6.6398 |
| 50 | Honeycomb28 | C80H26 | 54 | 1.7118 | 0.2573 | 6.6529 |
| 51 | Honeycomb29 | C82H26 | 54 | 1.6768 | 0.2990 | 5.6080 |
| 52 | Honeycomb30 | C84H26 | 54 | 2.4132 | 0.6710 | 3.5964 |
Notes.
aIntrinsic band strengths of the pure bay/non-bay C–H stretching mode. bIn units of km/mol/numbers of bay/non-bay C–H bonds in the molecular structure. cSum of the intensity of pure bay/non-bay transitions divided by the number of bay/non-bay C–H bonds in the molecular structure. dNo pure bay/non-bay transitions, or found to be entirely Raman modes.Download table as: ASCIITypeset image
Table 2. Names and Molecular Formulas for allyl-PAH Molecules in Figure 2
| No | Name | Formula |
|---|---|---|
| 53 | allylbenzene | C9H10 |
| 54 | di-allylbenzene | C12H14 |
| 55 | tri-allylbenzene | C15H18 |
| 56 | allylnaphthalene | C13H12 |
| 57 | di-allylnaphthalene | C16H16 |
| 58 | tri-allylnaphthalene | C19H20 |
| 59 | allyanthracene | C17H14 |
| 60 | di-allyanthracene | C20H18 |
| 61 | tri-allylanthracene | C23H22 |
| 62 | allylphenanthrene | C17H14 |
| 63 | di-allylphenanthrene | C20H18 |
| 64 | tri-allylphenanthrene | C23H22 |
| 65 | allylpyrene | C19H14 |
| 66 | di-allylpyrene | C22H18 |
| 67 | tri-allylpyrene | C25H22 |
| 68 | allyltetracene | C21H16 |
| 69 | di-allyltetracene | C24H20 |
| 70 | tri-allyltetracene | C27H24 |
| 71 | allylchrysene | C21H16 |
| 72 | di-allylchrysene | C24H20 |
| 73 | tri-allylchrysene | C27H24 |
| 74 | allyltriphenylene | C21H16 |
| 75 | di-triphenylene | C24H20 |
| 76 | tri-triphenylene | C27H24 |
| 77 | allylbenzo-a-anthracene | C21H16 |
| 78 | di-allylbenzo-a-anthracene | C24H20 |
| 79 | tri-allylbenzo-a-anthracene | C27H24 |
| 80 | allylperylene | C23H16 |
| 81 | di-allylperylene | C26H20 |
| 82 | tri-allylperylene | C29H24 |
| 83 | allylbenzo-a-pyrene | C23H16 |
| 84 | di-allylbenzo-a-pyrene | C26H20 |
| 85 | tri-allylbenzo-a-pyrene | C29H24 |
| 86 | allylbenzo-e-pyrene | C23H16 |
| 87 | di-allylbenzo-e-pyrene | C26H20 |
| 88 | tri-allylbenzo-e-pyrene | C29H24 |
| 89 | allyanthanthrene | C25H16 |
| 90 | di-allyanthanthrene | C28H20 |
| 91 | tri-allyanthanthrene | C31H24 |
| 92 | allylbenzo-ghi-perylene | C25H16 |
| 93 | di-allylbenzo-ghi-perylene | C28H20 |
| 94 | tri-allylbenzo-ghi-perylene | C31H24 |
| 95 | allylpentacene | C25H18 |
| 96 | di-allylpentacene | C28H22 |
| 97 | tri-allylpentacene | C31H26 |
| 98 | allylcoronene | C27H16 |
| 99 | di-allylcoronene | C30H20 |
| 100 | tri-allylcoronene | C33H24 |
| 101 | allyldibenzo-bdef-chrysene | C27H18 |
| 102 | di-allyldibenzo-bdef-chrysene | C30H22 |
| 103 | tri-allyldibenzo-bdef-chrysene | C33H26 |
| 104 | allyldibezo-cdlm-perylene | C29H18 |
| 105 | di-allyldibezo-cdlm-perylene | C32H22 |
| 106 | tri-allyldibezo-cdlm-perylene | C35H26 |
| 107 | allylhexacene | C29H20 |
| 108 | di-allylhexacene | C32H24 |
| 109 | tri-allylhexacene | C35H28 |
| 110 | allylbisanthene | C31H18 |
| 111 | di-allylbisanthene | C34H22 |
| 112 | tri-allylbisanthene | C35H28 |
| 113 | allylovalene | C35H18 |
| 114 | hepta-allylovalene | C53H42 |
Download table as: ASCIITypeset image
Table 3. Names and Molecular Formulas for alkyl-PAH Molecules in Figure 3
| No | Name | Formula |
|---|---|---|
| 115 | ethylbenzene | C8H10 |
| 116 | propylnathelene | C13H14 |
| 117 | butylanthracene | C18H18 |
| 118 | butylphenanthrene | C18H18 |
| 119 | butylpyrene | C20H18 |
| 120 | pentyltetracene | C23H22 |
| 121 | pentylchrysene | C23H22 |
| 122 | pentyltriphenylene | C23H22 |
| 123 | pentylbenzo-a-anthracene | C23H22 |
| 124 | pentylperylene | C25H22 |
| 125 | pentylbenzo-a-pyrene | C25H22 |
| 126 | pentylbenzo-e-pyrene | C25H22 |
| 127 | pentylanthanthrene | C27H22 |
| 128 | pentylbenzo-ghi-perylene | C27H22 |
| 129 | hexylpentacene | C28H26 |
| 130 | pentylcoronen | C29H22 |
| 131 | hexyl-dibenzo-bdef-chrysene | C30H26 |
| 132 | hexyl-dibenzo-cdlm-perylene | C32H26 |
| 133 | heptylhexacene | C33H30 |
| 134 | hexylbisanthene | C34H26 |
| 135 | dodecylHoneycomb30 | C96H50 |
Download table as: ASCIITypeset image
Table 4. Names and Molecular Formulas for Aliphatic Molecules in Figure 4
| No | Name | Formula |
|---|---|---|
| 136 | ethane | C2H6 |
| 137 | n-propane | C3H8 |
| 138 | n-butane | C4H10 |
| 139 | n-pentane | C5H12 |
| 140 | n-hexane | C6H14 |
| 141 | n-heptane | C7H16 |
| 142 | n-octane | C8H18 |
| 143 | n-nonane | C9H20 |
| 144 | n-decane | C10H22 |
| 145 | n-icosane | C20H42 |
| 146 | n-triacontane | C30H62 |
| 147 | n-tetracontane | C40H82 |
| 148 | n-pentacontane | C50H102 |
| 149 | 2,2-dimethylbutane | C6H14 |
| 150 | 3,3-dimethyloctane | C10H22 |
| 151 | hydrocarbon | C15H32 |
| 152 | hydrocarbon | C23H48 |
| 153 | hydrocarbon | C31H64 |
Download table as: ASCIITypeset image
The calculations were performed using the Gaussian 09, Revision C.01 software package (Frisch et al. 2009) running on the HKU grid-point supercomputer facility. The B3LYP calculations were done using PQS6 running on QS128-2300C-OA16 QuantumCubeTM machine. Under the default criteria of both software, all the optimized geometries were characterized as local minima, and established by the positive values of all harmonic frequencies and their associated eigenvalues of the second derivative matrix.
Visualization and manipulation of the results of a vibrational normal mode analysis were performed by utilizing the Chemcraft7 suit program. Quantitative vibrational analyses on atomic displacement vectors were performed by Vibanalysis code V2.0, as described in (Sadjadi et al. 2015a). In order to simulate astronomical spectroscopic observations, a Drude broadening profile of T = 500 K and FWHM = 0.03 is applied to the experimental resolved or theoretically calculated vibrational transitions (Sadjadi et al. 2015a). The value of the FWHM is chosen to match with the FWHM value of the astronomical UIE features at 3 to 4 μm region of infrared spectra (C.-H. Hsia et al. 2017, in preparation).
The accuracy of the theoretical calculations can be tested by comparing them with gas-phase laboratory infrared spectra (Zvereva et al. 2011). Previously, we have estimated errors of 0.12–0.13 μm for our density functional theory calculations (Sadjadi et al. 2015a). We have compared the experimental spectra (2 μm ≤ λ < 4 μm) of 28 PAH molecules in the version 2 of the NASA-Ames PAH data base (Boersma et al. 2014) with a test set of 60 neutral PAH molecules (Sadjadi et al. 2015b) and the results are shown in Table 5. We find average errors of 0.03316 μm and 53 kcal/mol in wavelength and absolute intensity, respectively. It should be noted that although DFT calculations show a large error in predicting the absolute intensity values, they can predict good relative intensities (Zvereva et al. 2011; Sadjadi et al. 2015a).
Table 5. Comparison between Theory and Experiment of Wavelengths and Intensities of 3 μm Vibrational Modes of Neutral PAH Molecules
| Method | Number of transitions | λ(μm) | I(km.mol−1) |
|---|---|---|---|
| Experimenta | 77 | 3.28784 | 64.0916 |
| Theoretical (DFT)b | 1026 | 3.25468 | 10.9139 |
| Exp-DFT | … | 0.03316 | 53.1777 |
Notes.
a28 PAH molecules from NASA-AMES PAH database v2.0. b60 PAH molecules (Sadjadi et al. 2015b).Download table as: ASCIITypeset image
3. The 3.3 μm Feature
3.1. Vibrational Analysis of “bay” and “non-bay” Aromatic C−H Stretching Modes
In order to quantitatively evaluate the “bay” and “non-bay” origins for the 3.28 and 3.30 μm features as proposed by Candian et al. (2012), we have computed the vibrational modes of a group of 52 neutral PAH molecules of different sizes and shapes with peripheral hydrogen atoms in “bay” configurations (Figure 1, Table 1). The relative numbers of “bay” C−H bonds to the total aromatic C−H bonds in each of these molecules are listed under column 4 of Table 1. The number of the normal modes for each molecule listed in Table 1 is equal to the number of aromatic C−H bonds or simply the hydrogen atoms in the molecular formula. In total, there are 986 normal modes for the 52 molecules, and these modes (including both Raman and IR active modes) are analyzed based on the vibrational displacement vectors in the calculations (Sadjadi et al. 2015a) in which we use criterion that atoms with total displacement of less than 0.01 Å are set as stationary atoms with zero contribution to the normal mode.
Figure 5 shows the degree of contribution from “non-bay” (top panel) and “bay” (bottom panel) C−H bonds to vibrational modes at each frequency in the 3 μm region. These results show a considerable coupling of both “bay” and “non-bay” aromatic C−H stretching bond vibrations. Approximately half of the transitions are pure “bay” (111) and “non-bay” (372), and the remaining (503) are coupled transitions. If we ignore these couplings, the vibrations with a sole contribution from “bay” C−H bonds appear at shorter wavelengths than the “non-bay” vibrations. The “bay” C–H bond lengths are generally slightly shorter than “non-bay” bond lengths, thus their vibrations are expected to appear at slightly shorter wavelengths. Although this is qualitatively consistent with the suggestion of Candian et al. (2012), the considerable coupling suggests that we would be unable to directly link the “bay” and “non-bay” aromatic C−H vibrations to the 3.28 and 3.30 μm astronomical components.
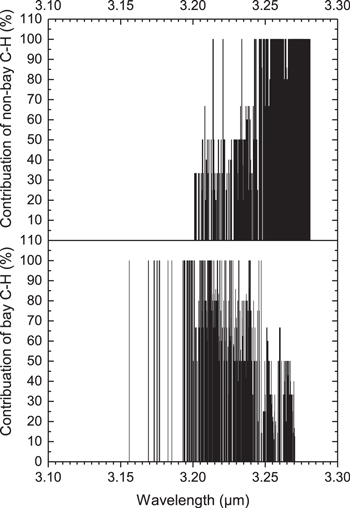
Figure 5. Peak vibrational wavelengths, dependence on the fraction of “non-bay” (top panel) and “bay” (bottom panel) aromatic C−H stretching modes (in percentage scale) for the molecules 1–52 in Figure 1 and Table 1). The lines that have contributions less than 100% are coupled modes. Out of a total of 986 transitions plotted, 111 are pure “bay,” 372 are pure “non-bay,” and 503 are coupled modes.
Download figure:
Standard image High-resolution imageFrom astronomical observations, the flux ratio of the 3.28/3.30 μm varies from 0.36 to 4.97 (C.-H. Hsia et al. 2017, in preparation). Can this range of flux ratios be explained by “bay” and “non-bay” C−H bonds? The relative intensities of the vibrational modes are convolved with a Drude profile at T = 500 K and the band profiles of the “bay” and “non-bay” transitions are shown in Figure 6. These results suggest a theoretical band flux ratio (Ff:fig5/Fnon-bay) of 1.17.
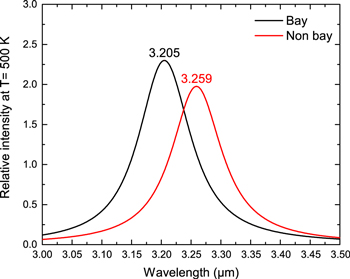
Figure 6. Simulated Drude profiles (T = 500 K) of pure bay (111 transitions) and pure non-bay (372 transitions) aromatic C−H transitions.
Download figure:
Standard image High-resolution imageThe separation between the peak of the “bay” and the “non-bay” profiles is 0.054 μm, which is larger than the astronomical observed wavelength difference between 3.28 and 3.30 components. For comparison with the theoretical calculations, we have also produced simulated astronomical spectra from laboratory data on PAH molecules with “bay” and “non-bay” C−H bonds in their structures (Figure 7). There is a slight difference between the peak wavelengths of the 3 μm C–H stretch of the two groups, but the difference is not large enough to separate the molecules based on the spectra alone. This suggests that there is a high degree of coupling between the “bay” and “non-bay” vibrations in actual PAH molecules.
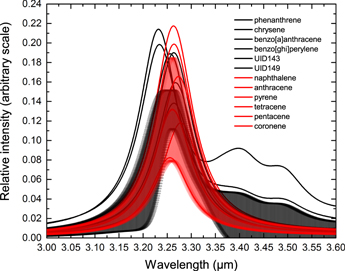
Figure 7. Gas-phase laboratory infrared spectra of 12 neutral PAH molecules broadened by Drude profiles of T = 500 K and FWHM = 0.03. Bands profile of “bay” PAH molecules are shown in black and “non-bay” PAH molecules in red. The standard deviations of average spectra for group of “bay” and “non-bay” PAH molecules are presented as shaded areas in black and red, respectively. Data from NASA-PAH database v2.0.
Download figure:
Standard image High-resolution imageTo further examine the difference in peak wavelengths and strength ratios between the “bay” and “non-bay” C–H bonds, we separate the PAH molecules in Figure 1 into three groups according to their bay% values in Table 1. The three groups correspond to bay percentages of <50%, =50% and >50%, i.e., from low fractions of bay C−H in molecular structure to high. In each of these groups the transitions with pure “bay” and “non-bay” contributions are separated and their corresponding infrared bands are simulated by Drude model at T = 500 K. These profiles are plotted in Figure 8. This figure shows that in all classes the band associated with the stretching modes of “bay” C−H bonds appears at shorter wavelength than “non-bays”. However the wavelength difference between two bands changes in a complex way. It increases from 0.047 μm in <50% bay class to 0.06 μm in >50% bay class. The changes in the bands relative flux values are also not simple. The almost similar values of relative flux values of bay/non-bay bands in PAH molecules with >50% and =50% bay make these two classes indistinguishable. We do not observe any linear correlation in bands flux ratio values with an increase in percentage number of “bay” C−H bonds. The variation of the values of band flux ratio in three different classes of molecules lies within a much narrower interval (0.948-2.809) than the observed range of 0.36–4.36. The only case that the band flux ratio is smaller than 1.00 is the class with <50% bay characteristics. It appears that “bay” and “non-bay” PAH molecules will not be able to reproduce the wide range of ratios as observed.
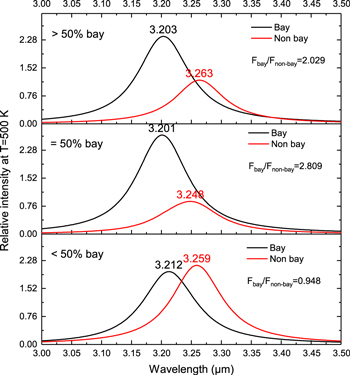
Figure 8. Simulated astronomical 3.3 μm spectra for three groups of PAH molecules with different fractions of bay C–H bonds. The vibrational modes plotted are all uncoupled modes.
Download figure:
Standard image High-resolution imageIn order to test if the observed 3.25–3.3 μm flux ratios can reflect the number ratio of “bay” and “non-bay” PAH sites, we have listed in columns 5 and 6 of Table 1 the band strengths per unit “bay” and “non-bay” C–H bonds (Abay and Anon-bay). These values are calculated from the sum of the intensities (In) of all pure “bay” or “non-bay” transitions in a PAH molecule divided by the total number (Nbay) of “bay” or “non-bay” C–H bonds within the structure. One may expect to infer from the observed intensities (Ibay and Inon-bay) the number ratios between “bay” and “non-bay” C–H bonds from (Ibay/Inon-bay) × (Anon-bay/Abay). The last column of Table 1 lists the calculated Anon-bay/Abay ratios, which turn out to be significantly different from one molecule to another. The variations in the values of Abay, Anon-bay, and Abay/Anon-bay among different PAH molecules are due to the fact that just a certain number of C–H bonds (not all of them simultaneously) participate in the vibrations of each normal mode. As a result, the band strengths cannot be directly linked to the simple number of bay or non-bay sites. Combined with the coupling effect, the profile of the 3.25–3.3 μm feature does not simply reflect the structures of PAH molecules. Because of these complications, it would be simplistic and misleading if one calculates the the number ratios between “bay” and “non-bay” through such an approach.
3.2. Vibrational Analysis of Olefinic sp2 C–H Stretching Mode
In this section, we examine the alternative assumption on the olefinic origin of the 3.28 μm component (Chiar et al. 2013). A group of 62 allyl-aromatic molecules are created by adding one to three H2C = CH−CH2 groups to a PAH molecular core (Figure 2). Each molecule in this set contains three types of C−H bonds: aromatic sp2, aliphatic sp2 (olefinic), and aliphatic sp3 bonds.
A total number of 1248 vibrational normal modes, including infrared and Raman active modes, are analyzed. The contributions of each of these three types of C−H bonds vibrations are plotted against their corresponding wavelengths in Figure 9. We can see that the aliphatic sp3 (top panel) and the aromatic sp2 (bottom panel) C−H stretching vibrations form well-defined bands. However, the olefinic C−H stretching mode (middle panel) forms three separate groups, centering around 3.22, 3.30, and 3.35 μm. The 3.22 and 3.30 μm bands of olefinic C−H vibrations contain pure olefinic C−H bonds vibrations (100% contributions) with zero couplings to either aromatic or aliphatic sp3 C−H stretching modes. We note that parts of these two bands overlap in wavelength with aromatic transitions (bottom panel).
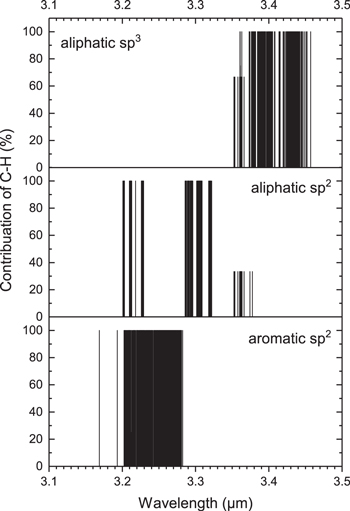
Figure 9. Contributions of aliphatic sp3 (top panel), aliphatic sp2 (olefinic, middle panel), and aromatic (bottom panel) C−H stretching modes in the 3 μm region for molecules 53–114 in Figure 2 and Table 2.
Download figure:
Standard image High-resolution imageThe 3.35 μm band consists of olefinic stretching modes coupled with aliphatic sp3 vibrations. The average contributions of olefinic stretching modes associated to this band is 30%.
The relative contributions from the three different kinds of C–H stretch to an astronomical 3 μm feature are shown in Figure 10. We can see that the olefinic C–H stretch has a blue shoulder that overlaps with the aromatic C–H stretch. Olefinic C−H stretching modes therefore can contribute to the astronomically observed 3.3 μm feature. Among the three stretching modes, the aliphatic C–H stretch is about twice as strong as the aromatic and olefinic C−H modes in these molecules (Figure 10).
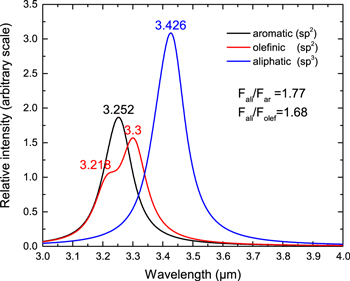
Figure 10. Simulated astronomical spectra in the 3 μm region from purely aromatic, aliphatic sp2 (olefinic), and aliphatic sp3 C−H stretching modes in molecules with mixed aromatic/aliphatic structures (molecules 53–114 in Figure 2 and Table 2). A Drude profile of T = 500 K has been applied to the theoretical data.
Download figure:
Standard image High-resolution image3.3. Mixed Aromatic-aliphatic Structures
Next we study a group of 21 alkyl-PAH molecules with a larger aliphatic component (Figure 3 and Table 3). A single aliphatic branch is added to an aromatic core of multiple rings. Each of these molecules has an equal number of aliphatic and aromatic C−H bonds in their structures. If there is zero degree of coupling between the vibrations of two types of C–H bonds (Figure 9), then the flux ratio of simulated bands in all these structures should follow the intrinsic flux ratio of aliphatic/aromatic calculated in Figure 10.
The simulated infrared spectra of this group of alkyl-PAH molecules are shown in Figure 11. Since the aliphatic C–H stretch has larger intrinsic strength than the aromatic C–H stretch, the 3.4 μm band is more prominent than the 3.3 μm band. In order to produce a relatively stronger 3.3 μm band, the fraction of aromatic/olefinic components must be larger in these molecules.
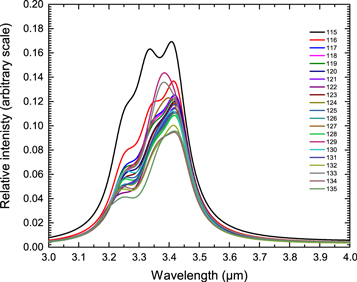
Figure 11. Simulated astronomical spectra in the 3 μm region for alkyl-aromatic molecules (structures 115–135 in Figure 3 and Table 3). A Drude profile of T = 500 K is applied to the theoretical data.
Download figure:
Standard image High-resolution image4. The 3.4 μm Feature
The astronomical 3.4 μm feature is commonly attributed to methyl (−CH3) and methylene (−CH2−) C–H stretching modes in the 3.37−3.51 μm region. This region is subdivided into four segments : anti-symmetric C−H stretching vibration in methyl groups (3.37–3.39 μm), anti-symmetric C−H stretching vibration in methylene groups (3.41–3.43 μm), symmetric C−H stretching in methyl group (3.47–3.50 μm) and symmetric C−H stretching in methylene group (3.49–3.51 μm) (Colthup et al. 1990).
In order to study these vibrations, we have created 20 hydrocarbons (10 linear and 10 branched) with up to 50 carbon atoms (Figure 4 and Table 4). All these molecules are composed of only methyl and methylene groups without any tertiary −CH groups, as in 2-methylpropane. The results of our quantitative analysis on the 594 vibrational modes in these hydrocarbons are presented in Figure 12. The vibrations of methyl and methylene C−H bonds are clearly separated based on their contributions in each normal modes and the type of vibrations (symmetric or anti-symmetric).
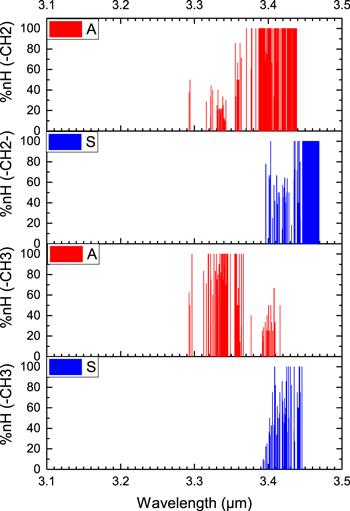
Figure 12. Contributions of symmetric (S, shown in blue) and anti-symmetric (A, shown in red) of methyl (the two bottom panels) and methyelene (the two top panels) C–H stretching vibrations for molecules 136–153 in Figure 4 and Table 4.
Download figure:
Standard image High-resolution imageIt is observed that the couplings between all four types of vibrational motions are significantly large (Figure 12). The most significant coupling occurs at the wavelength range of 3.4–3.44 μm where all types of methyl and methylene vibrations have non-negligible contributions in normal mode vibrations. Only within the narrow range of wavelength between 3.45–3.47 μm are the pure uncoupled vibrations of symmetric C−H stretching of methyelene groups observed (second panel from top in Figure 12). This group of transitions defines the long wavelength boundary of 3.4 μm features.
Figure 13 shows the wavelength peaks of the vibrational modes if the uncoupled transitions (a 100% contribution) are selected for each class of methyl and methylene vibrations. The pattern is in perfect agreement with that of Fox & Martin (1938), where the blue and redshifted boundaries are composed of anti-symmetric C−H stretching mode in methyl and symmetric C−H stretching mode in methylene groups, respectively. Although the four peaks of the symmetric and anti-symmetric stretches of the methyl and methylene groups are clearly separated, they cannot be mapped one-to-one to the astronomically observed 3.4 μm bands at 3.40, 3.46, 3.52, and 3.56 μm (Hrivnak et al. 2007). Since the C–H stretching frequencies (symmetric or anti-symmetric) of methyl and methylene groups do not go beyond 3.5 μm, the observed 3.56 μm (or even the 3.52 μm) feature cannot be due to these vibrational modes.
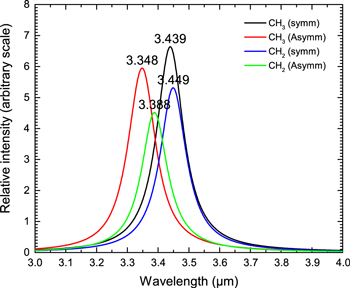
Figure 13. Simulated astronomical spectra of uncoupled methyl and methylene C−H stretching modes in the 3 μm region for molecules 136–153 in Figure 4 and Table 4. A Drude profile of T = 500 K is applied to the theoretical data.
Download figure:
Standard image High-resolution imageThe methyl group vibrations are often characterized by the vibrations of all of its three C−H bonds, which are called “trio” vibrations. In our calculations, we can also observe and separate other subclass vibrations for methyl groups involving only two (“duot”) or one (“solo”) motions of methyl C−H bonds (Figure 14). We can see that the major vibrational characteristics of the methyl’s C−H vibrational modes are trio and duot types of stretching. When the methyl group rotates fast around single C−C bond at high temperatures (above 2.9 kcal.mol−1, Payne & Allen 1977), the C−H stretch of the group is mostly trio.
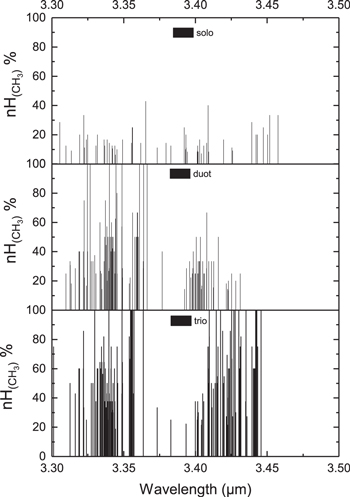
Figure 14. Classification and contributions of different types of vibrational motions of methyl groups in the 3 μm region for molecules 136–153 in Figure 4 and Table 4.
Download figure:
Standard image High-resolution image5. Discussion
In a theoretical study of several pyrene-like and perylene-like PAH molecules with “armchair” edges, Candian et al. (2014) found two strong peaks at 3.23 and 3.26 μm, and attributed them to symmetric stretching of C–H bonds involving duo hydrogens and anti-symmetric stretching of C–H bonds involving duo and trio hydrogens. Our calculations for a large set of molecules show that pure “bay” and “non-bay” C–H stretching modes result in two peaks at 3.20 and 3.26 μm, respectively (Figure 6). This is qualitatively consistent with the finding of Candian et al. (2014) because the PAHs with more C–H bonds involving duo hydrogens have more bay sites (see their Figure 1). Candian et al. (2014) also proposed that the armchair PAHs are responsible for the 12.7 μm band and suggested that there is a correlation between the spatial distributions of the 12.7 μm band and the two components of the 3.3 μm bands. However, our results indicate that the strong coupling of “bay” and “non-bay” vibrations may blur such a correlation.
In principle, less compact PAHs will introduce more bay sites and thus may lead to a rising of the blue part of the 3.3 μm feature. From the observations of the Red Rectangle, Candian et al. (2012) found that the 3.3 μm feature exhibits a rising blue part with an increasing distance from the central star, and they attributed this to the growth of PAHs by adding C4H2 entities. However, this correlation cannot be easily interpreted due to the nonlinear relation between 3.2 μm/3.26 μm intensity ratios and the bay/non-bay number ratios.
Our results show that the theoretical peaks of both “bay” and “non-bay” C–H stretching modes are located in shorter wavelengths than the observed 3.3 μm band. In contrast, the olefinic C–H vibration shows a strong peak at 3.3 μm, while the aromatic C–H vibration manifests itself as a blue shoulder (Figures 10 and 11). It seems more reasonable to hypothesize that in astronomical spectra, the red part of this feature originate from olefinic C–H bond while the blue wing mainly from aromatic C–H bond (with minor contribution from olefinic one).
Because the olefinic and aromatic vibrations are decoupled, the intensity ratio of the two components directly reflects their corresponding C–H number ratios. If the aromatic/olefinc hypothesis holds, then the rising blue wing’s increasing offset from the center of the Red Rectangle Nebula would indicate that the UV photons in the interstellar medium are processing the olefinic component into a more stable aromatic ring. The high 3.3 μm/3.4 μm intensity ratio detected in many astronomical sources (e.g., Yang et al. 2013) may suggest that the UIE carrier has significant olefinic components.
6. Conclusions
In this paper, we have investigated in detail the origin of the UIE bands in the 3.3–3.4 μm region with quantum chemistry calculations. Possible contributions from aromatic sp2, aliphatic sp2 (olefinic), and aliphatic sp3 C–H stretches to the observed bands are studied. Many of these vibrational modes show a significant degree of coupling, so the interpretation of astronomical spectra in this spectral region is not as straight forward as commonly believed.
We confirm that aromatic C−H bonds in the form of a “bay” vibrate at shorter wavelengths than “non-bay” C−H. However, the difference is ∼0.05 μm, which is larger than the astronomical peak separation of 0.02 μm between the 3.28 and 3.30 μm features. Furthermore, the strength ratios of the “bay” and “non-bay” bands do not correlate in a simple way with the number of bay C−H bonds. In many instances, the “bay” and “non-bay” vibrations are coupled, so the 3.28 and the 3.30 μm UIE bands cannot be unambiguously identified as “bay” and “non-bay” C–H stretching from PAH molecules.
We propose to assign the 3.30 μm feature to an olefinic C–H stretch while keeping the assignment of the 3.28 μm feature as an aromatic C–H stretch. Since the olefinic and aromatic vibrations are intrinsically uncoupled, the ratio of the 3.28 and 3.30 μm bands could in principle be used to determine the fractions of olefinic groups in the molecule (Figure 10).
In the 3.4 μm region, we show that the uncoupled C−H stretching modes of methyl and methylene functional groups can explain the observed features in this region. However, the reality is more complicated as there are quite extensive couplings between these modes. While there is no doubt that the astronomical 3.4 μm bands are aliphatic C–H stretches, we cannot assign exact identifications to the observed 3.40, 3.46, 3.52, and 3.56 μm features. A definite conclusion one can draw is that the 3.56 μm feature cannot be due to a pure C–H bond and probably involved an element other than C and H (e.g., an aldehyde group).
Although we have extended the vibrational analysis beyond purely aromatic molecules to molecules with aliphatic components, we note that the molecules considered are still quite simple. We have yet to explore complex organic compounds similar to those of HAC or QCC. As the size increases and the geometry gets more complex, it is possible that a different qualitative spectral pattern may emerge. We will continue to investigate molecules with more complex structures as well as those that contain other elements beyond carbon and hydrogen.
The Laboratory for Space Research was established by a special grant from the University Development Fund of the University of Hong Kong. This work is also partially supported by grants from the HKRGC (HKU 7027/11P and HKU7062/13P).
Software: Gaussian 09 (C.01; Frisch et al. 2009), PQS (v4.0), Chemcraft, Vibanalysis (V2.0; Sadjadi et al. 2015a).
Footnotes
- 6
PQS version 4.0, Parallel Quantum Solutions, 2013 Green Acres Road, Fayetteville, Arkansas 72703, USA URL: http://www.pqs-chem.com, Email: sales@pqs-chem.com: Parallel Quantum Solutions.
- 7