Abstract
The optical-ultraviolet transient AT 2021loi is located at the center of its host galaxy. Its spectral features identify it as a member of the Bowen fluorescence flare (BFF) class. The first member of this class was considered to be related to a tidal disruption event, but enhanced accretion onto an already active supermassive black hole was suggested as an alternative explanation. Having occurred in a previously known unobscured active galactic nucleus, AT 2021loi strengthens the latter interpretation. Its light curve is similar to those of previous BFFs, showing a rebrightening approximately 1 yr after the main peak (which was not explicitly identified but might be the case in all previous BFFs). An emission feature around 4680 Å, seen in the preflare spectrum, strengthens by a factor of ∼2 around the optical peak of the flare and is clearly seen as a double-peaked feature then, suggesting a blend of N iiiλ4640 with He iiλ4686 as its origin. The appearance of O iiiλ3133 and possible N iiiλλ4097, 4103 (blended with Hδ) during the flare further support a Bowen fluorescence classification. Here we present ZTF, ATLAS, Keck, Las Cumbres Observatory, NEOWISE-R, Swift AMI, and Very Large Array observations of AT 2021loi, making it one of the best-observed BFFs to date. It thus provides some clarity on the nature of BFFs but also further demonstrates the diversity of nuclear transients.
Original content from this work may be used under the terms of the Creative Commons Attribution 4.0 licence. Any further distribution of this work must maintain attribution to the author(s) and the title of the work, journal citation and DOI.
1. Introduction
Actively accreting supermassive black holes (SMBHs), commonly referred to as active galactic nuclei (AGNs), exhibit variable emission across the electromagnetic spectrum (Fahlman & Ulrych 1975; Clavel et al. 1991; Peterson et al. 1994) and over a wide range of timescales. This “normal” AGN variability is stochastic and varies from a few percent (over weeks) up to ∼20% (over decades; e.g., MacLeod et al. 2012a). Various models, motivated by accretion theory and the observed variability phenomenology, have been proposed to explain this stochastic optical/UV variability. These include accretion disk instabilities, microlensing, X-ray reprocessing of disk thermal emission, and changes in the accretion rate (see, e.g., Krolik et al. 1991; Hawkins 1993; Kawaguchi et al. 1998; Pereyra et al. 2006; Dexter & Agol 2011; Ruan et al. 2014; Caplar et al. 2017, and references therein).
Recently, more extreme optical variability has been identified in a number of AGNs where the optical/UV brightness varies by a few magnitudes in relatively short timescales (∼few months; e.g., Graham et al. 2017, 2020; Rumbaugh et al. 2018; Cannizzaro et al. 2020; see also Lawrence 2018, and references therein). In addition, there are AGNs where the change in brightness is also associated with spectral transitions, i.e., the continuum emission becoming bluer or redder. Rarely, more significant spectral (and related classification) transitions are seen with the appearance or disappearance of the blue continuum and/or broad-line emission that is typical of persistent, broad-line (unobscured) AGNs. The latter type of event is commonly referred to as a changing-look AGN (e.g., LaMassa et al. 2015; MacLeod et al. 2019; Trakhtenbrot et al. 2019a; Ricci & Trakhtenbrot 2022). 14
Among the various types of SMBH accretion events that show a large increase in optical/UV flux, Trakhtenbrot et al. (2019b) identified a new class of flares, originally consisting of a brightening event in the ULIRG F01004–2237 (Tadhunter et al. 2017) and the transients AT 2017bgt (Trakhtenbrot et al. 2019b) and OGLE 17aaj (Gromadzki et al. 2019). All of these events were long-lasting, unlike other SMBH-related transients such as tidal disruption events (TDEs; Rees 1988; Gezari et al. 2012; Arcavi et al. 2014; van Velzen et al. 2020; Gezari 2021). During the flare, the spectra of the Trakhtenbrot et al. (2019b) class display emission lines typical of broad-line, unobscured AGNs. Importantly, they also exhibit N iii λ4640 and O iii λ3133 emission lines, which are not generally seen in AGNs (e.g., Vanden Berk et al. 2001) but are produced by Bowen fluorescence (BF; Bowen 1928) in high-velocity (a few thousand kilometers per second) and dense gas in the vicinity of the accreting SMBH, as proposed several decades ago by Netzer et al. (1985). Hereafter, we refer to this class of events as “Bowen fluorescence flares,” or BFFs.
In the BF mechanism, He ii Lyα photons can either escape, ionize neutral H or He, or be absorbed by O iii at 303.693 or 303.799 Å. These ions are then de-excited through a series of transitions, producing O iii optical lines at 3047, 3133, 3312, 3341, 3444, and 3760 Å, as well as a prominent far-UV (FUV) transition at 374.436 Å. This latter transition can be reabsorbed by ground-state N iii, which can then produce emission lines at 4097, 4104, 4379, 4634, and 4641 Å. The presence of strong Bowen lines is thus an indicator of extreme ultraviolet (EUV; down to 100 Å) radiation, and their observed widths associate them with the broad-line region (BLR). An accretion origin could explain both the Bowen lines and perhaps the optical luminosity of these events.
The BF lines have been identified in other SMBH-related transients as well. Blagorodnova et al. (2017) and Leloudas et al. (2019) identified BF lines in the spectra of optical TDEs. Malyali et al. (2021) found BF lines in the peculiar nuclear transient AT 2019avd, which was associated with an extreme X-ray flare. Frederick et al. (2021) found BF lines in optical transients occurring in narrow-line Seyfert 1 galaxies (NLSy1s) and suggested that three of these events (AT 2019pev, AT 2019avd, and AT 2019brs) are BFFs. It is currently not yet clear which properties of the SMBHs, their (variable) accretion flows, and/or their circumnuclear gas environments give rise to transient BF emission.
Here we report optical, UV, X-ray, and radio observations of AT 2021loi, a new member of the BFF class. This object is unique because, to our knowledge, it is the only BFF so far to occur in a previously known broad-line AGN. In addition, it presents the strongest evidence among sources of this class (to date) for a significant rebrightening, roughly 1 yr after its main peak.
This paper is structured as follows. In Sections 2 and 3, we report the discovery and detail the observations, and in Section 4, we present the results of our analysis. In Section 5, we discuss the possible nature of AT 2021loi, and we conclude in Section 6. We adopt a flat ΛCDM cosmology throughout, with H0 = 70 km s−1 Mpc−1, ΩM = 0.3, and ΩΛ = 0.7. All magnitudes are reported in the AB system (Oke 1974), and all wavelengths are in the rest frame unless otherwise stated.
2. Discovery
An optical brightening at the center of the z = 0.083 active galaxy WISEA J010039.62+394230.3 was discovered in Zwicky Transient Facility (ZTF) public survey data as ZTF 20aanxcpf on 2021 May 7 (MJD = 59,341.49; UT used throughout) by Munoz-Arancibia et al. (2021) using the ALeRCE broker (Förster et al. 2021). The brightening was reported with an r-band reference-subtracted 15 discovery magnitude of 18.84 ± 0.15 mag at R.A. 22:11:21.93, decl. +39:42:30.31 (J2000).
The event was classified by Graham et al. (2021) on 2021 June 11 (close to the optical peak on 2021 June 22) as a BFF related to enhanced accretion around an SMBH, based on a spectrum with the Low-Resolution Imaging Spectrograph (LRIS; Oke et al. 1995) on Keck I that shows broad Balmer emission lines consistent with an NLSy1 but also He ii λ4686, N iii λ4640, and O iii at 3133 and 3444 Å emission, not seen in an archival Large Sky Area Multi-Object Fiber Spectroscopic Telescope (LAMOST) spectrum of the source (see Section 3.2).
3. Observations
We collected follow-up observations of AT 2021loi with various facilities as detailed below.
3.1. Photometry
3.1.1. Optical, MIR, and UV
We retrieved point-spread function (PSF)–fit photometry of reference-subtracted images from the ZTF forced photometry service 16 from MJD = 58,194 to MJD = 59,975 and the Asteroid Terrestrial-impact Last Alert System (ATLAS; Tonry et al. 2018) forced photometry service 17 from MJD = 57,232 to MJD = 59,975 at the position of AT 2021loi. We find no signs of strong variability in the years preceding the flare (Figure 1).
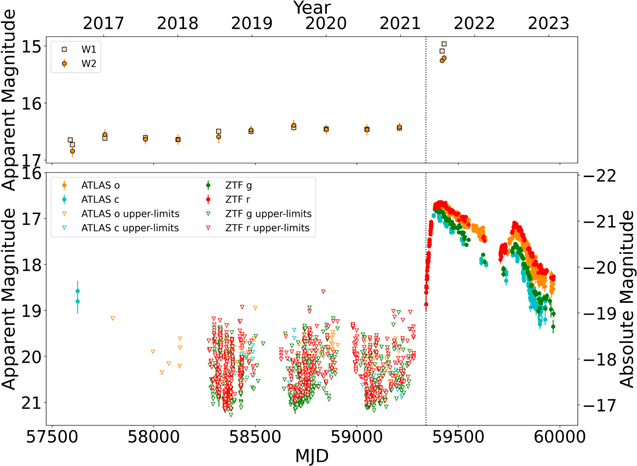
Figure 1. Top: NEOWISE-R W1 and W2 light curves at the position of AT 2021loi (not reference-subtracted). The light curves show a few tenths of a magnitude of variability prior to the optical outburst. Following the optical outburst, the MIR flux increased by >1.5 mag, as seen in both NEOWISE-R bands. Bottom: long-term (∼4 yr ), reference-subtracted, optical (ZTF g and r bands, ATLAS c and o bands) light curves of WISEA J010039.62+394230.3, which shows no significant variability above the nondetection 5σ upper limits. A real detection from ATLAS several years ago could correspond to a standard higher-amplitude variability event of the unobscured AGN and is much lower than the recent flare. The vertical dotted line in both panels indicates the date of discovery of the optical outburst (2021 May 7; MJD 59,341). All magnitudes in this and the following figures are in the AB system.
Download figure:
Standard image High-resolution imageWe also obtained optical photometry in the gri bands starting on 2021 July 1 with the Las Cumbres Observatory network of 1 m telescopes (Brown et al. 2013). As there are no available pretransient Las Cumbres images of AT 2021loi, and it has yet to fade, we use Sloan Digital Sky Survey (SDSS; York et al. 2000) reference images obtained on 2006 October 6 for all three bands. We used lcogtsnpipe 18 (Valenti et al. 2016) in order to process the Las Cumbres data. The pipeline is used to generate the PSF for the Las Cumbres images and the SDSS reference images. After that, the pipeline uses an implementation of the High Order Transform of PSF ANd Template Subtraction (hotpants; Becker 2015) to perform image subtraction. We performed aperture photometry at the source position because we find that, for the Las Cumbres data, PSF fitting produces varying residuals in the image after subtracting the PSF model. There is a noticeable difference between the ZTF and Las Cumbres r-band measurements, where the latter appears to be fainter (Figure 2). This difference is likely due to the difference in the transmission profiles of the two r filters. In Figure 3, we demonstrate this difference using an example optical spectrum of AT 2021loi along with the two r-band filter transmission functions. 19 , 20 While the ZTF filter encompasses the observed broad Hα emission line of AT 2021loi, the Las Cumbres filter does not, thus explaining why more flux is observed in ZTF r versus Las Cumbres r.
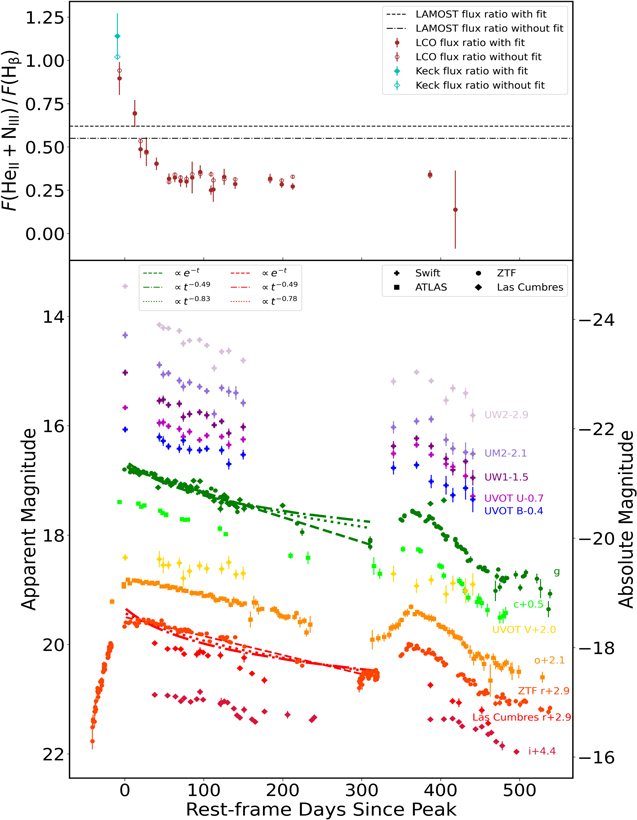
Figure 2. Bottom: optical and UV light curves obtained with ZTF, ATLAS, Las Cumbres, and Swift/UVOT. The ATLAS photometry is binned in 4 day time spans. Swift U, B, and V magnitudes are not reference-subtracted. We present two power-law fits, one with free t0 (dotted lines) and one with t0 fixed to the date of discovery (dashed–dotted lines), as well as an exponential fit to the ZTF g- and r-band data. The best-fit power laws are shallower than the power law expected for TDEs, i.e., t−5/3. Top: evolution of the relative flux of the spectral region that combines He ii λ4686 and N iii λ4640 to the flux of Hβ with and without Gaussian modeling of the emission lines.
Download figure:
Standard image High-resolution image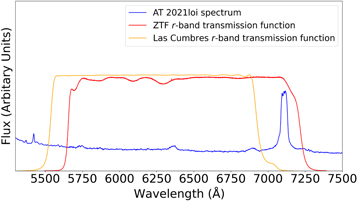
Figure 3. One of the optical spectra of AT 2021loi plotted along with the ZTF and Las Cumbres r-band throughputs. The throughputs have been scaled for visualization purposes. Given the redshift of AT 2021loi (z = 0.083), the ZTF r band includes the Hα line, while the Las Cumbres one does not. This can obviously affect the corresponding flux measurements and account for the discrepancies between the corresponding light curves.
Download figure:
Standard image High-resolution imageThe location of AT 2021loi was repeatedly observed in the mid-infrared (MIR) regime by the Wide-Field Infrared Survey Explorer (WISE; Wright et al. 2010) and its extensions, NEOWISE (Mainzer et al. 2011) and the NEOWISE reactivation mission survey (NEOWISE-R; Mainzer et al. 2014). The measurements were conducted in both the W1 and W2 bands (3.4 and 4.6 μm, respectively). We queried the NASA/IPAC Infrared Science Archive 21 for MIR detections within 5″ from the ZTF-determined position of AT 2021loi. This position was visited roughly twice a year by NEOWISE-R (changes in the scanning pattern may result in more observations like in this case, where there are two measurements within a few days in 2016 and 2021). We rebinned the measurements available for each such visit (using a weighted mean) into a single representative measurement per year per band. The resulting MIR light curve 22 is shown in Figure 1 (top panel). Prior to the optical outburst, the MIR flux shows limited variability of up to a few tenths of a magnitude. Fitting a linear magnitude-versus-time model to the preflare data (MJD ≤ 59,210) yields a rate of change of 0.067 ± 0.013 mag yr−1. The first MIR visit to show a dramatic flux increase (>1.5 mag in both MIR bands) is indeed the first measurement taken after the optical outburst on 2021 July 22, i.e., ∼70 days after the initial optical detection of the transient and ∼30 days after the peak optical emission.
The earliest available WISE-based measurements associated with the source hosting AT 2021loi (obtained through the AllWISE catalog; Cutri et al. 2021), using coadded images taken during 2010 December 11 to 2011 January 17, yield a MIR color of W1 − W2 = 0.08 mag. The average MIR color during the period 2014 January 18 to 2020 December 31 probed by NEOWISE-R, i.e., the ∼7 yr prior to the optical outburst (part of it, ∼4.5 PSF, is shown in Figure 1), is W1 − W2 = 0.02 mag. These MIR colors are consistent with the emission being related to an AGN, typically defined at W1 − W2 ≳ 0.06 mag in the AB system (e.g., Stern et al. 2012; Assef et al. 2018).
We initiated near-UV (NUV) follow-up observations (PI: L. Makrygianni) with the Neil Gehrels Swift Observatory (Gehrels et al. 2004) Optical/UV Telescope (UVOT; Roming et al. 2005). We obtained 23 Swift epochs from 2021 June 21 to 2022 October 11 in all six UVOT filters (uvw2, uvm2, uvw1, U, B, and V). The UVOT photometry was extracted using the HEASARC pipeline and the standard analysis task uvotsource. We used a circular aperture with a radius of 75 for all UV photometry, partially motivated by our desire to compare the postflare measurements to archival Galaxy Evolution Explorer (GALEX) photometry (see below). For the longer-wavelength bands, we use smaller apertures with radii of 5″ (for the U and B bands) and 4″ (for the V band).
23
In all cases, a nearby circular region with a radius of 7
5 was used for background extraction. We used the archival NUV flux measurement from GALEX observations taken on 2006 November 9, obtained with a 7
5 radius aperture, yielding mNUV = 20.05 ± 0.14 mag (Seibert et al. 2012).
Preflare photometry of WISEA J010039.62+394230.3 is presented in Table 1. For AT 2021loi, all photometry was corrected for Milky Way extinction using E(B − V) = 0.045 mag (Schlafly & Finkbeiner 2011), 24 the Cardelli et al. (1989) extinction law, and RV = 3.1. Our photometry is presented in Figure 1, the bottom panel of Figure 2, and Table 2.
Table 1. Preflare Photometry of WISEA J010039.62+394230.3
| Filter | Magnitude | Error | Source |
|---|---|---|---|
| FUV | 19.86 | 0.21 | GALEX |
| NUV | 20.05 | 0.14 | GALEX |
| u | 18.55 | 0.02 | SDSS |
| g | 17.91 | 0.01 | SDSS |
| r | 17.43 | 0.01 | SDSS |
| i | 17.00 | 0.01 | SDSS |
| z | 16.85 | 0.01 | SDSS |
| W1 | 16.34 | 0.03 | WISE |
| W2 | 16.26 | 0.03 | WISE |
Note. Photometry is in the AB system. No extinction correction applied.
Download table as: ASCIITypeset image
Table 2. Photometry of AT 2021loi
| MJD | Filter | Magnitude | Error | Source |
|---|---|---|---|---|
| 59,341.49 | r | 18.99 | 0.15 | ZTF |
| 59,341.49 | r | 18.73 | 0.14 | ZTF |
| 59,342.49 | r | 18.63 | 0.08 | ZTF |
| 59,342.49 | r | 18.59 | 0.09 | ZTF |
| 59,344.49 | r | 18.45 | 0.08 | ZTF |
| 59,344.49 | r | 18.63 | 0.11 | ZTF |
| 59,345.48 | r | 18.45 | 0.08 | ZTF |
| 59,345.49 | r | 18.36 | 0.08 | ZTF |
| 59,345.49 | r | 18.38 | 0.08 | ZTF |
| ... | ... | ... | ... | ... |
| 59,385.39 | r | 16.89 | 0.02 | ZTF |
| 59,387.44 | r | 16.82 | 0.01 | ZTF |
| 59,391.41 | r | 16.83 | 0.02 | ZTF |
| 59,393.45 | r | 16.80 | 0.01 | ZTF |
| 59,399.39 | r | 16.83 | 0.02 | ZTF |
| 59,401.44 | r | 16.86 | 0.01 | ZTF |
| 59,403.43 | r | 16.77 | 0.01 | ZTF |
| 59,405.43 | r | 16.82 | 0.01 | ZTF |
| ... | ... | ... | ... | ... |
| 59,428.20 | g | 17.64 | 0.01 | Las Cumbres |
| 59,444.40 | g | 17.33 | 0.03 | Las Cumbres |
| 59,450.10 | g | 17.24 | 0.02 | Las Cumbres |
| 59,461.20 | g | 17.33 | 0.02 | Las Cumbres |
| 59,469.40 | g | 17.69 | 0.01 | Las Cumbres |
Note. Photometry is in the AB system. This table is published in its entirety in machine-readable format. A portion is shown here for guidance regarding its form and content.
Only a portion of this table is shown here to demonstrate its form and content. A machine-readable version of the full table is available.
Download table as: DataTypeset image
3.1.2. X-Ray and Radio
The X-ray observations with the X-Ray Telescope (XRT; Burrows et al. 2005) on Swift were obtained simultaneously with the UVOT observations. Using XIMAGE to process the Swift/XRT images, we find no significant X-ray detection down to 3σ at the position of AT 2021loi. We then use XIMAGE to calculate the corresponding flux upper limits for each of the XRT epochs using a circular aperture with a radius of ∼47″ centered on the (optical) position of AT 2021loi (we verify that no neighboring X-ray sources are detected within that aperture). The 3σ upper limits on the X-ray flux are between 0.006 and 0.02 counts s−1 for the standard 0.2–10 keV XRT energy range. We use these to calculate the 2–10 keV flux upper limits using WebPIMMS 25 assuming a power-law photon index of Γ = 1.8, which is typical of low-redshift AGNs (e.g., Ricci et al. 2017). The upper limits we derive are in the range F(2–10 keV) = (1.4–4.6) × 10−13 erg cm−2 s−1. Given the source redshift, these translate to luminosity upper limits of L(2–10 keV) < (2.4–7.8) × 1042 erg s−1.
We also initiated radio measurements with the Arcminute Microkelvin Imager-Large Array (AMI-LA; Zwart et al. 2008; Hickish et al. 2018) and the Karl G. Jansky Very Large Array (VLA). The AMI-LA is a radio interferometer comprised of eight 12.8 m diameter antennas producing 28 baselines that extend from 18 m up to 110 m in length and operate with a 5 GHz bandwidth divided into eight channels around a central frequency of 15.5 GHz. Object AT 2021loi was first observed in the radio regime at 15.5 GHz with the AMI-LA on 2021 June 15, i.e., 39 days after optical discovery, but it was not detected. The AMI-LA follow-up in the same band out to 413 days after optical discovery also resulted in nondetections. The AMI-LA observations were reduced using a customized AMI-LA data reduction software package (Perrott et al. 2013), and the 3σ flux density upper limits are in the range of 0.10–0.21 mJy, which corresponds to radio luminosity limits of ν Lν (15.5 GHz) < (2.6–5.6) × 1038 erg s−1.
We observed the field of AT 2021loi with the VLA on 2021 December 1, i.e., 208 days after the initial optical detection. Images were produced using the CASA (McMullin et al. 2007) task CLEAN in interactive mode. While our S-band (3 GHz) image shows no source above the 3σ rms limit (0.096 mJy), the C- and X-band images (5 and 10 GHz, respectively) show a source at the phase center, which we fit with the CASA task IMFIT. We estimate the peak flux density error to be a quadratic sum of the error produced by the CASA task IMFIT and an additional 10% calibration error. The flux densities at 5 and 10 GHz correspond to 0.0578 ± 0.0071 and 0.0655 ± 0.0087 mJy, respectively. These, in turn, translate to radio luminosities of ν Lν (5 GHz) = (4.9 ± 0.6) × 1037 and ν Lν (10 GHz) = (1.1 ± 0.2) × 1037 erg s−1. Therefore, the new VLA detections correspond to a relatively weak compact radio source with a somewhat flat spectrum and are consistent with a normal (persistent) radio-quiet AGN (e.g., Panessa et al. 2019). Given the radio data in hand and previous studies (e.g., Smith et al. 2020, and references therein) of the correlation between radio and X-ray luminosity in AGNs, we find that the radio limits and faint detections are in agreement with the upper limits for the X-ray luminosity from Swift.
Object AT 2021loi is not detected in archival (NRAO 26 VLA Sky Survey; Condon et al. 1998) radio survey data, which are complete only down to (roughly) 2.5 mJy at 1.4 GHz, and it is outside the footprint of the (slightly) more sensitive Faint Images of the Radio Sky at Twenty cm (Becker et al. 1994) survey. Thus, we cannot say whether the new VLA detections probe an enhanced, dimmed, or persistent radio emission.
3.2. Optical Spectroscopy
We retrieved an archival spectrum of WISEA J010039.62+394230.3, the host galaxy of AT 2021loi, from the fifth data release of the LAMOST survey (LAMOST/DR5; Zhao et al. 2012) obtained on 2013 December 22. 27 The LAMOST spectrum covers the range 3500–9000 Å with a resolution of R = 1800. The archival spectrum shows AGN features, in particular prominent broad Balmer emission lines and strong narrow [O iii] λ5007.
The classification spectrum of AT 2021loi (Graham et al. 2021) was obtained with the LRIS on Keck I, which covers the wavelength range between 3400 and 10300 Å with a resolution of R = 600–1000, on 2021 June 7. This spectrum is shown in Figure 4, together with the archival LAMOST spectrum. In addition, Figure 14 shows the two spectra normalized in a way that would yield a common integrated [O iii] λ5007 line flux level to further emphasize the changes in the continuum and broad-line emission (see Appendix A).
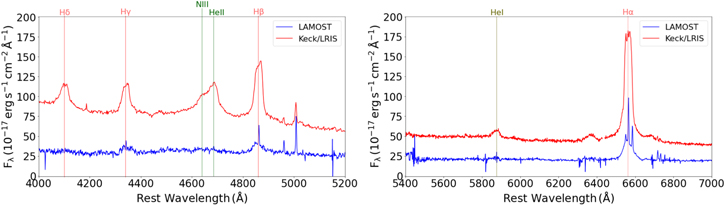
Figure 4. Comparison of the observed archival LAMOST spectrum and the raw Keck/LRIS classification spectrum. We present the regions around the Hβ (left) and Hα (right) lines. We see a clear appearance of a feature around 4680 Å in the Keck spectrum, which we interpret as BF, as well as the clear appearance of the Hδ line. We also find that there is enhanced emission for He i at ∼5875 Å. There are also significant signs of enhanced emission at ∼6375 Å, which corresponds to the higher-ionization coronal line Fe x λ6375.
Download figure:
Standard image High-resolution imageWe initiated a spectroscopic monitoring campaign for AT 2021loi using the FLOYDS spectrograph (Sand et al. 2011) mounted on the robotic 2 m telescope at Haleakalā Hawaii (which is also part of the Las Cumbres Observatory network). During the 16 months of spectroscopic monitoring, we obtained 20 spectra. FLOYDS covers the 3500–10000 Å range in a single exposure by capturing two spectral orders simultaneously, yielding a spectral resolution of R ∼ 400. The exposure time of the spectra varies between 1500 and 1800 s, and we have used a slit width of 2″.
The Las Cumbres Observatory spectra were reduced with a custom data reduction pipeline 28 built with the iraf-free python-based aspired tool kit 29 (Lam & Smith 2022; Lam et al. 2023). The spectral images were each cropped into a red and a blue image. Standard data reduction procedures were applied to trace and then optimally extract the spectral information using the Horne (1986) algorithm. Wavelength calibration was performed using the built-in calibrator powered by rascal 30 (Veitch-Michaelis & Lam 2020, 2021). Standard stars from the same night were used for flux calibration when available; otherwise, the ones observed closest in time to the science observations were used. Finally, atmospheric extinction and telluric absorption were removed. We present all spectra in Figure 5.
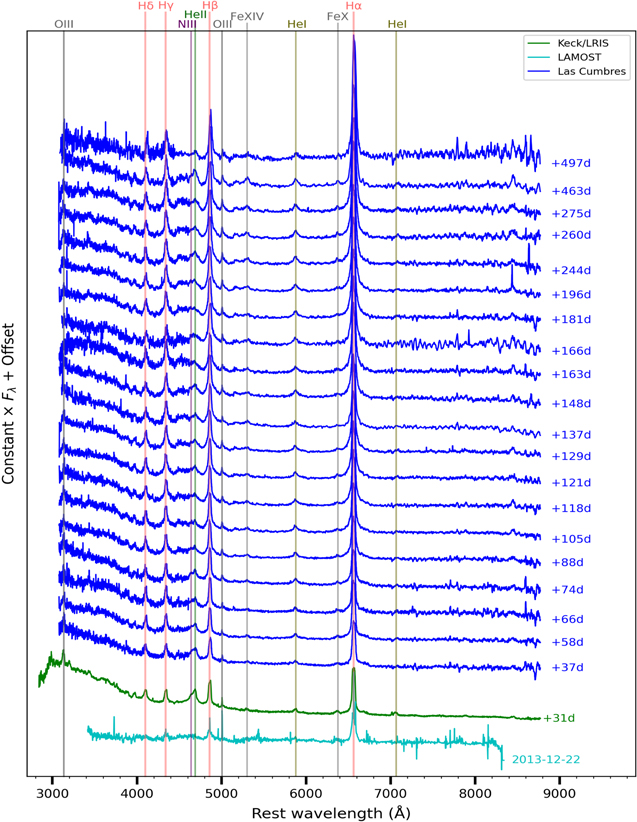
Figure 5. Spectral sequence of AT 2021loi together with the LAMOST preflare spectrum. Phases are noted in observed days from discovery. Emission features persisting for over a year include broad Balmer lines, a feature around 4680 Å, and He i emission at 5875 Å. We also see strong, persistent O iii emission at 3133 Å for at least 4 months after the transient detection.
Download figure:
Standard image High-resolution imageBasic details regarding all of the optical spectra of AT 2021loi used in this work are provided in Table 4 (in Appendix B), along with key spectral measurements (see Section 4.2).
4. Analysis
4.1. Photometric Evolution
The optical brightness of AT 2021loi increased by a factor of ≈4 between 2021 May 7 (first detection by ZTF) and 2021 June 22, from the initial Mr
= −19.04 ± 0.15 mag to peak magnitudes of Mr
= −21.08 ± 0.03 and Mg
= −20.98 ± 0.04 mag (all reference-subtracted). The latter corresponds to ν
Lν
(g) ≃ 7.8 × 1043 erg s−1. Following the peak, the optical light curve shows a slow, steady decline until 2022 mid-June (Figure 2). We fit the decline phase between the main peak and the rebrightening phase (59,386 < MJD < 59,750) with a power law of the form  . We find a power-law slope of α ≃ −0.48 if we fix the value of t0 to the discovery time of the optical flare, and α ≃ −0.78 if we let t0 (which yields t0 = 59253 ± 40) be a free parameter, with formal uncertainties of ≈0.01 and 0.1, respectively. The reduced χ2 in both cases is ≈25, which shows that a power-law model does not provide a good fit for our data. In any case, the declining phase and the best-fit power laws are much shallower than the α = −5/3 associated with TDEs (e.g., Rees 1988), and, as we found, a power law does not provide a good fit to the data (especially for the r band; Figure 2). After 2022 mid-June, AT 2021loi experiences a rebrightening and shows a second peak in the ZTF r band at Mr
= −20.59 ± 0.05 mag on 2022 July 15, about 390 days after the main peak. This second peak is also seen in the ZTF g and ATLAS o and c bands. An observational gap did not allow the Las Cumbres gri bands to cover the rebrightening. The decline after the second peak, although faster (α ≃ −0.9, r band), is still very different from that of a TDE.
. We find a power-law slope of α ≃ −0.48 if we fix the value of t0 to the discovery time of the optical flare, and α ≃ −0.78 if we let t0 (which yields t0 = 59253 ± 40) be a free parameter, with formal uncertainties of ≈0.01 and 0.1, respectively. The reduced χ2 in both cases is ≈25, which shows that a power-law model does not provide a good fit for our data. In any case, the declining phase and the best-fit power laws are much shallower than the α = −5/3 associated with TDEs (e.g., Rees 1988), and, as we found, a power law does not provide a good fit to the data (especially for the r band; Figure 2). After 2022 mid-June, AT 2021loi experiences a rebrightening and shows a second peak in the ZTF r band at Mr
= −20.59 ± 0.05 mag on 2022 July 15, about 390 days after the main peak. This second peak is also seen in the ZTF g and ATLAS o and c bands. An observational gap did not allow the Las Cumbres gri bands to cover the rebrightening. The decline after the second peak, although faster (α ≃ −0.9, r band), is still very different from that of a TDE.
We compare the uvm2 UVOT observations to the archival GALEX (NUV; λeff = 2304 Å) data, as uvm2 (λeff = 2245 Å) is the most relevant UVOT filter for such a comparison. In the first UVOT observation, which also resulted in the highest NUV flux we obtained during our monitoring campaign, we measure a uvm2 absolute magnitude of Muvm2 = −21.06 ± 0.07 mag, which corresponds to ν L ν(NUV) = 2.3 × 1044 erg s−1. This is a factor of ∼20 increase from the archival GALEX detection, where MNUV = −17.84 ± 0.14 mag translates to ν Lν (UV) = 1.1 × 1043 erg s−1. Following this measurement, the NUV flux shows a gradual decline before the rebrightening mentioned above. The monochromatic NUV luminosity we measure ∼14 months after the initial transient detection (and 1 yr after the initial Swift detection) is ν Lν ≃ 5.7 × 1043 erg s−1, i.e., a drop of ∼75% but still higher than the archival GALEX measurement by a factor of ∼5.
As already mentioned in Section 3.1.1, the MIR light curves (Figure 1, top panel) show limited variability prior to the optical flare and a noticeable flux increase in the first MIR measurement that follows the optical flare. This enhanced MIR emission is separated by at most ∼64 days from the detection of the optical outburst, or ∼30 days compared with the peak optical emission (both in the rest frame). These timescales are mere upper limits on the real delay, driven by the (low) cadence of the NEOWISE-R monitoring. To put these timescales in context, we note that the inner edge of the dusty torus, i.e., where the temperature reaches the sublimation threshold, is expected to be ∼100–300 lt-days away from the central engine based on our near-peak Lbol estimate for AT 2021loi. This range is driven by the range in possible dust grains (see Equations (2) and (3) in Mor et al. 2009) and is supported by NIR reverberation mapping campaigns (e.g., Suganuma et al. 2006; Koshida et al. 2014).
We can thus infer that, given the data in hand, the increase in MIR emission is broadly consistent with the reprocessing of the (sharp) rise in UV/optical radiation by circumnuclear dust in a way that is not markedly different from what is seen in normal (persistent) AGNs. From the NEOWISE-R light curves, there is also some variability in the W1 − W2 color, which changes from around 0.02 mag prior to the outburst to ∼−0.24 mag during the transient state. While the former, preoutburst MIR color is close to the cut used to identify AGNs (i.e., ≳0.06 mag in the AB system), the latter postflare color is, in fact, less consistent with what is found for persistent AGNs. This may not be surprising given the possibility that the emission from either the exceptionally UV-bright flare and/or the hottest, pure graphite part of the torus is enhancing the shorter-wavelength W1 band (i.e., relative to normal AGNs).
There is no ROSAT counterpart to WISEA J010039.62+394230.3 in the all-sky survey conducted during 1990–1991. From this, we infer an archival 3σ X-ray upper limit of F(0.1–2.4 keV) ≲ 10−13 erg cm−2 s−1 (Boller et al. 2016), which translates to L(0.1–2.4 keV) ≲ 2 × 1042 erg s−1 but also L(2–10 keV) ≲ 2.5 × 1042 erg s−1. In order to compare this archival ROSAT upper limit with the postflare XRT upper limits described in Section 3.1.2, we utilize the observed relation between X-ray and NUV emission in persistent AGNs, which is commonly quantified through the anticorrelation between the optical–to–X-ray spectral slope, ![${\alpha }_{{\rm\small{}}\mathrm{ox}}\equiv \mathrm{log}({f}_{\nu }[2\,\mathrm{keV}]/{f}_{\nu }[2500\,\mathring{\rm{A}} ])/\mathrm{log}(\nu [2\,\mathrm{keV}]/\nu [2500\,\mathring{\rm{A}} ])$](https://content.cld.iop.org/journals/0004-637X/953/1/32/revision1/apjace1eeieqn2.gif) , and the monochromatic NUV luminosity (see, e.g., Just et al. 2007; Lusso & Risaliti 2016; Nanni et al. 2017, and references therein).
, and the monochromatic NUV luminosity (see, e.g., Just et al. 2007; Lusso & Risaliti 2016; Nanni et al. 2017, and references therein).
Specifically, we rely on the relation derived in Equation (2) of Nanni et al. (2017), of the form  . From the (extinction-corrected) archival GALEX NUV magnitude of AT 2021loi, mNUV = 19.65 mag, we derive an archival NUV luminosity of Lν
(2500 Å) = 8.5 × 1027 erg s−1 Hz−1. Plugging this into the Nanni et al. (2017) relation, the expected spectral slope is αox = −1.12, which in turn yields an intrinsic monochromatic X-ray luminosity at 2 keV of ν
Lν
(2 keV) = 5.6 × 1042 erg s−1. Extrapolating the 2 keV fluxes to the 2–10 keV range assuming a photon index of Γ = 1.8, we derive an expected X-ray luminosity of L(2–10 keV) ≃ 6 × 1042 erg s−1, which is a factor of ∼3 higher than the upper limit from ROSAT. We stress that this estimate for the expected X-ray emission of AT 2021loi carries significant uncertainties. In particular, a 1σ uncertainty of ≈±0.2 on αox at any given Lν
(2500 Å) (consistent with what is reported in Nanni et al. 2017) would translate to an uncertainty of almost 0.6 dex on the expected X-ray luminosity we derive through this approach (i.e., a factor of ∼4).
31
Following the same approach for the near-peak Swift NUV measurement of mNUV = 16.82 mag yields αox ≃ −1.33 and L(2 keV) = 3.1 × 1043 erg s−1. Extrapolating the 2 keV flux to the 2–10 keV range using Γ = 1.8, we derive an expected X-ray luminosity of L(2–10 keV) = 5.0 × 1043 erg s−1. The upper limits from Swift/XRT correspond to L(2–10 keV) < (2.4–7.8) × 1042 erg s−1. At face value, we find that the source would have been detected in X-rays based on the near-peak NUV emission and if the broadband spectral energy distribution (SED) of AT 2021loi would have followed that of typical, persistent broad-line (unobscured) AGNs. However, the large uncertainties on this prediction limit our ability to draw definite conclusions regarding the SED of AT 2021loi based on its nondetection in X-rays (see Section 3.1.2). We discuss this further in Section 5.1.
. From the (extinction-corrected) archival GALEX NUV magnitude of AT 2021loi, mNUV = 19.65 mag, we derive an archival NUV luminosity of Lν
(2500 Å) = 8.5 × 1027 erg s−1 Hz−1. Plugging this into the Nanni et al. (2017) relation, the expected spectral slope is αox = −1.12, which in turn yields an intrinsic monochromatic X-ray luminosity at 2 keV of ν
Lν
(2 keV) = 5.6 × 1042 erg s−1. Extrapolating the 2 keV fluxes to the 2–10 keV range assuming a photon index of Γ = 1.8, we derive an expected X-ray luminosity of L(2–10 keV) ≃ 6 × 1042 erg s−1, which is a factor of ∼3 higher than the upper limit from ROSAT. We stress that this estimate for the expected X-ray emission of AT 2021loi carries significant uncertainties. In particular, a 1σ uncertainty of ≈±0.2 on αox at any given Lν
(2500 Å) (consistent with what is reported in Nanni et al. 2017) would translate to an uncertainty of almost 0.6 dex on the expected X-ray luminosity we derive through this approach (i.e., a factor of ∼4).
31
Following the same approach for the near-peak Swift NUV measurement of mNUV = 16.82 mag yields αox ≃ −1.33 and L(2 keV) = 3.1 × 1043 erg s−1. Extrapolating the 2 keV flux to the 2–10 keV range using Γ = 1.8, we derive an expected X-ray luminosity of L(2–10 keV) = 5.0 × 1043 erg s−1. The upper limits from Swift/XRT correspond to L(2–10 keV) < (2.4–7.8) × 1042 erg s−1. At face value, we find that the source would have been detected in X-rays based on the near-peak NUV emission and if the broadband spectral energy distribution (SED) of AT 2021loi would have followed that of typical, persistent broad-line (unobscured) AGNs. However, the large uncertainties on this prediction limit our ability to draw definite conclusions regarding the SED of AT 2021loi based on its nondetection in X-rays (see Section 3.1.2). We discuss this further in Section 5.1.
Figure 6 shows the color evolution of the UV-bright AT 2021loi compared to that of the BFF AT 2017bgt (Trakhtenbrot et al. 2019b) and the BF TDE AT 2018dyb (Leloudas et al. 2019). The color of AT 2021loi shows limited evolution similar to that of AT 2017bgt. Also, AT 2021loi is redder compared to AT 2018dyb.
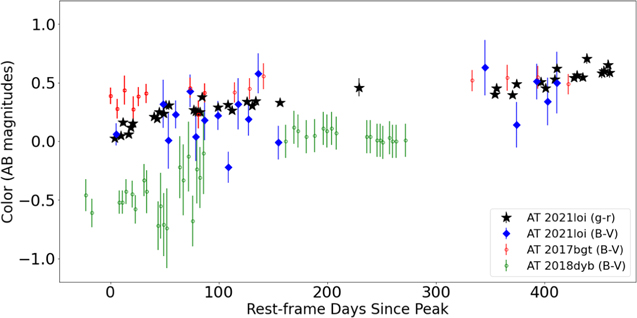
Figure 6. Color evolution (g − r and B − V) of AT 2021loi, the BFF AT 2017bgt, and the BF TDE AT 2018dyb. Here AT 2021loi is redder around the peak than AT 2018dyb. It also shows very limited color evolution, similar to AT 2017bgt.
Download figure:
Standard image High-resolution imageWe fit a blackbody to the ZTF (g and r), ATLAS (c and o), LCO (g and i), and all Swift photometry for each epoch in which we have Swift data (linearly interpolating neighboring optical epochs) using the blackbody fitting tool superbol 32 (Nicholl 2018). We then calculate the bolometric luminosity by integrating each observed SED, approximating the missing flux outside the observed bands, and using the blackbody fits. Our results are presented in Figure 7. The peak blackbody temperature (i.e., at UV peak but also the peak temperature) is (21.1 ± 1.5) × 103 K. After ∼43 days (in the rest frame), it declines to (15.8 ± 1.2) × 103 K, eventually reaching (14.4 ± 1.8) × 103 K. At these temperatures, we are fully sampling the blackbody continuum, especially with the UV data (Arcavi 2022).
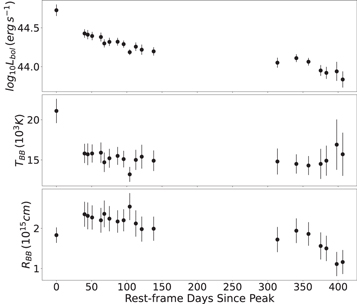
Figure 7. Bolometric luminosity (top), temperature (middle), and radius (bottom) from fitting a blackbody to the UV and optical photometry.
Download figure:
Standard image High-resolution imageCompared to a large compilation of TDEs (van Velzen et al. 2020), AT 2021loi is on the low-temperature end. Moreover, AT 2021loi has a steady slow decline, unlike several TDEs that show a decline followed by a rise in temperature. In terms of inferred radius, AT 2021loi has larger blackbody radii (1.8–2.6 × 1015 cm) compared to the vast majority of the van Velzen et al. (2020) TDEs (typically ≲6 × 1014 cm) and shows very little evolution. In contrast, TDE radii decline a few weeks after peak. The peak bolometric (blackbody) luminosity of AT 2021loi is  , which is higher than the majority of the TDEs presented in van Velzen et al. (2020). In comparison, the estimated temperature at the peak of the OGLE 17aaj BFF is 4 × 10⁴ K, which is much higher than that of AT 2021loi. (Gromadzki et al. 2019).
4.2. Spectroscopic Evolution
We use the pyqsofit fitting procedure 33 (Guo et al. 2018) to model the archival LAMOST spectrum, the first flare Keck spectrum, and the FLOYDS spectra. pyqsofit fits and decomposes the continuum emission (with AGN and host galaxy components) and fits the broad and narrow emission lines. The continuum is fitted as a simple power law, and we add a polynomial component when fitting fails without it.
All narrow emission lines are modeled with a single Gaussian, whereas the broad lines are modeled with either one or two Gaussians. We initially tried to model all broad emission lines with a single (broad) Gaussian, which works for simpler and/or weaker broad line profiles (e.g., Hδ). However, we found that some line profiles (e.g., Hβ) are more complex, and two broad components are required to achieve a satisfactory fit. These multiple broad Gaussians are not constrained in terms of offset velocity, peak intensity, or any other parameter. We stress that the choice to use either one or two broad Gaussian profiles was applied consistently to all spectra (i.e., all epochs). This fitting approach is in line with common practice in fitting the (sometimes complex) broad-line emission profiles in normal, persistent AGNs (see, e.g., Greene & Ho 2005; Shen et al. 2011; Trakhtenbrot & Netzer 2012; Mejía-Restrepo et al. 2018; Rakshit et al. 2020). We fit the 4500–5100 Å region, which covers the entire N iii λ4640 and He ii λ4686 region, as well as Hβ and the [O iii] λ λ4959, 5007 lines. In addition, we fit the Hα region, including the [N ii] λλ6548, 6584 and [S ii] λλ6718, 6732 doublets.
We first fit the archival spectrum from LAMOST with all of the available components within pyqsofit (i.e., the host component, power-law continuum, Balmer continuum, and iron emission). The fit results are presented in Figure 8. This spectrum shows broad Balmer emission lines with FWHM(Hα) and  , thus clearly capturing a broad-line, unobscured AGN. In addition, it also shows strong narrow [O iii] λ5007 emission. The key diagnostic narrow line ratios are
 ![$\mathrm{log}([{\rm{O}}\,{\rm\small{III}}]\,\lambda \,5007/{\rm{H}}\beta )\simeq 0.31$](https://content.cld.iop.org/journals/0004-637X/953/1/32/revision1/apjace1eeieqn6.gif) and
and ![$\mathrm{log}([{\rm{N}}\,{\rm\small{II}}]\,\lambda \,6583/{\rm{H}}\alpha )\simeq -0.30$](https://content.cld.iop.org/journals/0004-637X/953/1/32/revision1/apjace1eeieqn7.gif) , which would correspond to the composite region in the BPT (Baldwin et al. 1981); i.e., both star formation and AGN activity are responsible for producing the narrow lines in this galaxy (Kewley et al. 2006). Table 4 (in Appendix B) lists some key spectral measurements resulting from our analysis.
, which would correspond to the composite region in the BPT (Baldwin et al. 1981); i.e., both star formation and AGN activity are responsible for producing the narrow lines in this galaxy (Kewley et al. 2006). Table 4 (in Appendix B) lists some key spectral measurements resulting from our analysis.
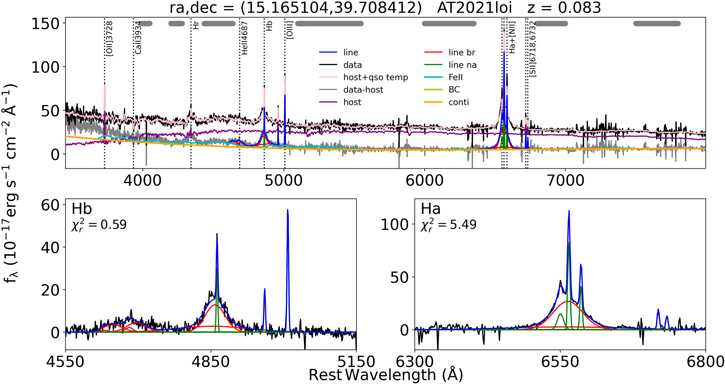
Figure 8. Decomposition of the archival LAMOST spectrum with pyqsofit along with the best-fit model and the model components. Gray horizontal bands near the top show the windows used for fitting the continuum (and iron) components. The black line represents the initial data, whereas the gray line represents the host-subtracted data. The host is plotted as the purple line. The best-fit emission lines, as a sum of the narrow (green line) and broad (red line) lines, are marked in blue. The bottom panels are a zoomed version of the components for Hα and Hβ.
Download figure:
Standard image High-resolution imageBased on relations between luminosity and BLR size derived from reverberation mapping campaigns, the LAMOST spectrum yields a BLR size of RBLR ≃ 2.9 and 5.4 lt-days using the prescriptions of Trakhtenbrot & Netzer (2012) and Bentz et al. (2013), respectively. We use the L(Hα) luminosity and the respective FWHM(Hα) to calculate the SMBH mass following Equation (2) in Mejía-Restrepo et al. (2022) and find MBH = 1.0 × 10⁷ M⊙. The uncertainties of such mass estimates are of the order of 0.3–0.5 dex, including uncertainties on both the RBLR–L5100 relation and the so-called virial factor (see, e.g., Shen 2013; Mejía-Restrepo et al. 2022, and references therein). We estimate the bolometric luminosity (Lbol) from the host galaxy–subtracted monochromatic luminosity at rest frame 5100 Å (3.2 × 1042 erg s−1) and a bolometric correction of fbol(5100 Å) ≡ Lbol/L5100 = 9.26 (e.g., Shen et al. 2008; MacLeod et al. 2010). This estimate has an uncertainty of order ∼0.3 dex due to the uncertainty on the bolometric correction (e.g., Runnoe et al. 2012; Duras et al. 2020, and references therein). From Lbol and MBH, we derive an estimate for the preflare Eddington ratio of L/LEdd ≈ 0.02 (with large systematic uncertainties stemming from both Lbol and MBH). Despite the large uncertainties associated with this Eddington ratio estimate, we conclude that the source in its preflare state was well within the sub-Eddington accretion regime.
The earliest spectrum after the flare, which is also the one nearest the optical peak time, is the Keck/LRIS spectrum obtained 31 days after discovery. Since the Keck spectrum has a lower resolution compared to LAMOST, we use the host component as measured for the LAMOST spectrum by pyqsofit to apply host subtraction to the Keck spectrum. After that, we process the Keck spectrum with pyqsofit (Figure 9) without applying host decomposition but only continuum, iron, and emission line fitting.
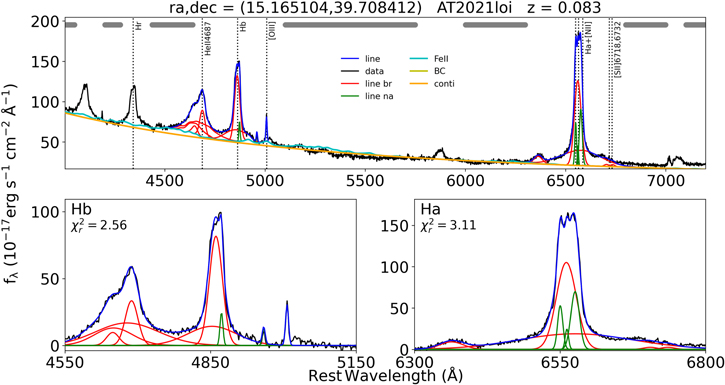
Figure 9. Decomposition of the Keck spectrum with pyqsofit along with the best-fit model and the model components. Gray horizontal lines on the top show the windows used for the continuum estimate. The black line represents the host-subtracted data. The best-fit emission lines, as a sum of narrow (green line) and broad (red line) lines, are marked in blue. The bottom panels are a zoomed version of the components for Hα and Hβ.
Download figure:
Standard image High-resolution imageFor the Keck spectrum, we find L5100 = 3.0 × 1043 erg s−1. From this, along with the MBH estimated from the LAMOST spectrum and the same bolometric correction as mentioned above, we derive an Eddington ratio at the epoch of the Keck spectrum (i.e., near peak) of L/LEdd ≈ 0.2. This is an increase by a factor of ∼10 compared to the preflare phase, but it is still well within the sub-Eddington regime. The UV peak luminosity found in Section 4.1, combined with a UV bolometric correction of fbol(UV) = 3.5 (see Kaspi et al. 2000; Netzer et al. 2016), yields a bolometric luminosity of 7.7 × 1044 erg s−1, which in turn gives L/LEdd ≃ 0.5. The higher value of the UV-based Lbol estimate is a result of the UV-bright nature of the transient. Although more than twice as high as what is found from L5100, the UV-based L/LEdd estimate is still within the sub-Eddington regime, although we note that the large systematic uncertainty on this estimate means it is formally consistent with L/LEdd ≈ 1. The bolometric luminosity generated from the blackbody fit in the previous section is 4.8 × 1044 erg s−1, which is lower than the one estimated from the UV flux, resulting in an even lower Eddington ratio. In any case, notwithstanding the range of L/LEdd estimates and the significant systematic uncertainties associated with them, we can still conclude that the data in hand do not support a scenario in which the AT 2021loi flare approached the Eddington limit of the accreting SMBH.
In Figure 10, we plot the LAMOST and Keck spectra divided by the power-law continuum and the iron component as fitted by pyqsofit in order to see the difference in the strength of the emission lines with respect to the continuum and iron complex. We see that the relative strength of the feature around 4680 Å to Hβ has increased. In order to quantify the changes in the He ii λ4686+N iii λ4640 region between the LAMOST preflare and Keck (near optical peak) spectra, we perform the following procedure on both spectra. We start by fitting both the He ii λ4686 and N iii λ4640 complex with two Gaussian components for each transition, forcing the widths to match that of the Hβ broad component. Each of these broad components is allowed to have an FWHM in the range of 2000–10,000 km s−1. In the case of LAMOST, although it is possible to fit the emission feature around 4680 Å (FWHM > 6000 km s−1) as either one or two components (i.e., only He ii λ4686 or He ii λ4686 blended with N iii λ4640), it is not clear if the feature indeed consists of two peaks. In the case of the Keck spectrum, we see two peaks more clearly, similar to previously identified BFFs. We list the flux (measured with pyqsofit) ratios between the emission lines of interest in Table 3.
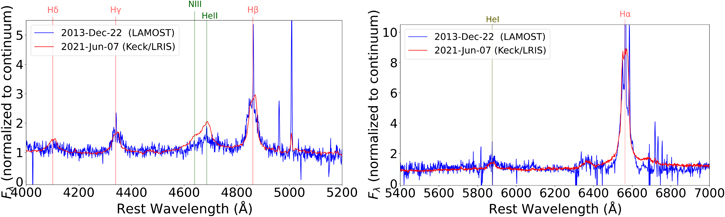
Figure 10. Comparison of the host-subtracted and extinction-corrected LAMOST and Keck spectra divided by the power-law continuum and the iron complex as fitted by pyqsofit. We see that there is indeed enhanced emission in the region around 4680 Å but also for Hδ with regard to Hβ. The Hα remains essentially unchanged.
Download figure:
Standard image High-resolution imageTable 3. Emission Line Ratios from the LAMOST and Keck Spectra
| Flux Ratio | Preflare | Transient State |
|---|---|---|
| F(Hαb )/F(Hβb ) | 2.33 ± 0.21 | 2.12 ± 0.34 |
| F(He II λ4686)/F(Hβb ) | ⋯ | 0.71 ± 0.09 |
| F(N iii λ4640)/F(Hβb ) | ⋯ | 0.47 ± 0.07 |
| F(He II λ4686 + N iii λ4640)/F(Hβb ) | 0.58 ± 0.13 | 1.12 ± 0.05 |
| F(Hγ)/F(Hβb ) | 0.48 ± 0.03 | 0.41 ± 0.02 |
| F(Hδ)/F(Hβb ) | 0.24 ± 0.02 | 0.36 ± 0.03 |
Note. For the ratios in this table, we use fluxes from Gaussian fitting. The superscript “b” denotes the broad component.
Download table as: ASCIITypeset image
We look for differences in the integrated flux density of the total He ii λ4686 and N iii λ4640 region relative to the integrated flux density of Hβ. We do this by integrating the flux density after host, continuum, and iron subtraction between 4580 and 4750 Å (the region that covers He ii λ4686 and N iii λ4640) and between 4800 and 4900 Å (the region that covers Hβ). We use two approaches to quantify this ratio. In the first case, we integrate the observed flux in the region with no emission line fitting. We find that the ratio between the integrated fluxes in the two regions is 0.53 for the LAMOST spectrum and 1.12 for the Keck spectrum, meaning that the ratio increased by a factor of ≈2. Using the flux as extracted from the Gaussians fit to the emission lines, we find a similar line ratio increase from F(He II λ4686 + N iii λ4640)/F(Hβ) ∼ 0.58 in the LAMOST spectrum to F(He II λ4686 + N iii λ4640)/F(Hβ) ∼ 1.09 in the Keck spectrum.
We also find that the ratio between the integrated flux without fitting the Hδ spectral region (4050–4150 Å) to that of Hβ increased from 0.22 ± 0.01 in the LAMOST spectrum to 0.35 ± 0.02 in the Keck spectrum. The flux ratio of F(Hδ)/F(Hβ) from Gaussian fitting increased from 0.24 ± 0.02 in the LAMOST spectrum to 0.36 ± 0.03 in the Keck one. On the other hand, the flux ratio of Hγ to Hβ remained consistent with F(Hγ)/F(Hβ) = 0.51 ± 0.02 for LAMOST and 0.48 ± 0.03 for Keck (without fitting) and at F(Hγ)/F(Hβ) = 0.48 ± 0.05 for LAMOST and 0.41 ± 0.03 for Keck (with fitting). We find, though, that the F(Hγ)/F(Hβ) ratio remained constant, whereas F(Hδ)/F(Hβ) significantly increased by ∼1.5, providing more support for the BF mechanism, as the Hδ feature is likely blended with N iii emission at λ λ4097, 4104 (Netzer et al. 1985).
Although the spectrum appears to have a strong iron bump around 4500–4600 Å after the pyqsofit fitting, we find that He ii at 4687 Å was present in the archival LAMOST spectrum. Typically, in AGNs, F(He II λ4686)/F(Hβ) ≤ 0.05 (Vanden Berk et al. 2001). For the LAMOST spectrum, the intensity ratio F(He II λ4686 + N iii λ4640)/F(Hβ) is ∼0.5, which is already 10 times higher than typical AGNs. For the Keck spectrum, where the N iii λ4640 and He ii λ4686 lines can be clearly separated, we find that F(He II λ4686)/F(Hβ) = 0.71 ± 0.09, F(N iii λ4640)/F(Hβ) = 0.47 ± 0.07, and F(N iii λ4640)/F(He II λ4686) = 0.66 ± 0.11. Given the F(He II λ4686)/F(Hβ) and F(N iii λ4640)/F(Hβ) ratios seen in AT 2021loi and the predicted relative intensities for AGNs as suggested by Netzer et al. (1985), the gas producing the BF must have a very high density (nH > 109.5 cm−3) and higher N and O abundances relative to the cosmic ones. We find that the [He i] λ5875 flux relative to [O iii] λ5007 increased from 1.17 in the LAMOST spectrum to 2.53 in the Keck spectrum; however, the flux ratio to Hβ has decreased from 0.27 in LAMOST to 0.13 in Keck.
To trace the evolution of the key spectral features of AT 2021loi, we apply the pyqsofit fitting to the lower-resolution Las Cumbres/FLOYDS spectra using the same approach as we did for the Keck spectrum (i.e., subtracting the host component as extracted from the archival LAMOST spectrum). We use the same two approaches as before, i.e., first integrating over the observed flux in the region with no emission line fitting and then finding the integrated fluxes after Gaussian fitting for He ii λ4686 and N iii λ4640. In the top panel of Figure 2, we plot the ratio of the total He ii λ4686 and N iii λ4640 integrated flux to the respective integrated flux of the broad Hβ as a function of rest-frame time with respect to MJD = 59,381. The flux is host-, continuum-, and iron-subtracted in both cases (i.e., with and without fitting).
The top panel of Figure 2 shows that there is enhanced emission in the region around 4680 Å (relative to Hβ) consistent with BF brightening. This enhanced emission lasts for at least 27 rest-frame days after the Keck spectrum and 58 rest-frame days after the initial transient detection. The ratio of the flux of the BF features to Hβ appears to become weaker than the respective ratio in the LAMOST spectrum after 35 rest-frame days from the Keck spectrum, but it is evident that the emission around 4680 Å still exists. The lower resolution of the FLOYDS spectra compared to LAMOST and Keck may underpredict our measured ratios due to blending with Fe features.
We now turn to investigating the high-ionization iron lines. These lines have been seen in the past in AGNs, and for Fe x λ6375, it has been found that the maximum F([Fe X] λ6375)/F([O iii] λ5007) ratio is ∼0.24 (Nagao et al. 2000). The LAMOST spectrum of AT 2021loi shows an F([Fe X] λ6375/F([O iii] λ5007) ratio of ∼0.6. In the Keck spectrum, we find this value to be 2.06.
In the LAMOST spectrum, the FWHM of Fe x λ6375 is ∼1900 km s−1 lower than that of Hβ, Hα, He i (∼3000 km s−1), and the BF lines (He ii λ4686+N iii λ4640 ∼ 7000 km s−1). For the Keck spectrum, the Fe x λ6375 emission line’s FWHM is ∼2000 km s−1. We note that this is surprising for two reasons: (1) the line seems almost unchanged between the two spectra, and (2) in both cases, the line is consistent with a BLR, whereas in Wang et al. (2012), coronal emitters are found to have Fe x λ6375 with an FWHM between 200 and 1000 km s−1, i.e., consistent with a narrow-line region.
5. Discussion
Object AT 2021loi is an optically discovered, UV-bright flare observed at the center of an active galaxy. The steep rise in the optical by a factor of ∼4 in about 40 days, as well as in the UV (a factor of ∼20 brightening), distinguishes AT 2021loi from the usual variability of unobscured, broad-line AGNs, which typically vary by only a few percent over such timescales (MacLeod et al. 2012a; van Velzen et al. 2019). The double-peaked emission feature around 4680 Å seen in the postpeak Keck/LRIS spectrum classifies this nuclear event as a BFF in a galaxy hosting an AGN. In this section, we discuss our key findings regarding AT 2021loi in the context of other types of BF nuclear transients.
5.1. AT 2021loi as a BFF
Here we refer to the basic properties of AT 2021loi that suggest it is part of the BFF class and compare it to previously reported BFFs. We focus on the three events used by Trakhtenbrot et al. (2019b) to identify this class, namely, AT 2017bgt (first reported in Trakhtenbrot et al. 2019b), F01007–2237 (Tadhunter et al. 2017), and OGLE 17aaj (Gromadzki et al. 2019).
After the initial increase in brightness, AT 2021loi shows a very slow decline until rebrightening ∼13 months after the initial detection (see Figures 1 and 2 and Section 4.1). The slow decline is comparable to that of the BFFs presented in Trakhtenbrot et al. (2019b); i.e., after more than a year, the optical transient emission still persists. In Figure 11, we present the r-band light curve of AT 2021loi along with those of the Trakhtenbrot et al. (2019b) BFFs. The rebrightening and second peak are very clear for AT 2021loi. There is evidence for a rebrightening in F01004–2237 too, which we point out explicitly here for the first time. However, in this case, the photometric cadence is rather low, and the host subtraction is more challenging. The most up-to-date ZTF and ATLAS photometry for AT 2017bgt is also indicative of another bump, roughly 14 months after the initial detection (and 13 months after the first peak); however, this possible rebrightening is even less robust than the one in F01004–2237. 34 A late-time rebrightening of the (optical) emission may thus emerge as another intriguing common property of BFFs, although the evidence in hand is still limited.
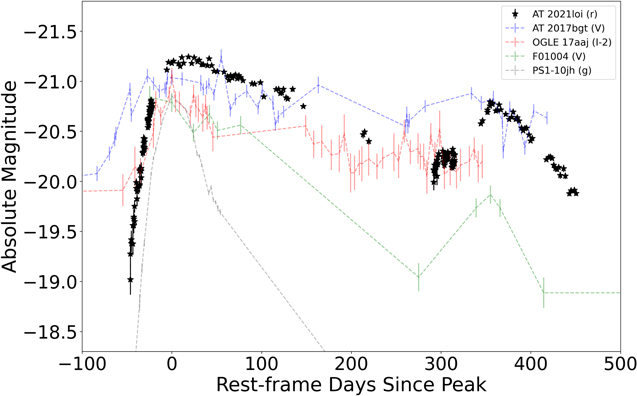
Figure 11. Comparison of the light curve of AT 2021loi with those of the BFFs listed in Tadhunter et al. (2017), Gromadzki et al. (2019), and Trakhtenbrot et al. (2019b) and the TDE PS1-10jh (Gezari et al. 2012, 2015). All of the magnitudes are reference-subtracted. From the light curves, we find that although AT 2021loi has a fast rise, it shows a very slow decline similar to other BFFs and unlike a typical TDE.
Download figure:
Standard image High-resolution imageThe optical spectroscopy of AT 2021loi shows a prominent double-peaked emission feature around 4680 Å, consistent with blended He ii λ4686 and N iii λ4640 emission. The spectra also show other BF features, such as O iii lines at 3133 and 3444 Å. A strong feature around 4680 Å is also seen in the preflare spectrum of AT 2021loi. To our knowledge, only one of the three BFFs studied by Trakhtenbrot et al. (2019b) has preflare optical spectroscopy: the HST/STIS spectrum of F01004–2237 (Tadhunter et al. 2017). That spectrum (Figure 12) also shows preexisting N iii λ4640 and He ii λ4686 features that became stronger following the optical flare. Tadhunter et al. (2017) attributed the preexisting N iii λ4640 and He ii λ4686 BF emission to WN Wolf–Rayet stars in the host galaxy, interpreting the flare and He ii λ4686 enhancement as a result of a TDE in F01004–2237.
The preflare F(He ii λ4686 + N iii λ4640)/F(Hβ) ratio of AT 2021loi (0.58) is already higher than what is expected for AGNs (∼0.05; see, e.g., Vanden Berk et al. 2001) and similar to that measured for F01004–2237 (0.49 preflare). For AT 2021loi, this ratio increases to ∼1.1 near the optical peak, which is slightly lower than what was found in the spectrum of F01004–2237 during its flare (∼1.8) and slightly higher than what was found for OGLE 17aaj (∼0.9; Gromadzki et al. 2019).
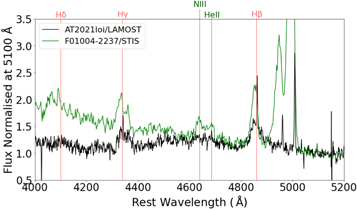
Figure 12. Comparison of the preflare LAMOST spectrum of AT 2021loi with the preflare HST spectrum of F01004–2237 (Tadhunter et al. 2017). Both show preflare emission features around 4680 Å.
Download figure:
Standard image High-resolution imageIn Figure 13, we compare the near-peak spectrum of AT 2021loi with those of the BFFs discussed in Trakhtenbrot et al. (2019b). In addition to the ∼4680 Å feature, AT 2021loi also shows a broad and possibly double-peaked feature near Hδ, similar to what is seen for OGLE 17aaj (Gromadzki et al. 2019). As previously mentioned, the Hδ emission line coincides with the N iii BF features expected at 4097 and 4104 Å. These two lines are expected to have relative intensities to N iii λ4640 of 0.117 and 0.082, respectively (Netzer et al. 1985). Given the limited resolution of the AT 2021loi spectra in hand, it is not possible to properly decompose these lines from Hδ, but we suggest that since the F(Hδ)/F(Hβ) ratio increased more from pre- to during-flare spectra than the F(Hγ)/F(Hβ) ratio, the Hδ spectral feature is affected by intensified N iii emission.
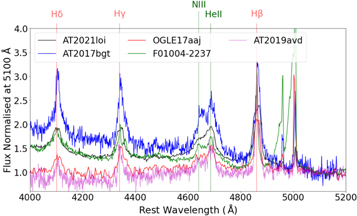
Figure 13. Comparison of the AT 2021loi spectrum (in blue) taken a month after discovery with the optical spectra of the three BFFs discussed in Trakhtenbrot et al. (2019b).
Download figure:
Standard image High-resolution imageObject AT 2021loi also shows signs of enhanced emission (between pre- and during-flare spectra) in some higher-ionization coronal lines, specifically Fe x λ6375. This line was also found in the BF nuclear transient AT 2019avd (Malyali et al. 2021). In that case, the presence of coronal emission lines was argued to require and be associated with the intense soft X-ray radiation seen in that event. The initial discovery of the X-ray flare by e-ROSITA measured a 0.2–2 keV luminosity of 2.7 × 1042 erg s−1, which is 90 times brighter than the preflare upper limits. The X-ray emission of AT 2019avd remained rather steady for 4 months, after which it further increased (L(0.2–2 keV) = 1.9 × 1043 erg s−1). For AT 2021loi, there is no X-ray emission detected by our Swift/XRT monitoring, with 3σ upper limits in the range (1.5–5.8) × 1042 erg s−1 at 2–10 keV. While there is no X-ray emission detected, we note that the expected X-ray luminosity for AT 2021loi at 2keV based on the NUV flux (ν Lν = ∼ 2.2 × 1043 erg s−1; see Section 4.1) is higher than what was detected in AT 2017bgt (L(2–10 keV) = 1.2 × 1043 erg s−1) and AT 2019avd (2.7 × 1042 erg s−1).
Thus, the X-ray emission from AT 2021loi and the AGN in its preflare state is intrinsically weaker than what is seen in normal, persistently accreting AGNs (taking into account the ≈0.6 dex uncertainty on the expected X-ray emission; see above); considerably weaker than what is seen in other BFFs; and/or delayed compared with what is seen in other BFFs. It is highly unlikely that intrinsically luminous X-ray radiation is obscured by (dusty) gas along our line of sight, given the prominent blue continuum and broad-line emission. Finally, we cannot rule out a more complex scenario in which the X-ray-emitting corona was disrupted by the UV flare, as suggested in at least one other AGN-related UV-luminous transient (Ricci et al. 2020). At any rate, the X-ray nondetection following the UV-luminous flare in AT 2021loi does not follow what is seen in normal AGNs.
Compared to the archival GALEX measurement of its host, AT 2021loi is associated with increased UV emission (by a factor of ∼20). The preflare optical spectrum clearly shows the presence of an actively accreting SMBH in the nucleus of the host galaxy. The rise of the UV emission, peaking at ν Lν ≃ 2.3 × 1044 erg s−1, combined with the simultaneous and significant brightening of the Bowen features, strongly suggests that the AT 2021loi BF features are driven by the accretion flow onto the SMBH.
We can use the observed and modeled SEDs of AT 2021loi to assess whether there is indeed sufficient EUV emission to account for the BF features. First, by integrating the best-fit (17.2 × 10³ K) blackbody SED of the flare near peak, we find that only ∼10−12 of the total luminosity is emitted below 228 Å (the range required to ionize He ii), corresponding to a luminosity of the order of 1032 erg s−1. The observed Bowen lines near peak, however, have respective (He ii λ4686 and N iii λ4640) luminosities of order 1041 erg s−1. Thus, another ionizing source outside the measured blackbody continuum might be required to account for the BF emission. This is similar to what was found for the BF-emitting TDE AT 2018dyb (Leloudas et al. 2019).
Second, we can use a (simplified) AGN SED to assess the radiative (EUV) energetics, scaling to either the pre- or during-flare measured luminosities of AT 2021loi. We use the Marconi et al. (2004) SED, scaled to either  or 44.46 for the pre- or during-flare states, respectively. The integrated EUV luminosities, i.e., over λ < 228 Å, are 7.4 × 1042 and 5.3 × 1043 erg s−1 for the pre- and during-flare near-peak states, respectively. At face value, it appears that the EUV emission from the AGN is sufficient to account for the energetics of the BF features (≳1041 erg s−1), even before the optical/UV flare. However, given that the (optical) luminosity of the preexisting AGN in this system is not exceptionally high, we recall that BF lines are not ubiquitous in persistent AGNs (e.g., Netzer et al. 1985; Vanden Berk et al. 2001), suggesting that other considerations apart from pure (radiative, EUV) energetics are at play.
5.2. Comparison to TDEs
We next compare AT 2021loi to the growing sample of TDEs detected in the optical/UV regime (see van Velzen et al. 2020 and Gezari 2021 for recent reviews). The rise time of AT 2021loi, about a month, is similar to what is observed in optical/UV TDEs. However, the decline of the optical emission in AT 2021loi, which can be described by a power law with an index shallower than α ≃ −0.8 (second decline α ≃ −0.9), is much slower than what is seen in optical/UV TDEs, which are typically compared to α ≃ −5/3. This is also apparent in Figure 11, where we compare the optical/UV light curve of AT 2021loi with that of the TDE PS1-10jh (Gezari et al. 2012, 2015). The TDE light curve fades within a few months, whereas AT 2021loi lasts for more than 1 yr and also presents a secondary brightening. If we fit the postpeak decline of AT 2021loi with a t−5/3 power law, the required disruption time is MJD = 59,031 ± 11 (i.e., 2020 June–July), which is approximately 1 yr before the initial ZTF detection of the flare. While the tidal disruptions of giant stars are indeed expected to have longer timescales (e.g., MacLeod et al. 2012b), this would also imply longer rise times (i.e., months instead of weeks), which is not the case with AT 2021loi. We conclude that the optical/UV light curve of AT 2021loi is markedly different than what is seen in (optical/UV) TDEs. We conclude that the overall shape of AT 2021loi is very different from what we know so far for TDEs.
In terms of spectral properties, in many cases, optical/UV TDEs also show broad emission features around 4680 Å (associated with He ii λ4686 and N iii λ4640; see van Velzen et al. 2020 and references therein). However, we first note that the emission lines (such as He ii and Balmer) in TDEs (FWHM ∼ 104 km s−1) are much broader than those observed in AT 2021loi (FWHM ∼ 3000 km s−1). In terms of broadband SEDs, the color of AT 2021loi is redder than what is found for TDEs in the early stages and shows very limited evolution (Figure 6). When modeling the transient emission in AT 2021loi with a blackbody, we find that the derived temperature is much lower than what is seen in TDEs, whereas its (peak) bolometric luminosity and inferred blackbody radius are higher than in TDEs (see Section 4.1). These features lend further support to our interpretation that the transient emission in AT 2021loi is not driven by a TDE—at least not of the common optical/UV kind—as emphasized by Trakhtenbrot et al. (2019a) for the BFF class as a whole.
Also, AT 2021loi is not compatible with scenarios of partial TDEs (e.g., Zhong et al. 2022), double TDEs (e.g., Mandel & Levin 2015), or extreme mass-ratio inspirals (EMRIs; e.g., Sari & Fragione 2019). The second peak in AT 2021loi occurred ∼400 days after the first peak, which is longer than predicted in the partial TDE scenarios (i.e., ≲150 days for main-sequence stars). On the other hand, in the case of EMRIs, repeated flares are expected to happen on longer timescales (i.e., ≳several years). However, more detailed simulations of such events are needed to investigate their possible emission signatures.
6. Conclusions
We presented multiepoch observations of the nuclear transient AT 2021loi, whose main observed photometric and spectroscopic characteristics are as follows.
- 1.It is a transient event in a previously known broad-line AGN (WISEA J010039.62+394230.3). An archival spectrum shows clear broad Hα, Hβ, and Hγ emission and a bump around 4680 Å, which suggests that at least He ii λ4686 was present before the flare.
- 2.It shows a rapid (∼month) rise of the optical flux by a factor of ∼4× and a rise in the UV by a factor of ∼20×, while no previous strong variability is found (Figure 1). It shows a very slow decline for 13 months after the initial detection (about 12 months after the peak). Then the optical/UV light curve shows a rebrightening and a second peak about 390 days after the first one.
- 3.The spectra during the transient phase show enhanced broad Hα, Hβ, Hγ, and Hδ emission. We also find enhanced He i emission at 5875 Å.
- 4.The spectra of the source during the flare also show BF lines such as N iii λ4640 and O iii λ3133.
- 5.The flare spectroscopy also reveals signs of enhanced emission from higher-ionization coronal lines such as Fe x λ6375. The width of this line is consistent with that of other broad lines (i.e., originating from the BLR), unlike what has been seen in AGNs until now.
- 6.It shows no X-ray emission down to a limit of L(2–10 keV) < 2.5 × 1042 erg s−1 (3σ), which is considerably lower (by a factor of ∼25) than what is expected from the UV–to–X-ray scaling relations of normal AGNs.
Object AT 2021loi adds further insight but also raises new questions related to the already complex phenomenology of SMBH-related transients and extreme AGN variability. Continued monitoring of AT 2021loi could provide insights as to its multipeak nature, testing models of repeated flaring activity. Any late-time X-ray or radio emission could provide further clues as to the nature of this event and perhaps the class of BFFs as a whole.
Acknowledgments
L.M., B.T., I.A., and M.C.L. acknowledge support from the European Research Council (ERC) under the European Union’s Horizon 2020 research and innovation program (grant agreements 852097 and 950533) and from the Israel Science Foundation (grant Nos. 1849/19 and 2752/19). I.A. is a CIFAR Azrieli Global Scholar in the Gravity and the Extreme Universe Program and acknowledges support from that program, the United States–Israel Binational Science Foundation (BSF), and the Israeli Council for Higher Education Alon Fellowship. C.R. acknowledges support from Fondecyt Iniciacion grant 11190831 and ANID BASAL project FB210003. A.H. is grateful for support by the I-Core Program of the Planning and Budgeting Committee and the Israel Science Foundation and by ISF grant 647/18. A.H. is grateful for support by the Zelman Cowen Academic Initiatives. This publication was made possible through the support of an LSSTC Catalyst Fellowship to K.A.B. funded through grant 62192 from the John Templeton Foundation to LSST Corporation. The opinions expressed in this publication are those of the author(s) and do not necessarily reflect the views of LSSTC or the John Templeton Foundation.
Guoshoujing Telescope (the Large Sky Area Multi-Object Fiber Spectroscopic Telescope, LAMOST) is a National Major Scientific Project built by the Chinese Academy of Sciences. Funding for the project has been provided by the National Development and Reform Commission. LAMOST is operated and managed by the National Astronomical Observatories, Chinese Academy of Sciences. The ZTF forced photometry service was funded under Heising-Simons Foundation grant No. 12540303 (PI: Graham). This work makes use of data from the Las Cumbres Observatory global telescope network. The LCO group is supported by NSF grants AST-1911151 and AST-1911225 and NASA Swift grant 80NSSC19k1639. The National Radio Astronomy Observatory is a facility of the National Science Foundation operated under cooperative agreement by Associated Universities, Inc. We acknowledge the staff who operate and run the AMI-LA telescope at Lord's Bridge, Cambridge, for the AMI-LA radio data. The AMI is supported by the Universities of Cambridge and Oxford and the European Research Council under grant ERC-2012-StG307215 LODESTONE.
This work made use of data from the Asteroid Terrestrial- impact Last Alert System (ATLAS) project. ATLAS is primarily funded to search for near-Earth asteroids through NASA grants NN12AR55G, 80NSSC18K0284, and 80NSSC18K1575; by-products of the NEO search include images and catalogs from the survey area. This work was partially funded by Kepler/K2 grant J1944/80NSSC19K0112, HST GO-15889, and STFC grants ST/T000198/1 and ST/S006109/1. The ATLAS science products have been made possible through the contributions of the University of Hawaii Institute for Astronomy, the Queen's University Belfast, the Space Telescope Science Institute, the South African Astronomical Observatory, and the Millennium Institute of Astrophysics (MAS), Chile.
This work also made use of the NASA/IPAC Extragalactic Database (NED), which is funded by the National Aeronautics and Space Administration and operated by the California Institute of Technology, and of data, software, and web tools obtained from the High Energy Astrophysics Science Archive Research Center (HEASARC), a service of the Astrophysics Science Division at NASA/GSFC and the Smithsonian Astrophysical Observatory's High Energy Astrophysics Division.
Facilities: Las Cumbres (FLOYDS - , Sinistro) - , Keck (LRIS) - , LAMOST - , WISE - , Swift (UVOT and XRT) - , ZTF - , ATLAS - , VLA - , AMI-LA - .
Software: AstroPy (Astropy Collaboration et al. 2013, 2018, 2022), Matplotlib (Hunter 2007), NumPy (Harris et al. 2020), SciPy (Virtanen et al. 2020), lcogtsnpipe (Valenti et al. 2016), PyQSOFit (Guo et al. 2018), ASPIRED (Lam & Smith 2022).
Appendix A: Normalized Keck and LAMOST Spectra
Figure 14 shows the archival LAMOST and near-peak (classification) Keck spectra of AT 2021loi but with flux densities normalized such that the integrated flux of the best-fitting [O iii] λ5007 line profile would result in 1 erg s−1 cm−2. To derive the corresponding normalization factor for each spectrum, we employed the pyqsofit spectral fitting procedure (see Section 4.2) but note that in this case, we did not try to assign any physical meaning to the continuum decomposition, broad line profiles, or other parameters. As we do not expect the [O iii] λ5007 to vary within timescales of a few years (see discussion and a rare counterexample in Peterson et al. 2013), these normalized spectra serve to further highlight the differences in continuum and broad-line emission between the two epochs, independent of potential seeing and aperture effects.
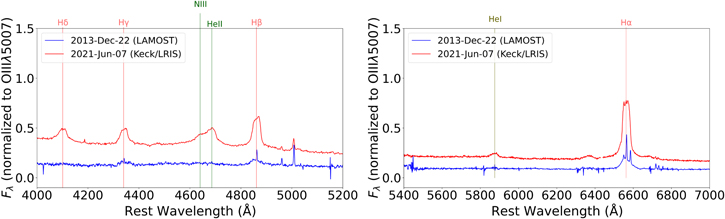
Figure 14. Comparison of the host-subtracted and extinction-corrected LAMOST and Keck spectra divided by the [O iii] λ5007 flux as found by pyqsofit.
Download figure:
Standard image High-resolution imageAppendix B: Details Regarding Optical Spectra
Table 4 lists the basic details regarding the optical spectra we use and some key spectral measurements derived through our spectral fitting (see Section 4.2).
Table 4. Optical Spectroscopy of AT 2021loi
| MJD | Telescope/Instrument | Ra | F(Hβ) | F(BF) b | F([O iii] λ5007) |

| FWHM(Hβ) |
|---|---|---|---|---|---|---|---|
| (Approx.) | (10−15 erg cm−2 s−1) | (10−15 erg cm−2 s−1) | (10−15 erg cm−2 s−1) | (erg s−1) | (km s−1) | ||
| 56,648.00 | LAMOST | 1800 | 10.12 ± 0.54 | 5.82 ± 0.46 | 2.29 ± 0.12 | 42.5 | 3024 ± 248 |
| 59,372.61 | Keck/LRIS | 900 | 47.12 ± 2.13 | 55.88 ± 2.96 | 2.42 ± 0.11 | 43.48 | 2146 ± 31 |
| 59,378.59 | Las Cumbres/FLOYDS-N | 500 | 39.41 ± 2.06 | 35.31 ± 1.85 | 2.20 ± 0.12 | 43.59 | 2087 ± 94 |
| 59,399.60 | Las Cumbres/FLOYDS-N | 500 | 58.42 ± 2.55 | 40.49 ± 1.76 | 2.48 ± 0.11 | 43.65 | 2092 ± 61 |
| 59,407.55 | Las Cumbres/FLOYDS-N | 500 | 53.16 ± 2.42 | 25.91 ± 1.18 | 2.54 ± 0.12 | 43.51 | 1917 ± 77 |
| 59,415.53 | Las Cumbres/FLOYDS-N | 500 | 63.08 ± 3.47 | 29.82 ± 1.64 | 3.39 ± 0.19 | 43.53 | 2162 ± 63 |
| 59,429.46 | Las Cumbres/FLOYDS-N | 500 | 78.90 ± 2.52 | 31.77 ± 1.02 | 4.17 ± 0.13 | 43.65 | 2051 ± 120 |
| 59,446.52 | Las Cumbres/FLOYDS-N | 500 | 69.93 ± 0.97 | 22.13 ± 0.31 | 3.08 ± 0.04 | 43.48 | 2078 ± 52 |
| 59,454.61 | Las Cumbres/FLOYDS-N | 500 | 65.78 ± 1.14 | 21.25 ± 0.37 | 2.52 ± 0.04 | 43.44 | 2125 ± 49 |
| 59,462.49 | Las Cumbres/FLOYDS-N | 500 | 62.87 ± 1.27 | 19.08 ± 0.38 | 2.78 ± 0.06 | 43.41 | 2184 ± 80 |
| 59,470.44 | Las Cumbres/FLOYDS-N | 500 | 72.48 ± 1.82 | 21.76 ± 0.55 | 3.25 ± 0.08 | 43.43 | 2171 ± 101 |
| 59,478.44 | Las Cumbres/FLOYDS-N | 500 | 69.84 ± 4.29 | 22.58 ± 1.39 | 1.92 ± 0.12 | 43.25 | 2279 ± 189 |
| 59,489.37 | Las Cumbres/FLOYDS-N | 500 | 65.38 ± 1.72 | 23.26 ± 0.61 | 2.58 ± 0.07 | 43.29 | 2409 ± 100 |
| 59,504.28 | Las Cumbres/FLOYDS-N | 500 | 48.26 ± 0.88 | 12.11 ± 0.22 | 1.04 ± 0.02 | 42.99 | 2272 ± 53 |
| 59,507.37 | Las Cumbres/FLOYDS-N | 500 | 60.37 ± 2.93 | 15.40 ± 0.75 | 1.25 ± 0.06 | 42.63 | 2761 ± 103 |
| 59,522.34 | Las Cumbres/FLOYDS-N | 500 | 52.01 ± 1.40 | 17.02 ± 0.46 | 1.68 ± 0.05 | 42.95 | 2440 ± 69 |
| 59,537.35 | Las Cumbres/FLOYDS-N | 500 | 67.34 ± 1.06 | 19.30 ± 0.30 | 2.44 ± 0.04 | 43.18 | 2370 ± 44 |
| 59,585.29 | Las Cumbres/FLOYDS-N | 500 | 54.20 ± 0.98 | 17.20 ± 0.31 | 1.88 ± 0.03 | 42.69 | 2365 ± 74 |
| 59,601.24 | Las Cumbres/FLOYDS-N | 500 | 70.13 ± 1.08 | 19.88 ± 0.31 | 2.62 ± 0.04 | 43.11 | 2340 ± 57 |
| 59,616.22 | Las Cumbres/FLOYDS-N | 500 | 66.00 ± 0.98 | 17.97 ± 0.27 | 2.62 ± 0.04 | 43.0 | 2265 ± 54 |
| 59,804.55 | Las Cumbres/FLOYDS-N | 500 | 72.00 ± 0.91 | 24.61 ± 0.31 | 2.00 ± 0.03 | 42.46 | 2312 ± 148 |
| 59,839.52 | Las Cumbres/FLOYDS-N | 500 | 57.93 ± 9.19 | 8.00 ± 1.27 | 1.50 ± 0.23 | 42.63 | 2333 ± 528 |
Notes.
a The (approximate) resolving power of the spectrum. b With the term BF here, we mean the double-peaked emission feature around ∼4680 Å originating from He ii λ4686 and N iii λ4640.A machine-readable version of the table is available.
Download table as: DataTypeset image
Footnotes
- 14
Here we refer to changing-look events in terms of their spectral appearance in the optical regime, not in the X-ray regime.
- 15
Throughout the text, the term “reference” in the context of photometry or spectroscopy is used to denote the preflare emission from the source, which contains both the stellar light of the host and the preflare AGN emission.
- 16
- 17
- 18
- 19
- 20
- 21
- 22
MIR magnitudes and colors are converted in the AB system.
- 23
These changes in aperture do not have a strong effect on the photometry.
- 24
Retrieved via the NASA/IPAC Extragalactic Database; http://ned.ipac.caltech.edu/.
- 25
- 26
National Radio Astronomy Observatory.
- 27
The LAMOST archive includes an even earlier spectrum of this source, obtained 2 yr prior (2011 December 28). That spectrum also shows broad Balmer emission lines, similar to the LAMOST spectrum we use. However, it is significantly affected by spectral calibration issues, including residual (sky) spectral features and uncertain spectrophotometry. We thus decided to only use the latest LAMOST spectrum.
- 28
- 29
- 30
- 31
- 32
- 33
- 34
The data showing this secondary peak of AT 2017bgt were not available during the analysis of Trakhtenbrot et al. (2019b).