Abstract
Galaxy merger timescales are crucial for understanding and modeling galaxy formation in our hierarchically structured Universe. However, previous studies have reported widely varying dependencies of merger timescales on initial orbital parameters and mass ratios at the first crossing of rvir. Using IllustrisTNG simulations, we find that these dependencies vary with host halo mass, suggesting that discrepancies in prior studies may arise from differences in the systems analyzed. Specifically, in low-mass halos, merger timescales show a stronger dependence on initial orbital parameters, while, in high-mass halos, this dependence weakens. To account for these variations, we present a fitting formula that incorporates host mass dependence, achieving a logarithmic scatter smaller than 0.15 dex. Comparing dark-matter-only and baryonic simulations, we observe similar merger timescales for circular orbits but notable differences for radial orbits. In halos with Mhost < 1012.5h−1M⊙, mergers in dark-matter-only runs take longer than in baryonic runs, whereas the trend reverses in more massive halos. We attribute these differences to the competing effects of tidal disruption by central galaxy disks and the resistance of baryonic satellites to tidal stripping. Finally, we extend our model to predict merger timescales from any starting radius within the halo. By fitting the extended model to the entire infall sample, we find that using only the merger sample can underestimate merger timescales, particularly for low mass ratios. Our model provides a valuable tool for improving semianalytical and empirical models of galaxy formation.
Original content from this work may be used under the terms of the Creative Commons Attribution 4.0 licence. Any further distribution of this work must maintain attribution to the author(s) and the title of the work, journal citation and DOI.
1. Introduction
Galaxy mergers play a fundamental role in the hierarchical structure formation paradigm, shaping the evolution of galaxies over cosmic time (A. Toomre & J. Toomre 1972; S. D. M. White & M. J. Rees 1978; S. D. M. White & C. S. Frenk 1991; C. Lacey & S. Cole 1993). According to the ΛCDM model, galaxies grow through a combination of in-situ star formation and mergers. (H. Mo et al. 2010; V. Rodriguez-Gomez et al. 2016), making the study of mergers essential for understanding galaxy evolution. The timescale over which a merging satellite galaxy coalesces with its host influences various astrophysical processes, including star formation, black hole growth, and morphological transformation (P. F. Hopkins et al. 2006). Therefore, merger timescales are essential for semianalytical models of galaxy formation, as it controls the merger of the satellite thus determining the satellite abundance and also the processes mentioned above (S. D. M. White & C. S. Frenk 1991; G. Kauffmann et al. 1993; S. Cole et al. 2000; G. De Lucia & J. Blaizot 2007; Q. Guo et al. 2011; B. M. B. Henriques et al. 2015). However, despite its importance, accurately predicting merger timescales remains a complex challenge due to the interplay of gravitational dynamics, baryonic physics, and environmental factors.
Early studies of galaxy merger timescales, primarily based on numerical simulations and analytical models, focused on the role of dynamical friction in driving satellite galaxies toward their host centers. S. Chandrasekhar (1943) demonstrated that the influence of random encounters on an object moving through a homogeneous and isotropic distribution of lighter objects can be effectively approximated by a dynamical friction force:
where vsat and Msat are the velocity and mass of the object, ρhost(<vsat) is the density of background particles with velocities less than vsat, and  is the standard Coulomb logarithm, which quantifies the ratio between the maximum and minimum impact parameters that contribute significantly to effective encounters (S. Chandrasekhar 1943; S. D. M. White 1976; J. Binney & S. Tremaine 1987). Although Chandrasekhar’s formula relies on idealized approximations and requires knowledge of
  and the distribution function of lighter objects, it is physically well motivated and serves as a foundational framework for understanding dynamical friction acting on satellite galaxies.
Assuming a singular isothermal sphere (SIS) background density with a Maxwellian velocity distribution, J. Binney & S. Tremaine (1987) demonstrated that, for a nearly circular orbit, the merger timescale is given by
For a satellite beginning its infall at the virial radius, Mhost and rhost correspond to the host halo’s virial mass Mvir and virial radius rvir, respectively. Msat is the subhalo mass. The dynamical time is defined as  . C. Lacey & S. Cole (1993) extended this result to arbitrary orbits using the orbit-averaged approximation and derived
The parameter = jinfall/jc(E) represents the orbit’s circularity, where rc(E) and jc(E) are the radius and specific angular momentum of a circular orbit with the same energy E. Through numerical integration of the orbit-averaged equations, C. Lacey & S. Cole (1993) found that f(
) can be accurately approximated by f(
) ≈
0.78, with an accuracy better than 3%.
However, in reality, the situation is more complex, and the assumptions used above may not always hold. For example, tidal stripping can gradually reduce the satellite’s mass (J. E. Taylor & A. Babul 2001; F. M. Delfino et al. 2022; X. Du et al. 2024), an effect not accounted for in the previous calculations. Additionally, factors such as the nonspherical density distribution of host halos, the presence of substructures, the evolution of the host halo itself, and baryonic effects further complicate the merger process and are not considered in these simplified models. Therefore, to better formulate merger timescales using only initial conditions for easier application, many studies have attempted to derive more generalized fitting formulas based on N-body or hydrodynamic simulations. These efforts aim to provide a more realistic description of galaxy merger timescales (J. F. Navarro et al. 1995; M. Colpi et al. 1999; H. Velazquez & S. D. M. White 1999; G. Taffoni et al. 2003; M. Boylan-Kolchin et al. 2008; C. Y. Jiang et al. 2008; A. R. Wetzel & M. White 2010; V. Simha & S. Cole 2017; R. J. J. Poulton et al. 2021). The generalized fitting formulas are typically expressed as
where a common choice for the Coulomb logarithm is Λ = (1 + Mhost/Msat). For example, using idealized N-body simulations, M. Boylan-Kolchin et al. (2008) found that f() = e1.9
, with β = 1.3 and γ = 1.0. However, results from cosmological hydrodynamic simulations by C. Y. Jiang et al. (2008) indicate a much weaker dependence of merger timescales on initial orbits, with f(
) = 0.94
0.6 + 0.6, β = 1.0, and γ = 0.5. Furthermore, it is worth noting that R. J. J. Poulton et al. (2021) argued that, in cosmological N-body simulations, merger timescales primarily depend on the pericentric distance of satellites from the host center, suggesting that tidal disruption or heating near pericenter may play a significant role in determining merger timescales (J. E. Taylor & A. Babul 2001; F. C. van den Bosch et al. 2018).
The variation in results across different studies may suggest a fundamental limitation in the assumption that merger timescales are universally applicable to all host halos and satellites. This assumption implies that a single formula can accurately predict merger timescales based on initial conditions. However, discrepancies observed in various simulations indicate that additional factors may significantly influence these timescales. While the spherical density profile of dark matter halos exhibits a degree of universality (J. F. Navarro et al. 1997; Y. P. Jing & Y. Suto 2000), other factors that may influence merger timescales—such as the triaxial density profile (Y. P. Jing & Y. Suto 2002), halo formation history (R. H. Wechsler et al. 2002; D. H. Zhao et al. 2003, 2009), and galaxy properties (H. Mo et al. 2010)—depend on halo mass and the surrounding environment.
Therefore, in this paper, we investigate whether merger timescales are truly universal and, if not, seek to provide a more accurate description. To achieve this, we construct our merger samples using the IllustrisTNG magnetohydrodynamic cosmological simulations. Our findings reveal that the dependence of galaxy merger timescales on initial conditions varies with host halo mass, suggesting that the discrepancies observed in previous studies may stem from differences in the systems analyzed. We present a fitting formula that accounts for the dependence on host halo mass, enabling more accurate predictions of merger timescales. Moreover, we find that merger timescales differ between dark-matter-only (DMO) and baryonic runs. This difference also varies with host halo mass. Finally, we demonstrate that our fitting formula can be extended to predict merger timescales for events initiated at any radius within the host halo. By incorporating the entire infall sample into the extended model, rather than just the merger sample, we also assess the impact of sample selection effects.
We introduce the simulation data and merger samples in Section 2. In Section 3, we develop a halo mass–dependent model for merger timescales. The comparison between merger timescales in DMO and baryonic runs is presented in Section 4. In Section 5, we extend our model to arbitrary infall radii and study the sample selection effects. Finally, we provide a brief summary in Section 6.
2. Simulation Data
In this section, we provide a brief overview of the IllustrisTNG simulations. We also describe the methodology for constructing merger samples and deriving merger parameters.
2.1. IllustrisTNG
The IllustrisTNG simulations are a suite of magnetohydrodynamic cosmological simulations (F. Marinacci et al. 2018; J. P. Naiman et al. 2018; D. Nelson et al. 2018; A. Pillepich et al. 2018a; V. Springel et al. 2018; D. Nelson et al. 2019). These simulations are conducted using the moving-mesh code AREPO (V. Springel 2010) and incorporate a range of baryonic processes modeled as subgrid physics (R. Weinberger et al. 2017; A. Pillepich et al. 2018b). The cosmological parameters adopted in the simulations align with the Planck15 results (Planck Collaboration et al. 2016): Ωm = 0.3089, ΩΛ = 0.6911, Ωb = 0.0486, h = 0.6774, σ8 = 0.8159, and ns = 0.9667. Among the suite of simulations, we utilize the TNG100-1 and TNG300-1 runs for this study. The TNG100-1 simulation features a box size of 75h−1 Mpc, with 18203 dark matter particles and 18203 gas cells. This corresponds to mass resolutions of mDM = 5.05 × 10⁶h−1M⊙ for dark matter and average mgas = 9.44 × 10⁵h−1M⊙ for gas cells. The TNG300-1 simulation has a larger box size of 205h−1 Mpc, containing 25003 dark matter particles and 25003 gas cells, with mass resolutions of mDM = 3.98 × 10⁷h−1M⊙ for dark matter and average mgas = 7.44 × 10⁶h−1M⊙ for gas cells.
Dark matter halos in the simulation were identified using the Friends-of-Friends method, while subhalos were cataloged using the SUBFIND algorithm (V. Springel et al. 2001). Subhalos across different snapshots were linked by merger trees constructed with the SUBLINK algorithm (V. Rodriguez-Gomez et al. 2015), which traces their formation history by assigning a unique descendant (if one exists) from the subsequent snapshot to each subhalo based on a scoring system that considers shared particles.
2.2. Merger Samples
We use the DM-based SUBLINK merger tree to study the merger timescales of galaxies. We also tested the star- and gas-based merger trees and found minimal differences in the results. We define the infall time as the moment when the center of a subhalo crosses the virial radius rvir of its host halo. The virial radius, rvir, is the radius within which the mean mass density equals Δc (G. L. Bryan & M. L. Norman 1998) times the critical density of the Universe. In the SUBLINK merger tree, a merger is defined as the event in which two subhalos share the same descendant. For simplicity, we consider only mergers between a satellite subhalo and a central subhalo. Specifically, we include events where the descendant of the satellite subhalo lies in the main progenitor branch of the central subhalo at z = 0.
To ensure that both central and satellite galaxies are well resolved, we select host halos with virial masses Mvir(z = 0) > 1010.7h−1M⊙ for TNG100-1 and Mvir(z = 0) > 1011.7h−1M⊙ for TNG300-1 at z = 0, corresponding to more than 10,000 DM particles. Identifying satellite galaxies that have merged into central galaxies is nontrivial because of the challenges in robustly defining mergers in simulations. A merger, as defined by the SUBLINK merger tree, can correspond to one of three scenarios: a real merger, the actual disruption of a satellite (F. He et al. 2025), or the artificial disruption of a satellite (F. C. van den Bosch & G. Ogiya 2018). A real merger is typically defined as the point at which a large fraction of a satellite’s particles become mixed and indistinguishable from those of the central galaxy in phase space. In contrast, actual disruption refers to the physical disintegration of a satellite before its material merges with the central galaxy. The observed stellar streams in the Milky Way are remnants of such disruptions (K. Malhan et al. 2018). Artificial disruption, on the other hand, occurs when a satellite is entirely disrupted due to limited mass and force resolution; such satellites would remain intact in higher-resolution simulations. Distinguishing among these scenarios is essential for accurately studying galaxy merger timescales, since including artificial disruption events can significantly shorten the measured durations. Since distinguishing between real and artificial disruption is challenging, we first focus on genuine merger events. Results that include disruption cases will be discussed in Section 5.2. Therefore, following M. Boylan-Kolchin et al. (2008), we distinguish mergers from satellite disruptions using not only stellar mass or particle count but also the final specific angular momentum, jmerger, which, as shown by M. Boylan-Kolchin et al. (2008), is a better indicator than rmerger. In Figure 1, we show the joint distribution of the infall stellar mass of satellite galaxies  and the ratio jmerger/jinfall of their specific angular momentum before the merger to that at infall. The stellar mass of galaxies is defined as the total stellar mass enclosed within twice the stellar half-mass radius. We show the results for both TNG100-1 and TNG300-1 for all systems with zinfall < 4. It is evident that jmerger/jinfall decreases with increasing stellar mass. Moreover, at a fixed stellar mass, TNG100-1 exhibits, on average, lower jmerger/jinfall values compared to TNG300-1. This suggests that galaxies with fewer particles are more susceptible to disruption, consistent with the results reported in F. C. van den Bosch & G. Ogiya (2018). To construct the merger sample, we apply both stellar mass and angular momentum cuts, as indicated by the red lines in Figure 1. Specifically, we use an infall stellar mass cut of
  for satellite galaxies in TNG100-1 and
  for those in TNG300-1, along with an angular momentum cut of jmerger/jinfall < 0.1. This stellar mass cut ensures that infalling subhalos contain more than 200 star particles and 5000 dark matter particles, guaranteeing that the subhalos are well resolved and that baryonic effects are present. After applying the selection criteria, we identify a total of 3792 mergers in TNG100-1 and 22,635 mergers in TNG300-1.
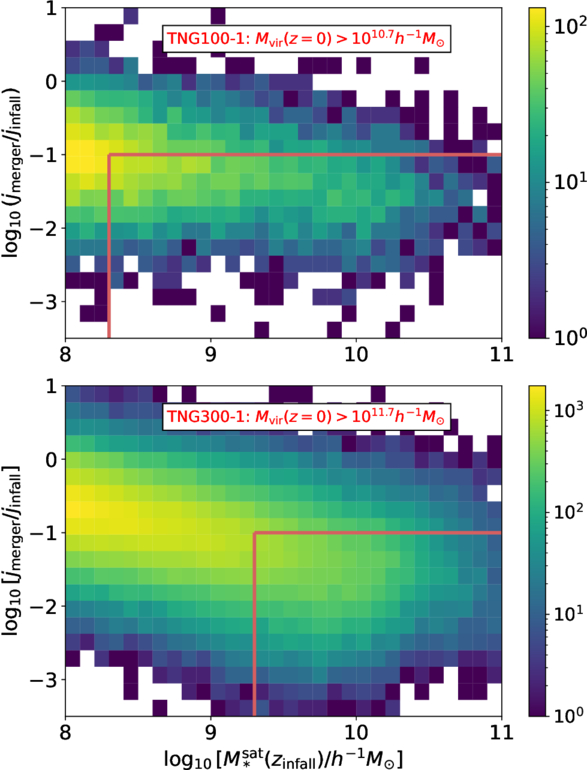
Figure 1. Joint distribution of the infall stellar mass of satellite galaxies  and the remaining fraction of specific angular momentum before the merger jmerger/jinfall. Results from TNG100-1 and TNG300-1 are displayed in the top and bottom panels, respectively, for systems with zinfall < 4. Red lines indicate the selection criteria used to construct our merger sample.
Download figure:
Standard image High-resolution image2.3. Merger Timescales and Orbit Parameters
Merger timescales refer to the time between a satellite’s infall into the host halo and its eventual disruption or merger with the central galaxy. The goal of this paper is to investigate the prediction of merger timescales for satellite galaxies based on their initial conditions at the time of infall. To achieve this, we calculate the infall and merger times, along with the orbital parameters and mass ratios at the infall time, for these satellite galaxies.
Since the simulations are stored in discrete snapshots, determining the exact infall and merger times requires approximations. For the infall time, we use the positions, velocities, and times of satellite galaxies from the snapshots immediately before and after infall. Assuming constant acceleration in the radial direction, we solve for the precise time at which the satellite galaxies first cross rvir of their host halos. For the merger time, following C. Y. Jiang et al. (2008), we adopt the midpoint between the snapshots immediately before and after the merger as the merger time. The dense sampling provided by the large number of snapshots results in a time interval of 0.1–0.2 Gyr between snapshots, which only significantly affects the rare, very fast merger events.
For the initial conditions, all quantities are calculated at the snapshot immediately preceding infall. Three sets of parameters are typically required to determine the merger timescale: the mass ratio Msat/Mhost, the orbit parameters Θ, and the dynamical time Tdyn. For the mass ratio, we define Mhost as the virial mass Mvir of the host halo and Msat as the bound subhalo mass of the satellite. The dynamical time Tdyn is defined as  , where rhost is the virial radius rvir of the host halos. For a spherical potential, the orbit of a satellite can be fully determined by its energy and angular momentum (E, L). In practice, two dimensionless quantities are commonly used:
 and rc(E)/rhost. Here,
= jinfall/jc(E) represents the circularity of the orbit, while rc(E) and jc(E) denote the radius and specific angular momentum, respectively, of a circular orbit with the same energy E. As in many studies (C. Lacey & S. Cole 1993; C. Y. Jiang et al. 2008; L. Jiang et al. 2015), we adopt an SIS potential for halos to calculate the initial orbit parameters, as it is more convenient than the Navarro–Frenk–White (NFW; J. F. Navarro et al. 1997) potential. The differences in orbit parameters between the SIS and NFW potentials have been explored in L. Jiang et al. (2015, see their Figure 11). While the NFW potential may be more realistic, we find that the parameters derived from the SIS potential already provide accurate predictions for merger timescales, as indicated by
 below. Given its simplicity and effectiveness, we retain the use of the SIS potential in our analysis.
In Figure 2, we show the distributions of the initial conditions Msat/Mhost, , and rc(E)/rhost for our merger samples. Despite the differences in the selection criteria for
 and Mvir between TNG100-1 and TNG300-1, their merger samples exhibit very similar initial distributions. Similar to C. Y. Jiang et al. (2008), most mergers in our sample have a mass ratio larger than 0.03, as smaller satellites cannot merge within a Hubble time. Additionally, we find that our merger sample exhibits smaller
 values compared to the complete infall sample studied in L. Jiang et al. (2015), while the rc(E)/rhost distribution is quite similar. This arises because radial orbits have shorter merger timescales and are more likely to be included in our merger sample. The impact of these selection effects on our results will be examined in Section 5.2 using the full infall sample rather than only the merger sample.
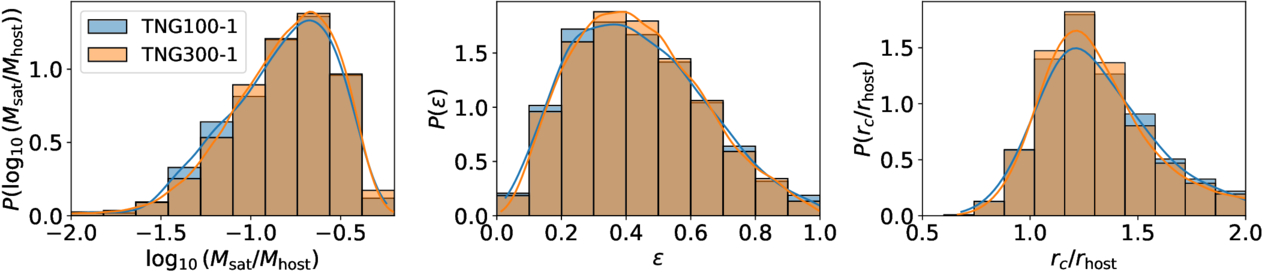
Figure 2. Distributions of  ,
, , and rc/rhost at the infall time for our merger samples in TNG100-1 (blue) and TNG300-1 (orange). The lines represent kernel density estimate distributions.
Download figure:
Standard image High-resolution image3. Predicting Merger Timescales
In this section, we present a model for predicting the merger timescales of satellite galaxies based on their initial conditions at infall. Additionally, we test the model’s universality and examine its dependence on host halo mass.
3.1. Modeling the Entire Merger Samples
As in previous studies (C. Y. Jiang et al. 2008; V. Simha & S. Cole 2017; R. J. J. Poulton et al. 2021), we begin by attempting to construct a universal model for the entire merger sample. We adopt the exponential form of f() from M. Boylan-Kolchin et al. (2008), as it provides a better fit to our results than alternative forms such as power laws. The merger timescale model we adopt is
Here, α, β, and γ control the dependence of merger timescales on orbital circularity, mass ratio, and orbital energy, respectively, while A serves as a normalization factor.
We fit this model to our merger samples from TNG100-1 and TNG300-1 separately using the following expression for chi-squared:
where N is the number of mergers in the sample, p is the number of free parameters,  represents the merger timescales calculated from simulations, and
  denotes the timescales predicted by the model. The χ2 is minimized using the Levenberg–Marquardt algorithm. We obtain the following best-fit parameters for TNG100-1:
with a logarithmic scatter of  . For TNG300-1, the best-fit parameters are
with a logarithmic scatter of  .
.
In Figure 3, we compare the merger timescales from simulations and best-fit models. Each component in Equation (5) is examined separately, with the simulation data showing merger timescales normalized by the best-fit models that exclude the corresponding component. We find that the dependence of merger timescales on all components—, Msat/Mhost, and rc/rhost—is well captured by Equation (5). The overall scatter in both TNG100-1 and TNG300-1 is small with
 smaller than 0.15, indicating that our model provides accurate predictions for merger timescales. However, although our model fits the merger timescales in both TNG100-1 and TNG300-1 samples well, the best-fit parameters differ, particularly for α, which describes the dependence on the orbit circularity
 . This suggests that galaxy merger timescales may not be universal and could depend on sample properties.
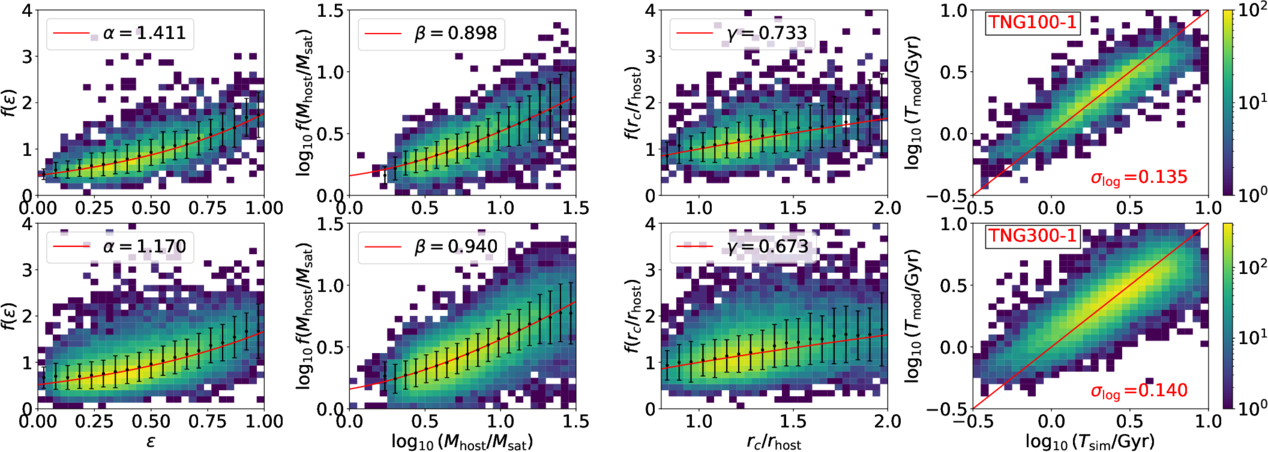
Figure 3. Comparison of the merger timescales from TNG100-1 (top) and TNG300-1 (bottom) with the best-fit models. The first three columns compare each component: Aeα,
 , and
, and  . In each case, the simulation data represents the merger timescales normalized by the best-fit models excluding the respective component. The last column compares the overall merger timescales between the simulation and the models. The figures are color-coded by the number of merger events.
Download figure:
Standard image High-resolution image3.2. Dependence on Infall Host Halo Mass
The differences in best-fit models between TNG100-1 and TNG300-1, along with inconsistencies in previous studies such as C. Y. Jiang et al. (2008) and M. Boylan-Kolchin et al. (2008), suggest that galaxy merger timescales may depend on sample properties. Therefore, we divide the merger samples from TNG100-1 and TNG300-1 into different infall Mhost bins and model them separately, as host halo mass is a fundamental property that influences key factors such as halo formation history, concentration, ellipticity, and subhalo distributions.
The best-fit parameters and their uncertainties are shown in Figure 4, while the data and best-fit models are presented in Figures A1 and A2, respectively. We find that the parameters indeed depend on Mhost, and the results in TNG100-1 and TNG300-1 are now consistent. Specifically, the orbital parameters α and γ decrease with increasing Mhost, while remaining relatively unchanged for Mhost < 1012M⊙. This suggests that the dependence of galaxy merger timescales on the initial orbit weakens in higher-mass host halos. For the mass ratio dependence, β increases slightly with Mhost, from 0.75 to approximately 0.9. Additionally, the scatter  also increases with Mhost, further indicating a weaker connection between merger timescales and initial conditions in more massive host halos.
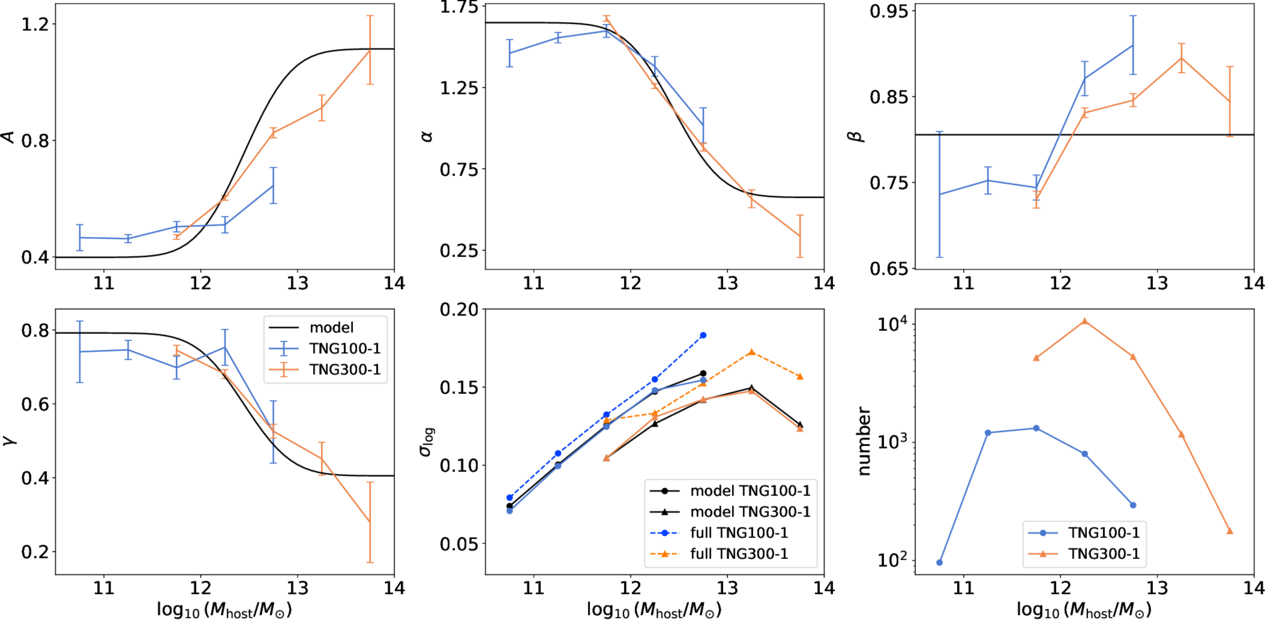
Figure 4. The dependence of galaxy merger timescale parameters on the infall host halo mass Mhost is shown. Results from TNG100-1 (blue) and TNG300-1 (orange) are presented separately, with the best-fit models shown as black solid lines.
Download figure:
Standard image High-resolution imageComparing our results with previous findings from C. Y. Jiang et al. (2008) and M. Boylan-Kolchin et al. (2008), we find that, for Mhost < 1012M⊙, the parameters α and γ approach the values of 1.9 and 1.0, respectively, as reported in the idealized simulations of M. Boylan-Kolchin et al. (2008). At higher host masses, our results align with the conclusion of C. Y. Jiang et al. (2008), which suggests that the dependence on initial orbital conditions becomes relatively weak. This may explain the discrepancies between these two studies as they are studying systems in different conditions. It is reasonable that in the idealized simulations of M. Boylan-Kolchin et al. (2008) merger timescales show the strongest connection to the initial conditions. In realistic simulations, violent processes in host halos, such as major mergers (N. E. Drakos et al. 2019a, 2019b) and interactions between satellite galaxies, can make the infall process more collisional, thereby erasing initial conditions and weakening their connection to merger timescales. For example, a sudden shift in the halo center position following a major merger can significantly weaken the connection, as it alters the reference frame used to calculate the orbital parameters. According to our results, these processes may occur more frequently in more massive host halos.
To characterize the dependence of merger timescales on Mhost, we parameterize A, α, β, and γ as functions of Mhost. Based on Figure 4, we adopt the following parameterization:
and a constant β = β1, where  is the error function, and
  is the complementary error function. These functional forms based on the error function are chosen to interpolate between two limiting cases: the strongest orbital dependence, as found in the idealized simulation by M. Boylan-Kolchin et al. (2008) with α = 1.9 and γ = 1.0, and the weakest case of no dependence, corresponding to α = 0 and γ = 0. Therefore, the model contains nine parameters:
  . We fit the model directly to the merger timescales of the combined TNG100-1 and TNG300-1 sample. The best-fit model is represented by black solid lines in Figure 4, with the corresponding parameters listed in the first row of Table 1. We find that the best-fit model generally follows the trends observed when modeling different Mhost bins separately. Additionally, we obtain a similar
  as in the Mhost bin results, indicating that our model provides a sufficiently accurate description.
Table 1. Descriptions and Best-fit Parameters of the Four Merger Timescale Models Constructed in This Study, Based on Different Samples, Starting Radii, and Model Parameterizations
| Sample | Start | Model | Ah |

|

|

| αh |

| γh |

| β1 | β2 | Mβ |
|---|---|---|---|---|---|---|---|---|---|---|---|---|---|
| merger hydro | rvir | Equations (5), (7) | 0.358 | 12.447 | 0.551 | 0.756 | 0.537 | 0.575 | 0.193 | 0.405 | 0.806 | … | … |
| merger DMO | rvir | Equations (5), (7) | 0.257 | 13.228 | 0.885 | 0.987 | 0.393 | 0.208 | 0.332 | 0.038 | 0.824 | … | … |
| merger hydro | any | Equations (7), (8), (10), (11), (12) | 0.360 | 12.376 | 0.605 | 0.833 | 0.406 | 0.700 | -0.026 | 0.892 | 0.814 | 94.736 | −0.456 |
| infall hydro | any | Equations (7), (8), (10), (11), (12) | 0.323 | 12.484 | 0.555 | 0.657 | 0.328 | 0.497 | 0.326 | 0.408 | 1.077 | 30.890 | −0.026 |
Note. The first two rows use the merger sample starting at rvir, from baryonic and DMO runs, respectively. The third uses the merger sample with arbitrary starting radii in baryonic runs. The fourth, recommended for general use, is based on the full infall sample with arbitrary starting radii in baryonic runs.
Download table as: ASCIITypeset image
In Figure 4, we also present  for different Mhost using the parameters from the full-sample fit shown in Figure 3. The
  from the full-sample model is higher than that from the Mhost-dependent model, confirming that incorporating Mhost dependence improves the model’s accuracy. We also note that TNG300-1 shows a smaller
  than TNG100-1 at fixed Mhost. This is because the merger samples in TNG100-1 span a broader mass ratio range—extending to lower values—due to a lower
  cut. If merger timescales retain some dependence on Msat, this broader range would naturally lead to a larger
  in TNG100-1, which appears to be the case. We do not pursue a detailed investigation of the Msat dependence, as the current model already yields a relatively low
  .
.
4. Comparison with Dark-matter-only Simulations
In this section, we examine the differences in galaxy merger timescales between dark-matter-only and hydrodynamic simulations and discuss the possible underlying causes.
4.1. Dark-matter-only Analogs
To investigate the differences between DMO and hydrodynamic simulations, we use the DMO simulations TNG100-1-Dark and TNG300-1-Dark, which serve as the DMO counterparts to TNG100-1 and TNG300-1. These simulations share the same cosmology, box sizes, and initial conditions. The mass resolutions of TNG100-1-Dark and TNG300-1-Dark are mDM = 6.00 × 10⁶h−1M⊙ and 4.73 × 10⁷h−1M⊙, respectively. IllustrisTNG provides matched catalogs between DMO and baryonic runs using the SUBLINK weighting algorithm, which is similar to the method used for tracking descendants across different snapshots within the same simulation.
4.2. Statistical Comparison
We start with a statistical comparison between DMO and baryonic runs, calculating merger timescales and their dependence on initial conditions in the DMO simulations using the same methodology as in the baryonic simulations. To construct the merger sample, we apply a selection similar to that in Figure 1. Specifically, we select host halos with virial masses of Mvir > 1010.7h−1M⊙ for TNG100-1-Dark and Mvir > 1011.7h−1M⊙ for TNG300-1-Dark at z = 0. Additionally, we require subhalo bound masses at the infall snapshot to be Msat > 1010.5h−1M⊙ for TNG100-1-Dark and Msat > 1011.5h−1M⊙ for TNG300-1-Dark. The same selection criteria of jmerger/jinfall < 0.1 and zinfall < 4 are also applied. Next, we calculate the merger timescales and initial conditions at the infall time and derive the merger timescale models for different infall host halo masses Mhost according to Equation (5). Similar to the baryonic runs, we fit the results from the DMO merger sample using the models in Equation (7). The best-fit parameters are provided in the second row of Table 1, and the corresponding best-fit models are shown in Figure 5.
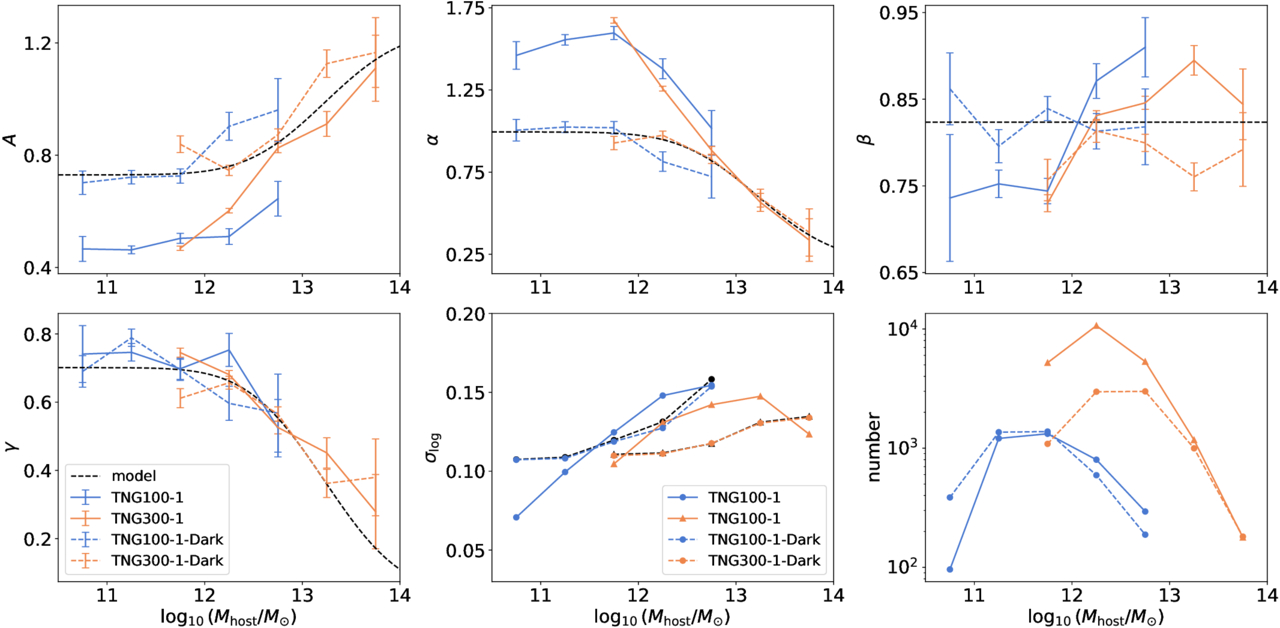
Figure 5. Comparison of merger timescale parameters between DMO (dashed lines) and hydrodynamic (solid lines) simulations in IllustrisTNG. The best-fit models for DMO merger samples are also shown with black dashed lines.
Download figure:
Standard image High-resolution imageFigure 5 compares merger timescale parameters between DMO and baryonic runs. We find that α is lower in DMO runs, with the difference increasing as Mhost decreases, while β and γ remain largely similar. As a result of the variation in α, the normalization parameter A also differs. To investigate the cause of this difference, we compare the best-fit models across different Mhost bins for TNG100-1-Dark and TNG100-1 in Figure A3, as well as for TNG300-1-Dark and TNG300-1 in Figure A4. We find that, in low-mass host halos, merger timescales in DMO simulations are generally longer than those in hydrodynamic simulations for highly radial orbits with smaller . To determine what is the cause of the difference, we further conduct a detailed one-to-one comparison of merger events in DMO and baryonic runs.
4.3. One-to-one Comparison
Since IllustrisTNG provides matched catalogs between DMO and baryonic runs, it offers a more effective way to study the factors influencing merger timescales through a one-to-one comparison. To match the events, we first identify the host halos in the DMO runs that correspond to those in the baryonic runs at z = 0. Then, for each merged satellite in the baryonic runs, we search for its DMO counterpart among the progenitors of the matched host halos at the satellite’s infall snapshot. Using this approach, we identify 3103 matched pairs out of 3792 in TNG100-1-Dark and 18,871 out of 22,635 in TNG300-1-Dark.
In the left panel of Figure 6, we compare the merger timescales Tbaryon from the baryonic runs with Tdark from the corresponding matched events in the DMO runs. The results exhibit a quantized pattern because merger times are determined using the midpoint between the snapshots immediately before and after the merger. The differences between baryonic and DMO runs appear larger for short-duration mergers, while they remain fairly consistent for long-duration mergers. This is consistent with the results of the statistical comparison, as short-duration mergers typically occur in more radial orbits with smaller . To better quantify the dependence of the merger timescale difference on Mhost and
, the middle panel presents the logarithmic difference
 across different Mhost and
 bins. For each event, we choose Mhost and
from the baryonic runs. We find that events with smaller
indeed exhibit larger differences. However, interestingly, events with large and small Mhost exhibit different trends. For Mhost < 1012.5h−1M⊙, merger timescales are larger in the DMO runs, whereas, for Mhost > 1012.5h−1M⊙, they are larger in the baryonic runs. Additionally, the magnitude of this difference increases toward both smaller and larger Mhost.
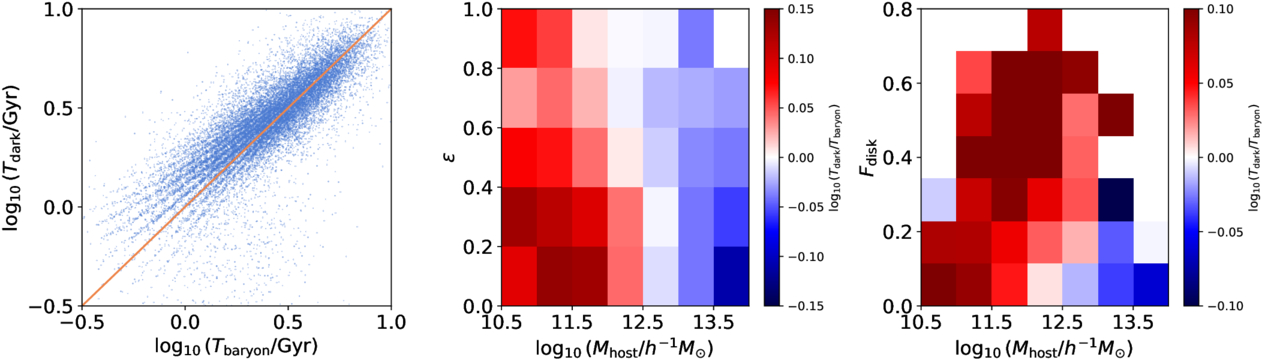
Figure 6. Comparison of merger timescales for matched events between DMO and baryonic runs. Left: direct comparison of merger timescales. Middle: logarithmic difference in merger timescales,  , binned by Mhost and
 . Right: logarithmic difference in merger timescales,
 , binned by Mhost and disk fraction Fdisk.
Download figure:
Standard image High-resolution imageThe differing impact of baryons on either side of Mhost ∼ 1012.5h−1M⊙ suggests that baryonic effects can influence merger timescales in multiple ways, either extending or shortening them. The dominant effect may vary depending on Mhost, leading to the observed trend. First, the presence of a disk structure in the central galaxy can more effectively disrupt infalling satellites, shortening merger timescales—particularly for those on radial orbits that pass through the central region (G. Toth & J. P. Ostriker 1992; H. Velazquez & S. D. M. White 1999; A. Helmi et al. 2003; S. Garrison-Kimmel et al. 2017; J. Samuel et al. 2020). Second, the presence of baryons in the satellite galaxy may increase the inner density of the subhalo, making it more resistant to tidal disruption. If the tidal forces in the inner region of the host halo are strong enough to disrupt the subhalos in DMO simulations, the survival of the corresponding subhalo in baryonic simulations may lead to longer merger timescales. However, if the tidal forces are not strong enough to completely disrupt the subhalo but instead significantly reduce its mass in the DMO simulation, longer merger timescales in DMO runs are expected, as reported in M. Boylan-Kolchin et al. (2008). Finally, in halos hosting high-mass elliptical galaxies, strong feedback from the supermassive black hole reduces the matter density in the central region of the host halos (K. Xu et al. 2024, see their Figure 17), primarily within r < 100h−1 kpc. This reduction in density may weaken the deceleration caused by dynamical friction, as described by Chandrasekhar’s formula, leading to an increase in merger timescales.
Since one of the most significant differences between low- and high-mass galaxies is their morphology—where high-mass galaxies are mostly elliptical while low-mass galaxies are predominantly disk shaped—we suspect that the difference in merger timescales for low-mass halos is due to the impact of their disk structure. To support this hypothesis, the right panel of Figure 6 presents the logarithmic difference in merger timescales,  , across different Mhost and Fdisk bins, where Fdisk represents the disk-to-total stellar mass fraction of the central galaxy at the merger snapshot (S. Genel et al. 2015). Disk particles are identified based on the criterion Jz/J(E) > 0.7, where Jz is the specific angular momentum of the particle, and J(E) is the expected angular momentum for a circular orbit at the same location. We find that
  depends on Fdisk, with larger values observed for higher Fdisk, partially supporting our hypothesis. For high-mass halos, we believe that the resistance of baryons to tidal disruption may be the dominant effect, as many subhalos are disrupted much more quickly in DMO runs. This is evident in the left panel of Figure 6, where numerous events exhibit
  in the DMO runs but
  in the baryonic simulations.
We conduct a more detailed analysis by comparing the infall history of matched merger events in DMO and baryonic runs. Figure 7 presents two matched events, one in a low-mass host halo hosting a central disk galaxy and the other in a high-mass host halo with a central elliptical galaxy. These two events have similar initial conditions, with ∼ 0.13 and Msat/Mcen ∼ 0.1. The selected events have relatively radial orbits, which exhibit more pronounced differences between the two runs. The mass ratios are chosen to ensure sufficiently long merger histories for clearer illustration, while avoiding rare cases with very small mass ratios. Notably, the differences between the DMO and baryonic runs exhibit opposite trends in high-mass and low-mass halos. In the low-mass halo, the subhalo in the baryonic run loses a significant amount of mass after its first pericenter passage and merges with the central galaxy immediately after the second passage. In contrast, in the DMO run, the subhalo survives through four pericenter passages. In the high-mass halo, the subhalo in the DMO run experiences a more rapid loss of mass and sinks to the center faster than in the baryonic run.
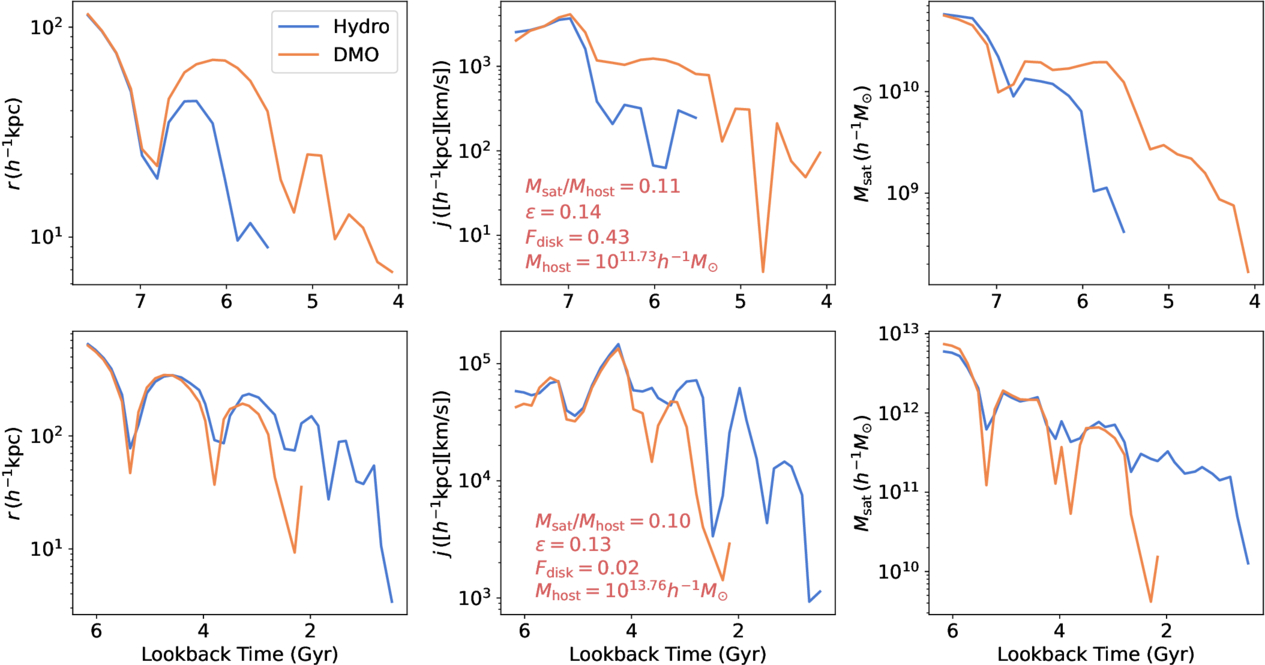
Figure 7. Comparison of the infall history of two matched events between DMO and baryonic runs. One occurs in a low-mass halo (Mhost = 1011.73h−1M⊙) hosting a central disk galaxy (Fdisk = 0.42) in the baryonic run, while the other takes place in a massive halo (Mhost = 1013.76h−1M⊙) with a central elliptical galaxy (Fdisk = 0.02). Both events have similar radial orbits ( ∼ 0.13) and mass ratios (Msat/Mhost ∼ 0.1). The figure shows the trajectories r (left), the evolution of specific angular momentum j (middle), and the bound mass of the satellite (right) for each event.
Download figure:
Standard image High-resolution imageWhile this analysis supports our hypothesis, further controlled experiments are necessary for a more comprehensive understanding, given the highly chaotic nature of the processes and the numerous influencing factors. Additionally, a thorough investigation is needed to determine whether these effects are physical or merely numerical artifacts.
5. Models for Arbitrary Starting Radii and Selection Effects
In this section, we extend the merger timescale model to include mergers starting at arbitrary starting radii. Using this revised model, we examine selection effects on merger timescale results by comparing the model derived from the merger sample with that from the entire infall sample.
5.1. Extension to Arbitrary Starting Radii
Since dark matter halos exhibit universal density profiles (J. F. Navarro et al. 1997), a natural question arises: can our model be extended to merger events initiated at any radius within the halo, as the inner regions of halos can be considered as new halos with different overdensities (accounted by Tdy) and concentrations? Some studies have claimed a validation for their models (V. Simha & S. Cole 2017; R. J. J. Poulton et al. 2021). Therefore, we extend our model in Equation (5) to estimate merger timescales for any initial starting radius r as follows:
where Mhost(<r) is the mass of the halo enclosed within the radius r, ![${T}_{{\rm{dyn}}}(r)=\sqrt{{r}^{3}/[G{M}_{{\rm{host}}}(\lt r)]}$](https://content.cld.iop.org/journals/0004-637X/986/2/201/revision2/apjadd5f6ieqn42.gif) is the dynamical time, Msat represents the bound mass of the subhalo, and the orbital parameters
is the dynamical time, Msat represents the bound mass of the subhalo, and the orbital parameters and rc are still computed using the SIS potential for convenience, constrained by (r, Mhost(<r)). We first maintain the mass ratio dependence as g(x) = xβ. The mass dependence of α, β, and γ is preserved as a function of the virial mass at the first crossing of rvir, following Equation (7), with the best-fit values given in the first row of Table 1.
To test the model, we use the merger sample from TNG100-1 and TNG300-1. For each event, we treat each intermediate snapshot during its infall history as the starting point of a new event and compute the corresponding initial conditions and merger timescales. This process requires particle data from each snapshot to determine Mhost(<r). In Figure 8, we present the logarithmic difference,  , between simulation results and model predictions from Equation (8). This difference is shown as a function of
 , mass ratio Msat/Mhost(<r), orbit energy rc/r, host halo mass Mhost,0 at the time of crossing rhost,0 = rvir, and starting radius r. We find that, after entering the halo (
 ), our extended model underestimates the merger timescales, suggesting a transition before and after infall. Moreover, our model significantly overestimates the merger timescales for mass ratios <10−2, where fewer cases were present in the previous sample used for parameter constraints. This may be reasonable, as subhalos in low mass ratio events experience weaker dynamical friction but are more susceptible to disruption. As a result, this effect may cause events with low mass ratio to deviate from the previous mass dependence.
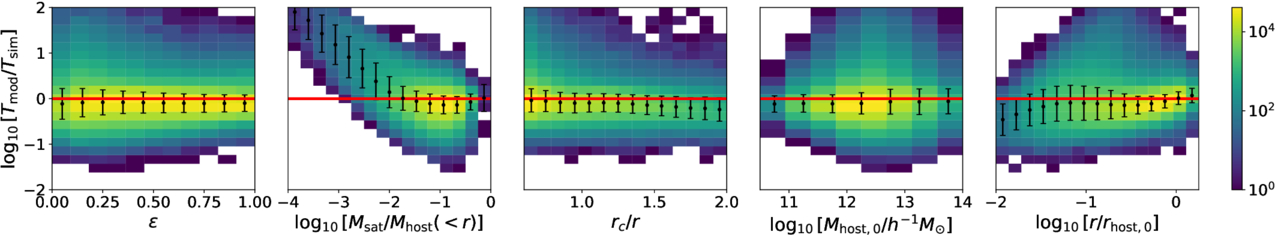
Figure 8. Comparison of merger timescales starting at any radius between simulation results and model predictions using best-fit parameters from those starting at rvir. The logarithmic difference, ![${\mathrm{log}}_{10}[{T}_{{\rm{mod}}}/{T}_{{\rm{sim}}}]$](https://content.cld.iop.org/journals/0004-637X/986/2/201/revision2/apjadd5f6ieqn45.gif) , is shown as a function of orbit circularity (
, is shown as a function of orbit circularity (), mass ratio (Msat/Mhost(<r)), orbit energy (rc/r), host halo mass at the time of crossing rvir (Mhost,0), and infall radius (r). The figures are color-coded by the number of arbitrary starting merger events.
Download figure:
Standard image High-resolution imageTo better describe the merger timescales for events starting at any radius within the halo, we introduce a correction based on r and adjust the mass ratio dependence at the low-mass end. We find that the dependence of  on r originates from Mhost(<r). Figure 9 shows Mhost(<r)/Mhost,0 as a function of r/rhost,0 for our merger sample. The fraction Mhost(<r)/Mhost,0 increases with r/rhost,0, following a power-law trend up to r/rhost,0 ∼ 10−0.5, beyond which the growth gradually slows down. This is due to the halo’s nonspherical mass distribution and boundary. As r approaches rvir, the enclosed sphere extends beyond the irregular halo boundary, capturing little additional mass and slowing the total mass increase. If Mhost(<r) determines the merger timescale, this is not an issue. However, if the relevant factor is not the enclosed spherical mass but an alternative effective mass, such as the elliptical mass, this trend could introduce a bias across different r, as demonstrated in Figure 8. This bias can be corrected by defining an effective host halo mass. The relationship between Mhost(<r)/Mhost,0 and r/rhost,0 is well described by
with best-fit parameters rt = 0.833 and η = 1.257. Based on this relation, we define a correction factor
which is normalized such that fc(1) = 1, ensuring consistency with our previous results. The effective host halo mass is then defined as fcMhost(<r), which is also presented in Figure 9. To better capture the mass ratio dependence, motivated by the power-law upturn bias seen in Figure 8, we replace ![${[{M}_{{\rm{host}}}(\lt r)/{M}_{{\rm{sat}}}]}^{\beta }$](https://content.cld.iop.org/journals/0004-637X/986/2/201/revision2/apjadd5f6ieqn47.gif) with a double power-law form:
with a double power-law form:
where Mratio = Mhost(<r)/Msat. We test replacing Mhost(<r) with fcMhost(<r) in Mratio, Λ, and Tdy and find that only Tdy requires modification. Adjusting the other components has negligible or adverse effects on the results. Therefore, we define a new Tdy as
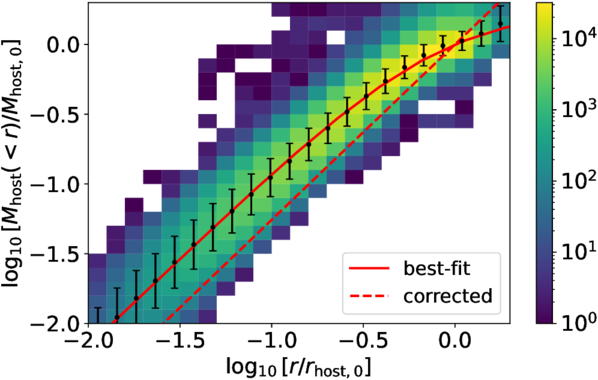
Figure 9. The enclosed mass fraction, Mhost(<r)/Mhost,0, is shown as a function of the infall radius, r/rhost,0. The red solid and dashed lines represent the best-fit and corrected relation. The figures are color-coded by the number of arbitrary starting merger events.
Download figure:
Standard image High-resolution imageBy combining Equations (7), (8), (10), (11), and (12), we develop a model to describe merger timescales for mergers starting at arbitrary starting radii. This model includes 11 parameters:  . When including rt and η, the total number of parameters increases to 13. We fit this new model to the merger sample starting at arbitrary starting radii. The best-fit parameters are listed in the third row of Table 1, and the residuals as a function of various parameters are shown in Figure 10. Our new model effectively describes the merger timescales for the arbitrary starting radius sample, achieving
  , with the scatter showing little to no dependence on any parameters. In Figure 10, we also show the scatter for the best-fit model without the correction for Tdy in the r/rhost,0 panel. Including this correction really helps reduce the bias dependence on r/rhost,0. In the new model, we find a weaker dependence of α and γ on Mhost,0 compared to the previous model, with αh = 0.406 (previously 0.537) and γh = −0.026 (previously 0.193). Notably, γ now shows almost no dependence. This suggests that Mhost,0 may not be a reliable indicator of system variation for mergers that do not start at rvir, and more fundamental parameters might be needed. However, since our model already performs well and Mhost,0 remains the most accessible quantity, we do not explore alternative options.
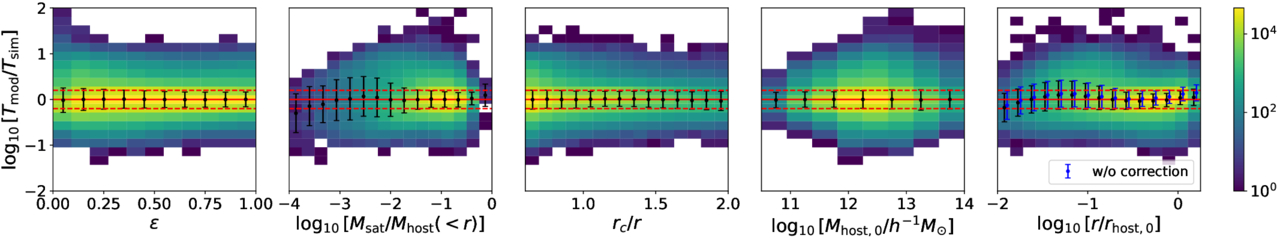
Figure 10. Similar to Figure 8, but showing a comparison between simulation results and predictions from the new model, which combines Equations (7), (8), (10), (11), and (12). For reference, the last panel also presents the best-fit results for the model without corrections from Equation (12) for Tdy. The red dashed lines indicate scatter values of −0.2 and 0.2. The figures are color-coded by the number of arbitrary starting merger events.
Download figure:
Standard image High-resolution image5.2. The Entire Infall Sample and Selection Effects
One remaining concern regarding our merger timescale results is selection effects, a common issue in studies of merger timescales using cosmological simulations. Since we only analyze satellites that have already merged with centrals, our sample is likely biased toward events with shorter merger timescales. If this sample is taken as a representative of all infall events, our model may underestimate the true average merger timescales. With the model for arbitrary starting radii, we can now use the entire infall sample—whether the satellites have merged, have been disrupted, or are still surviving—to study selection effects. This is possible because our model allows us to predict merger timescales for any two points in an event’s timeline and compare the predicted time intervals with those from simulations. As a result, satellites do not need to have already merged with the central to be included in the analysis.
To construct the infall sample, we select all satellites that have crossed rvir after z = 4, using only the mass selection criterion as before: Mvir(z = 0) > 1010.7h−1M⊙ and  for TNG100-1, and Mvir(z = 0) > 1011.7h−1M⊙ and
  for TNG300-1. In Figure 11, we present the distributions of the initial properties—
 ,
, , and rc/rhost—at the time of first crossing rvir for the infall sample. We also show the contributions from three subsamples: satellites that have merged with the centrals (
 ), those that have been disrupted (
 , regardless of whether the disruption is physical or artificial), and those that are still surviving at z = 0. If we use only the merger sample instead of the full infall sample as before, we tend to select satellites with higher mass ratios, more radial orbits, and possibly shorter merger timescale events for the same initial conditions, which may bias our model toward underestimating merger timescales.
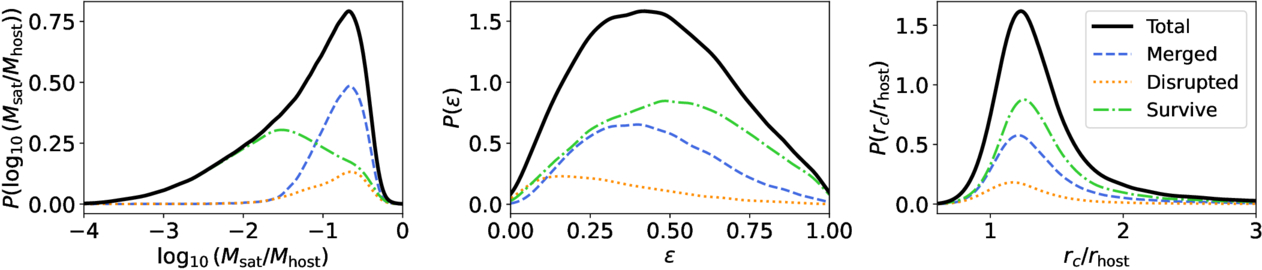
Figure 11. Distributions of  ,
, , and rc/rhost at the time of first crossing rvir for our entire infall samples, combining TNG100-1 and TNG300-1. The distributions are further divided into three subsamples: merged (jmerger/jinfall < 0.1), disrupted (jmerger/jinfall > 0.1, regardless of whether the disruption is physical or artificial), and still surviving at z = 0.
Download figure:
Standard image High-resolution imageTherefore, we refine our model by incorporating the entire infall sample. For the merger sample, we maintain the previous approach, requiring only the prediction of the merger timescale at the infall time, Tmerger(tinfall), where tinfall is defined as the time of first crossing rvir. For the disruption and surviving samples, we predict both Tmerger(tinfall) and Tmerger(t50), where t50 is the last time the subhalo contained more than 50 particles. If the subhalo still has more than 50 particles at z = 0, then t50 corresponds to the present time. The requirement of at least 50 remaining particles is imposed to reduce numerical artifacts. With these predictions, we compute ΔTmerger = Tmerger(tinfall) − Tmerger(t50) from our model and compare it with simulation results. For the merger sample, ΔTmerger simply equals Tmerger(tinfall). We have also tested t100 and found similar results, confirming the robustness of this choice.
We first assess whether our previously derived arbitrary starting radii model, based on the merger sample, accurately predicts ΔTmerger for the entire infall sample. Figure 12 compares model predictions of ΔTmerger with simulation results. Overall, the model performs well across all three subsamples, except when the mass ratio is very small (Msat/Mhost < 10−3). For the merger sample, Tmerger from simulations is generally slightly shorter than the model predictions, with discrepancies reaching 0.2 dex for Msat/Mhost < 10−2. This aligns with expectations, as the merger sample tends to favor shorter merger timescales. Despite being calibrated on the merger sample, the model’s ability to incorporate information from arbitrary radii appears to mitigate selection effects, likely due to the collisional nature of the merger process.
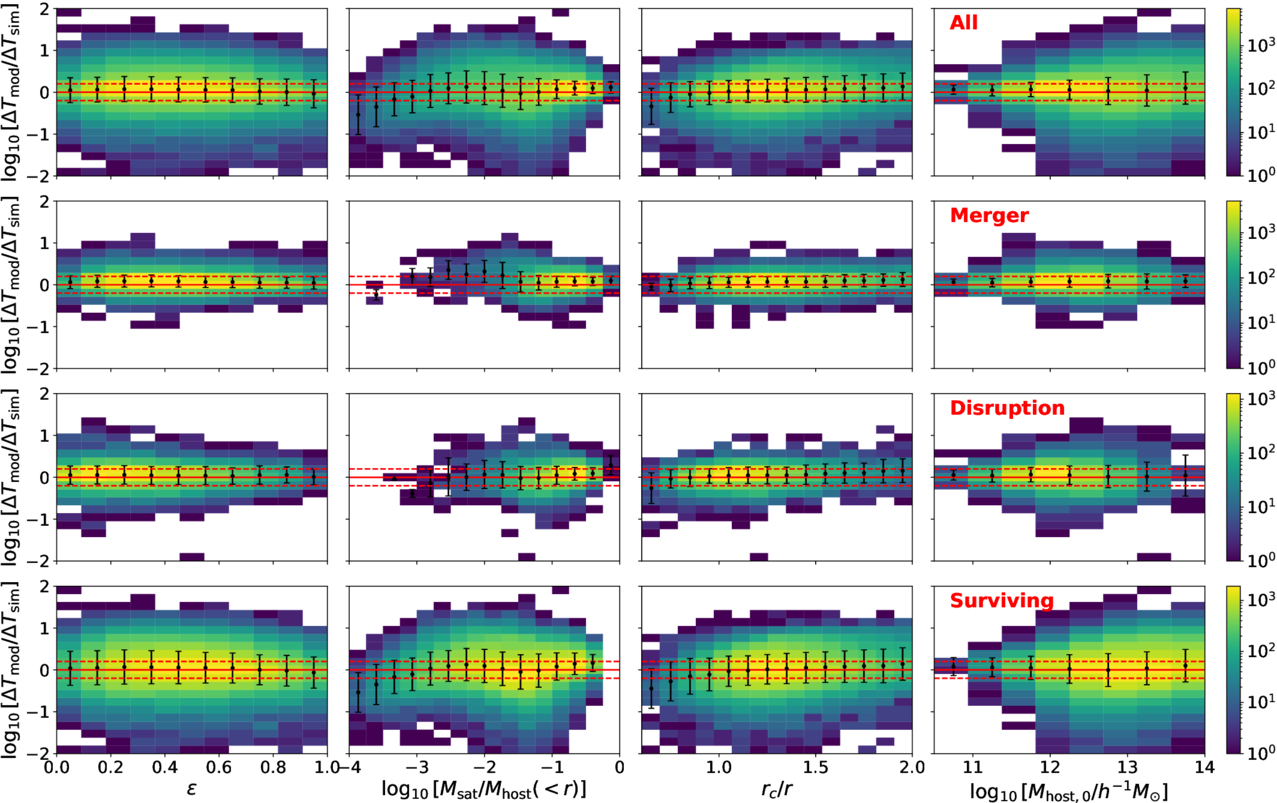
Figure 12. Comparison of ΔTmerger between simulation results and model predictions using the best-fit model derived from the merger sample started at arbitrary radii (third row of Table 1). The logarithmic difference, ![${\mathrm{log}}_{10}[{\rm{\Delta }}{T}_{{\rm{mod}}}/{\rm{\Delta }}{T}_{{\rm{sim}}}]$](https://content.cld.iop.org/journals/0004-637X/986/2/201/revision2/apjadd5f6ieqn56.gif) , is shown as a function of orbit circularity (
, is shown as a function of orbit circularity (), mass ratio (Msat/Mhost( < r)), orbit energy (rc/r), and host halo mass at the time of crossing rvir (Mhost,0). Results for the whole infall sample, merger sample, disruption sample, and surviving sample are presented in different rows. The red dashed lines indicate scatter values of −0.2 and 0.2. The figures are color-coded by the number of infall events.
Download figure:
Standard image High-resolution imageWe refine our model by fitting ΔTmerger from the entire infall sample, using the same framework as the arbitrary starting radii model. The best-fit parameters are listed in the fourth row of Table 1, and Figure 13 compares model predictions with simulation results. The new model shows improved accuracy, particularly for low mass ratios (Msat/Mhost < 10−3) and high rc/r, with an average logarithmic scatter of  for the entire infall sample. For Msat/Mhost < 10−2, Tmerger from the merger sample remains 0.2 dex lower than the model prediction, highlighting the presence of selection effects. This also indicates that incorporating the entire infall sample into the fitting framework effectively reduces selection effects. However, this comes at the cost of increased scatter due to the need for predictions at two different times.
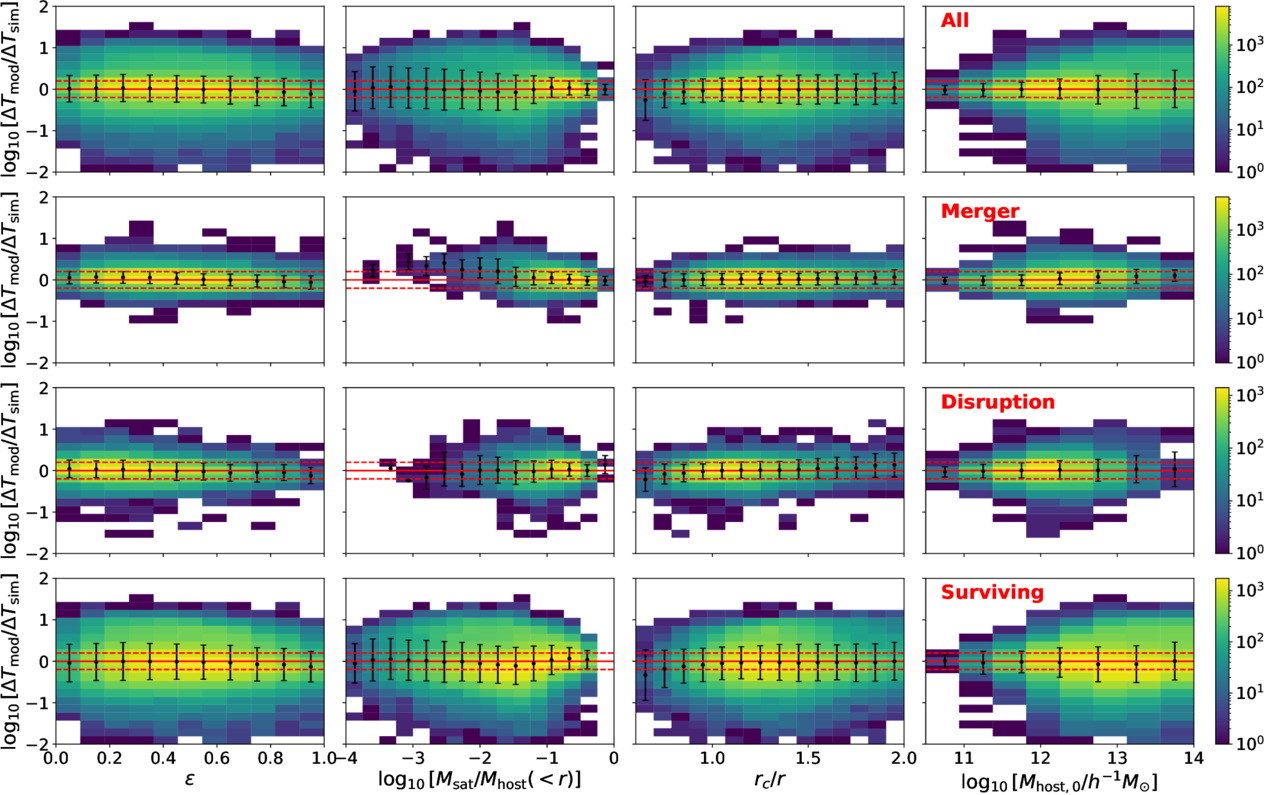
Figure 13. Similar to Figure 12, but here, the simulation results are compared to the best-fit model derived from fitting the whole infall sample (fourth row of Table 1). The figures are color-coded by the number of infall events.
Download figure:
Standard image High-resolution image6. Conclusion and Discussion
In this paper, we investigate galaxy merger timescales in the IllustrisTNG simulations and develop models that predict merger timescales based on the initial conditions—Msat/Mhost, , and rc(E)/rhost—when the satellite first crosses rvir. Our model is further extended to describe merger events initiated at arbitrary radii within the host halo. Additionally, we examine the impact of halo formation history (characterized by halo mass), baryonic effects, and sample selection on merger timescales. We summarize our results as follows.
- 1.Using merger samples from TNG100-1 and TNG300-1, we find that the dependence of merger timescales on initial conditions is not universal, with massive halos exhibiting a weaker dependence on orbital parameters. This may be due to more violent processes, such as major mergers and subhalo interactions, which make the infall process more collisional and weaken its connection to initial conditions. To account for this, we introduce an Mhost-dependent model that accurately predicts merger timescales across host halos of different masses.
- 2.Compared to baryonic runs, merger timescales in DMO runs are similar for circular orbits but show larger differences for radial orbits. In low-mass halos (Mhost < 1012.5h−1M⊙), mergers in DMO runs have longer timescales than in baryonic runs, whereas, in high-mass halos (Mhost > 1012.5h−1M⊙), the trend reverses. This may be because, in low-mass halos, the central galaxy’s high Fdisk leads to a disk structure that more effectively disrupts satellites. In high-mass halos, however, the resistance of baryons within satellites to tidal disruption may become the dominant effect.
- 3.With a slight modification to the mass ratio dependence, our model can be extended to merger events originating from any radius within the halo. Using this new model, we investigate selection effects on merger timescale predictions by incorporating the entire infall sample into the fitting, rather than just the merger sample. We find that relying solely on the merger sample leads to an underestimation of average merger timescales, particularly for low-mass-ratio events with Msat/Mhost < 10−2. In contrast, our model, derived from the full infall sample, provides a more unbiased prediction.
- 4.Table 1 presents four best-fit models for merger timescales, each derived from different samples. We recommend using the fourth model, which is based on the entire infall sample and applicable to any starting radius. The other models may still be useful for specific cases.
Our results indicate that merger timescales may be influenced by the formation history of halos and baryonic effects, potentially explaining the discrepancies among previous studies that examined different types of systems. Additionally, selection effects should be carefully considered in related studies to ensure accurate predictions.
Our models for galaxy merger timescales, presented in Table 1, serve as valuable tools for semianalytical and empirical models of galaxy formation. The evolution of subhalos (satellites) is a crucial component of hierarchical structure formation. Unlike halo formation and evolution—where physically motivated semianalytical models such as the Press–Schechter framework (W. H. Press & P. Schechter 1974; J. R. Bond et al. 1991; C. Lacey & S. Cole 1993) provide theoretical guidance—subhalo evolution after halo mergers is highly nonlinear and chaotic, making it challenging to model without numerical experiments (J. E. Taylor & A. Babul 2001; S. Kazantzidis et al. 2004; J. Han et al. 2016; N. E. Drakos et al. 2022; J. Stücker et al. 2023). The merger timescale is a key parameter in determining subhalo abundance, making our models an essential input for semianalytical and empirical approaches to galaxy formation. Moreover, even in high-resolution numerical simulations, halos are more resilient to numerical artifacts than subhalos. The abundance and distribution of halos can converge with as few as 10–20 particles (Y. Jing 2019). However, for subhalos, the high-density environment within host halos leads to rapid tidal disruption, requiring at least 50 particles for a robust simulation of subhalo evolution (F. C. van den Bosch & G. Ogiya 2018; F. He et al. 2025), which can be computationally inefficient. In practice, the most bound particles of artificially disrupted subhalos are often tracked to approximate their unresolved evolution, but their survival time must be estimated carefully, as these particles may experience significantly weaker dynamical friction than fully resolved subhalos. If merger timescales are not considered when determining subhalo survival, their abundance may be overestimated. Thus, our galaxy merger timescale models play a crucial role in improving the accuracy of galaxy formation modeling.
Our merger timescale model is also useful for inferring galaxy merger rates from observed close pairs (M. G. Kitzbichler & S. D. M. White 2008; C. Y. Jiang et al. 2014), which play a key role in the ex situ growth of galaxies. Estimating galaxy merger rates typically involves identifying galaxy pairs and determining merger timescales as a function of separation distance, where our model with arbitrary starting radii can provide valuable input (L. Ferreira et al. 2020; A. Whitney et al. 2021). Moreover, the galaxy merger timescales defined in our study effectively represent the delay between halo mergers and the corresponding galaxy mergers. As such, they can be useful for inferring the halo merger rate, which is not directly observable but is closely linked to cosmological parameters (Y. Amoura et al. 2024).
Acknowledgments
We thank the anonymous referee for the detailed and valuable comments that helped improve the manuscript. We thank Jiaxin Han, Shaun Cole, and Carlos Frenk for their valuable discussions. We also appreciate Dylan Nelson and Vicente Rodriguez-Gomez for their assistance in accessing the merger trees of IllustrisTNG. K.X. is supported by the funding from the Center for Particle Cosmology at U Penn. Y.P.J. is supported by NSFC (12133006, 11890691), by National Key R&D Program of China (2023YFA1607800, 2023YFA1607801), by grant No. CMS-CSST-2021-A03, and by 111 project No. B20019. This work made use of the Gravity Supercomputer at the Department of Astronomy, Shanghai Jiao Tong University.
Appendix: Validation of Fits
In this section, we validate the merger timescale fits across different Mhost bins. Results for TNG100-1, TNG300-1, TNG100-1-Dark, and TNG300-1-Dark are shown in Figures A1, A2, A3, and A4, respectively.
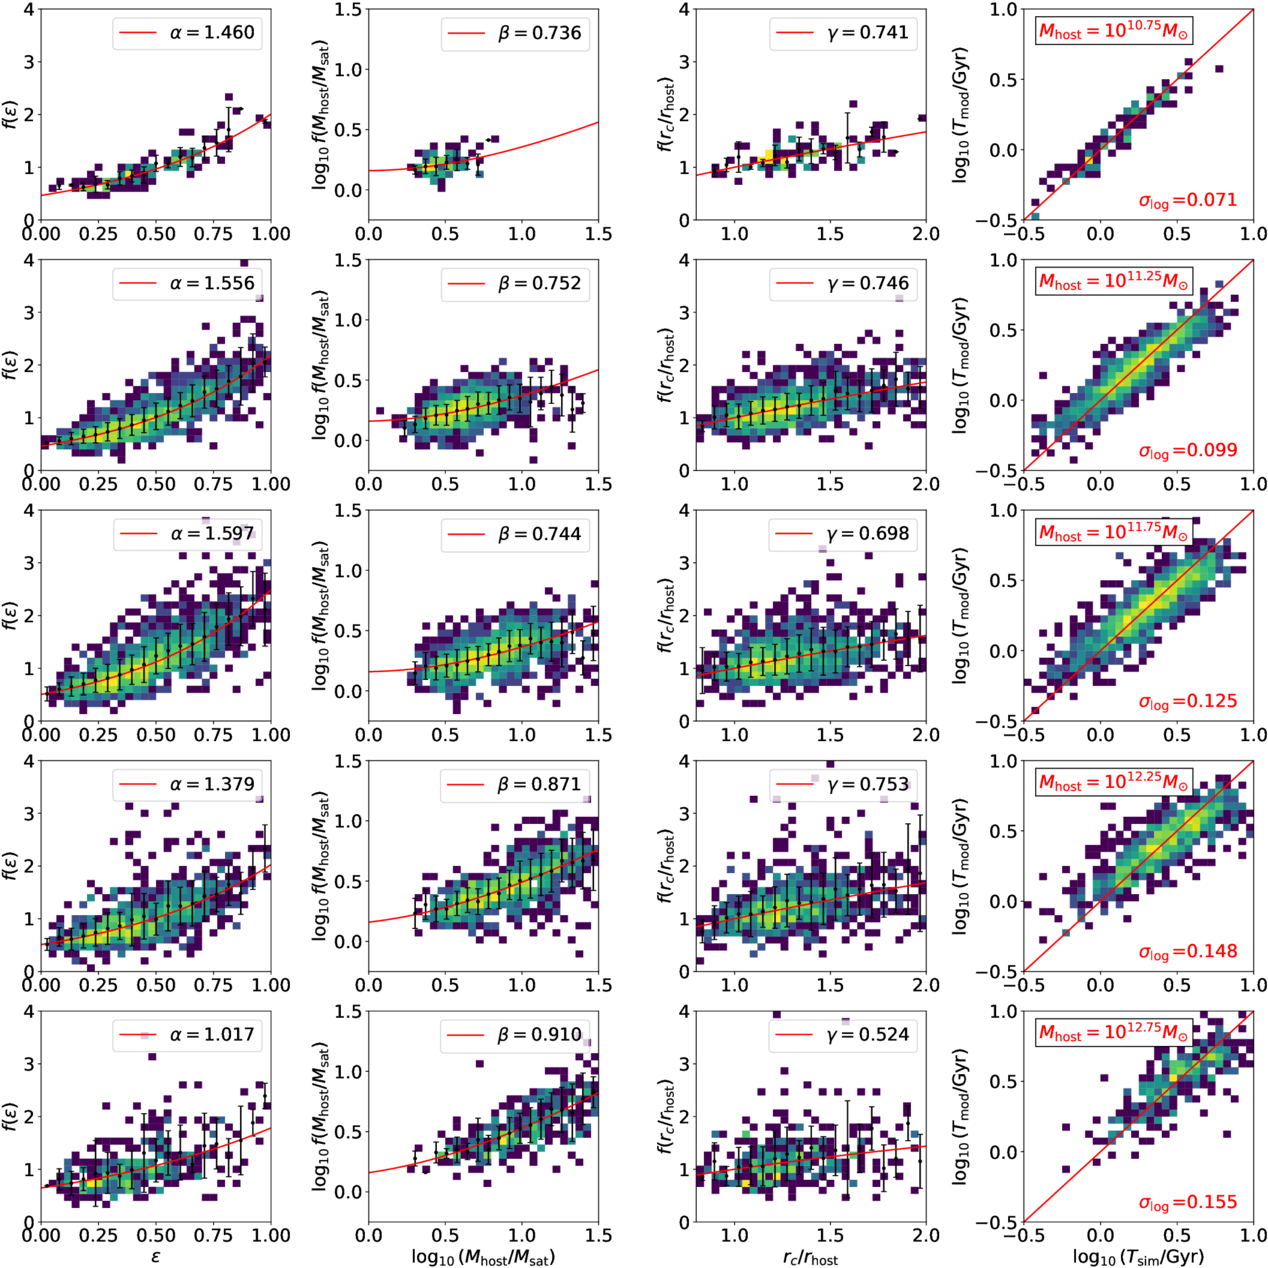
Figure A1. Similar to Figure 3, but for the TNG100-1 sample divided into different Mhost bins.
Download figure:
Standard image High-resolution image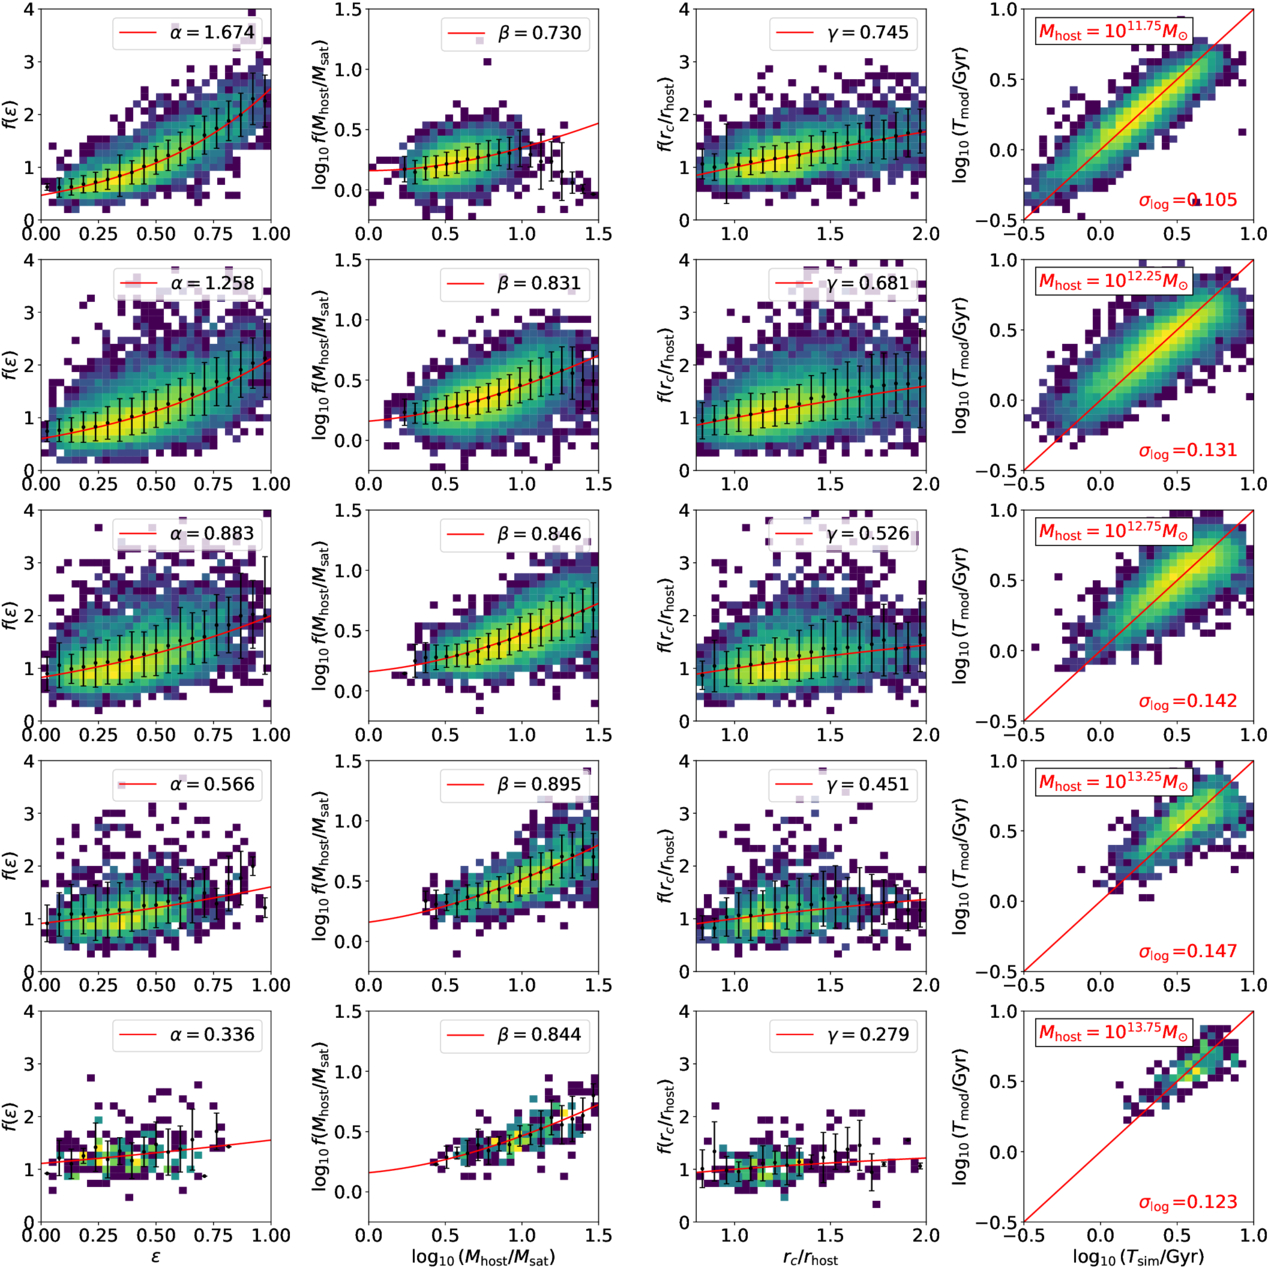
Figure A2. Similar to Figure 3, but for the TNG300-1 sample divided into different Mhost bins.
Download figure:
Standard image High-resolution image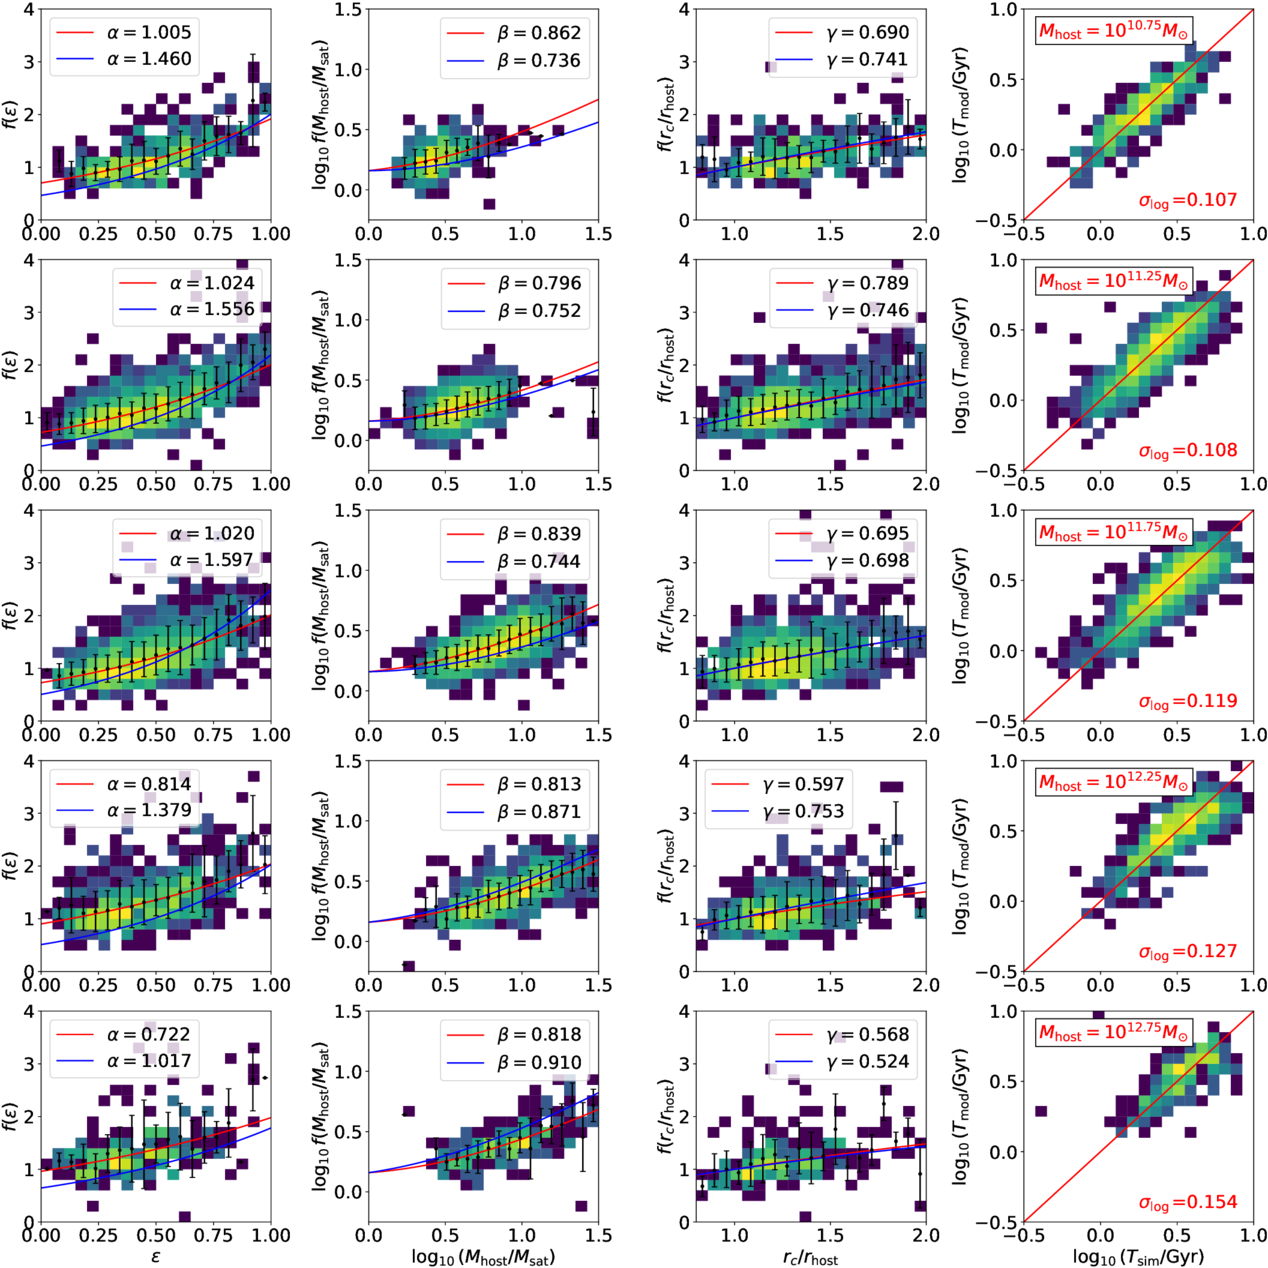
Figure A3. Similar to Figure 3, but for the TNG100-1-Dark sample divided into different Mhost bins. The best-fit models from TNG100-1 are also shown in blue lines for comparison.
Download figure:
Standard image High-resolution image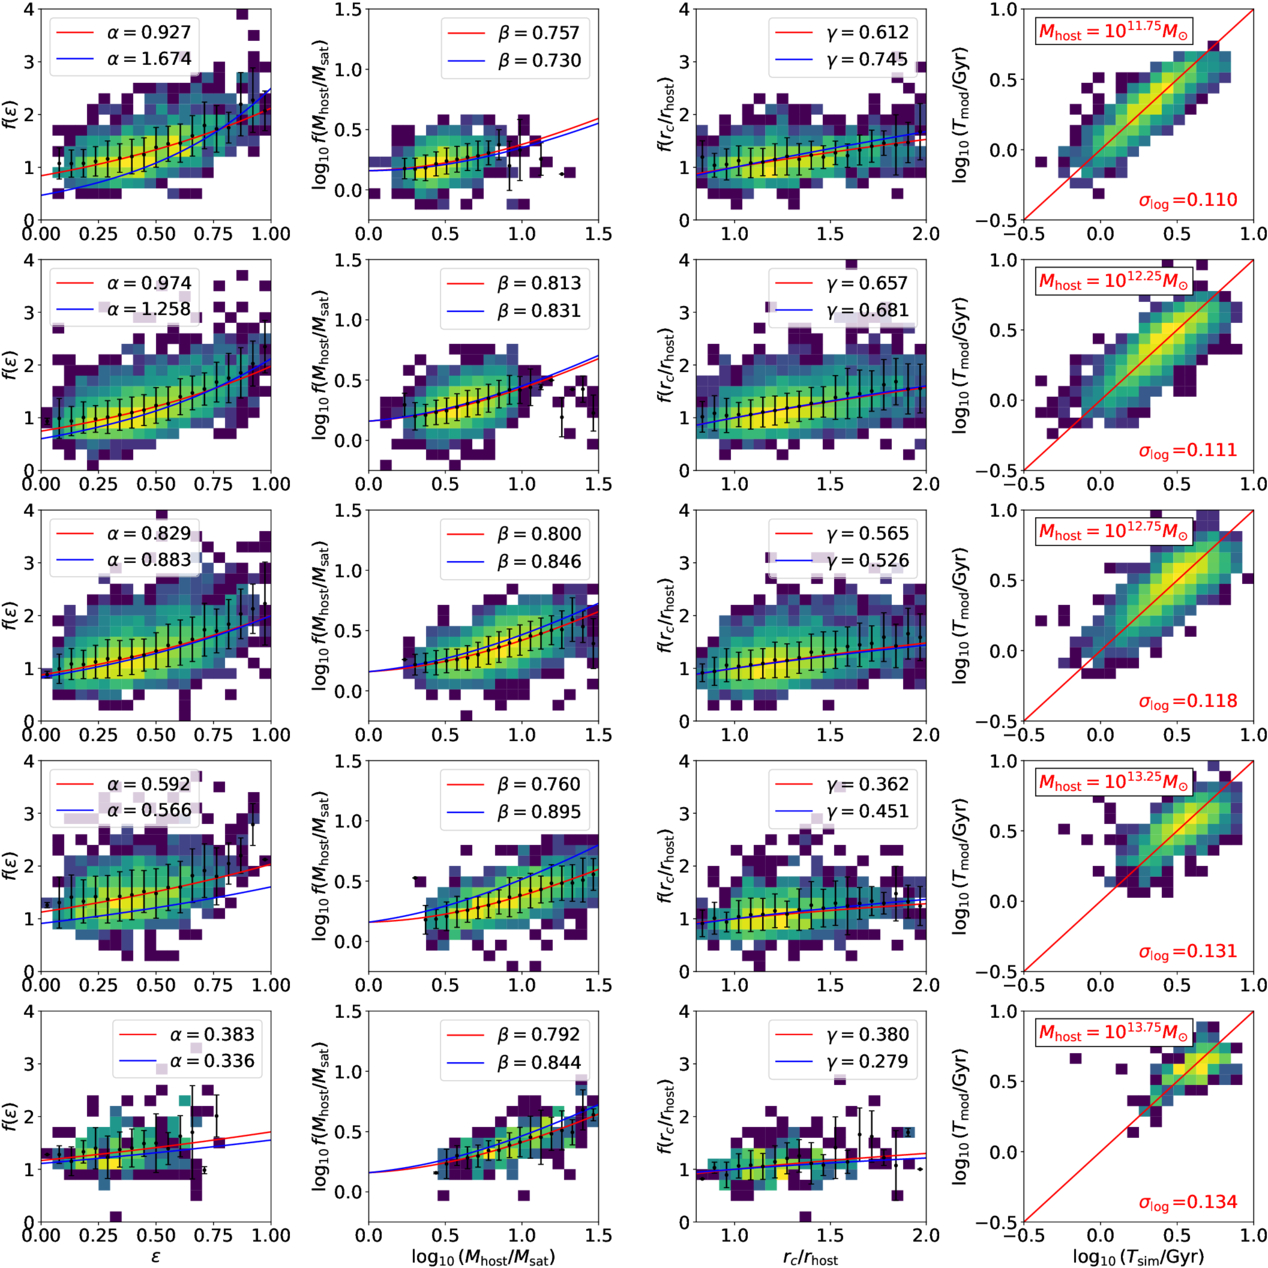
Figure A4. Similar to Figure 3, but for the TNG300-1-Dark sample divided into different Mhost bins. The best-fit models from TNG300-1 are also shown in blue lines for comparison.
Download figure:
Standard image High-resolution image