Abstract
We analyze the evolution of the dual active galactic nucleus (AGN) in ESO 509-IG066, a galaxy pair located at z = 0.034 whose nuclei are separated by 11 kpc. Previous observations with XMM-Newton on this dual AGN found evidence for two moderately obscured ( ∼ 1022 cm−2) X-ray luminous (
 ∼ 1043 erg s−1) nuclear sources. We present an analysis of subsequent Chandra, NuSTAR, and Swift/XRT observations that show one source has dropped in flux by a factor of 10 between 2004 and 2011, which could be explained by either an increase in the absorbing column or an intrinsic fading of the central engine, possibly due to a decrease in mass accretion. Both of these scenarios are predicted by galaxy merger simulations. The source that has dropped in flux is not detected by NuSTAR, which argues against absorption, unless it is extreme. However, new Keck/LRIS optical spectroscopy reveals a previously unreported broad Hα line that is highly unlikely to be visible under the extreme absorption scenario. We therefore conclude that the black hole in this nucleus has undergone a dramatic drop in its accretion rate. From AO-assisted near-infrared integral-field spectroscopy of the other nucleus, we find evidence that the galaxy merger is having a direct effect on the kinematics of the gas close to the nucleus of the galaxy, providing a direct observational link between the galaxy merger and the mass accretion rate onto the black hole.
1. Introduction
Interactions between galaxies are predicted to cause increased nuclear activity (e.g., Sanders et al. 1988; Hernquist 1989). Massive gas flows triggered by gravitational interaction and resulting tidal forces can potentially fuel central supermassive black holes, creating luminous active galactic nuclei (AGNs). This has been shown observationally in large statistical samples of galaxy pairs, where the AGN fraction and AGN luminosity have both been shown to increase as the separation between the galaxies decreases, peaking at ∼10 kpc (Alonso et al. 2007; Woods & Geller 2007; Ellison et al. 2011; Silverman et al. 2011; Koss et al. 2012; Satyapal et al. 2014). In addition, it is naturally expected that such a gas buildup in the nucleus will not only fuel the growth of the supermassive black hole, but obscure it as well, at Compton-thick levels ( > 1024 cm−2, Hopkins et al. 2005). Indeed, this has been shown recently with a sample of interacting galaxies at
  where galaxies that exhibit evidence for a merger or interaction were more likely to host a Compton-thick AGN than a less obscured one (Kocevski et al. 2015; Ricci et al. 2017).
However, while both observations and simulations of galaxy mergers find that AGN obscuration increases in galaxy mergers, simulations have also shown that large fluctuations in the mass accretion rate onto the black hole are also to be expected (e.g., Di Matteo et al. 2005; Hopkins et al. 2006), especially during the later stages of the merger (e.g., Gabor et al. 2016). Observationally, however, it is challenging to distinguish between changes in accretion rate and changes in absorption, since both lead to changes in the observed flux (e.g., Rivers et al. 2015a; Gandhi et al. 2017).
In this paper we study a local pair of interacting galaxies, ESO 509-IG066 (Figure 1), located at z = 0.034 ( Mpc). The galaxy pair was chosen for this study as part of a NuSTAR program to observe Swift/BAT-detected AGNs (Harrison et al. 2013). The nuclei of the two galaxies are separated by 16″ on the sky, which at this redshift implies a physical projected separation of 10.9 kpc (assuming
  km s−1 Mpc−1,
  , and
, and  , Planck Collaboration et al. 2016). The galaxies are aligned in the east–west direction where the R.A. and decl. of the nuclei are 203
6653, −23
4468, henceforth known as the “Western source” and 203
6700, −23
4461, henceforth known as the “Eastern source.” Guainazzi et al. (2005, hereafter G05) analyzed the galaxy pair using XMM-Newton data from 2004 and reported that both galaxies host luminous nuclear X-ray sources with luminosities of ∼1043 erg s−1. They found that the Western source is a moderately obscured AGN with a column density of ∼1023 cm−2, while the Eastern source is almost unobscured with the column density less than 1022 cm−2. While the Western source is very weak in the very soft X-ray band (0.5–2 keV), it outshines the Eastern source in harder bands (2.0–10.0 keV). The system has also been detected by Swift/BAT (Cusumano et al. 2010; Baumgartner et al. 2013) with a 14–195 keV flux of
 erg cm−2 s−1, although with a PSF of 10′, Swift/BAT cannot resolve these two nuclei. Furthermore, ESO 509-IG066 was detected by MAXI/GSC (Hiroi et al. 2011) with a 4–10 keV flux of
  erg cm−2 s−1.
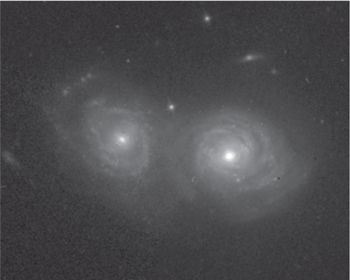
Figure 1. HST/WFPC2 F606W image of the galaxy pair ESO 509-IG066 from Malkan et al. (1998). The Eastern galaxy is on the left and the Western galaxy is on the right. The image is 50″ × 40″.
Download figure:
Standard image High-resolution imageIn this paper we reanalyze the XMM-Newton data from 2004 and add new results from the Chandra, NuSTAR, and Swift observations. In addition to the X-ray data, we use data from the Catalina Sky Survey (Drake et al. 2009) and the Wide-field Infrared Survey Explorer (WISE, Wright et al. 2010) to compare the X-ray variations with the variability in the optical and infrared (IR). Furthermore, we present new Keck/LRIS optical spectroscopic observations of the galaxies and a Keck/OSIRIS near-IR integral-field spectroscopic observation of the Western nucleus that yield insights into the system.
The structure of this paper is as follows. In Section 2 we describe the observational data used and the data reduction. Section 3 briefly summarizes our X-ray spectral fitting methods and results, followed by results from optical and IR analysis listed in Section 4. We present new Keck/LRIS optical spectroscopy and Keck/OSIRIS near-IR integral-field spectroscopy in Section 5. We discuss our results in Section 6 and conclude in Section 7.
2. Observations
ESO 509-IG066 has been observed by XMM-Newton, Chandra, NuSTAR, and Swift, and the NuSTAR and Swift observations were simultaneous. Figure 2 presents the X-ray images of the system from each of the observatories and Table 1 summarizes the basic observational data. The following sections discuss the processing of each of these X-ray data sets, as well as ancillary data sets at optical and IR wavelengths.
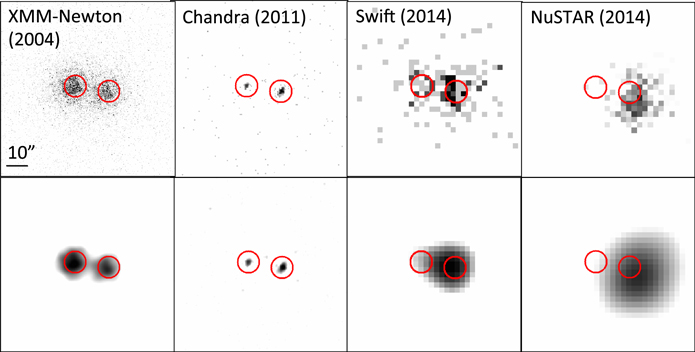
Figure 2. XMM-Newton (0.2–10 keV), Chandra (0.5–8 keV), Swift/XRT (0.5–10 keV), and NuSTAR (3–79 keV) images of ESO 509-IG066 from 2004–2014 showing the progressive fading of the Eastern source (east is left in these images). The red circles mark the positions of the sources and have 5″ radii. All images have the same scale, which is marked on the XMM-Newton image. The top panels show the unsmoothed images and the bottom images show images that have been smoothed with a Gaussian kernel with a radius of 5″ for XMM-Newton, Swift/XRT, and NuSTAR and 2″ for Chandra.
Download figure:
Standard image High-resolution imageTable 1. X-Ray Observations
| Telescope | ObsID | Date | Exposure (ks) |
|---|---|---|---|
| (1) | (2) | (3) | (4) |
| XMM-Newton | 0200430801 | 2004 Jan 24 | 13.9 |
| Chandra | 12835 | 2011 Feb 08 | 5.1 |
| NuSTAR | 60061244002 | 2014 Sep 02 | 20.9 |
| Swift/XRT | 00080115002 | 2014 Sep 03 | 6.2 |
Note. Column (1) gives the telescope name, column (2) lists the observation ID, column (3) gives the start date of the observation, and column (4) gives the exposure time in ks.
Download table as: ASCIITypeset image
2.1. XMM-Newton
XMM-Newton (Jansen et al. 2001) EPIC-pn (Strüder et al. 2001) data were reduced using sas v14.0, selecting events from a circular region of radius 60″ centered on the galaxy pair corresponding to a ∼90% encircled energy fraction. EPIC-MOS data were not considered due to their lower hard X-ray sensitivity. A period of high background at the beginning of the observation was filtered out, leaving 7.9 ks of science data. Background spectra were extracted from a nearby circular region of 75″ radius on the same chip as the galaxies. Initially, both of the nuclei were extracted in a single spectrum. During a subsequent analysis, we also extracted a spectrum for each of the two objects. For this individual analysis we used circular regions of radius 8″ for the Eastern source and 7″ for the Western source, respectively. Spectra were grouped with a minimum of 20 counts per bin. We carried out spectral fitting in the 0.2–10.0 keV energy range.
2.2. Chandra
The Chandra (Weisskopf 2000) data of the Eastern and Western sources were extracted using the ciao (v4.7, CALDB v4.6.5) tool specextract, from circular regions with a radius of 5″. A larger circular region on the same chip as the galaxies was used to extract the background spectrum. The spectrum of the Western source (the brighter one) was grouped to at least 10 counts per bin and the spectrum of the Eastern source was binned to at least 5 counts per bin. Counts at energies below 0.5 and above 7.5 keV were ignored, as the efficiency of the instrument drops quickly when outside of this energy range.
2.3. NuSTAR
The NuSTAR (Harrison et al. 2013) raw data were reduced using the nustardas v 1.5.1 software. Initially the events were cleaned and filtered with the nupipeline script with standard parameters, then the nuproducts procedure was used to extract spectra and the corresponding response and auxiliary files. A single spectrum was extracted for the galaxy pair because the size of the PSF of NuSTAR (∼60″, Madsen et al. 2015) is larger than the separation of the galaxies. The spectra were extracted from circular regions centered on the peak of emission and with specific radii to maximize the signal-to-noise ratio. The background spectra were obtained from regions chosen to cover as much area as possible on the same detector as the source while avoiding the source itself and its point-spread function. Data from both focal plane modules (FPMA and FPMB) were extracted and used in simultaneous fitting without coadding. Both NuSTAR spectra were grouped by at least 20 counts per bin using the heasarc tool grppha. We ignore channels below 3 keV, as the calibration at lower energies is uncertain, and we ignore channels above the 79 keV cutoff that results from absorption in the mirror coating.
2.4. Swift
The Swift/XRT (Gehrels et al. 2004; Burrows et al. 2005) observation was taken simultaneously with the NuSTAR observation. The data were preprocessed and the spectrum was extracted using automatic routines xrtpipeline and xrtproducts before downloading. Because of the low spatial resolution of XRT (HPD = 18″ at 1.5 keV), only one spectrum was extracted for the AGN pair. We used default parameters (such as extraction radius) while generating the spectrum. The data were then grouped by at least 3 counts per bin. We carry out spectral fitting in the 0.2–7.0 keV energy range where the efficiency of the telescope is highest.
2.5. Keck
We obtained observations of the ESO 509-IG066 system with the Keck telescope during 2016. Optical spectroscopy of both nuclei was carried out using the Keck I telescope and the dual-beam Low Resolution Imaging Spectrometer (LRIS, Oke et al. 1995). The 300 s spectrum, obtained on UT 2016 June 9 in photometric conditions, used the 15 wide slit, the 5600 Å dichroic to split the light, the 600 ℓ mm−1 grism on the blue arm (
 Å), and the 600 ℓ mm−1 grating on the red arm (
 Å). The 1
5 slit corresponds to physical scales of ∼1 kpc. The observations were obtained at a position angle of 82° in order to simultaneously observe both galaxies in the system. We processed the data using standard techniques within IRAF, and calibrated the spectrum using standard stars observed using the same instrument configuration on the same night.
In addition to the optical spectroscopy, we acquired near-IR integral-field spectroscopy of the nucleus of the Western galaxy from the adaptive optics (AO)-assisted, near-IR integral-field spectrograph (OSIRIS, Larkin et al. 2006; van Dam et al. 2006; Wizinowich et al. 2006) on the Keck I Telescope taken on UT 2016 April 22. The data were taken in the K-band using the Kbb filter and the 01 pixel scale, resulting in a rectangular field of view of 1
6 × 6
4. The galaxy nucleus was used as a tip-tilt star for the Laser Guide Star AO system. A total of two sky and four on-source exposures of 600 s each at a position angle of 90 degrees were combined to make the final data cube.
The OSIRIS data were reduced using the OSIRIS data reduction pipeline (ODRP). This performs all the usual steps needed to reduce near-IR spectra, but with the additional routines for reconstructing the data cube. More details can be found in Müller-Sánchez et al. (2016). Flux calibration was performed using an A7V star HD 87035 (K = 7.5).
2.6. Other Data
We used WISE (Wright et al. 2010) and NEOWISE-R (Mainzer et al. 2011) data to investigate the IR variability of the galaxy pair, which are spatially resolved by the telescope. ESO 509-IG066 was observed three times by WISE in 2010–2011 and four times by NEOWISE in 2014–2016. Data from the Catalina Sky Survey were used to investigate the variability of the AGN in the optical part of spectrum.
3. X-Ray Spectral Fitting
We fit the X-ray data using xspec (Arnaud 1996) software version 12.9.0 and used the Cash (Cash 1979) statistic for fitting because of the low number of counts per bin in the Swift data. Both AGNs are modeled in the same way with an absorbed cutoff power law plus pexrav component (Magdziarz & Zdziarski 1995) simulating scattered radiation from the dusty torus, plus a narrow iron line at 6.4 keV. We take into account Galactic absorption with a wabs model component, the  value of which was obtained from the Leiden/Argentine/Bonn survey of Galactic H i (Kalberla et al. 2005), and found to be
  cm−2. We also included cross-normalization constants between the X-ray instruments. A secondary power-law component was added, assuming that a fraction of the primary radiation escapes through a patchy absorber without reprocessing, or is scattered into the line of sight. In xspec, this model is written: constant∗wabs∗(constant∗cutoffpl + zwabs∗cabs(cutoffpl+pexrav+zgauss)). The zwabs∗cabs component represents the reprocessing of the X-rays by photo-electric absorption and Compton scattering local to the source. The constant∗cutoffpl component represents the secondary power-law component. The pexrav component represents scattered radiation from the torus. All the statistical errors calculated by XSPEC are at the 90 percent confidence level, unless explicitly stated otherwise.
Initially, we extracted a single spectrum for both of the sources from the XMM-Newton, Swift, and NuSTAR data and fitted the three data sets simultaneously. Since G05 showed that the two sources have different spectral properties, specifically the level of absorption, we assumed that we could spectrally decompose the two nuclei in the summed spectra. To do so we used the model described above multiplied by two in order to account for both AGNs within the extraction region. At first we tied the parameters for each source across data sets under the assumption that they did not change between the XMM-Newton observation and the Swift-plus-NuSTAR observations; however, the resulting fit was very poor. A visual inspection of the spectrum revealed that the 2004 XMM-Newton spectrum was significantly different from the 2014 NuSTAR and Swift/XRT spectra, appearing harder (see Figure 3). For this reason, another constant component was applied to the components of one of the sources to account for the possible variability of one source with respect to the other. From this we obtained a very good fit with a C-stat of 556.21 from 589 degrees of freedom (DOF). We found that the constant for one of the sources drops to 0 for the NuSTAR and Swift/XRT data, implying that it is negligible in the 2014 data. The results of this fit are summarized in Table 2. We identify the source with the highest  value as the Western source and the other as the Eastern source, since these match the parameters from G05, who carried out spatially resolved analysis on the galaxies.
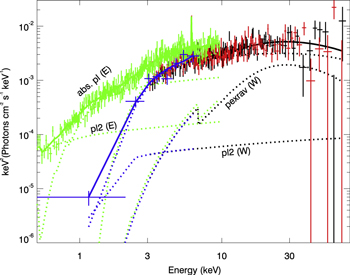
Figure 3.
 spectra of the two sources from XMM-Newton (green), NuSTAR (black and red), and Swift/XRT (blue), where both sources have been included in the extraction regions and the spectra have been unfolded through the instrumental responses. The absorbed power-law (abs. pl), secondary power-law (pl2), and pexrav components used in the fit are marked for each epoch.
Download figure:
Standard image High-resolution imageTable 2. Results of Simultaneous Fitting of Both Sources Using NuSTAR, Swift, and XMM-Newton Data
| Source |

|
Γ |

|
Power-law Norm. |

|
Pexrav Norm. | Iron Line Norm. |
|---|---|---|---|---|---|---|---|
| (1) | (2) | (3) | (4) | (5) | (6) | (7) | (8) |
| West |

|

|

|

|

|

|

|
| East |

|

|
500 |

|

|
⋯ | ⋯ |
Note. Column (1) gives source name, column (2) gives the  value in units of 1022 cm−2, column (3) gives the photon index of the cutoff power law, and column (4) shows the exponential cutoff energy of the cutoff power law in keV. Column (5) lists the normalization of the power law in units of photons keV−1 cm−2 s−1 at 1 keV, column (6) gives the fraction of the leaked power-law model to the primary one (“−l” indicates that this fraction is unconstrained at the lower end, and “+u” indicates that the fraction is unconstrained at the upper end), column (7) shows the normalization of the pexrav component in units of photons keV−1 cm−2 s−1 at 1 keV, and column (8) lists the normalization of a Gaussian component representing the iron line at 6.4 keV in units of total photons cm−2 s−1 in the line. The equivalent width of this line is 150 eV.
Download table as: ASCIITypeset image
The first constant in the spectral model is used to account for differences between instruments and possible variability effects. We fix it to 1 for NuSTAR FPMA and let it float for all other instruments. Constants obtained by fitting the spectrum simultaneously are: 1.01 ± 0.04 for FPMB,  for XMM-Newton-pn, and
  for Swift/XRT. The cross-normalization for XMM-Newton is higher, possibly due to variability between 2004 and 2014. However, it is still consistent with unity within the 90 percent uncertainties. Noticing this, we investigated the variability of the Western source. We tried freeing the photon index and column densities of this source in XMM-Newton data, but the resulting values stayed constant within the uncertainties. The other cross-normalization constants are consistent with calibrated values from Madsen et al. (2015).
To investigate the variability of the two sources individually, we analyzed the Chandra observation from 2011. For XMM-Newton, while the 16″ separation of the sources is similar to the FWHM of the telescope’s PSF, we extracted the spectra of each source using small 7″–8″ radius apertures following G05, bearing in mind that each spectrum will be contaminated by the other’s PSF wings. First, we extracted XMM-Newton and Chandra spectra of the Western source only. We simultaneously fit the spectra using a simple spectral model in the form constant∗wabs(constant∗po + zwabs∗cabs(po + zgauss)). The power law did not require a cutoff and the pexrav component was not required since these features are not significant in the soft X-ray range (below 10 keV). As the Chandra observation is only 5 ks, we were not able to constrain all the parameters of the spectral model. We achieved a very good fit of 69.49/92 C-stat/DOF when freeing  (the fraction of the secondary power-law to the primary one),
  , and the cross-normalization constant, and fixing all other parameters. The results of the fit are shown in Table 3 and in Figure 4. We notice an increase in the
  of the absorber from 6 ± 1 × 1022 cm−2 to
  cm−2, though the uncertainties increased as well. The equivalent width of the Fe Kα line is
  eV during the XMM-Newton observation and
  eV during the Chandra observation. The cross-normalization constant between the measurements is consistent with unity at the 90 percent confidence level.
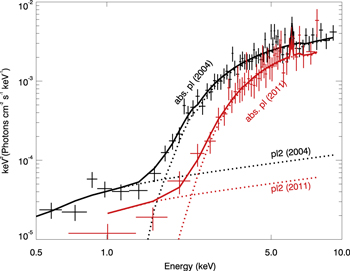
Figure 4.
 spectra of the Western source from XMM-Newton (black) and Chandra (red) where the spectra have been unfolded through the instrumental responses. The absorbed power-law (abs. pl) and secondary power-law (pl2) components used in the fit are marked for each epoch.
Download figure:
Standard image High-resolution imageTable 3. Simultaneous Fitting Results of Both Sources Using XMM-Newton and Chandra Data
| Source |

|
Γ | Power-law Norm. |

|
Iron Line Norm. | Cross-normalization Constant |
|---|---|---|---|---|---|---|
| (1) | (2) | (3) | (4) | (5) | (6) | (7) |
| Western Source | ||||||
| XMM-Newton |

|
1.53 ± 0.20 |

|

|

|
fixed to 1 |
| Chandra |

|
tied | tied |

|
tied |

|
| Eastern Source | ||||||
| XMM-Newton |

|
1.49 ± 0.12 |

|

|
⋯ | fixed to 1 |
| Chandra | tied | tied | tied | tied | ⋯ |

|
Note. Column (1) lists the instrument that measured the data, column (2) gives the  value in units of 1022 cm−2, column (3) gives the photon index of the power law, column (4) lists the normalization of the power law in units of photons keV−1 cm−2 s−1 at 1 keV, column (5) gives the fraction of the secondary power law to the primary one, column (6) gives the normalization of the zgauss component in units of total photons cm−2 s−1 in the line, and column (7) shows the cross-normalization constant between the two measurements.
Download table as: ASCIITypeset image
We extracted the spectrum of the Eastern source from XMM-Newton and Chandra observations as done with the Western source. The source is detected in both observations, but the flux from the 2011 Chandra observation is much lower than that from the 2004 XMM-Newton observation. We fit the spectrum simultaneously using the same model used for the Western source. In this case, the zgauss component is not significant anymore and again the pexrav component and high-energy cutoff were not required. We obtained a good fit with 85.18/115 C-stat/DOF by tying all the parameters for Chandra to the XMM-Newton parameters except for the cross-normalization constant, which now accounts mostly for the drop in flux of the object. Upon freeing the other Chandra spectral parameters, the fit becomes unconstrained. The results are summarized in Table 3 and Figure 5. We find that the normalization of the Eastern source decreased by a factor of ∼10 between 2004, when XMM-Newton observed it and 2011, the date of the Chandra observation.
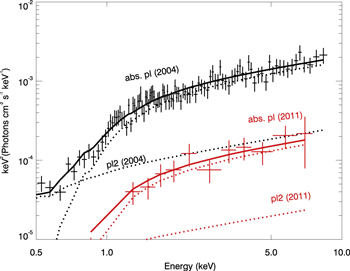
Figure 5.
 spectra of the Eastern source from XMM-Newton (black) and Chandra (red) where the spectra have been unfolded through the instrumental responses. The absorbed power-law (abs. pl) and secondary power-law (pl2) components used in the fit are marked for each epoch.
Download figure:
Standard image High-resolution imageIn the final part of X-ray analysis, we focus on fluxes from both of the sources and their changes over time. We calculate the flux using cflux, which provides the observed flux of the combined spectral models. We calculate the flux in two different bands: soft (0.5–2.0 keV) and hard (2.0–8.0 keV). From the Chandra and XMM-Newton data, we obtain fluxes of the sources separately, while for the Swift-plus-NuSTAR data, the calculated flux is the sum of both sources. However, we list it as the flux of Western source only, since the Eastern source is undetected. We include the upper limit at the 90 percent confidence level for the Eastern source flux calculated using spectral modeling. We plot the results from this analysis in Figure 6.
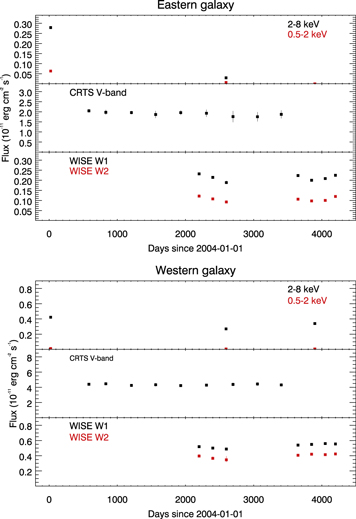
Figure 6. Multiband light curves of both the Eastern (top) and Western (bottom) galaxies, covering the period 2004–2014. While the X-ray flux from the Eastern galaxy has dropped by a factor of 10 in the X-ray bands, the flux at optical and mid-IR wavelengths has remained constant. No major variations are seen in the flux from the Western galaxy at X-ray, optical, or mid-IR wavelengths.
Download figure:
Standard image High-resolution imageThe system was reported by Swift/BAT as having 14–195 keV flux of  erg cm−2 s−1 (Cusumano et al. 2010; Baumgartner et al. 2013), which is an average over the period 2005–2009. We estimate the 14–195 keV flux of ESO 509-IG066 from the 2014 NuSTAR observation by extrapolating our spectral model up to 195 keV. We find that the flux during the NuSTAR observation is
  erg cm−2 s−1, which is consistent with the Swift/BAT flux reported, implying that there is no evidence for a drop in X-ray flux in this band. However, this is not surprising, since the Western source, which has remained relatively constant, dominates at high energies.
4. Long-term Optical and IR Light Curves
To investigate the cause of the X-ray variability of the Eastern source, we examined the optical and IR light curves. We used the Catalina Real-Time Transient Survey (CRTS) to determine the V-band optical brightness of the Eastern source over time. The measurements were taken from 2005 August until 2013 July, so the survey covers a large time period between our X-ray observations.
We then analyzed the mid-IR brightness of both sources using WISE and NEOWISE data as described in Section 2. The sources were observed during seven epochs, three times in 2010–2011 and four times in 2014–2016. The reduced  of the standard profile fitting technique for WISE point sources listed in the AllWISE catalog indicates that the sources are extended. For this reason, we use small-aperture photometry, extracted from regions of 5
5 also listed in the AllWISE catalog. Lastly, since the W3 and W4 passbands are not available for NEOWISE, we do not include them in our analysis. We present this photometry in Table 4.
Table 4. WISE and NEOWISE Photometry of Both Galaxies
| Eastern Source | Western Source | |||
|---|---|---|---|---|
| W1 | W2 | W1 | W2 | |
| (1) | (2) | (3) | (4) | (5) |
| AllWISE 1 | 12.67 ± 0.02 | 12.39 ± 0.06 | 11.79 ± 0.01 | 11.10 ± 0.04 |
| AllWISE 2 | 12.75 ± 0.02 | 12.52 ± 0.01 | 11.83 ± 0.02 | 11.19 ± 0.04 |
| AllWISE 3 | 12.89 ± 0.04 | 12.68 ± 0.06 | 11.86 ± 0.03 | 11.25 ± 0.12 |
| NEOWISE-R 1 | 12.71 ± 0.02 | 12.53 ± 0.03 | 11.75 ± 0.08 | 11.07 ± 0.03 |
| NEOWISE-R 2 | 12.83 ± 0.03 | 12.62 ± 0.05 | 11.73 ± 0.02 | 11.04 ± 0.04 |
| NEOWISE-R 3 | 12.78 ± 0.02 | 12.59 ± 0.03 | 11.71 ± 0.03 | 11.05 ± 0.08 |
| NEOWISE-R 4 | 12.70 ± 0.03 | 12.40 ± 0.05 | 11.72 ± 0.05 | 11.03 ± 0.08 |
Note. Column (1) shows the observational epoch and columns (2)–(5) list the WISE and NEOWISE magnitudes (Vega) of both galaxies in the W1 and W2 bands.
Download table as: ASCIITypeset image
First, we note that the mid-IR colors of the Eastern galaxy are relatively blue, with W1–W2 ≃ 0.3, which indicates that the bands are dominated by stellar emission. For the Western galaxy W1–W2 ≃ 0.7, which is more consistent with being dominated by the AGNs (Stern et al. 2012). Therefore, any drop in mid-IR flux from the AGNs in the Eastern galaxy will probably be washed out by the host galaxy. While the flux in W1 from the Eastern galaxy does shows a ∼20% drop during the 2010–2011 WISE observations and the AllWISE catalog gives it the maximum probability that the flux was not constant with time, the drop in flux is not sustained, as seen in the 2014–2016 NEOWISE data, which show a recovery of the initial flux. Finally, the expected optical-to-K-band time lag using our assumed cosmology is 25 days, a much shorter timescale than the cadence of the WISE data (although the W1, W2 emission regions may be slightly larger than the K-band emission region).
We convert the V-band magnitude from CRTS and the WISE W1 and W2 magnitudes to  fluxes in order to compare to the X-ray data. We plot this multiband light curve in Figure 6. While the X-ray flux from the Eastern galaxy has dropped by a factor of 10 in the X-ray bands, the flux at optical and mid-IR wavelengths has remained relatively constant over the long base line. No major variations are seen in the flux from the Western galaxy at X-ray, optical, or mid-IR wavelengths.
5. Optical and IR Spectroscopy
In order to gain further insight into the nature of the interaction between the galaxies and the drop in X-ray flux from the Eastern nucleus, we analyzed the optical spectra of the two nuclei. The processed Keck/LRIS spectra are shown in Figure 7. We use the penalised PiXel Fitting software (pPXF, Cappellari & Emsellem 2004) to measure stellar kinematics and the central stellar velocity dispersion with the Indo-U.S. CaT, and MILES empirical stellar library ( Vazdekis et al. 2012). We fit the residual spectra for emission lines after subtracting the stellar templates with the PYSPECKIT software following Berney et al. (2015) and correct the narrow line ratios (Hα/Hβ), assuming an intrinsic ratio of R = 3.1 and the Cardelli et al. (1989) reddening curve. In the case of a Hβ non-detection, we assume the 3σ upper limits for the extinction correction.
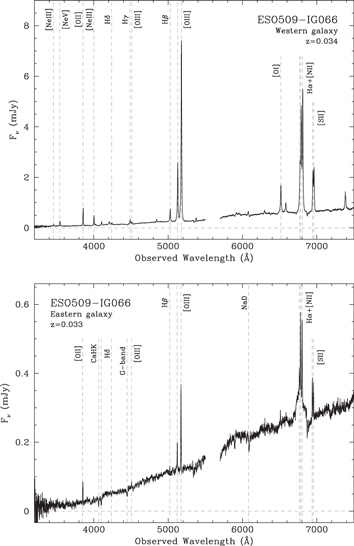
Figure 7. Keck/LRIS optical spectra of the nucleus of the Western galaxy (top) showing strong forbidden lines typical of a Seyfert 2 and the Eastern galaxy (bottom), which reveals a broad Hα beneath narrow Hα+[N ii] lines. This is the first reported detection of broad optical lines from this galaxy and indicates that the nucleus is not strongly absorbed, arguing against heavy absorption behind the drop in X-ray flux.
Download figure:
Standard image High-resolution imageThe optical spectrum of the Western galaxy exhibits strong forbidden transition lines from [O iii] and [N ii] and BPT diagnostics confirm that the galaxy hosts a Seyfert 2 nucleus (Figure 8). The Balmer-decrement-corrected [O iii] flux is  erg cm−2 s−1. We measure a velocity dispersion of 118 ± 37 km s−1 in the CaH+K and Mgb region and 124 ± 27 km s−1 in the Calcium triplet absorption lines. We show the fit to the Calcium triplet lines in Figure 9.
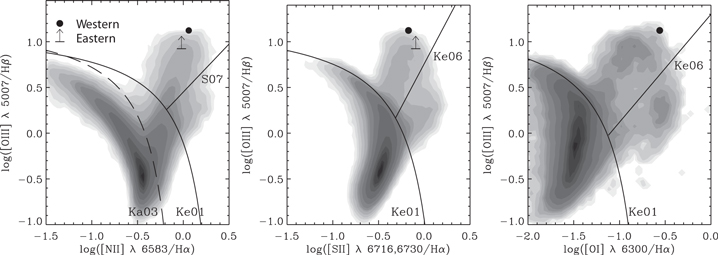
Figure 8. BPT narrow emission-line diagnostic diagrams for the Western (black dot) and Eastern (black bar) nuclei. The solid black curve shows the separation between star-forming galaxies, which lie below the curve, and AGNs, which lie above the curve, from Kewley et al. (2001). The dashed curved line shows the same separation, but from Kauffmann et al. (2003). The solid straight line shows the separation between Seyferts, which fall left of the line, and LINERs, which fall to the right of the line, from Kewley et al. (2006). The Western nucleus is in the Seyfert section in all three diagrams. The Eastern nucleus only has an upper limit on the Hβ flux, but the corresponding lower limit of the ratio is in the Seyfert region, thus both galaxies are classified as Seyferts from our data.
Download figure:
Standard image High-resolution image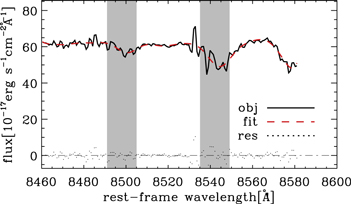
Figure 9. Zoom-in on the Keck/LRIS optical spectrum of the Western galaxy in the region where the Calcium triplet absorption occurs, which we use to measure the velocity dispersion of the stars.
Download figure:
Standard image High-resolution imageIn the LRIS spectrum of the Eastern galaxy a broad Hα line is detected with a width of 4226 km s−1 characteristic of a Seyfert 1 nucleus (Figure 10); however, the Hβ line is very weak, and so would be classified as a Seyfert 1.9 (Osterbrock 1981). Using an upper limit to the flux of the narrow Hβ line, we find that the BPT diagnostics also confirm the presence of a Seyfert nucleus in this source (Figure 8). The Eastern galaxy has a velocity dispersion that is consistent with the instrumental resolution (<100 km s−1) in the CaH+K and Mgb region. However, due to the broad Hα line, the Calcium triplet absorption lines are likely contaminated by AGN emission.
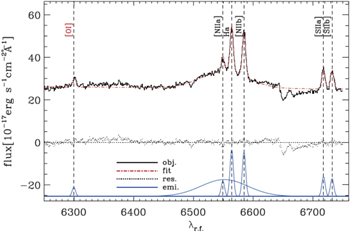
Figure 10. Zoom-in on the Keck/LRIS optical spectrum of the Eastern galaxy in the region where the broad Hα line was detected, showing the spectral decomposition.
Download figure:
Standard image High-resolution imageSekiguchi & Wolstencroft (1992) presented optical spectroscopic observations of the two galaxies, taken with the 1.9 m South African Astronomical Observatory, also finding the Western nucleus to be a Seyfert 2. They, however, classified the Eastern nucleus as a LINER or H ii galaxy. It is unclear if the broad Hα line was undetected in their observations or not present at that time when they were made, between 1987 and 1990. Our new detection of broad Hα strongly suggests that our view of the Eastern nucleus is largely unobscured. Some reddening may be present in order to explain the non-detection of a broad Hβ line. We can estimate the amount of reddening from the flux ratio of the Hα and Hβ lines, known as the Balmer decrement. Given the upper limit on the flux of the Hβ line, the lower limit on the Balmer decrement is 4.7. Assuming an intrinsic value of 3.1, this corresponds to a lower limit on the reddening of  , which, assuming the Galactic gas-to-dust ratio corresponds to
  ∼ 1021 cm−2. In order to suppress the X-ray flux from the Eastern nucleus such that it is not detected by NuSTAR, the obscuration must be at least 4 orders of magnitude higher, around 1025 cm−2. If this were the case, the implied reddening in the optical means that the broad Hα line would not be detectable. A possibility remains, however, that the broad Hα line results from scattered light from the nucleus that would not be subjected to the heavy line-of-sight absorption that the X-rays may be subjected to.
In addition to the optical spectroscopy of the two nuclei, we also acquired near-IR K-band integral-field spectroscopy of the inner ∼kpc of both nuclei. The integrated spectrum of the Western nucleus (Figure 11) reveals several transitions of molecular hydrogen, Brγ and Brδ from atomic hydrogen, as well as transitions from ionized gas ([Si vi] and [He i]). The molecular hydrogen transitions indicate the presence of large amounts of molecular gas, while the emission from highly ionized gas confirms the presence of a powerful AGN. The integrated spectrum of the Eastern nucleus is featureless, however, with no emission lines detected.
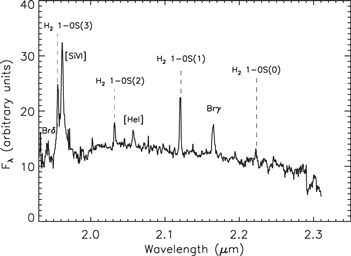
Figure 11. Integrated Keck/OSIRIS spectrum of the Western nucleus in the K-band (rest frame). The individual spectra were added over an aperture of 06 diameter centered at the peak of continuum emission in the near-IR. Several transitions of molecular hydrogen can be seen, where the 2.12 μm H2 1−0 S(1) emission line is the strongest. Ionized gas emission is also detected in this galaxy ([Si vi], Brδ, Brγ, and [He i]), confirming the presence of a powerful AGN.
Download figure:
Standard image High-resolution imageWe use the strong H2 1−0 S(1) emission line at 2.12 μm to map the velocity of the gas within the inner ∼kpc of the Western galaxy, fitting it with a single Gaussian for each pixel in the field of view. Figure 12 presents the flux, velocity, and the velocity dispersion inferred from these measurements. We find that within the inner 200–300 pc of the galaxy, the gas rotates in an ordered fashion, with a systematic velocity toward us to the west of the nucleus, and a systematic velocity away from us to the east of the nucleus. The velocity dispersion is also low ( km s−1). However, at ∼1 kpc to the east of the nucleus, a region of gas appears to have motion that is redshifted toward us, opposite to the direction of ordered rotation in that region. This region also shows very high velocity dispersion of 455 km s−1 (typical error 10–20 km s−1). A high dispersion is an indication of shocks and perturbed kinematics. These usually correspond to outflows, but they are also associated with inflows, particularly from merger processes (Medling et al. 2015; Müller-Sánchez et al. 2016). We have mapped the gas outflow from the Western AGN using the high-ionization [Si vi] line, which shows a different morphology from the molecular gas, orientated in the north–south direction. We therefore find it unlikely that the perturbed molecular gas in the east is caused by an AGN outflow. Since this galaxy appears to be interacting with its neighbor to the east, we interpret these observations as signatures of an inflow of gas caused by a physical interaction between the galaxies. While a region of high velocity dispersion is also seen to the northwest of the nucleus, the signal-to-noise is low and has significantly lower velocity dispersion (300 km s−1) than the region to the east. Furthermore, there is no evidence that the velocity is systematically different from the ordered rotation seen in the rest of the nucleus.
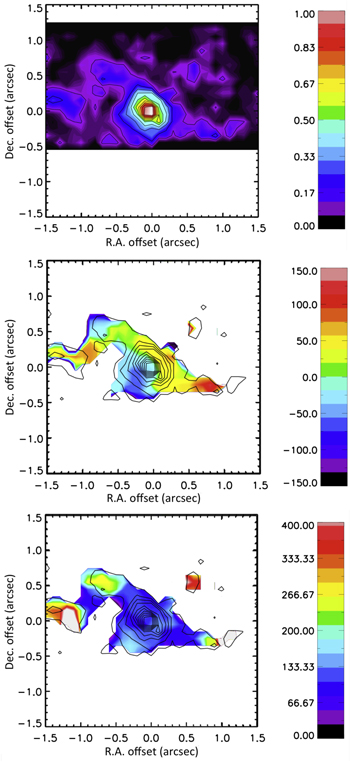
Figure 12. Maps of the H2 1−0 S(1) flux (top), velocity (middle), and velocity dispersion (bottom) in the nucleus of the Western galaxy acquired from Keck/OSIRIS near-IR integral-field spectroscopy observations. The color scale is in km s−1 and the angular scale is 700 pc/″ at the redshift of the system and our assumed cosmology. The central 200–300 pc shows ordered rotation (PA of the kinematic major axis ∼135°), whereas the gas at ∼1 kpc to the east of the nucleus appears to be systematically redshifted (top). The same region of gas also shows a high (455 km s−1) velocity dispersion, pointing toward a physical interaction between the galaxies (bottom). The contours delineate the molecular gas morphology and are normalized to the peak of emission. Each contour represents a change in flux of 10%.
Download figure:
Standard image High-resolution imageTherefore, we conclude that while the nuclei are separated by ∼11 kpc, the effect of the interaction is seen on the gas within the inner ∼1 kpc of the Western galaxy. This clearly shows that galaxy interactions like the one in ESO 509-IG066 can have a significant impact on the motion of gas within the nuclei and the feeding of the central SMBH.
6. Discussion
One of the notable features of the X-ray observations spanning 12 years is the drop, by a factor of 10, of the flux of the Eastern source. There are two possible straightforward explanations for this observed drop in X-ray flux. The decrease in flux could be caused by an increase in the column density of the absorber. A cloud of gas and dust might be passing in front of the nucleus along the line of sight obscuring the source (e.g., NGC 1365, Risaliti et al. 2009; Rivers et al. 2015b). Provided the column density is extremely high (above 1025 cm−2), the only received X-ray radiation would be that escaping through gaps between clouds, assuming that the covering fraction is not 100%, or light that has been scattered into our line of sight. The spectrum would then resemble results obtained from the 2011 Chandra observation, being lower in flux with approximately the same spectral shape. An extreme  would be required so that even emission above 10 keV is suppressed by Compton scattering since the Eastern source is not visible in the NuSTAR image (Figure 2). With an angular separation of 16″, the nuclei are far enough apart to be distinguishable with NuSTAR, whose PSF has a 18″ FWHM (Harrison et al. 2013; Madsen et al. 2015). The X-ray emission in the NuSTAR image peaks strongly at the position of the Western source, with no indication for the Eastern one. Furthermore, there is no evidence for Fe-Kα emission in the Chandra spectrum of the source. In AGNs, significant obscuration is usually but not always associated with Fe-Kα fluorescence emission. The absence of an Fe-K line suggests absorption is not responsible for the flux decrease.
The second possibility is that the intrinsic X-ray luminosity of the AGN itself decreased by a factor of at least 10 over the past 10 years, due to a decrease in coronal activity, which could have been caused by a drop in the mass accretion rate. This would explain the spectral shape seen in the 2011 Chandra observation, which is fitted well by a model with similar physical parameters, such as column density and power-law slope. Assuming a similar luminosity for the nucleus in 2014 and 2011, this scenario also agrees with the non-detection of the AGN by NuSTAR and its very faint detection by Swift/XRT. The Eastern nucleus was weak in the hard X-ray band in 2004 with respect to the Western source, and thus would be undetectable by NuSTAR above 3 keV after a decrease by a factor of 10. Additional evidence in favor of the drop in accretion rate comes from the optical spectrum, which reveals a weak but significantly detected broad Hα line from the nucleus of the Eastern galaxy, which must come from close to the central engine. If the dimming were due to obscuration, it would require an extremely low dust-to-gas ratio for the X-ray flux to have undergone such suppression, while the Hα line remains visible, although the possibility still exists that the Hα line may be scattered light.
However, no emission lines were detected in the NIR from the Eastern nucleus. This implies that there are not enough ionizing photons to produce emission lines of ionized gas in the near-IR (like Br-γ, [He i], or [Si vi] seen from the Western nucleus). Also, the lack of molecular hydrogen indicates that there is not sufficient gas to maintain the active nucleus. This is consistent with our interpretation that the accretion rate of the eastern nucleus has dropped.
We discuss the scenario that the merging of the two galaxies is directly linked to the change in accretion rate of the Eastern AGN. First, galaxy merger simulations predict large fluctuations in black hole accretion rate during the final stages of a merger (e.g., Van Wassenhove et al. 2012; Gabor et al. 2016). Although the time resolution of most simulations (∼103 years) is much longer than our observational timescale, results on much shorter timescales (∼10 years) also reveal similar accretion rate fluctuations (J. Gabor 2017, private communication). It should be noted, however, that fluctuations are also predicted from simulations of isolated AGNs (e.g., Novak et al. 2011) and have been observed as well (LaMassa et al. 2015), although this could be related to a tidal disruption event (Merloni et al. 2015). Second, the motion of the gas in the central ∼kpc of the Western galaxy, as revealed by integral-field spectroscopy, is highly suggestive that the galaxy merger is directly affecting the kinematics of the gas within the nuclear region, providing a direct observational link between the galaxy merger and the change in mass accretion rate onto the black hole.
To better place this AGN pair in the context of galaxy simulations, we estimate the masses of the central SMBHs. For the Eastern galaxy, a broad Hα line was detected, which we use for the  estimation. Greene & Ho (2005) presented a method for estimating the black hole mass from the width and luminosity of the Hα line. From their Equation (6), given that we measure a width of 4226 km s−1 and a luminosity of
  erg s−1, we obtain
  ≈ 4.6 × 10⁶ M⊙. Since no broad line was detected in the Western galaxy, we use the velocity dispersion of the stars in the center of the galaxy to estimate the black hole mass. Using the
  –σ* relation from Kormendy & Ho (2013), the calcium triplet measurement implies a black hole mass of
  M⊙ for the Western galaxy. This then implies that the black hole mass ratio of the two galaxies is 10:1, which is rather larger than the 4:1 or 2:1
  ratios considered in recent simulations by Gabor et al. (2016).
It is interesting that the AGN in this system with the smallest black hole mass has exhibited the greatest X-ray variability, since it is well known that the variability timescale correlates with black hole mass, i.e., the variability timescale increases with  (e.g., Papadakis 2004). However, these timescales are much shorter (∼104s) than the timescale of the drop in X-ray flux that we have observed.
An observational signature for the drop in  in the X-ray spectrum of the Eastern source is expected since there is a known correlation between
  and Γ (e.g., Shemmer et al. 2006; Risaliti et al. 2009; Brightman et al. 2013, 2016). During the 2004 XMM-Newton observation, the Eastern source had an absorption-corrected
  of
of  erg s−1. Applying a bolometric correction of 10 (Lusso et al. 2012) implies
  = 7.5 × 1043 erg s−1, which in turn yields
  = 0.12 for our
  estimate. At the time of the Chandra observation,
  had reduced by a factor of 10, meaning a decline in
  by the same factor. For the observations in 2014, the X-ray emission from the Eastern nucleus was undetectable, thus
 at that time. From Brightman et al. (2013),
  log10
log10
 , thus we would expect
  for Δlog10
 ≈ −1. For our analysis presented in Section 3, we tie the Γ values to each other for both flux levels. If we perform the same analysis, but with the Γ parameter not linked between the observations, we obtain
  for the XMM-Newton observation and
  for the Chandra observation. The uncertainties are therefore too large to constrain
  at the requisite level.
7. Summary and Conclusions
We conducted a multi-wavelength analysis of the galaxy pair ESO 509-IG066 using X-ray, optical, near-IR, and mid-IR data taken between 2004 and 2016. The galaxies in the pair, located at a distance of 150 Mpc with a projected separation of 10.9 kpc, were both reported to host an AGN of  ∼ 1043 erg s−1 by G05 using XMM-Newton data. In an analysis of all available data, we found that since the XMM-Newton observation in 2004, the Eastern nucleus has shown a strong decrease in X-ray flux revealed first by a Chandra observation in 2011. The galaxy remained at this level or lower during a joint NuSTAR and Swift/XRT observation in 2014. The X-ray emission from the Western source remained relatively constant during this period. Although the 16″ angular separation of the galaxy pair causes significant overlap given the NuSTAR PSF, there is no evidence for the Eastern source in the NuSTAR image from 2014. This argues against a rise in obscuration behind the drop in X-ray flux, unless it is extreme. New Keck/LRIS optical spectroscopy taken after the drop in X-ray flux reveals a broad component to the Hα line from the Eastern nucleus, which also strongly argues against heavy obscuration. We therefore conclude that the AGN has dropped intrinsically in luminosity, most likely due to a decrease in mass accretion rate. From AO-assisted near-infrared integral-field spectroscopy, we find that the kinematics of the gas close to the Western nucleus show evidence that the galaxy merger is having a direct effect close-in to the black hole, providing an observational link between the galaxy merger and the mass accretion rate onto the black hole.
We thank the referee for their constructive input on our manuscript. We also thank Mislav Baloković for introducing us to these interesting galaxies and Jared Gabor for useful discussion. R.J.A. was supported by FONDECYT grant number 1151408. A.M. acknowledges support from the ASI/INAF grant I/037/12/0-011/13. C.R. acknowledges financial support from the CONICYT-Chile grants “EMBIGGEN” Anillo ACT1101, FONDECYT 1141218, Basal-CATA PFB–06/2007 and from the China-CONICYT fund. This work was supported under NASA Contract No. NNG08FD60C, and made use of data from the NuSTAR mission, a project led by the California Institute of Technology, managed by the Jet Propulsion Laboratory, and funded by the National Aeronautics and Space Administration. We thank the NuSTAR Operations, Software, and Calibration teams for support with the execution and analysis of these observations. This research has made use of the NuSTAR Data Analysis Software (NuSTARDAS) jointly developed by the ASI Science Data Center (ASDC, Italy) and the California Institute of Technology (USA). The work presented here was also based on observations obtained with XMM-Newton, an ESA science mission with instruments and contributions directly funded by ESA Member States and NASA. This publication makes use of data products from the Wide-field Infrared Survey Explorer, which is a joint project of the University of California, Los Angeles, and the Jet Propulsion Laboratory/California Institute of Technology, funded by the National Aeronautics and Space Administration. The data presented herein were obtained at the W.M. Keck Observatory, which is operated as a scientific partnership among the California Institute of Technology, the University of California and the National Aeronautics and Space Administration. The Observatory was made possible by the generous financial support of the W.M. Keck Foundation. The authors wish to recognize and acknowledge the very significant cultural role and reverence that the summit of Maunakea has always had within the indigenous Hawaiian community. We are most fortunate to have the opportunity to conduct observations from this mountain. This research has also made use of data and software provided by the High Energy Astrophysics Science Archive Research Center (HEASARC), which is a service of the Astrophysics Science Division at NASA/GSFC and the High Energy Astrophysics Division of the Smithsonian Astrophysical Observatory. Furthermore, this research has made use of the NASA/IPAC Extragalactic Database (NED), which is operated by the Jet Propulsion Laboratory, California Institute of Technology, under contract with the National Aeronautics and Space Administration. A.M. acknowledges support from the ASI/INAF grant I/037/12/0-011/13, and C.R. acknowledges financial support from the CONICYT-Chile grants “EMBIGGEN” Anillo ACT1101, FONDECYT 1141218, Basal-CATA PFB–06/2007, and from the China-CONICYT fund.
Facilities: NuSTAR - The NuSTAR (Nuclear Spectroscopic Telescope Array) mission, XMM-Newton (pn) - , Chandra - , Swift (XRT), WISE - , Keck (LRIS) - , Keck (OSIRIS) - .