Abstract
With the conclusion of the third observing run for Advanced LIGO/Virgo (O3), we present a detailed analysis of both triggered and serendipitous observations of 17 gravitational-wave (GW) events (7 triggered and 10 purely serendipitous) from the Searches After Gravitational-waves Using ARizona Observatories (SAGUARO) program. We searched a total of 4935 deg2 down to a median 5σ transient detection depth of 21.1 AB mag using the Mt. Lemmon 1.5 m telescope, the discovery engine for SAGUARO. In addition to triggered events within 24 hr, our transient search encompassed a time interval following GW events of <120 hr, providing observations on ∼1/2 of the events accessible to the Mt. Lemmon 1.5 m telescope. We covered 2.1%–86% of the LVC total probability (Ptotal) for individual events, with a median Ptotal ≈ 8% within <120 hr. Following improvements to our pipeline and the addition of serendipitous observations, we find a total of seven new optical candidates across five GW events, which we are unable to rule out after searching for additional information and comparing to kilonova models. Using both publicly available and our own late-time data, we investigated a total of 252 optical candidates for these 17 events, finding that only 65% were followed up in some capacity by the community. Of the total 252 candidates, we are able to rule out an additional 12 previously reported counterpart candidates. In light of these results, we discuss lessons learned from the SAGUARO GW counterpart search. We discuss how community coordination of observations and candidate follow-up, as well as the role of archival data, are crucial to improving the efficiency of follow-up efforts and preventing unnecessary duplication of effort with limited electromagnetic resources.
1. Introduction
Since 2015, the Advanced Laser Interferometer Gravitational-Wave Observatory detectors (LIGO; Abbott et al. 2009), and later the Advanced Virgo Observatory (Acernese et al. 2015) detectors, have been detecting gravitational waves (GWs) produced by the inspirals of merging compact objects (neutron stars: NSs and/or black holes: BHs). During the first two observing runs (O1 and O2), the LIGO-Virgo Collaboration (LVC) announced 10 binary BH (BBH) mergers and one binary NS (BNS) merger (Abbott et al. 2019). The single BNS merger, termed GW 170817 (Abbott et al. 2017a), also produced electromagnetic (EM) emission (AT 2017gfo) from the γ-rays to the radio band, signaling the first GW–EM multimessenger discovery (Abbott et al. 2017b). AT 2017gfo was discovered in the galaxy NGC 4993 (Coulter et al. 2017a) at a distance of 40.7 ± 1.4 ± 1.9 Mpc (random and systematic errors; Cantiello et al. 2018).
With the discovery of this EM counterpart, GW 170817 was detected across the entire EM spectrum with a multitude of telescopes (see Abbott et al. 2017b). In-depth studies of the EM emission and its spectral and temporal evolution have provided a wealth of information about BNS mergers, such as direct evidence of the radioactive decay of r-process material demonstrating kilonovae as important sites for the production of heavy elements (Lipunov et al. 2017; Coulter et al. 2017a; Arcavi et al. 2017; Chornock et al. 2017; Cowperthwaite et al. 2017; Díaz et al. 2017; Drout et al. 2017; Fong et al. 2017; Gall et al. 2017; Hu et al. 2017; Kasliwal et al. 2017; McCully et al. 2017; Nicholl et al. 2017; Pian et al. 2017; Shappee et al. 2017; Smartt et al. 2017; Soares-Santos et al. 2017; Tanvir et al. 2017; Utsumi et al. 2017; Valenti et al. 2017; Villar et al. 2017; Pozanenko et al. 2018). Through late-time follow-up and detailed modeling, the identification of a structured relativistic jet was also confirmed for GW 170817 (Haggard et al. 2017; Hallinan et al. 2017; Margutti et al. 2017; Alexander et al. 2018; Margutti et al. 2018; Mooley et al. 2018; Fong et al. 2019; Ghirlanda et al. 2019; Hajela et al. 2019; Troja et al. 2019).
The third observing run (O3) began on 2019 April 1 with a 1 month commissioning break in 2019 October and had an effective operational time of 10.9 months. Relative to the capabilities of O2, the increased sensitivities during the first 6 months of O3 (O3a) led to a median orientation-averaged range for BNS mergers of 108 Mpc, 135 Mpc, and 45 Mpc for LIGO Hanford, LIGO Livingston, and Virgo, respectively, while the median 90% localization during O3a was 860 deg2 (Abbott et al. 2020b). During O3, a total of 56 nonretracted public alerts 21 were released. Assuming an astrophysical origin for these 56 alerts, each GW candidate is assigned a probability of being the merger of two BHs (BBH), two NSs (BNS), an NS and a BH (NSBH), or a more ambiguous case in which one of the components has a mass in the gap between NS and BH classifications (termed “MassGap,” 3 < M/M⊙ < 5; see Abbott et al. 2016). A fifth classification encompasses unmodeled short duration (t < 1s) “Burst” signals, which do not fit the normal inspiral of compact objects and are of uncertain astrophysical origin.
This classification scheme resulted in 37 BBH, 7 BNS, 7 NSBH, 4 MassGap, and 1 burst event candidates that were detected during O3 22 . For each event, we adopt the naming convention used by the LVC. Events have superevent names given by the letter “S” followed by the six-digit UTC date and a lowercase incrementing letter. Events that are confirmed as real GW events by the LVC are renamed to “GW” followed by the six-digit UTC date (e.g., GW 190425). For O3a sources presented in the Gravitational-Wave Transient Catalog 2 (GWTC-2, Abbott et al. 2020b), we change the names to follow the naming convention adopted there. For events above the adopted False-Alarm Rate (FAR) threshold, names include “GW” followed by the six-digit UTC date and the six-digit UTC time (e.g., GW 190408_181802); while subthreshold events retain their superevent names. Previously published events (e.g., GW 190425 and GW 190521) keep their published names without the UTC time. These 56 nonretracted events had 90% localization regions that ranged in size from 18 to 24,264 deg2, depending largely on the number of detectors operational at the time. Other than the event detected by the burst pipeline (S200114f), which does not have an associated distance, the remaining 55 event candidates have inferred median distances of 108–5263 Mpc from the GW signals.
O3 comprised a number of firsts for the LVC, including the first detection of a candidate NSBH merger, GW 190426_152155 (Ligo Scientific Collaboration & VIRGO Collaboration 2019a); the first detection of a candidate MassGap merger, S190814bv (LIGO Scientific Collaboration & Virgo Collaboration 2019b), which was later classified as an NSBH with a high mass ratio, challenging current formation models and the predicted mass distribution of compact-object binaries (GW 190814; Abbott et al. 2020c); and the first detection of a burst candidate, S200114f (Ligo Scientific Collaboration & VIRGO Collaboration 2020a). In addition, the second BNS merger, GW 190425 (Abbott et al. 2020a), was significantly more massive than GW 170817, as well as more massive than the Galactic NS binary population (Safarzadeh et al. 2020). Finally, O3 included the most massive BBH merger, GW 190521, with BH masses of  M⊙ and
  M⊙ (Abbott et al. 2020b, 2020e), having implications for various formation channels for these systems (Abbott et al. 2020d).
Despite the wealth of new discoveries and GW event alerts, the large sky localizations coupled with the large median distances made it challenging for effective searches of associated UV, optical, or near-infrared emission for a large number of events. Indeed, optical searches were dominated by instruments with wide fields of view (FOVs), which largely adopted the approach of tiling the GW localization regions. Published examples include DECam/DES (Garcia et al. 2020), DECam/GROWTH (Andreoni et al. 2019d; Goldstein et al. 2019; Andreoni et al. 2020), ZTF/GROWTH (Coughlin et al. 2019b; Kasliwal et al. 2020; Anand et al. 2020b; Coughlin et al. 2020), GRANDMA (Antier et al. 2020), GOTO (Gompertz et al 2020), ENGRAVE (Ackley et al. 2020), CFHT (Vieira et al. 2020), SkyMapper (Chang et al. 2021), and Subaru/HSC (Ohgami et al. 2021); while other surveys like the MASTER-Network (Lipunov et al. 2017), Pan-STARRS (Chambers et al. 2016), ATLAS (Tonry et al. 2018), Gaia (Gaia Collaboration et al. 2016), and Swift/UVOT (Roming et al. 2005) have also contributed toward candidate searches. Meanwhile, telescopes with a smaller FOV have opted for galaxy-targeted searches (Magellan; Gomez et al. 2019, MMT/SOAR; Hosseinzadeh et al. 2019, J-GEM; Morokuma et al. 2016). The large majority of these surveys encompass triggered searches on GW events with a majority of the information distribution in real-time via The Gamma-ray Coordinates Network (GCN). Published papers on single events generally focus on the search for transient EM emission within a few days of the GW event and the in-depth analysis of the emission from candidates. Summary papers from groups such as ZTF/GROWTH (Kasliwal et al. 2020; Anand et al. 2020b) have also explored the long-term behavior of their initially reported candidates, with efforts to follow up outstanding candidates through spectroscopic or photometric means.
Searches After Gravitational waves Using ARizona Observatories (SAGUARO) is a telescope network dedicated to the discovery and follow-up of GW events. 23 In this paper, we present a summary of the SAGUARO campaign and an analysis of our observations to find and study the optical counterparts to GW events that ran concurrently with LIGO/Virgo O3 (Lundquist et al. 2019a). In Section 2 we provide an overview of SAGUARO, including our image subtraction and candidate vetting, summarize our coverage in O3, and discuss significant updates implemented during O3. We present a detailed description of our observations and each individual event in Section 4. In Section 5, we discuss our findings. Lastly, we discuss the conclusions, lessons learned from O3, and future prospects in Section 6.
Unless otherwise stated, all magnitudes reported here are in the Gaia DR2 G band and are converted to the AB system via mAB = mGaia + 0.125 (Maíz Apellániz & Weiler 2018). We employ standard ΛCDM cosmology with H0 = 69.6 km s−1 Mpc−1 and ΩM = 0.286 (Bennett et al. 2014).
2. Overview of SAGUARO
SAGUARO started operations in 2019 April and uses a network of telescopes,
24
primarily in Arizona. To facilitate the immediate follow-up of GW events, SAGUARO makes use of the Steward Observatory 1.5 m Mt. Lemmon telescope operated by the Catalina Sky Survey (CSS; Christensen et al. 2018). The telescope is equipped with a prime focus imager and a 10.5 K × 10.5 K CCD (077 per pixel), resulting in a 5 deg2 FOV. It is operated with 2 × 2 binning for an effective plate scale of 1
54 per pixel. CSS observes fixed fields on the sky, between declinations of −25 deg and +60 deg, while avoiding crowded regions in the Galactic plane (see Figure 1 of Lundquist et al. 2019a) and observes ∼24 nights per month, avoiding the period around full moon. During normal operations, CSS searches for near-Earth objects (NEOs) and potentially hazardous asteroids (PHAs). To accomplish this, CSS obtains 4 × 30 s exposures per field, observing 12 fields over the span of ∼30 minutes (thus, the typical survey speed is 120 deg2 per hour; ≳1000 deg2 per night). This results in four images per field separated by ∼8 minutes, allowing for the identification of moving objects. SAGUARO observations that are triggered for GW counterpart searches (“triggered fields”) follow the same observing strategy. These fields are typically triggered in sets of 60, 120, or 180 deg2 on the highest probability region of the GW localization that is observable. All images are taken without a filter and are calibrated to Gaia G-band using Gaia DR2 (Gaia Collaboration et al. 2018). For each 4 × 30 s set of median-combined images, we show the 5σ transient detection depth, defined as the magnitude of a source that can be detected through image subtraction with a peak pixel significance (signal-to-noise ratio; S/N) = 5, in Figure 1. The median 5σ transient detection depth is G ≈ 21.1 mag. For astrometry, images are tied to Gaia DR2. The details of the follow-up capabilities, as well as an example of such follow-up, can be found in Lundquist et al. (2019a).
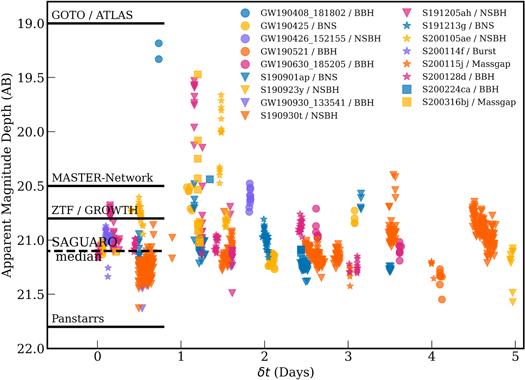
Figure 1. The 5σ transient depth of the SAGUARO fields measured from the image subtraction process versus δ t (defined as the time after the GW event) for 17 events with triggered or serendipitous fields; all symbols represent upper limits. The reported depths (in various filters and sigma levels) of other GW follow-up surveys: GOTO (Gompertz et al 2020), ATLAS (Tonry et al. 2018), the MASTER-Network (Lipunov et al. 2019i), ZTF/GROWTH (Kasliwal et al. 2020), and Pan-STARRS (Chambers et al. 2016), are shown as black horizontal lines. We also note a 23.1 mag i-band median depth of the CFHT survey (Vieira et al. 2020), a 23.0 mag g- or r-band median depth of the DECam/GROWTH searches (Anand et al. 2020b), a 22.4 mag i-band median depth of the Dark Energy Survey GW program (DESGW; based on two events; Morgan et al. 2020a, 2020b), and a 17.4 mag median limiting magnitude of the BNS and NSBH events by the GRANDMA collaboration (Antier et al. 2020). The median 5σ transient depth of SAGUARO fields, 21.1 mag, is deeper than many of the other GW follow-up surveys.
Download figure:
Standard image High-resolution image2.1. Image Subtraction and Candidate Vetting
Deep reference images were constructed based on nearly three years of CSS data, with an average limiting magnitude of G ≈ 23.0 mag. Data are run through a custom pipeline in real time that performs image subtraction on each 4 × 30 s median-combined image using ZOGY 25 (an image subtraction algorithm developed for optimal transient detection and flux measurement in the limit of background-dominated noise; Zackay et al. 2016). Candidates with an S/N > 5 are ingested into our database. PSF photometry is performed directly on the subtracted image, following the equations in Zackay et al. (2016), and calibrated to the CSS zero point calculated from Gaia DR2. A graphical summary of the entire candidate vetting process is shown in Figure 2. “Automatic vetting” and simple “human vetting” were performed for triggered SAGUARO fields in real time, with the results reported via GCN to the community. In this paper, we present a more detailed vetting of candidates in the context of the updates discussed in Section 3.
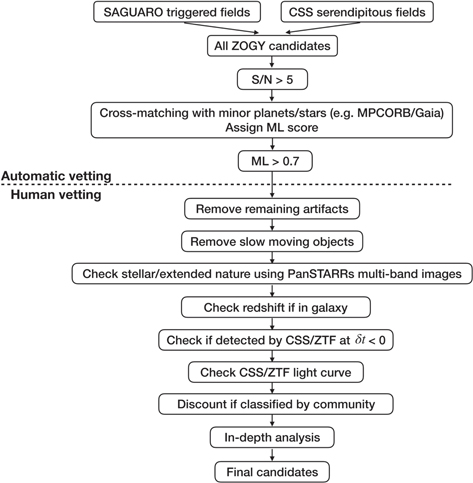
Figure 2. Flowchart describing the automatic and human vetting of SAGUARO candidates during the in-depth candidate search presented here and described in Section 2.1. All candidates from the image subtraction process using ZOGY (Zackay et al. 2016) with S/N > 5 are cross-matched to various databases (such as the Minor Planet Center Orbit Database and Gaia) and assigned a machine-learning (ML) score automatically after ingestion. Through a web interface, human vetting of candidates proceeds for all candidates with ML > 0.7. This process includes removing any remaining artifacts or slow-moving objects, cross-checking with Pan-STARRS images, checking the redshift of the candidate if in a galaxy, checking the CSS/ZTF light curve including the time of first detection, and community follow-up. A more in-depth study of the candidates is then performed. The details on the final candidates are summarized in Table 2.
Download figure:
Standard image High-resolution imageWe make use of various catalogs and databases, including the Minor Planet Center Orbit Database 26 (MPCORB) to identify known moving objects, and the Transient Name Server 27 (TNS) and the Zwicky Transient Facility (ZTF; Graham et al. 2019) to identify known transients. We also cross-match candidates with the Galaxy List for the Advanced Detector Era (GLADE; Dálya et al. 2018) for possible associations to nearby cataloged galaxies, and the Gaia DR2 catalog (Gaia Collaboration et al. 2018) to reduce contamination by stellar sources (see Section 3). Candidates are then assigned a machine-learning (ML) score, based on the likelihood of being a real astrophysical source. A cut of ML score >0.7 is made before continuing (see Section 3). This process falls under our “automatic vetting” and is done in real-time without human intervention to prepare candidates for “human vetting.”
We then move onto our human vetting through our web interface. We manually remove any remaining artifacts caused by satellite trails, bright stars, or optical reflections. Slow-moving objects that are not removed during the median stacking of the four images or found in the MPCORB were then rejected using our moving object calculator (see Section 3.3). Next, candidates coincident with point-like sources that we infer to be stellar with PanSTARRS1 multiband images (Chambers et al. 2016) that were not removed by the Gaia cross-matching, were rejected as potential kilonova candidates. If candidates are clearly spatially coincident with a galaxy, the redshift of the host galaxy (if known) is compared to the distance inferred for the GW event reported by LIGO/Virgo. Candidates with detections prior to the GW event in either CSS or ZTF were ruled out as being related to the GW event. Candidates with light curves inconsistent with the rise or fall times of kilonovae (see Section 3.5) built from a combination of CSS and ZTF data were rejected. Additionally, candidates already ruled out by the community through spectroscopic or photometric means (reported either through GCNs or papers) were discounted. The remaining candidates are then analyzed in more detail to assess their association with the GW event and provide value-added information. First, individual images are checked to assess shifts in the source's shape and position, as well as the presence of the candidate in each image, to confirm the candidate as a real source. Next, a literature search for spatially coincident galaxies using a radius, r < 4″ (equating to spatial scales of ∼2–13 kpc for distances of 100–500 Mpc) is performed. If no galaxy is found within the literature, we search the DESI Legacy Survey DR8 (Dey et al. 2019) data for a detection or limits (based on nearby detections) on a faint coincident host. For candidates embedded within a galaxy, the position of the candidate and offset, δ r, is reported relative to the position of the galaxy. For galaxies without measured redshifts, we check Pan-STARRS DR2 (Flewelling 2018) for photometric redshifts (zphoto). The final candidates for all events presented here are summarized in Table 2, with the details discussed in depth in the relevant individual event sections (Sections 4.6, 4.8, 4.9, 4.12, 4.16).
In addition to vetting our own candidates, we make use of normal CSS operations to rule out candidates reported by the community that were not followed up and are covered by CSS at a later date. For candidates within the CSS footprint, the positions of these candidates are put through the same automatic and human-vetting procedures as described above to assess their viability as genuine kilonova.
2.2. Coverage in O3
Starting alongside LIGO/Virgo's O3, SAGUARO had overlapping operations for 9.5 months with a duty cycle of 53.6% for the 24 hr window following each event and 78.6% for the 120 hr window after each event. 28 Including all observing constraints, CSS was available to trigger on 27 nonretracted events with δ t < 24 hr (where δ t is defined as the time after the event) and on 38 events within δ t < 120 hr. Our trigger criteria focused on events that contained potential NS components (where the sum of the classifications containing a possible NS, ∑(BNS,NSBH,MassGap) > 20% at the time of trigger) for which CSS could cover part of the 90% probability region when considering airmass and moon constraints described in Lundquist et al. (2019a); but also included unusual events such as S200114f, the “burst” event. Two additional components of importance “HasNS” and “HasRemnant” accompany each event. These describe the probability that the event has an NS and the probability that there is matter outside the final compact object (calculated based on the masses and spins inferred), respectively. With these classifications, we would expect events with large HasRemnant values to produce EM emission. While 38 events were available to trigger on, taking our trigger criteria and the GW sky localization under consideration, we triggered on 8 events. After taking data quality under consideration, we present seven triggered events during O3, including an initial trigger to test our system.
3. SAGUARO System Updates
In the following section, we describe significant updates to the SAGUARO system for the latter part of O3 that build upon the infrastructure outlined in Lundquist et al. (2019a). First, we discuss the improvement of the ML algorithm, allowing for more accurate classifications between real and bogus candidates. Second, we include cross-matching with Gaia proper motion measurements to remove candidates clearly associated with stellar sources. Third, we introduce a more streamlined approach to identify new, uncataloged moving objects, with particular attention to slower-moving objects that persist in the median images as candidates. Fourth, we implement infrastructure to identify and search through CSS fields that serendipitously overlap with observable GW events within δ t < 5 days, designated as “serendipitous fields.” And lastly, we discuss the use of kilonova models to place constraints on the photometric evolution of candidates.
3.1. Machine Learning
Candidates are given an ML score between 0 (bogus) and 1 (real) based on an ML model to reduce the number of bogus candidates. Following the example of Wright et al. (2015), this model was created using a random forest classifier that was trained on 10 × 10 pixel substamps of a sample that included 3678 detections of known transients and 56,062 bogus detections, including artifacts from bright stars and oversubtractions. To optimize our random forest model, we performed a grid search over the parameter space for the number of trees, the number of samples required to split an internal node, and the number of samples required to be a leaf node. Final values of 1000, 2, and 2 for these parameters were chosen respectively. To reduce overfitting in our ML model and improve generalization, we add Gaussian noise into our training sample data at the level of 1% of the peak brightness. To improve rotation invariance, we add versions of each image in our training sample that have been rotated by 90, 180, and 270 deg, effectively increasing our training set fourfold.
We evaluated the ML scores on a test sample that included 1285 detections of known transients. By selecting a lower limit on the ML score of 0.70, such that we only assess candidates with ML > 0.70, we recovered 94.3% of these known transients with an average score of 0.87. With every classifier, there is a trade-off between the number of false positives and the number of missed detections. Given this recovery rate of known transients, we use this score to maximize the number of real candidates and limit the number of false positives during human vetting.
3.2. Gaia Matching
To reduce the number of known variable stellar sources that produce residuals in subtracted images, all candidates are cross-matched against high proper motion objects in the Gaia DR2 catalog (Gaia Collaboration et al. 2018) upon ingestion. If a candidate matches a high proper motion source (μ > 3σ, where σ is the error on proper motion measurement) in the Gaia catalog, it is classified in the candidate database as a stellar object, as these sources must be stars within the Milky Way, and thus removed from our candidate vetting process. This reduces the number of candidates that need to be human vetted by ∼7.2%.
3.3. Moving Objects
Candidates are cross-matched against known moving objects from the MPCORB to remove these before human vetting. However, unknown moving objects, especially extremely slow-moving objects that move on the order of a pixel or less between each image and thus are not removed in the median image, can still persist as potential candidates. To help eliminate these slow-moving objects whose small shifts can be difficult to determine by eye, we implemented a moving object calculator. This calculator uses the position of the source in each of the four individual images and determines the shift between the first and each of the subsequent images along with the standard deviation of these shifts. With this method, we are able to identify moving objects that move as little as ∼1 pixel between each of the individual images i.e., ∼16/8 minutes.
3.4. Serendipitous Fields
While GW 170817 peaked in the r band at δ t ≈ 0.65 days and faded at a rate of ∼1 mag per day (e.g., Cowperthwaite et al. 2017; Kasen et al. 2017; Nicholl et al. 2017; Valenti et al. 2017; Villar et al. 2017), kilonova models describing various progenitor and remnant scenarios predict a diversity in peak times and fading behaviors (e.g., Metzger & Fernández 2014; Kasen et al. 2015; Barbieri et al. 2020; see Section 3.5 and Figure 4). As CSS maps ∼1000 deg2 of the sky each night in search of NEOs and PHAs, this provides the opportunity to analyze additional data outside our triggered area and time frame in search of optical counterparts. Thus motivated, we ingest incoming CSS survey data to search for fields that serendipitously fall within the 90% contour of the localization of GW events within δ t < 5 days (i.e., <120 hr). We perform image subtraction between these fields and our deep reference images using ZOGY, and perform the same cross-matching and ingestion as described above. When only considering the triggered fields, SAGUARO covers between 15–180 deg2 for each triggered event. The inclusion of these serendipitous fields results in increased coverage of up to 2115 deg2 for purely serendipitous events. For events with triggered fields, we see up to ∼9 times in additional area coverage (see Figure 3). In total, we have serendipitous coverage of up to ∼43% of the LVC total probability (Ptotal) for individual events. Thus, we present an additional 10 events with serendipitous fields, defined as those with coverage in the range of δ t < 120 hr.
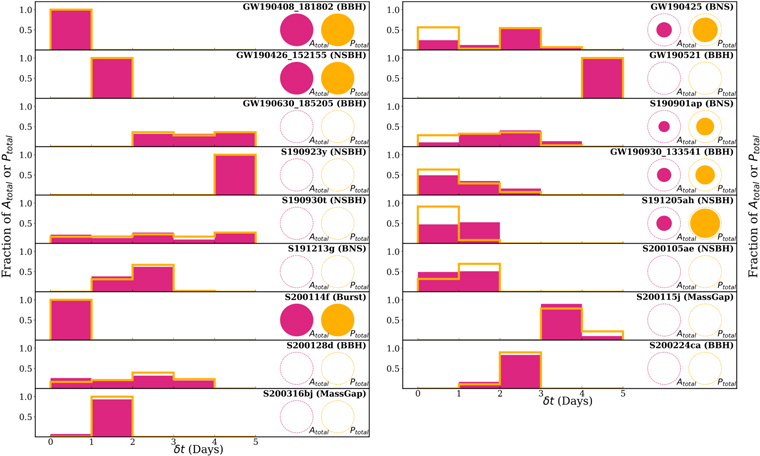
Figure 3. Temporal and areal coverage of all GW events with significant follow-up from SAGUARO during O3. The histogram shows the fraction of the total area (Atotal, solid pink) and probability (Ptotal, gold line) covered as a function of δ t. For the probability covered, in the case where a field was observed twice, each observation will contribute to the probability covered in the respective bin. Thus, for some events, the sum of the histogram can be >1. The circles on the right show the area/probability covered by triggered fields (filled circle) normalized to the total covered area by including the serendipitous fields (open circle). As such, events with only a filled circle represent those without serendipitous coverage, while those with only open circles show purely serendipitous events.
Download figure:
Standard image High-resolution image3.5. Kilonova Models
To place constraints on photometric evolution, for events classified as BNS, NSBH, or MassGap, we compare each candidate to a number of kilonova models that represent a large range of progenitor and remnant scenarios. To describe the data of GW 170817/AT 2017gfo, we choose the two-component model described in Kasen et al. (2017), which we smooth with a Savitsky–Golay filter. For NSBH events, we compare to a model by Kawaguchi et al. 2020 parameterized by an ejecta mass Mej = 0.06M⊙.
29
We correct for the ∼0.2 mag artificial excess brightness (determined through private communication with the authors) due to the use of a restricted line list in calculating the ejecta opacity and smooth using a Savitsky–Golay filter. We also compare to three BNS models with resulting hypermassive NS (HMNS) remnant lifetimes of 0 ms (prompt formation of a BH), 100 ms, and infinite (corresponding to an indefinitely stable remnant; Kasen et al. 2015). The overall effect of a long-lived NS remnant, as opposed to prompt collapse to a BH, is that the remnant radiates neutrinos into the postmerger disk, resulting in a bright and blue slow-rising kilonova (Metzger & Fernández 2014; Perego et al. 2014; Metzger 2017). Finally, to describe a massive merger event like GW 190425 (with a chirp mass of  Abbott et al. 2020a), we choose two models. The first model's ejecta masses are ≳0.1M⊙ with the DD2 equation of state, representing an optimistic transient brighter than AT 2017gfo (Barbieri et al. 2020). The second assumes ejecta mass Mej = 0.04M⊙, velocity vej = 0.15c, and lanthanide fraction Xlan = 10−2, and predicts a kilonova less luminous than AT 2017gfo across all bands (Foley et al. 2020). We show these models in rest-frame time units (δ
trest) in Figure 4, along with the absolute magnitude of our 5σ transient depth for individual fields. Even for the slowest rising model, given by an indefinitely stable remnant, the peak of emission occurs at δ
t ∼ 2.5 days. We can thus use the rise times to rule out candidates that continue to rise for δ
t ≫ 3 days. Given the time evolution of all models, we can also use the fading time to rule out candidates that have detections on longer timescales, i.e., for candidates detected months after the GW event. In general, SAGUARO is able to search to depths that would allow the detection of kilonova emission out to ∼150–400 Mpc, assuming detection at peak brightness and depending on the model assumed (see Figure 4).
Abbott et al. 2020a), we choose two models. The first model's ejecta masses are ≳0.1M⊙ with the DD2 equation of state, representing an optimistic transient brighter than AT 2017gfo (Barbieri et al. 2020). The second assumes ejecta mass Mej = 0.04M⊙, velocity vej = 0.15c, and lanthanide fraction Xlan = 10−2, and predicts a kilonova less luminous than AT 2017gfo across all bands (Foley et al. 2020). We show these models in rest-frame time units (δ
trest) in Figure 4, along with the absolute magnitude of our 5σ transient depth for individual fields. Even for the slowest rising model, given by an indefinitely stable remnant, the peak of emission occurs at δ
t ∼ 2.5 days. We can thus use the rise times to rule out candidates that continue to rise for δ
t ≫ 3 days. Given the time evolution of all models, we can also use the fading time to rule out candidates that have detections on longer timescales, i.e., for candidates detected months after the GW event. In general, SAGUARO is able to search to depths that would allow the detection of kilonova emission out to ∼150–400 Mpc, assuming detection at peak brightness and depending on the model assumed (see Figure 4).
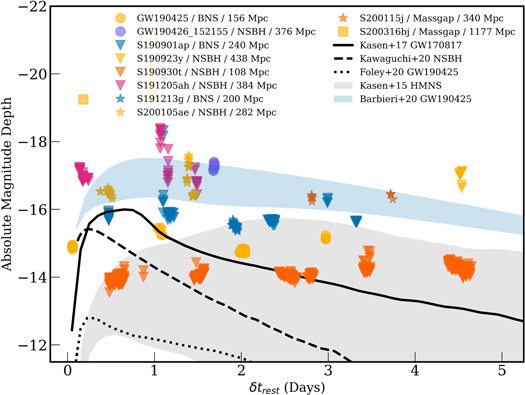
Figure 4. The 5σ transient depth in absolute magnitude space of individual SAGUARO fields with five kilonova models in the r band. The solid black line represents a model for a GW 170817/AT 2017gfo–like kilonova (Kasen et al. 2017). The dashed black line shows a modeled kilonova from an NSBH merger viewed at 41 < θ < 46 deg off axis (Kawaguchi et al. 2020). The dotted line is a model for the unusually massive event GW 190425 in the case of a BNS merger (Foley et al. 2020). The gray band models a slow-rising kilonova in the case of an NS remnant (Kasen et al. 2015) for a prompt collapse (lower boundary), lifetime of 100 ms, and an infinite lifetime (upper boundary). Finally, the blue band is a more optimistic model for the unusually massive event GW 190425 in the case of an NSBH merger (upper boundary) and a BNS merger (lower boundary) (Barbieri et al. 2020). SAGUARO observations for BNS, NSBH, and MassGap events are scaled to the median inferred distance reported by LIGO/Virgo.
Download figure:
Standard image High-resolution image4. Individual Events and Results
Here we (i) present a more detailed analysis of the search for candidate counterparts in triggered fields, given the improvements to our automatic vetting portion of the pipeline (Section 3) using updated localizations and (ii) extend this analysis to the serendipitous fields for all events that have SAGUARO coverage with Ptotal > 2%.
For triggered fields, we vetted candidates in real time to search for optical counterparts. Information on these fields was provided to the community through GCNs (Paterson et al. 2019a; Lundquist et al. 2019b; Paterson et al. 2019b; Lundquist et al. 2019c, 2019d, 2020a, 2020b) and uploaded to the Gravitational Wave Treasure Map 30 (Wyatt et al. 2020). During O3, we reported observations of six new candidates found by SAGUARO in the triggered fields (SN2019wdb, Paterson et al. 2019b; SAGUARO20a, SAGUARO20b, SAGUARO20c, SAGUARO20d, and SAGUARO20e, Lundquist et al. 2020b). We were also able to rule out two community-identified candidates: the first, AT 2020vx, due to a previous CSS detection (Lundquist et al. 2020a), and the second, SN 2019ebq, due to spectroscopic classification (Lundquist et al. 2019a).
We exclude four GW events from our analysis that had serendipitous coverage Ptotal < 2%. Three of these are candidate BBH mergers (for which bright EM counterparts are less likely), while the fourth is a candidate NSBH merger, S190910d (LIGO Scientific Collaboration & Virgo Collaboration 2019c), which has d = 632 ± 186 Mpc (such that our imaging does not reach sufficient depths to make any meaningful statements on NSBH kilonova emission). We also exclude an additional two events, one triggered (S191216ap; LIGO Scientific Collaboration & Virgo Collaboration 2019d) and one serendipitous (S191215w; LIGO Scientific Collaboration & Virgo Collaboration 2019e), from our analysis due to poor data quality from bad weather.
Thus, in total, we present observations for 17 GW events, 7 triggered and 10 with only serendipitous coverage. In this section, we detail the GW discovery and relevant follow-up observations of these 17 events. For each, we summarize all relevant candidates reported by the community (focusing on actual candidates detected by the community versus survey limits), investigate whether they are still viable kilonova candidates with available information (checking GCNs, publicly available data uploaded to TNS, public ZTF data, peer-reviewed papers, and our own data), and present our own candidate search. We note that SAGUARO follow-up of three of these events was also detailed in Lundquist et al. (2019a); however, we include their details again here based on our updated system, results from additional serendipitous fields, as well as the follow-up of community candidates.
An overview of our observations, including the area covered by the 50%, 90%, and total localization (A50%, A90%, Atotal), as well as the percentage of the total probability (Ptotal) covered for each event, is listed in Table 1. The GW localization maps, along with our coverage, are displayed in Appendix. A summary of our final candidates is presented in Table 2. Hereafter, we use the common designations L1 (LIGO Livingston), H1 (LIGO Hanford), and V1 (Virgo).
Table 1. Summary of SAGUARO Follow-up in O3
| Event | Type c | FAR | Distance | δ tfirst b | δ t | Fields | 5σ Limit a | A50% | A90% | Atotal | Ptotal |
|---|---|---|---|---|---|---|---|---|---|---|---|
| (Hz) | (Mpc) | (hr) | (hr) | observed | (AB Mag) | (deg2) | (deg2) | (deg2) | (%) | ||
| GW 190408_181802 d | BBH | 2.8e-18 | 1472.90 ± 357.88 | 17.6 | <24 | 3 | 19.2 | 5.7 | 12.9 | 15.0 | 13.73 |
| GW 190425 d | BNS | 4.5e-13 | 156.14 ± 41.37 | 1.4 | <24 | 12 | 21.1 | 60.0 | 60.0 | 60.0 | 3.68 |
| 24−48 | 12 | 20.5 | 0.2 | 48.5 | 60.0 | 0.23 | |||||
| 48−72 | 31 | 21.2 | 72.0 | 149.6 | 155.0 | 3.57 | |||||
| 72−96 | 6 | 20.8 | 12.2 | 26.9 | 30.0 | 0.46 | |||||
| 21.1 | 124.4 | 265.0 | 285.0 | 6.55 | |||||||
| GW 190426_152155 d | NSBH | 1.9e-8 | 376.72 ± 100.44 | 43.6 | 24−48 | 12 | 20.6 | 17.3 | 54.4 | 60.0 | 4.48 |
| GW 190521 | BBH | 3.8e-9 | 3931.42 ± 953.03 | 98.3 | 96−120 | 7 | 21.3 | 0.3 | 30.5 | 35.0 | 2.27 |
| GW 190630_185205 | BBH | 1.44e-13 | 925.67 ± 258.51 | 62.7 | 48−72 | 8 | 21.0 | 25.3 | 38.2 | 40.0 | 9.07 |
| 72−96 | 8 | 21.1 | 21.0 | 36.3 | 40.0 | 7.14 | |||||
| 96−120 | 10 | 20.9 | 26.5 | 46.1 | 50.0 | 9.09 | |||||
| 21.0 | 72.7 | 120.7 | 130.0 | 25.29 | |||||||
| S190901ap d | BNS | 7.0e-9 | 240.87 ± 78.65 | 11.9 | <24 | 12 | 21.1 | 60.0 | 60.0 | 60.0 | 1.66 |
| 24−48 | 38 | 21.0 | 101.4 | 190.0 | 190.0 | 1.87 | |||||
| 48−72 | 44 | 21.2 | 119.6 | 219.6 | 220.0 | 2.06 | |||||
| 72−96 | 15 | 21.3 | 0.0 | 69.4 | 75.0 | 0.19 | |||||
| 21.2 | 281.0 | 539.0 | 545.0 | 5.79 | |||||||
| S190923y | NSBH | 4.78e-8 | 438.09 ± 132.95 | 118.6 | 96−120 | 9 | 21.2 | 28.3 | 43.1 | 45.0 | 4.05 |
| GW 190930_133541 d | BBH | 3.0e-9 | 708.90 ± 190.66 | 12.79 | <24 | 32 | 21.3 | 72.1 | 153.0 | 160.0 | 8.33 |
| 24−48 | 24 | 21.2 | 0.0 | 106.8 | 120.0 | 3.79 | |||||
| 48−72 | 11 | 21.1 | 0.0 | 43.2 | 55.0 | 1.00 | |||||
| 21.2 | 72.1 | 303.0 | 335.0 | 13.13 | |||||||
| S190930t | NSBH | 1.5e-8 | 108.49 ± 37.67 | 11.80 | <24 | 91 | 21.2 | 74.3 | 451.5 | 455.0 | 1.51 |
| 24−48 | 61 | 21.2 | 219.2 | 305.0 | 305.0 | 1.58 | |||||
| 48−72 | 115 | 21.1 | 207.3 | 567.9 | 575.0 | 2.04 | |||||
| 72−96 | 41 | 21.0 | 205.0 | 205.0 | 205.0 | 1.55 | |||||
| 96−120 | 117 | 20.9 | 263.7 | 580.4 | 585.0 | 2.47 | |||||
| 21.1 | 964.4 | 2104.8 | 2120.0 | 9.13 | |||||||
| S191205ah d | NSBH | 1.2e-8 | 384.97 ± 163.72 | 3.60 | <24 | 27 | 21.0 | 68.8 | 130.1 | 135.0 | 10.00 |
| 24−48 | 30 | 20.9 | 4.6 | 147.3 | 150.0 | 0.91 | |||||
| 20.9 | 73.4 | 277.4 | 285.0 | 10.91 | |||||||
| S191213g | BNS | 3.55e-8 | 200.86 ± 80.96 | 47.4 | 24−48 | 8 | 20.9 | 2.5 | 39.6 | 40.0 | 0.65 |
| 48−72 | 18 | 21.0 | 13.8 | 85.0 | 90.0 | 1.40 | |||||
| 72−96 | 2 | 21.0 | 0.0 | 9.2 | 10.0 | 0.05 | |||||
| 21.0 | 16.2 | 133.8 | 140.0 | 2.10 | |||||||
| S200105ae | NSBH | 7.67e-7 | 282.85 ± 73.78 | 20.7 | <24 | 23 | 19.64 | 6.5 | 104.3 | 115.0 | 0.90 |
| 24−48 | 30 | 20.4 | 55.0 | 139.1 | 150.0 | 1.97 | |||||
| 20.7 | 61.5 | 240.9 | 260.0 | 2.84 | |||||||
| S200114f d | IMBH | 1.2e-9 | n/a | 2.36 | <24 | 36 | 21.0 | 37.7 | 176.1 | 180.0 | 86.30 |
| S200115j | MassGap | 2.09e-11 | 332.22 ± 78.46 | 72.5 | 72−96 | 9 | 21.3 | 0.0 | 37.5 | 45.0 | 2.07 |
| 96−120 | 2 | 21.4 | 0.0 | 9.9 | 10.0 | 0.57 | |||||
| 21.3 | 0.0 | 47.4 | 55.0 | 2.64 | |||||||
| S200128d | BBH | 1.65e-8 | 3701.59 ± 1264.51 | 0.16 | <24 | 16 | 21.1 | 4.1 | 72.3 | 80.0 | 1.93 |
| 24−48 | 15 | 21.0 | 13.2 | 71.5 | 75.0 | 2.48 | |||||
| 48−72 | 20 | 20.9 | 42.0 | 92.6 | 100.0 | 4.66 | |||||
| 72−96 | 13 | 21.3 | 25.9 | 62.8 | 65.0 | 2.73 | |||||
| 21.0 | 85.2 | 299.1 | 320.0 | 11.80 | |||||||
| S200224ca | BBH | 1.61e-11 | 1575.00 ± 322.36 | 32.3 | 24−48 | 1 | 20.4 | 0.0 | 3.9 | 5.0 | 1.18 |
| 48−72 | 4 | 21.1 | 0.0 | 14.9 | 20.0 | 10.24 | |||||
| 21.1 | 0.0 | 18.8 | 25.0 | 11.42 | |||||||
| S200316bj | MassGap | 7.10e-11 | 1177.98 ± 283.01 | 5.4 | <24 | 2 | 21.1 | 0.0 | 5.1 | 10.0 | 0.24 |
| 24−48 | 18 | 20.9 | 22.1 | 88.9 | 90.0 | 73.00 | |||||
| 20.9 | 22.1 | 93.9 | 100.0 | 73.24 |
Notes. Magnitudes reported here are uncorrected for Galactic extinction and are reported in the Gaia G band.
The probability covered refers to the percent of the probability of the 50%, 90%, and total localizations that were covered by these observations.
a Median 5σ transient detection depth. b δt of the first field after the GW event. c Most likely classification based on GW probabilities (Kapadia et al. 2020). d Triggered events.Download table as: ASCIITypeset image
Table 2. Viable SAGUARO Candidates from O3
| Event | Candidate | R.A. | Decl. | mcan | MJD | δ trest | Host a | mhost | zhost | δ r |
|---|---|---|---|---|---|---|---|---|---|---|
| (Type) | (Gaia G) | (+58,000) | (days) | |||||||
| S190901ap | SAGUARO19k b | 04:06:26.2 | −12:01:13 | 20.9 | 728.4880 | 0.48 | No f | g > 25.6 | ⋯ | |
| (BNS) | /AT 2019aaid | r > 24.6 | ||||||||
| z > 24.5 | . | |||||||||
| GW 190930_133541 | SAGUARO19n | 21:53:14.0 | −06:43:38 | 20.6[20] | 759.1745 | 2.17 | Yes d , k | u = 20.7 | 0.208 ± 0.030 g | |
| (BBH) | /AT 2019aaig | g = 20.0 | 0.168 ± 0.041 i | |||||||
| r = 19.3 | ||||||||||
| i = 18.9 | ||||||||||
| z = 18.8 | ||||||||||
| S190930t | SAGUARO19l b | 20:40:05.2 | −01:39:09 | 20.9 | 758.1318 | 1.49 | Yes f | g = 22.5 | ⋯ | ∼0 |
| (NSBH) | /AT 2019aaie | r = 21.5 | ||||||||
| z = 20.9 | ||||||||||
| SAGUARO19m b | 20:15:45.8 | −07:55:44 | 18.6 | 759.1088 | 2.44 | No k | ⋯ | ⋯ | ||
| /AT 2019aaif | ||||||||||
| SAGUARO19o b | 23:22:03.4 | −23:15:11 | 20.3 | 761.2123 | 4.49 | Yes e | J = 15.1 | 0.07 ± 0.03 h | 7 | |
| /AT 2019aaih | H = 14.3 | 0.113 ± 0.008 i j | ||||||||
| K = 14.1 | ||||||||||
| S200105ae | SAGUARO20h | 07:41:24.0 | 09:27:59 | 18.9[20] | 854.2061 | 0.49 | No k | ⋯ | ⋯ | |
| (NSBH) | /AT 2020abgt | |||||||||
| S200128d | SAGUARO20i | 14:16:09.0 | −06:22:43 | 20.3[240] | 876.5531 | 0.28 | Yes f | g = 19.5 | 0.065 ± 0.039 i | 1 |
| (BBH) | /AT 2020abgu | r = 19.1 | ||||||||
| z = 18.7 |
Notes.
a Here we define the host as an underlying galaxy coincident with the candidate within r < 4″. b Within the 50% sky localization probability map. c [X] X times more luminous than models discussed here. d Host magnitudes from Alam et al. (2015). e Host magnitudes from Bilicki et al. (2014). f Host magnitudes/limits from Dey et al. (2019) g zphoto from Alam et al. (2015). h zphoto from Bilicki et al. (2014). i zphoto from Flewelling (2018). j zphoto > 3σ outside LIGO/Virgo d. k Nearby galaxy within 40″.Download table as: ASCIITypeset image
4.1. GW 190408_181802
A candidate GW signal was identified on 2019-04-08 at 18:18:02.288 UTC using data from L1, H1, and V1 (LIGO Scientific Collaboration & Virgo Collaboration 2019f). The final classification for this event is >99% BBH at a distance, d = 1473 ± 358 Mpc. This event, as the first of the O3 alerts, served as a test for our system, and we triggered three fields. The initial follow-up for these triggered fields is discussed in Lundquist et al. (2019a). No serendipitous fields were covered by CSS within our search interval of δ t < 120 hr. The localization of the event, along with the CSS fields that fall within the 90% probability region, is shown in Figure 5.
A total of 11 candidates were initially reported by the community via GCN (MASTER-Network, Pan-STARRS, Gaia; Lipunov et al. 2019a; Smith et al. 2019a; Kostrzewa-Rutkowska et al. 2019a; Lipunov et al. 2019b; Kostrzewa-Rutkowska et al. 2019b). Initial follow-up, either through photometry or spectroscopy, ruled out four of these as viable candidates (Valeev et al. 2019b; Jonker et al. 2019b; Kostrzewa-Rutkowska et al. 2019c; Onori et al. 2019; Chen et al. 2019). SN 2019daj was found to have detections prior to the GW event (Smartt et al. 2019a) and later classified as a Type Ia SN (Burke et al. 2019). Later follow-up classified another candidate, SN 2019dma, as a Type II SN (Prentice et al. 2019). Another candidate, AT 2019dpg, was detected by routine ZTF survey operations out to ∼35 days after the GW event (Nordin et al. 2019). Having faded by <1.5 mag over a month, we consider it to be unrelated to the GW event based on photometric evolution. Searching public ZTF data, we find that another candidate, AT 2019deu, shows variability for over a year after the GW event (Masci et al. 2019). We thus consider it to be unrelated to the GW event. Of the remaining four candidates, CSS observed the positions of AT 2019doo, AT 2019dmc, and AT 2019dev. We found no detections down to a limit of 20.8, 21.0, and 21.2 mag at δ t = 74.7, 65.7, and 65.8 days, respectively. With these limits, we are not able to rule out these as potential candidates. No other viable candidates were found within our data.
4.2. GW 190425
A candidate GW signal with classification >99% BNS was identified on 2019-04-25 at 08:18:05.017 UTC using data from L1 and V1 (LIGO Scientific Collaboration & Virgo Collaboration 2019g). This event was later confirmed to be a real BNS merger with a total mass of  that occurred at
  (Abbott et al. 2020a). We triggered 12 fields in the northern part of the localization with δ
t < 24 hr. The initial follow-up of these triggered fields are discussed in more detail in Lundquist et al. (2019a). In total, we obtained additional serendipitous coverage of 49 fields (245 deg2) at δ
t < 96 hr. Including the triggered fields, the total probability coverage for this event was Ptotal = 6.55% (Table 1). The localization of the event, along with the CSS fields that fall within the 90% region, is shown in Figure 5, subfigure 5.2.
(Abbott et al. 2020a). We triggered 12 fields in the northern part of the localization with δ
t < 24 hr. The initial follow-up of these triggered fields are discussed in more detail in Lundquist et al. (2019a). In total, we obtained additional serendipitous coverage of 49 fields (245 deg2) at δ
t < 96 hr. Including the triggered fields, the total probability coverage for this event was Ptotal = 6.55% (Table 1). The localization of the event, along with the CSS fields that fall within the 90% region, is shown in Figure 5, subfigure 5.2.
A total of 54 candidate optical counterparts were reported by the community from ZTF, ATLAS, Pan-STARRS, Swift/UVOT, and Gaia (McBrien et al. 2019a; Smith et al. 2019b, 2019c; Kostrzewa-Rutkowska et al. 2019d, 2019e, 2019f, 2019g; Kasliwal et al. 2019; Breeveld et al. 2019; Anand et al. 2019). Hosseinzadeh et al. (2019) compiled a list of all public follow-up searches that were reported for this event at the time, including these 54 candidates and an additional 15 pre-event transients reported by Kasliwal et al. (2019). Of these 54 candidates, 6 were excluded after spectroscopic classification (Short et al. 2019a; Jonker et al. 2019a; Perley et al. 2019b; Buckley et al. 2019b; Pavana et al. 2019; Nicholl et al. 2019), 8 had redshifts inconsistent with the inferred LIGO/Virgo distance (Short et al. 2019b; Anand et al. 2019), while an additional 9 were detected prior to the GW event (Coughlin et al. 2019a; Andreoni & Bellm 2019a; Andreoni et al. 2019c). Five of these 54 candidates had marginal detections (McBrien et al. 2019a), with follow-up imaging failing to confirm these as real candidates (Perley & Copperwheat 2019; Steeghs et al. 2019). Later follow-up by Coughlin et al. (2019b) ruled out an additional four candidates due to photometric evolution that was inconsistent with a kilonova. Routine survey operations by Pan-STARRS resulted in photometric coverage of an additional candidate, AT 2019eby, ∼1 month after the GW event (Chambers et al. 2016). Having faded by <0.4 mag over a month, we consider it to be unrelated to the GW event based on photometric evolution. Of the remaining 21 candidates, the positions of 20 were covered by CSS survey operations over the subsequent months. Only one candidate, AT 2019ech, was identified, just below our automatic vetting S/N threshold (with S/N ≈ 4.2) and 5σ transient depth of 21.0 mag, ∼17 days later. Having faded by <0.4 mag, we are able to rule it out as a viable candidate. None of the other candidates were detected in our data. We find no new candidates within our serendipitous data.
4.3. GW 190426_152155
GW 190426_152155 was identified as a candidate GW event on 2019-04-26 15:21:55.337 UTC in data from H1, L1, and V1 (Ligo Scientific Collaboration & VIRGO Collaboration 2019h). This event is classified as a MassGap and is either an NSBH or BBH with masses of  and
and  at
at  Mpc (Ligo Scientific Collaboration & VIRGO Collaboration 2019a; Abbott et al. 2020b). We triggered 12 fields for this event in the interval δ
t = 24–48 hr (Table 1). The initial follow-up of these triggered fields are discussed in more detail in Lundquist et al. (2019a). No additional fields within the 90% localization were covered by CSS during normal operations over the subsequent 120 hr after the detection. The localization of the event, along with the CSS fields that fall within the 90% region, is shown in Figure 5, subfigure 5.3.
Mpc (Ligo Scientific Collaboration & VIRGO Collaboration 2019a; Abbott et al. 2020b). We triggered 12 fields for this event in the interval δ
t = 24–48 hr (Table 1). The initial follow-up of these triggered fields are discussed in more detail in Lundquist et al. (2019a). No additional fields within the 90% localization were covered by CSS during normal operations over the subsequent 120 hr after the detection. The localization of the event, along with the CSS fields that fall within the 90% region, is shown in Figure 5, subfigure 5.3.
A total of 30 optical candidate counterparts were reported by the community from LCOGT, DECam/GROWTH, ZTF, GRAWITA, and Gaia (Arcavi et al. 2019a; Izzo et al. 2019a; Coughlin et al. 2019c; Perley et al. 2019c; Andreoni et al. 2019e; Kostrzewa-Rutkowska et al. 2019h, 2019i). Hosseinzadeh et al. (2019) compiled a list of all public follow-up searches that were reported for this event at the time. Of these candidates, five were spectroscopically classified and excluded as kilonova candidates (Valeev et al. 2019c; Hu et al. 2019d), three were detected prior to the GW event (Andreoni et al. 2019a; Arcavi et al. 2019b; Andreoni & Bellm 2019b), and one had a redshift inconsistent with the inferred LIGO/Virgo distance (Perley et al. 2019c). Later follow-up by Kasliwal et al. (2020) ruled out 10 candidates based on spectroscopic classification, photometric evolution, or association with a stellar source or artifact. CSS coverage of one of these sources, ZTF 19aaslszp/AT 2019snj, reveals a rising light curve ∼1 month after the GW event, consistent with the finding of Kasliwal et al. 2020 that it is unrelated to the GW event. Seven DECam/GROWTH candidates discussed in Goldstein et al. (2019) were initially ruled out as they were outside the updated LALInference localization; however, GWTC-2 included a new localization that had these candidates within the 90% region. Four of these candidates, DG19ftnb, DG19kqxe, DG19nmaf, and DG19zyaf, were covered by CSS ∼1 week after the event. None were detected to a limit of ∼21.0 mag. DG 19zdwb was covered by CSS ∼40 days after the event and was not detected down to a limit of ∼20.9. The other two candidates, DG 19ouub and DG 19vkgf, were only covered by CSS operations ∼278 days after the GW event, with nondetections to a limit of 21.6 and 22.1 mag, respectively. With these limits, we are not able to rule out any of these as potential candidates. None of the remaining four candidates were covered by CSS, and no new candidates were found within our data.
4.4. GW 190521
GW 190521 was identified as a candidate GW signal using data from H1, L1, and V1 on 2019-05-21 03:02:29.447 UTC (Ligo Scientific Collaboration & VIRGO Collaboration 2019i) and later confirmed to be a BBH merger of two unusually high mass components of  and
and  (Abbott et al. 2020b, 2020e), at
  Gpc (Ligo Scientific Collaboration & VIRGO Collaboration 2019j). There are no triggered fields for this event, and our total serendipitous coverage is seven fields (35 deg2) in the interval δ
t = 96–120 hr, with Ptotal = 2.27% (Table 1). The localization of the event, along with the CSS fields that fall within the 90% region, is shown in Figure 5, subfigure 5.4.
Gpc (Ligo Scientific Collaboration & VIRGO Collaboration 2019j). There are no triggered fields for this event, and our total serendipitous coverage is seven fields (35 deg2) in the interval δ
t = 96–120 hr, with Ptotal = 2.27% (Table 1). The localization of the event, along with the CSS fields that fall within the 90% region, is shown in Figure 5, subfigure 5.4.
Graham et al. (2020) reported the detection of a potential counterpart, ZTF 19abanrhr, which they found to be consistent with a kicked BBH merger inside the accretion disk of an active galactic nucleus (AGN). Ashton et al. (2020), however, found insufficient data to confidently associate this optical counterpart with the GW event. They determined the odds (defined as the ratio of the probabilities between the scenario where the AGN is caused by the BBH and a random coincidence) for this event to be 1–12, depending on the waveform model used, compared to the 106 found for GW 170817 and AT 2017gfo. The location of ZTF 19abanrhr and host, J124942.3+344929, is within the CSS footprint; however, we have no data for the period over the duration of the flare (which started at δ t ∼ 50 days and had a a duration of ∼50 days). Our closest coverage was at δ t ∼ 47 days, 3 days before the approximate start of the flare, which can be used to help constrain the start of the flare and preflare activity. At this time, we find no detection of a transient or significant change in magnitude for the galaxy relative to the deep reference to a limit of 20.7 mag. Over the course of 53 epochs prior to the event, the source maintained a constant flux within 1σ of 19.00 ± 0.19 mag. Additionally, Podlesnyi & Dzhatdoev (2020) reported limits from a search for high-energy γ-rays in publicly available Fermi-LAT data in the 100–300 MeV range for this candidate. No other candidates were reported by the community, and a search of our serendipitous data found no candidates within the covered fields.
4.5. GW 190630_185205
A candidate GW signal was identified using data from L1 and V1 on 2019-06-30 at 18:52:05.180 UTC (Ligo Scientific Collaboration & VIRGO Collaboration 2019k). The final classification for this event, GW 190630_185205, is a BBH merger with masses of  and
and  at
at  Mpc (Abbott et al. 2020b). There are no triggered fields for this event. In total, we covered 26 fields serendipitously with δ
t < 120 hr, totaling 130 deg2, with Ptotal = 25.29% (Table 1). The localization of the event, along with the CSS fields that fall within the 90% region, is shown in Figure 5, subfigure 5.5. Only a single Gaia candidate was reported within the localization (Kostrzewa-Rutkowska et al. 2019j); however, no additional follow-up was conducted. This candidate was not covered by CSS. No new candidates were found within our serendipitous data.
Mpc (Abbott et al. 2020b). There are no triggered fields for this event. In total, we covered 26 fields serendipitously with δ
t < 120 hr, totaling 130 deg2, with Ptotal = 25.29% (Table 1). The localization of the event, along with the CSS fields that fall within the 90% region, is shown in Figure 5, subfigure 5.5. Only a single Gaia candidate was reported within the localization (Kostrzewa-Rutkowska et al. 2019j); however, no additional follow-up was conducted. This candidate was not covered by CSS. No new candidates were found within our serendipitous data.
4.6. S190901ap
A candidate GW signal was identified using data from L1 and V1 on 2019-09-01 at 23:31:01.838 UTC (Ligo Scientific Collaboration & VIRGO Collaboration 2019l). The final classification for this event, S190901ap, is 86% BNS at d = 241 ± 79 Mpc, with a 14% probability of being terrestrial in nature. We triggered 12 fields (60 deg2) at δ t < 24 hr. Additionally, we covered 97 fields serendipitously (485 deg2) in the interval δ t = 24–96 hr. In total, we observed 109 fields with δ t < 96 hr, totaling 545 deg2 with Ptotal = 5.79% (Table 1). The localization of the event, along with the CSS fields that fall within the 90% region, is shown in Figure 5, subfigure 5.6.
Initially, 19 candidates were reported by the community via GCN (ZTF, Stein et al. 2019b, 2019c; Kool et al. 2019; MASTER-Network, Lipunov et al. 2019c; GOTO, Ackley et al. 2019; Gaia Kostrzewa-Rutkowska et al. 2019k). Of these, 17 were subsequently ruled out as possible kilonova candidates by the community due to association with a galaxy at a distance outside the inferred LIGO/Virgo distance range, spectroscopic classification, or photometric evolution (Burdge et al. 2019a, 2019b; Izzo et al. 2019b; Salmaso et al. 2019; Rosell et al. 2019; Kumar et al. 2019; Wei et al. 2019; Nascimbeni et al. 2019; Kankare et al. 2019; Kasliwal et al. 2020). We find a detection ∼1 month later for ZTF 19abvjnsm, initially ruled out by an inconsistent photo z (Kool et al. 2019), confirming it to be unrelated to the GW event due to inconsistent photometric evolution. Likewise, we also find a detection ∼1 month later for ZTF 19abwsmmd/AT 2019pnc, consistent with the findings of Kasliwal et al. 2020, which ruled it out as a candidate due to a slow decline rate. Of the two candidates not followed up by the community, we find a detection ∼1 month later for Gaia 19dzi/AT 2019piw, showing inconsistent photometric evolution for a kilonova and thus ruling it out as a candidate.
During our search, we found a single new candidate, SAGUARO19k/AT 2019aaid (Paterson et al. 2020) at R.A. = 04h06m262 and decl. = −12d01m13s (see Table 2). Performing PSF photometry on the subtracted image, we obtain mcan = 20.95 ± 0.27 mag at δ
trest = 0.48 days, making it consistent with an AT 2017gfo–like kilonova when transforming to absolute magnitude space using the inferred distance from LIGO/Virgo. However, the candidate only has a single detection, with no pre-event data and no additional coverage of the field by CSS until three months after the event, by which time the source is no longer detected to a limit of 20.6 mag. Searching public ZTF data, we find nondetections to the limits of r = 20.42 and 20.27 mag at δ
t ∼ 4.5 and 7.5 days, respectively, and g = 20.36 mag at δ
t ∼ 7.5 days. AT 2019aaid is isolated with no cataloged galaxy at the position of the source and no coincident galaxy detected in our images. Searching the Legacy Survey data, we find no source at the position of this candidate with limits based on nearby sources of g > 25.56, r > 24.62, and z > 24.50 mag. With no constraints on the photometric evolution, we are not able to concretely conclude that this candidate is related or unrelated to the GW event.
4.7. S190923y
S190923y was identified as a candidate GW signal using data from H1 and L1 on 2019-09-23 12:55:59.646 UTC (Ligo Scientific Collaboration & VIRGO Collaboration 2019m). The final classification for this event is 68% NSBH merger at d = 438 ± 133 Mpc and a 32% probability of being terrestrial. There are no triggered fields for this event. In total, we covered nine fields serendipitously in the interval δ t = 96–120 hr, totaling 45 deg2 with Ptotal = 4.05% (Table 2). The localization of the event, along with the CSS fields that fall within the 90% region, is shown in Figure 5, subfigure 5.7. A single candidate within the localization was reported by the MASTER-Network (Lipunov et al. 2019d), but spectroscopic follow-up ruled it out due to its Galactic origin (Buckley et al. 2019a). Searching our serendipitous fields, we find no new candidates.
4.8. GW 190930_133541
GW 190930_133541 was identified as a candidate GW event on 2019-09-30 13:35:41.247 UTC using data from L1 and H1 (Ligo Scientific Collaboration & VIRGO Collaboration 2019n). The final classification for this event is a BBH with masses of 7.8 and 12.3 M⊙ at d = 709 ± 79 Mpc (Abbott et al. 2020b). We triggered 12 fields (60 deg2) at δ t < 24 hr. From CSS operations, we have an additional 55 fields (275 deg2) of serendipitous coverage with δ t < 72 hr. In total, we covered 67 fields with δ t < 72 hr, totaling 335 deg2 with Ptotal = 13.13% (Table 1). The localization of the event, along with the CSS fields that fall within the 90% region, is shown in Figure 5, subfigure 5.8.
Only two candidates were initially reported, both by the MASTER-Network (Lipunov et al. 2019e, 2019f). Both were reported as likely Galactic CVs, but only one was followed up (ATLAS, Smartt et al. 2019b). Searching through our data, we find a single new candidate, SAGUARO19n/AT 2019aaig (Paterson et al. 2020) at RA = 21h53m140 and Dec = −06d43m38s (see Table 2). Performing PSF photometry on the subtracted image, we obtain mcan = 20.60 ± 0.23 mag at δ
trest = 2.17 days. As a BBH event, however, we do not expect EM emission. Nevertheless, comparing AT 2019aaig to the kilonova models discussed here, we find that AT 2019aaig has a luminosity of 8.75 × 1042 erg s−1 at the median inferred distance of the GW event, making it ∼3 mag brighter, or 20 times more luminous, than the brightest model at δ
trest = 2.17 days. Searching our data, we find a nondetection to the limit of 21.2 mag ∼12 days prior to the event and a nondetection to the limit of 20.9 mag seven months after the event. Searching the literature, we find AT 2019aaig is coincident with the galaxy SDSS J215314.00–064338.3 (Alam et al. 2015). SDSS J215314.00–064338.3 has a zphoto = 0.208 ± 0.030, within 3σ of the inferred LIGO/Virgo distance for this event. Searching Pan-STARRS DR2, we find zphoto = 0.168 ± 0.041, in agreement with the SDSS zphoto, and in better agreement with the inferred LIGO/Virgo distance. We find δ
r ∼ 0
5 between the position of AT 2019aaig and the position of the galaxy from SDSS DR12.
4.9. S190930t
S190930t was identified as a candidate GW event on 2019-09-30 14:34:07.685 UTC, nearly one hour after GW 190930_133541 was detected Ligo Scientific Collaboration & VIRGO Collaboration (2019o). S190930t was only identified in data from L1 and thus has a very large localization. The final classification for the event is 74% NSBH at d = 108 ± 38 Mpc. As a result of the large sky localization for this event, no specific fields were triggered. In total, our serendipitous data covered 425 fields with δ t < 120 hr after the event, totaling 2125 deg2 with Ptotal = 9.13% (Table 1). The localization of the event, along with the CSS fields that fall within the 90% region, is shown in Figure 5, subfigure 5.9.
Eleven candidates were reported by the community (MASTER-Network; Lipunov et al. 2019e, 2019f, ZTF; Stein et al. 2019d, ATLAS; Smartt et al. 2019b, Swift/UVOT Oates et al. 2019; Tohuvavohu et al. 2019), including the two candidates from the GW 190930_133541 localization (see Section 4.8). Six candidates were followed up in detail and ruled out as possible candidates due to spectroscopic classification (Dahiwale et al. 2019; Karambelkar et al. 2019; Dahiwale & Fremling 2020), inconsistent photometric properties (Smartt et al. 2019b), or associated distances outside the inferred LIGO/Virgo range (Tohuvavohu et al. 2019). One of the remaining candidates, AT 2019rpt, was observed several times by CSS after the GW event. Having faded by ∼2.5 mag over ∼136 days, we consider it to be unrelated to the GW event based on photometric evolution. None of the remaining six candidates were detected by CSS.
Searching through our serendipitous data, we find three new candidates (see Table 2). The first candidate, SAGUARO19l/AT 2019aaie (Paterson et al. 2020), is at R.A. = 20h40m052 and decl. = −01h39m09s. Performing PSF photometry on the subtracted image, we obtain mcan = 20.90 ± 0.26 mag at δ
trest = 1.49 days, making it consistent with the Kawaguchi et al. (2020) NSBH model discussed here when transforming to absolute magnitude space using the inferred LIGO/Virgo distance. Searching our data, we find a nondetection to the limit of 20.82 mag one month prior to the event and a nondetection to the limit of 20.96 mag eight months after the event. Searching the literature, we find AT 2019aaie is coincident with a galaxy (SrcID: 472567686234) in the VISTA Hemisphere Survey DR4.1 (VHS; McMahon et al. 2013). Searching the Legacy Survey, we find the coincident galaxy (Brick: 3101m017, ObjID: 7531) with g = 22.49, r = 21.49, and z = 20.88 mag. We find δ
r ∼ 0
3 between the position of AT 2019aaie and the position of the galaxy from the Legacy Survey. The second candidate, SAGUARO19m/AT 2019aaif (Paterson et al. 2020), is at R.A. = 20h15m45
8 and decl. = −07d55m44s. Performing PSF photometry on the subtracted image, we obtain mcan = 18.63 ± 0.22 mag at δ
trest = 2.44 days. Comparing the absolute magnitude of AT 2019aaif to the kilonova models discussed here, we find that AT 2019aaif overlaps with the Kasen et al. (2015) HMNS model when considering the error on the median inferred LIGO/Virgo distance. Searching our data, we find a nondetection to the limit of 20.97 mag three months prior to the event and a nondetection to the limit of 21.05 mag eight months after the event. AT 2019aaif is isolated with no cataloged galaxy at the position of the source. No coincident galaxy is detected in our images, and it is not covered within the Legacy Survey footprint. The third candidate, SAGUARO19o/AT 2019aaih (Paterson et al. 2020), is at R.A. = 23h22m03
4 and decl. = −23d15m11s. Performing PSF photometry on the subtracted image, we obtain mcan = 20.28 ± 0.31 mag at δ
trest = 4.49 days. Comparing the absolute magnitude of AT 2019aaih to the kilonova models discussed here, we find that AT 2019aaih overlaps with the Kasen et al. (2015) HMNS model when considering the error on the median inferred LIGO/Virgo distance. Searching our data, we find only one other observation a year after the event, with a nondetection to the limit of 20.55 mag. AT 2019aaih lies in the outskirts (with δ
r = 7
9) of the GLADE galaxy PCG 802942, at ∼330 Mpc (zphoto = 0.07 ± 0.03; Bilicki et al. 2014). This zphoto lies within 3σ of the inferred LIGO/Virgo distance. Searching Pan-STARRS DR2, however, we find zphoto = 0.113 ± 0.008, >8σ from the inferred LIGO/Virgo distance. Given the disagreement between the zphoto for the host and the general uncertainties associated with the zphoto calculations, we do not rule AT 2019aaih out as a potential candidate.
4.10. S191205ah
The GW candidate S191205ah was discovered using data from H1, L1, and V1 at 21:52:08.569 UTC by the gstlal pipeline (Ligo Scientific Collaboration & VIRGO Collaboration 2019p). The final classification is 93% NSBH at d = 385 ± 164 Mpc. We triggered 12 fields (60 deg2) at δ t < 24 hr and have an additional 45 serendipitous fields (225 deg2) with δ t < 96 hr. In total, we covered 57 fields with δ t < 96 hr, totaling 285 deg2 with Ptotal = 10.91% (Table 1). The localization of the event, along with the CSS fields that fall within the 90% region, is shown in Figure 5, subfigure 5.10.
During the real-time analysis of our data, we reported a single SAGUARO candidate, SAGUARO19j (Paterson et al. 2019b). It was later found to have a previous detection in Pan-STARRS (McBrien et al. 2019b) and was subsequently classified as an SN (Yan 2020). It was thus ruled out as being related to this GW event. An additional 13 candidates were reported by the community via GCN (ZTF; Andreoni et al. 2019f, MASTER-Network Lipunov et al. 2019g, 2019h, Gaia Kostrzewa-Rutkowska et al. 2019l). Of these, nine were ruled out as possible kilonova candidates by the community due to spectroscopic classification or photometric evolution (Valeev et al. 2019a; Hu et al. 2019a, 2019b, 2019c; Valeev et al. 2019d; Kasliwal et al. 2020). One of the remaining four candidates, AT 2019wjr, was detected by ATLAS during routine survey operations two days after the initial detection. Still on the rise ∼7 days after the GW event, we consider it to be unrelated to the GW event based on photometric evolution. The remaining three candidates lie outside the CSS footprint and were thus not covered by us. Searching our data, we find no new additional candidates.
4.11. S191213g
A candidate GW signal was identified using data from H1, L1, and V1 on 2019-12-13 at 04:34:08.142 UTC (Ligo Scientific Collaboration & VIRGO Collaboration 2019q). The final classification for this event, S191213g, is 76.8% BNS at d = 201 ± 81 Mpc and a 23.2% probability of being terrestrial. We did not trigger any fields for this event but covered 28 fields serendipitously with δ t < 72 hr, totaling 170 deg2 with a Ptotal = 2.10% (Table 1). The localization of the event, along with the CSS fields that fall within the 90% region, is shown in Figure 5, subfigure 5.11.
In total, 21 candidates were reported in GCNs by ZTF, MASTER-Network, and Pan-STARRS (Stein et al. 2019a; McBrien et al. 2019c; Andreoni et al. 2019g; Denisenko 2019). All candidates were subsequently ruled out and determined to be either SNe (Perley et al. 2019a; Brennan et al. 2019; Castro-Tirado et al. 2019; Vogl et al. 2019), due to AGN activity (Brennan et al. 2019), stellar in nature (Denisenko 2019; Castro-Tirado et al. 2019), or unrelated to S191213g (Andreoni et al. 2019b; Coughlin et al. 2020). Searching through our serendipitous fields, we find no new candidates.
4.12. S200105ae
A subthreshold candidate GW signal, with a high terrestrial probability (97.3%), was identified in data from L1 and V1 on 2020 January 5 16:24:26.057 UTC (LIGO Scientific Collaboration & Virgo Collaboration 2020b). The event was not retracted, however, as the data suggested the probability of it being astrophysical in nature was greater than calculated by the real-time processing due to its chirp structure (LIGO Scientific Collaboration & Virgo Collaboration 2020b, 2020c). The offline parameter estimation classifies the event as an NSBH at d = 283 ± 74 Mpc (LIGO Scientific Collaboration & Virgo Collaboration 2020d) with a 90% localization of 7373 deg2. There are no triggered fields for this event. CSS serendipitously covered 53 fields with δ t < 48 hr, totaling 265 deg2 with Ptotal = 2.84% (Table 1). The localization of the event, along with the CSS fields that fall within the 90% region, is shown in Figure 5, subfigure 5.12.
In total, 24 candidates were reported by ZTF (Stein et al. 2020; Ahumada 2020) and Gaia (Kostrzewa-Rutkowska & Gaia Alerts Team 2020). All candidates were ruled out through spectroscopic classification (Anand et al. 2020c; Hu et al. 2020; Valeev & Font 2020; Castro-Tirado & Font 2020), slow photometric evolution, or identification as a stellar source or moving object Anand et al. 2020c. We detect five of the ZTF candidates in our data, all showing photometric evolution inconsistent with a kilonova, in agreement with Anand et al. (2020c). Searching our serendipitous fields, we find a single new candidate, SAGUARO20h/AT 2020abgt (Paterson et al. 2020), at R.A. = 07h41m240 and decl. = 09d27m59s (see Table 2). Performing PSF photometry on the subtracted image, we obtain mcan = 18.86 ± 0.24 mag at δ
trest = 0.49 days. Comparing the absolute magnitude of AT 2020abgt to the kilonova models discussed here, we find that it is ∼3 mag brighter (a factor of 20 larger in luminosity) than the brightest model at δ
trest = 0.49 days, using the median inferred LIGO/Virgo distance. Given the uncertainty associated with NSBH models and the unknown parameters of the system, we do not rule out this candidate based purely on the above. Searching our data, we find a nondetection to the limit of 21.31 mag just over one month prior to the event and a nondetection to the limit of 21.07 mag one month after the event. AT 2020abgt is isolated with no cataloged galaxy at the position of the source. No coincident galaxy is detected in our images, and it is not covered within the Legacy Survey footprint.
4.13. S200114f
On 2020 January 14 02:08:18.23 UTC, the coherent Wave Burst (cWB) pipeline (Klimenko et al. 2016) triggered on a candidate unmodeled burst signal, S200114f, using data from the L1, H1, and V1 (LIGO Scientific Collaboration & Virgo Collaboration 2020e). As a burst event, S200114f was detected without a template or prior knowledge of the waveform, with no constraint on the distance. The FAR was 1 per 25.838 yr, and the 90% localization covered 403 deg2. We triggered 36 fields (180 deg2) within δ t < 24 hr, covering Ptotal = 86.30% (Table 1). The localization of the event, along with the CSS fields that fall within the 90% region, is shown in Figure 5, subfigure 5.13.
In total, 33 optical candidates were reported by ZTF (Andreoni 2020a, 2020b) and SAGUARO (Lundquist et al. 2020b). Ten of these were classified as SN and excluded (Valeev & Castro-Rodriguez 2020; Cartier et al. 2020; McCully et al. 2020), two (including one SAGUARO detection) were excluded for having previous detections (Lundquist et al. 2020a; Andreoni 2020b), and one was classified as a QSO and excluded (McCully et al. 2020). Subsequent reanalysis of the three remaining original SAGUARO candidates suggests that two (SAGUARO20b and SAGUARO20d) have underlying point sources and are likely the result of stellar variability. Of the remaining 17 candidates, we find a detection of AT 2020aco within our data prior to the event on 2019 November 24, thus ruling it out as being related to the GW event. Searching through our data, we find no new candidates for this event. A more in-depth discussion on the progenitor of this burst event, along with possible models and the efficiency of our search with regard to these “burst” events, will be presented in M. J. Lundquist et al. (2021, in preparation).
4.14. S200115j
S200115j was identified as a candidate GW signal using data from H1, L1, and V1 on 2020 January 15 04:23:09.742 UTC (LIGO Scientific Collaboration & Virgo Collaboration 2020f). The final classification for this event is >99% MassGap at d = 332 ± 78 Mpc. With a HasNS probability of > 99%, this would suggest that the event was a merger between one object of 3 < M/M⊙ < 5 and an NS with <3M⊙. The calculated HasRemnant for this event is >99% (LIGO Scientific Collaboration & Virgo Collaboration 2020g), suggesting a high probability of EM emission. There are no triggered fields for this event, and our total serendipitous coverage is 11 fields (55 deg2) in the interval δ t = 72–120 hr, with Ptotal = 2.64% (Table 1). The localization of the event, along with the CSS fields that fall within the 90% region, is shown in Figure 5, subfigure 5.14. Three optical candidates were reported by the community, all from ZTF (Anand et al. 2020a). Two of these candidates had inconsistent redshifts with the inferred LIGO/Virgo distance, while multiple nondetections in optical imaging follow-up of the third failed to confirm it as a source (Ahumada et al. 2020a, 2020b; de et al. 2020; Mazaeva & IKI FuN 2020). Searching through our serendipitous fields, we find no new candidates.
4.15. S200128d
A candidate GW signal, S200128d, was identified using data from H1 and L1 on 2020 January 28 02:20:11.903 UTC (LIGO Scientific Collaboration & Virgo Collaboration 2020h). The final classification for this event is 97% BBH at d = 3702 ± 1265 Mpc. There are no triggered fields for this event, and our total serendipitous coverage is 64 fields (320 deg2) with δ t < 96 hr and Ptotal = 11.80% (Table 1). The localization of the event, along with the CSS fields that fall within the 90% region, is shown in Figure 5, subfigure 5.15.
No counterparts were reported by the community. Searching our serendipitous fields, we find a single new candidate, SAGUARO20i/AT 2020abgu (Paterson et al. 2020), at R.A. = 14h16m090 and decl. = −06d22m43s (see Table 2). Performing PSF photometry on the subtracted image, we obtain mcan = 20.47 ± 0.26 mag at δ
trest = 0.28 days. As a BBH event, however, we do not expect EM emission. Nevertheless, comparing the absolute magnitude of AT 2020abgu to the kilonova models discussed here, we find that AT 2020abgu is ∼6 mag brighter (a factor of 240 larger in luminosity) than the brightest model at δ
trest = 0.28 days, using the median inferred LIGO/Virgo distance. Searching our data, we find a nondetection to the limit of 20.72 mag just over one month prior to the event and a nondetection to the limit of 20.93 mag roughly three months after the event. Searching the Legacy Survey, we find AT 2020abgu is coincident with a galaxy (Brick: 2140m065, Objid: 6389) with g = 19.51, r = 19.07, and z = 18.73 mag. Searching Pan-STARRS DR2, we find a zphoto = 0.065 ± 0.039. This distance is vastly different from the inferred LIGO/Virgo distance (by >3000 Mpc), but, due to the large errors in the inferred LIGO/Virgo distance, still falls within 3σ of the median. From our images, AT 2020abgu appears to be nuclear in nature with δ
r ∼ 1
7 between the position of AT 2020abgu and the position of the galaxy from the Legacy Survey. The nature of both the merger (BBH and very far) and the candidate (extremely bright if assuming the median LIGO/Virgo distance, the host zphoto, and apparent nuclear position) implies that AT 2020abgu is most likely due to AGN activity, or possibly a tidal disruption event, and not related to the GW event.
4.16. S200224ca
S200224ca was identified as a candidate GW signal using data from H1, L1, and V1 on 2020-02-24 22:22:34.406 UTC (LIGO Scientific Collaboration & Virgo Collaboration 2020i). The final classification for this event is >97% BBH at d = 1575 ± 322 Mpc (LIGO Scientific Collaboration & Virgo Collaboration 2020j). There are no triggered fields for this event, and our total serendipitous coverage is five fields (25 deg2) in the interval δ t = 24–72 hr, with Ptotal = 11.42% (Table 1). The localization of the event, along with the CSS fields that fall within the 90% region, is shown in Figure 5, subfigure 5.16.
In total, 27 optical candidates were initially reported by the community (DESGW; Morgan et al. 2020a, 2020c, GRAWITA Grado et al. 2020). Initial follow-up ruled out 14 optical candidates due to photometric evolution consistent with an SN (Morgan et al. 2020a) and thus too slow for a kilonova. While the DESGW candidates are generally too faint for the limiting magnitude of CSS, we are able to identify AT 2020dlt and AT 2020dlu below our automatic vetting S/N threshold (with S/N ≈ 2.2 and 2.9, and 5σ transient depth of 21.6 mag and 21.1 mag, respectively) in images taken 6 days prior to the event. Thus, we are able to rule them out as being related to the GW event. Searching through our data, we find nondetections for the remaining 13 candidates, both prior to and after the event. No new candidates were found within our serendipitous data for this event.
4.17. S200316bj
A candidate GW signal, S200316bj, was identified using data from H1, L1, and V1 on 2020-03-16 21:57:56.157 UTC (LIGO Scientific Collaboration & Virgo Collaboration 2020k). The final classification for this event is >99% MassGap at d = 1178 ± 283 Mpc. With a HasNS probability of <1%, this would suggest the event was a merger between one object of 3 < M/M⊙ < 5 and a BH with > 5M⊙ (LIGO Scientific Collaboration & Virgo Collaboration 2020l). There are no triggered fields for this event, and our total serendipitous coverage is 20 fields (100 deg2) at δ t < 48 hr and Ptotal = 73.24% (Table 1). The localization of the event, along with the CSS fields that fall within the 90% region, is shown in Figure 5, subfigure 5.17. No candidates were reported by the community, and no candidates were found in our serendipitous data for this event.
5. Discussion
In total, we have presented observations of 17 GW events from O3 (see Table 1). We triggered observations (generally in sets of 60 deg2) for seven events: GW 190408_181802, GW 190425, GW 190426_152155, S190901ap, GW 190930_133541, S191205ah, and S200114f. Our trigger criteria focused on events containing a potential NS or unusual events. Except for one event (GW 190426_152155), we were able to trigger fields within 24 hr of the GW alert. We find δ t = 1.4–43.6 hr for the first triggered field, with a median δ t = 11.9 hr across triggered events. Including fields from normal CSS operations that serendipitously overlap with the GW sky localization at δ t < 5 days, we were able to increase our coverage of these triggered events, as well as include additional events with purely serendipitous coverage. We present observations for 10 additional events with serendipitous coverage that have Ptotal > 2%: GW 190521, GW 190630_185205, S190923y, S190930t, S191213g, S200105ae, S200115j, S200128d, S200224ca, and S200316bj. Including triggered and serendipitous fields, we searched a total of 4755 deg2, with Atotal = 15–2120 deg2 for these events. We covered up to Ptotal = 86% for individual events, with a median Ptotal ≈ 8% within δ t < 5 days of the GW event. The 5σ transient depth of individual fields ranges from 17.1–21.6 mag, with a median of 21.1 mag.
For a direct comparison to other surveys that reported on a number of events during O3, we compare the Ptotal, the median depth of observations, and the median time lag between the observations and the GW event. Our highest coverage (86%) is comparable to the maximum covered by ZTF/GROWTH (88%; Kasliwal et al. 2020), GOTO (95%; Gompertz et al 2020), and GRANDMA (95%; Antier et al. 2020). In terms of the median Ptotal covered across all events, we have a much lower number (8% compared to ∼40% from ZTF/GROWTH and GOTO) due to the number of low coverage events included in our analysis (2% < Ptotal < 15%). We highlight our coverage of the unusual burst event, S200114f, which has not been discussed in great detail by the community. In terms of the median depths of our observations, we are most comparable to (but deeper than) ZTF/GROWTH (see Figure 1). Compared to the median trigger time for observations, we find comparable timescales for the first trigger to GOTO and GRANDMA when looking at the triggering of a large number of events from O3, while ZTF/GROWTH usually had shorter delay times. Focusing on observations purely from O3a, DECam/GROWTH (Anand et al. 2020b) searched down to a deeper median depth compared to our observations (a median of ≈23 mag for four events) with coverage ranging from 8%–98%. In addition, there were a number of searches that targeted single (or two or three) events (Coughlin et al. 2019b; Anand et al. 2020c; Ackley et al. 2020; Thakur et al. 2020; Vieira et al. 2020; Chang et al. 2021; Klingler et al. 2021; Ohgami et al. 2021). For GW 190425, we searched to a comparable depth as ZTF/GROWTH (Coughlin et al. 2019b), while searching a slightly deeper median depth than SkyMapper (Chang et al. 2021). For the NSBH events S200105ae and S200115j, we find similar search depths (with a slightly shallower median) to ZTF (Anand et al. 2020c), who found that with search depths of ≈22 mag, one should be able to place strong constraints on the ejecta mass from these systems. For the BBH event GW 190521, we also find comparable search depth (ranging from 21.2–22.3 for the respective filters) from DECam/GROWTH (Andreoni et al. 2019d). For the BBH event S200224ca, Swift/UVOT reported limits of 20.2 mag in the u band for follow-up observations. Although the NSBH event S190814bv (LIGO Scientific Collaboration & Virgo Collaboration 2019b) was not covered by us, we can achieve deeper search depths in general than observations by the DDOTI (Thakur et al. 2020), while CFHT (Vieira et al. 2020), ENGRAVE (Ackley et al. 2020), and DECam/GROWTH (Andreoni et al. 2020) observations were deeper than our typical search depths. Likewise for the retracted NSBH event S190510g (Ligo Scientific Collaboration & VIRGO Collaboration 2019r), DECam/GROWTH (Andreoni et al. 2019d) reported 3σ depths of 21.2–22.3 mag, while DECam/DES (Garcia et al. 2020) reported 10σ search depths of 20.58–21.72 mag for grz observations, and Subaru/HSC (Ohgami et al. 2021) reported depths of 21.3 and 22.28 mag in the Y band.
A number of updates were made to SAGUARO during O3, mostly improving our ability to classify and vet candidates (see Section 3). With these improvements, the availability of updated localizations, and the inclusion of serendipitous fields, we present a detailed analysis of these 17 events while taking advantage of later observations to rule out candidates based on their photometric evolution. To do this, we compare our candidates to a number of kilonova models: a GW 170817/AT 2017gfo–like kilonova (Kasen et al. 2017), an NSBH kilonova model (Kawaguchi et al. 2020), an HMNS remnant (Kasen et al. 2015), and a GW 190425–like kilonova model (Barbieri et al. 2020; Foley et al. 2020). Comparing the absolute magnitude of our observations to these models, SAGUARO is able to search to depths that would detect kilonova emission out to ∼150–400 Mpc (see Figure 4). This distance range assumes detection at peak brightness and depends on the model assumed.
Of the 17 events presented here, 9 have BNS/NSBH/MassGap classifications from which we could expect some EM emission depending on the parameters of the system. Comparing these events directly to the models, SAGUARO should have been able to detect kilonova emission for S190901ap, S190930t, and S191213g for their respective models, as well as for GW 190425, GW 190426_152155, S191205ah, S200105ae, and S200115j for the more optimistic models. Given the large localizations, however, it would have been extremely challenging to achieve both the necessary depths and areal coverage necessary to identify kilonovae.
After automatic and human vetting of our triggered and serendipitous fields (see Section 2.1), we find a total of seven viable candidates: AT 2019aaid (S190901ap, BNS), AT 2019aaig (GW 190930_133541, BBH), AT 2019aaie, AT 2019aaif and AT 2019aaih (S190930t, NSBH), AT 2020abgt (S200105ae, NSBH), and AT 2020abgu (S200128d, BBH), from five GW events (see Table 2). All candidates have a single detection within our data, along with limits on timescales that do not allow us to rule them out as optical counterparts. Their detected magnitudes range from 18.6 to 20.9 mag with δ t ranging from ∼0.5 to 4.5 days.
First, we compare the five candidates associated with BNS and NSBH mergers directly to the models and the luminosity of AT 2017gfo at the median inferred LIGO/Virgo distance of each event. We also choose a range of models that represent the optical diversity of kilonovae, previously found in comparative studies between AT 2017gfo and candidate kilonovae following short GRBs (Gompertz et al. 2018; Ascenzi et al. 2019). We find a single candidate, AT 2019aaid (BNS), consistent with the r-band luminosity of AT 2017gfo at δ trest = 0.48 days. As a potential candidate associated with an NSBH merger, AT 2019aaie is consistent with the Kawaguchi et al. (2020) NSBH model discussed here at δ trest = 1.49 days, while AT 2020abgt is ∼20 times more luminous at δ trest = 0.28 days. Although AT 2020abgt is more luminous than the NSBH model discussed here, we do not rule it out due to the uncertainty associated with NSBH models. The remaining candidates associated with the NSBH merger S190930t, AT 2019aaif and AT 2019aaih, only overlap with the optimistic HMNS model, where a stable remnant is expected to be a rare outcome (Margalit & Metzger 2019) when considering the error in the inferred LIGO/Virgo distance (Kasen et al. 2015).
Likewise, for our two BBH candidates (AT 2019aaig and AT 2020abgu), we do not expect EM emission, although there is much more uncertainty associated with the optical emission from BBH mergers (e.g., Perna et al. 2018, 2019; Graham et al. 2020). We note that both candidates are more luminous (by a factor of 20 and 240, respectively) than any model discussed here, and the limited predictions for any optical emission from BBH mergers overall predict fainter emission than BNS mergers and/or specific associations to AGN disks (Stone et al. 2017; McKernan et al. 2018).
Four of our candidates have detectable galaxies within 4″. Considering these galaxies as their hosts, we measure the offset between each candidate and the galaxy position. We find δ
r = 03–7
9. Only three of these galaxies have redshifts (as zphoto), with two having multiple zphoto values associated with them. Using each of the different photometric redshifts (Table 2), this implies projected physical offsets of 1.4–16.3 kpc, well within the range of known short GRB offsets (Fong & Berger 2013). Overall, the precise nature of these seven candidates is inconclusive, although several demonstrate consistency with the properties and locations of kilonovae.
Looking at observations from the community for O3 as a whole, a total of 252 optical candidates were initially reported via GCN for the 17 GW events discussed here. Although much effort went into the search and discovery of candidates for these events, only 65% were followed up in some capacity prior to this work, with only 25% spectroscopically followed up. Checking the status of community candidates not ruled out by initial (via GCN) or later (in published papers) follow-up, we find three candidates (AT 2019dpg, AT 2019eby, and AT 2019wjr) with later detections that were automatically uploaded from various surveys to TNS. Using these data points, we were able to rule out these candidates as viable kilonova counterparts due to their inconsistent photometric evolution. Searching through public data from ZTF, we were able to find another candidate, AT 2019deu, which displayed photometric behavior inconsistent with a kilonova. From our own data, we were able to rule out an additional eight candidates: AT 2019ech, AT 2019piw, AT 2019rpt, SAGUARO20b, SAGUARO20d, AT 2020aco, AT 2020dlt, and AT 2020dlu. While some of these candidates were ruled out due to inconsistent photometric evolution based on later observations, three of these had detections prior to the GW event and thus could have been ruled out at the time of initial discovery. These 12 candidates make up ∼5% of the total number of counterpart candidates associated with the 17 GW events in this paper.
6. Conclusions and Future Prospects
In this paper, we presented a detailed analysis of both triggered and serendipitous observations of 17 events (7 triggered and 10 purely serendipitous) from O3. The serendipitous coverage of events provided both an increase in coverage for δ t < 5 days, as well as information about the long-term light-curve evolution for both community and SAGUARO candidates. From our data, we report seven viable kilonova candidates from five different GW events. Although each candidate only has a single detection, making it difficult to concretely tie them to a kilonova model, we cannot completely rule them out due to lack of information and the uncertainty surrounding the predicted kilonova light curves. Searching through publicly available data, we also found several outstanding candidates that could be ruled out due to later photometric observations.
The lack of follow-up for such a large number of candidates highlights the need for community coordination during candidate follow-up and vetting (although the number of candidates may decrease in the future as localizations improve; Abbott et al. 2018). This is strengthened by the fact that many candidates were followed up, classified, and ruled out by multiple different groups, while others were not revisited at all. During their wide-field plus galaxy-targeted search of GW 190814, Thakur et al. (2020) also noted that the lack of follow-up from the community left ∼25% of candidates without a classification (see also Coughlin et al. 2019b). They found brighter candidates were generally reported earlier, with follow-up efforts for classification concentrated within δ t < 4 days with often duplicated efforts. Projects that promote coordination of observations, such as the Gravitational Wave Treasure Map (Wyatt et al. 2020), will be increasingly important as we move toward more GW detections in future runs. A more comprehensive effort, tracking down and classifying remaining counterpart candidates for all of the GW events of O3, would certainly bear fruit and shed light on follow-up strategies going forward. To this end, having a candidate database, where candidate status and planned observations could be tracked, would be greatly beneficial. Real-time information from the LVC about event parameters such as the chirp mass, mass ratio, and inclination of the system, as well as prompt updates regarding classification and sky localizations, would also greatly improve the efficiency of EM counterpart searches.
Looking to future runs, O4 is scheduled to start no earlier than mid-2022, with significant upgrades to LIGO and Virgo and the addition of KAGRA. 31 The upgrades to LIGO/Virgo/KAGRA are expected to increase the BNS detection range for O4 to 160–190, 90–120, and 25–130 Mpc, respectively (Abbott et al. 2018). Given the value added by the serendipitous observations provided by CSS and current kilonova model predictions, we plan to extend our SAGUARO real-time candidate searching to include serendipitous fields with δ t < 5 days for O4 and beyond. Another planned improvement is the real-time comparison of candidates to kilonova models during the vetting process to provide value-added information about the likelihood of a candidate being associated with an event. Comparing candidates to a grid of kilonova models will also provide limits on model parameters such as ejecta mass, electron fraction, energy, density, and viewing angle. Almualla et al. (2020) presented an in-depth analysis of serendipitous kilonova detection using wide-field surveys, showing how cadence and the choice of filters could be used to optimize serendipitous kilonova detection. Previous studies by Cowperthwaite et al. (2018) also looked at how observations could be tailored to detect kilonova emission in the context of contaminating sources. Improvements to SAGUARO, such as the addition of other discovery telescopes, would provide resources to increase the likelihood of detecting kilonova emission from GW triggers, as well as independently from GW detections.
Although the planned increase in sensitivity will allow the detection of mergers out to greater distances, EM follow-up is greatly restricted by the depth of current telescope surveys (see Figure 1). With SAGUARO's current discovery depth, we are able to probe the peak brightness of kilonova out to ∼150–400 Mpc (see Figure 4). For surveys such as CFHT, which have deeper observations, the discovery space could go out to ∼1000 Mpc for unusually massive events like GW 190425 (assuming the optimistic case), while shallower surveys that probe <19 mag can only reach ∼150 Mpc for the same scenario. The issue of survey depth is not easily solved and is generally a trade-off with FOV. Given the large localizations seen in O3, and thus the fairly low Ptotal for many events, a trade-off with FOV is often not feasible. The addition of KAGRA, however, will provide localizations that are a factor of ∼1.4 better (Abbott et al. 2018) and presumably increase the efficiency of EM follow-up searches.
We gratefully acknowledge Kyohei Kawaguchi and Claudio Barbieri for generously sharing their models with us. SAGUARO is supported by the National Science Foundation (NSF) under award Nos. AST-1909358 and AST-1908972. Time-domain research by D.J.S. is supported by NSF grants AST-1821987, 1813466, and 1908972, and by the Heising-Simons Foundation under grant #2020-1864. Research by K.P., J.C.R., and W.F. is also supported by NSF award No. AST-1814782. The UCSC team is supported in part by NASA grant NNG17PX03C, NSF grant AST-1815935, the Gordon and Betty Moore Foundation, the Heising-Simons Foundation, and by a fellowship from the David and Lucile Packard Foundation to R.J.F. J.S. acknowledges support from the Packard Foundation. V.P. acknowledges support from NSF grant PHY-1912619. A.C. acknowledges support from NSF award No. 1907975. The operation of the facilities of Steward Observatory is supported in part by the state of Arizona. This research has made use of data and/or services provided by the International Astronomical Union's Minor Planet Center.
Facility: SO:1.5m. -
Software: astropy (Astropy Collaboration et al. 2013; The Astropy Collaboration et al. 2018), The IDL Astronomy User's Library (Landsman 1993), SCAMP (Bertin et al. 2006; Bertin 2010a), SWarp (Bertin 2010b), IRAF (Tody 1986, 1993), SExtractor (Bertin & Arnouts 1996), ZOGY (https://github.com/pmvreeswijk/ZOGY).
Appendix: Localization figures and final candidates
The GW localization maps, along with our coverage, are displayed in Figure 5 and its associated figure set (17 total images). A summary of our final candidates is presented in Table 2.
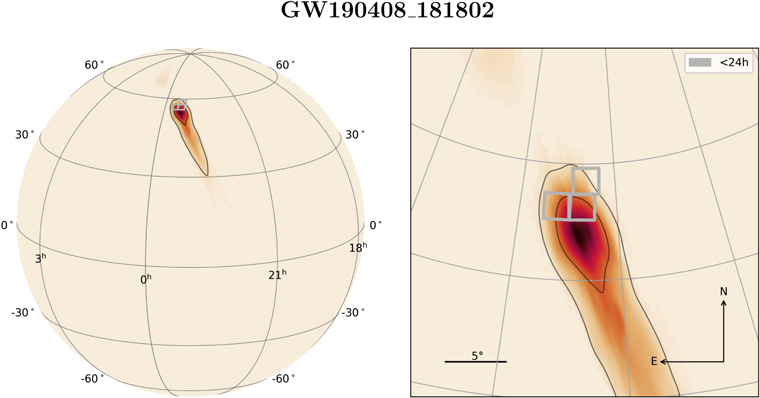
Figure 5.
GW localization of GW 190408_181802 overlaid with the three CSS fields that were triggered for this event. These fields were observed within 24 hr of the GW detection and covered 13.73% of the total localization probability. A globe projection is shown on the left panel with a zoom-in on the region of higher probability on the right panel. These panels show the localization as a probability density map where darker colors indicate a higher probability of containing the GW source. Contours indicate the 50% and 90% confidence levels for containing the GW event. The complete figure set (17 images), containing the GW localization maps for all 17 events presented here, is available in the online journal. (The complete figure set (17 images) is available.)
Download figure:
Standard image High-resolution imageFootnotes
- 21
- 22
Categorized by the highest nonterrestrial classification reported by the LVC for each event.
- 23
Although SAGUARO currently focuses on the follow-up of GW events, the methods presented in this paper could be applied to any transient of interest.
- 24
The facilities range from the 1.54 m Kuiper, 1.8 m VATT, and 2.3 m Bok telescopes in Southern Arizona, to the 6.5 m MMT, the twin 6.5 m Magellan telescopes, the 2 × 8.4 m Large Binocular Telescope, and the two Keck I 10 m telescopes.
- 25
Using a modified version of the python code from https://github.com/pmvreeswijk/ZOGY.
- 26
- 27
- 28
The calculation of the duty cycle takes all observing constraints into account, including the annual Arizona “monsoon” shutdown running mid-July to the end of August, the 1 month LIGO/Virgo shutdown between O3a and O3b, CSS moon constraints, and weather.
- 29
This model divides the ejecta mass into dynamical ejecta (Mdyn = 0.02M⊙) and postmerger ejecta mass (Mpm = 0.04M⊙).
- 30
- 31
Further into the future (O5 and beyond), we will also see the addition of LIGO-India.