Abstract
Eclipsing binaries in star clusters offer more stringent tests of stellar evolution theory than field binaries because models must not only match the binary properties, but also the radiative properties of all other cluster members at a single chemical composition and a single age. Here we report new spectroscopic observations of the G-type, detached eclipsing binary EPIC 219394517 in the open cluster Ruprecht 147 ([Fe/H] = +0.10), which was observed in late 2015 by the K2 mission. A joint analysis of our radial-velocity measurements and the K2 light curve shows the 6.5 day orbit to be nearly circular. We derive highly precise masses of  and
and  , radii of 1.055 ± 0.011
  and 1.042 ± 0.012
  , and effective temperatures of 5930 ± 100 K and 5880 ± 100 K for the primary and secondary, respectively. The distance we infer,
  pc, corresponds to a parallax in good agreement with the Gaia/DR2 value for the star. Current stellar evolution models from the MIST and PARSEC series match the above physical properties well at ages of 2.48 and 2.65 Gyr. Isochrones for these same ages and the measured composition, along with our reddening estimate for EPIC 219394517, also show generally good agreement with the optical and near-infrared color–magnitude diagrams of the cluster, which can be constructed with no free parameters as the distances of all member stars are known from Gaia.
1. Introduction
Star clusters have long been used to test our knowledge of stellar physics by comparing observations in the color–magnitude diagram (CMD) against models of stellar evolution. This allows inferences to be made about the age of the cluster and its distance, often aided by knowledge of the chemical abundance, which can be derived spectroscopically from one or more of its brighter members. Constraints of a very different nature on stellar theory may be obtained from suitable detached double-lined eclipsing binaries by measuring their component masses and radii (see, e.g., Andersen et al. 1991; Torres et al. 2010), two of the most fundamental stellar properties. Accurate values for these properties can usually be derived from purely geometric and dynamical principles, with no further assumptions.
When eclipsing binaries are found in a cluster of known metallicity the constraints become much stronger and the test more valuable, as models must then match not only the masses and radii of both binary components at the measured composition, but also the radiative properties of all other cluster members at the same age as inferred for the binary. While some three dozen eclipsing binaries have been studied photometrically and spectroscopically in clusters and young associations, not all binaries are suitable (detached) for this sort of test, or have parent populations sufficiently well characterized (well-defined color–magnitude diagrams, spectroscopically known metallicity), or have had their properties measured well enough. Some examples of systems with sufficiently precise measurements permitting such tests include those published by Kaluzny et al. (2006), Meibom et al. (2009), Brogaard et al. (2011, 2012), Sandquist et al. (2016), Brewer et al. (2016), and others.
Here we present an analysis of a relatively bright (V = 11.4), detached eclipsing binary in the open cluster Ruprecht 147 (NGC 6774), designated EPIC 219394517 (also TYC 6296-96-1 and 2MASS J19152465-1651222). Ruprecht 147 lies on the ecliptic, and was observed by K2, the repurposed Kepler mission, in the final months of 2015. EPIC 219394517 was identified as a cluster member and a double-lined spectroscopic binary by Curtis et al. (2013), and listed as entry CWW 64 in their catalog. These authors presented the first detailed study of this neglected cluster, establishing it to be middle-aged (∼3 Gyr), of slightly super-solar composition ([Fe/H] = +0.10), and distant some 300 pc from the Sun, making it the oldest nearby cluster (see their Figure 1). What makes Ruprecht 147 special is that it contains no fewer than five eclipsing binaries (Curtis 2016), offering an unprecedented opportunity for testing stellar evolution models over a wide range of masses at a single age and composition. Furthermore, the recently published second data release (DR2) from the Gaia consortium (Gaia Collaboration et al. 2016, 2018) now provides highly accurate parallaxes for other cluster members that greatly simplifies the study of the color–magnitude diagram of Ruprecht 147.
This paper begins our study of the eclipsing systems in the cluster with EPIC 219394517, a 6.527 day detached eclipsing binary composed of similar G-type main-sequence stars. We describe our preparation of the K2 data for analysis in Section 2, our imaging observations to examine the vicinity of EPIC 219394517 in Section 3, and our spectroscopic monitoring to derive radial velocities for both components in Section 4. The joint analysis of the K2 light curve and the velocities is presented in Section 5. We then proceed to derive the absolute dimensions of the components (masses, radii, etc.) in Section 6. Rotation is studied in Section 7, along with the signs of activity (spots) that we see manifested in EPIC 219394517 as quasi-periodic variability in the light curve. Then in Section 8 we compare two sets of current stellar evolution models against our measurements of the physical properties (mass, radius, temperature), and illustrate the good agreement (with no adjustable parameters) of the same best-fit models with brightness measurements for other cluster members in the optical and near-infrared color–magnitude diagrams. We conclude in Section 9 with our final remarks.
2. K2 Photometry
The Ruprecht 147 cluster was observed by K2 during Campaign 7 of the mission, for a period of 75 days (2015 October to December). The pixel-level data were downloaded from the Mikulski Archive for Space Telescopes5
after calibration by the Kepler pipeline (Jenkins et al. 2010; Quintana et al. 2010), and the light curves for EPIC 219394517 were then extracted. We performed a first-pass correction for systematic errors introduced by Kepler’s unstable pointing following Vanderburg & Johnson (2014). The typical pointing drift of about 1 pixel over the 6 hr interval between thruster firings can occasionally be as large as 2 pixels. Because Ruprecht 147 is located near the Galactic plane ( ) in a crowded region of sky, there are several fainter stars blended with the target star (see below). To keep the third light contribution from these nearby stars constant as the pointing changes, we extracted the raw photometry from circular moving apertures with a range of different radii, instead of the stationary apertures typically used for the K2 data analysis in the procedures of Vanderburg & Johnson (2014). We chose to use the one giving the lowest scatter, with a radius of 3.87 pixels, corresponding to 15
4. Partial pixels were handled by calculating the exact overlap of the area of the pixel with the circular aperture. We inspected this first-pass light curve of EPIC 219394517 and identified the binary star eclipses, of which there are 12 primary minima and 13 secondary minima recorded over the 75 day time span. We then rederived the K2 systematics correction by performing a least-squares fit simultaneously to the binary star eclipses, the K2 roll systematics, and long-term stellar/instrumental variability, following the procedure described by Vanderburg et al. (2016). For the purposes of deriving the K2 systematics correction we modeled the long-term variability with a basis spline in time with nodes spaced every 0.75 days, the Kepler roll systematics with cubic splines in arclength (the position of Kepler’s pointing along a one-dimensional arc), and the binary star eclipses with a Mandel & Agol (2002) transit model (allowing separate shapes for the primary and secondary eclipses). Even though the Mandel & Agol (2002) model does not perfectly describe binary star eclipses, it gives a good enough approximation to the light curve shape to yield high-quality corrections for systematics.
EPIC 219394517 shows variability at the 1% peak-to-peak level that we interpret as being due mainly to rotational modulation. This obscures subtler effects such as Doppler beaming, reflection, and ellipsoidal variations due to the binary orbit. To deal with this, we removed all long-timescale signals from the light curve (including the rotational variability, and any phase-dependent variations in the binary) by dividing the corrected photometry by the best-fit basis spline from our fit to the variability, systematics, and eclipses. This rectified light curve is the one used for our analysis below. The scatter out of eclipse in this residual light curve is about 95 parts per million per 30 minute cadence.
3. Imaging Observations
The 154-radius photometric aperture contains a number of fainter stars around EPIC 219394517 that will affect the light curve and potentially bias the parameters derived from it. Figure 1 shows a Sloan r′-band image from observations obtained in 2008 by Curtis et al. (2013), which were made with the MegaCam instrument (Hora et al. 1994) on the Canada–France–Hawaii Telescope (CFHT). Measurements of the brightness of all numbered companions within the aperture in the Sloan g′r′i′ filters are listed in Table 1, along with their positions relative to our target. Many of these companions have entries in the Gaia/DR2 (Gaia Collaboration et al. 2018; see Table 1), though none appear to be cluster members based on their proper motions (and parallaxes, when statistically significant). Also included in the table are J- and K-band measurements based on UKIRT/WFCAM imaging (Curtis 2016). We use this information below in Section 5 to make a quantitative estimate of the flux contamination.
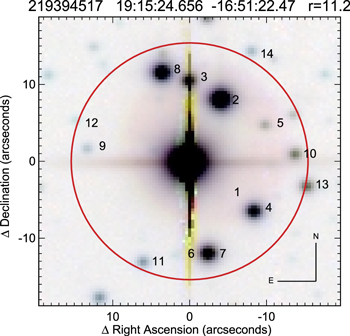
Figure 1. CFHT r′-band image of the field of EPIC 219394517, with the 154 photometric aperture used to extract the K2 photometry indicated with a circle. Nearby companions are numbered as in Table 1. Companions #1 and #6 are too faint to influence the light curve analysis.
Download figure:
Standard image High-resolution imageTable 1. Neighbors of EPIC 219394517
| R.A. | Decl. | P.A. | ρ |

|
r′ | i′ | σ(gri) | J | K | σ(JK) | G | πDR2 | |
|---|---|---|---|---|---|---|---|---|---|---|---|---|---|
| # | (J2000) | (J2000) | (degree) | (″) | (mag) | (mag) | (mag) | (mag) | (mag) | (mag) | (mag) | (mag) | (mas) |
| 1 | 19:15:24.355 | −16:51:26.84 | 225.3 | 6.3 | ⋯ | ⋯ | ⋯ | ⋯ | 18.57 | 17.90 | 0.07 | 14.60 | 0.129 ± 0.034 |
| 2 | 19:15:24.368 | −16:51:14.30 | 333.0 | 9.3 | 15.13 | 14.53 | 14.26 | 0.02 | 13.16 | 12.69 | 0.02 | ⋯ | ⋯ |
| 3 | 19:15:24.642 | −16:51:11.87 | 358.7 | 10.6 | 17.36 | 16.87 | 16.64 | 0.02 | 15.82 | 15.41 | 0.02 | 17.06 | 0.300 ± 0.105 |
| 4 | 19:15:24.080 | −16:51:28.83 | 232.8 | 10.7 | 17.07 | 16.37 | 16.21 | 0.02 | 15.09 | 14.52 | 0.02 | 16.70 | 0.089 ± 0.106 |
| 5 | 19:15:23.981 | −16:51:17.62 | 296.7 | 11.3 | 20.88 | 19.91 | 20.10 | 0.10 | 18.67 | 17.97 | 0.07 | 20.17 | ⋯ |
| 6 | 19:15:24.753 | −16:51:34.47 | 173.5 | 12.0 | ⋯ | ⋯ | ⋯ | ⋯ | 18.65 | 17.74 | 0.06 | ⋯ | ⋯ |
| 7 | 19:15:24.478 | −16:51:34.32 | 192.4 | 12.1 | 16.75 | 16.18 | 16.01 | 0.02 | 14.95 | 14.54 | 0.02 | 16.23 | 0.712 ± 0.069 |
| 8 | 19:15:24.874 | −16:51:10.78 | 14.8 | 12.2 | 16.37 | 15.62 | 15.33 | 0.02 | 14.06 | 13.47 | 0.02 | 15.70 | 0.219 ± 0.053 |
| 9 | 19:15:25.523 | −16:51:20.62 | 81.3 | 13.1 | 23.18 | 22.08 | 21.38 | 0.91 | 18.20 | 17.40 | 0.04 | 20.80 | 2.973 ± 2.185 |
| 10 | 19:15:23.725 | −16:51:21.48 | 274.4 | 14.0 | 19.46 | 18.96 | 18.66 | 0.06 | 17.66 | 17.21 | 0.04 | 18.88 | 0.039 ± 0.385 |
| 11 | 19:15:25.038 | −16:51:35.38 | 157.1 | 14.1 | 21.01 | 19.80 | 19.14 | 0.02 | 17.36 | 16.52 | 0.02 | 19.62 | −0.048 ± 0.584 |
| 12 | 19:15:25.618 | −16:51:17.01 | 68.2 | 15.4 | 24.50 | 23.67 | 21.95 | 0.10 | 18.54 | 17.72 | 0.06 | ⋯ | ⋯ |
| 13 | 19:15:23.619 | −16:51:25.61 | 258.3 | 15.9 | 19.04 | 18.58 | 18.34 | 0.02 | 17.24 | 16.81 | 0.03 | ⋯ | ⋯ |
| 14 | 19:15:24.097 | −16:51:08.02 | 330.9 | 16.8 | 22.02 | 20.83 | 19.98 | 0.02 | 17.96 | 17.02 | 0.03 | 20.37 | ⋯ |
Note. Coordinates derived from the astrometric solutions of the CFHT images (see Curtis et al. 2013).
Download table as: ASCIITypeset image
To search for even closer companions along the line of sight to EPIC 219394517 we obtained natural guide star adaptive optics (AO) imaging and non-redundant aperture-mask interferometry (NRM; see Tuthill et al. 2006, 2010). These observations were conducted in the  band (λ = 2.124 μm) on 2016 May 11 with the NIRC2 instrument on the 10 m Keck II telescope. The data were acquired, reduced, and analyzed following the procedures of Kraus et al. (2016). Table 2 lists the
  detection limits from AO as a function of angular separation from the eclipsing binary ranging from 150 to 2000 mas, expressed as a magnitude difference relative to the target. They are based on a sequence of 5 × 10 s exposures of the object. The limiting apparent magnitude for companions at the widest separations is
  mag. For the NRM observation we used the star EPIC 219511354 (2MASS J19153533−1634117) as a calibrator. We obtained and analyzed eight interferograms exposed for 20 s each, following observing and analysis procedures described by Kraus et al. (2008, 2011, 2016) and Rizzuto et al. (2016). No companions were detected from these observations within the limits given in Tables 2 and 3. For reference, these contrast limits would correspond to companion masses of 0.40 M⊙ at 20 mas (5.7 au), 0.17 M⊙ at 150 mas (43 au), and 0.08 M⊙ at 500 mas (140 au) if physically bound to the target.
Table 2.
Keck/NIRC2  Imaging Detection Limits (mag)
| MJD | Number of | Total | Contrast Limit (ΔK′ in mag) at Projected Separation (ρ in mas) | |||||||||
|---|---|---|---|---|---|---|---|---|---|---|---|---|
| Frames | Exposure (s) | 150 | 200 | 250 | 300 | 400 | 500 | 700 | 1000 | 1500 | 2000 | |
| 57520.5 | 5 | 50.00 | 5.6 | 6.6 | 7.1 | 7.5 | 7.9 | 8.1 | 8.2 | 8.4 | 8.4 | 8.4 |
Note. No objects were detected within these limits.
Download table as: ASCIITypeset image
Table 3. Keck/NIRC2 Aperture-masking Interferometry Detection Limits (mag)
| Confidence | MJD | Contrast Limit (ΔK′ in mag) at Projected Separation (ρ in mas) | |||||
|---|---|---|---|---|---|---|---|
| Interval | 10–20 | 20–40 | 40–80 | 80–160 | 160–240 | 240–320 | |
| 99.9% | 57520.5 | 0.79 | 3.83 | 4.73 | 4.51 | 3.95 | 2.86 |
| 99% only | 57520.5 | 1.23 | 4.05 | 4.93 | 4.69 | 4.15 | 3.11 |
Note. No objects were detected within these limits.
Download table as: ASCIITypeset image
4. Spectroscopic Observations
We monitored EPIC 219394517 spectroscopically at the Harvard-Smithsonian Center for Astrophysics (CfA) between 2016 May and 2017 November with the Tillinghast Reflector Echelle Spectrograph (Fűrész 2008), a bench-mounted fiber-fed echelle instrument attached to the 1.5 m Tillinghast reflector at the Fred L. Whipple Observatory on Mount Hopkins (Arizona, USA). A total of 20 spectra were obtained at a resolving power of  covering the wavelength region 3800–9100 Å in 51 orders. The signal-to-noise ratios in the order containing the Mg i b triplet (∼5187 Å) range from 28 to 39 per resolution element of 6.8 km s−1.
Double lines are clearly visible in all our spectra, and there is no evidence of light from additional stars. Radial velocities for the components were measured using the two-dimensional cross-correlation algorithm TODCOR (Zucker & Mazeh 1994), with templates (one for each star in the binary) taken from a large library of synthetic spectra based on model atmospheres by R. L. Kurucz (see Nordström et al. 1994; Latham et al. 2002). For these determinations we used only the echelle order centered on the Mg i b triplet, given that previous experience with similar material shows that it contains most of the information on the velocity (e.g., Geller et al. 2015; Vanderburg et al. 2016), and because our template library is restricted to a relatively narrow spectral region centered at this wavelength. The optimal template for each component was found by running grids of cross-correlations over a wide range of effective temperatures (Teff) and rotational broadenings ( ) following Torres et al. (2002), and selecting the combination giving the highest cross-correlation value averaged over all observations. Solar metallicity was assumed, along with surface gravity (
 ) values of 4.5 for both stars, which are close to our final results in Section 6. In this way we determined temperatures of 5930 ± 100 K and 5880 ± 100 K for the primary (the slightly more massive star eclipsed at the deeper minimum) and secondary, corresponding approximately to spectral types of G0 and G1, and
  values of 8.4 ± 0.8 km s−1 and 8.2 ± 0.5 km s−1, respectively. Uncertainties are based on the scatter from the individual spectra, conservatively increased to account for possible systematic errors. Small differences between the adopted composition and surface gravity compared to the final results have only a minor effect on these values that is well within our quoted uncertainties. Radial velocities were then determined using the templates in our grid with parameters nearest to these values (Teff = 6000 K and
  km s−1 for both stars). We also measured the light ratio as
  at the mean wavelength of our observations, 5187 Å.
The resulting heliocentric radial velocities on the native CfA zero-point system (Stefanik et al. 1999, 2006) are listed in Table 4 along with their uncertainties. The velocity uncertainties for the primary are almost twice as large as those of the secondary, even though the line broadening is nearly the same. A visual representation of our measurements can be seen in Figure 2, along with our final model described in the next section.
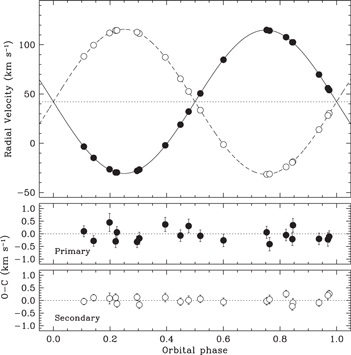
Figure 2. Radial-velocity measurements for EPIC 219394517 with our adopted model. Primary and secondary measurements are represented with filled and open circles, respectively. The dotted line marks the center-of-mass velocity of the system. Error bars are too small to be visible. They are seen in the lower panels, which display the residuals. Phases are counted from the reference time of primary eclipse.
Download figure:
Standard image High-resolution imageTable 4. Heliocentric Radial-velocity Measurements of EPIC 219394517
| HJD | RV1 |

|
RV2 |

|
Orbital |
|---|---|---|---|---|---|
| (2,400,000+) | (km s−1) | (km s−1) | (km s−1) | (km s−1) | Phase |
| 57523.9695 | −2.06 | 0.29 | 87.35 | 0.16 | 0.3951 |
| 57526.9118 | 102.58 | 0.28 | −18.68 | 0.16 | 0.8459 |
| 57529.8984 | −26.73 | 0.25 | 111.44 | 0.14 | 0.3034 |
| 57535.8802 | −29.64 | 0.26 | 114.55 | 0.15 | 0.2199 |
| 57539.9522 | 102.57 | 0.26 | −19.37 | 0.15 | 0.8438 |
| 57550.8860 | 50.60 | 0.24 | 33.60 | 0.14 | 0.5189 |
| 57552.8622 | 107.74 | 0.23 | −23.94 | 0.13 | 0.8216 |
| 57553.8560 | 53.98 | 0.23 | 30.35 | 0.13 | 0.9739 |
| 57554.9536 | −14.84 | 0.21 | 99.60 | 0.12 | 0.1421 |
| 57555.9545 | −27.99 | 0.24 | 112.88 | 0.13 | 0.2954 |
| 57556.9542 | 18.92 | 0.24 | 65.52 | 0.14 | 0.4486 |
| 57557.9466 | 84.81 | 0.26 | −1.29 | 0.15 | 0.6006 |
| 57558.9417 | 115.04 | 0.25 | −31.50 | 0.14 | 0.7531 |
| 57566.8803 | 55.94 | 0.28 | 28.20 | 0.16 | 0.9693 |
| 57854.9782 | −3.39 | 0.22 | 88.26 | 0.12 | 0.1078 |
| 57879.9771 | 69.77 | 0.23 | 13.94 | 0.13 | 0.9378 |
| 57907.9566 | −29.64 | 0.24 | 114.67 | 0.13 | 0.2244 |
| 57920.8409 | −26.40 | 0.37 | 112.00 | 0.21 | 0.1984 |
| 58033.6246 | 32.18 | 0.28 | 52.57 | 0.16 | 0.4776 |
| 58061.5978 | 114.34 | 0.28 | −31.20 | 0.16 | 0.7632 |
Note. Orbital phases are counted from the reference time of primary eclipse. Final velocity uncertainties result from scaling the values listed for the primary and secondary by the near-unity factors f1 and f2, respectively, from our global analysis described in Section 5.
Download table as: ASCIITypeset image
5. Light Curve Analysis
Our analysis of the K2 photometry of EPIC 219394517 was based on the Nelson–Davis–Etzel binary model (Etzel 1981; Popper & Etzel 1981) that underlies the popular EBOP code and its descendants. This relatively simple model treats the star shapes as biaxial spheroids for the phase-dependent component luminosities, and includes a simple reflection prescription following Binnendijk (1960). It is suitable for well-detached eclipsing systems such as ours in which the stars have relatively small oblateness. The version we use (EB) is a rewrite by Irwin et al. (2011),6
and is convenient for use within the Markov Chain Monte Carlo (MCMC) scheme we apply below. The main adjustable variables are the orbital period (P) and reference epoch of primary eclipse (T0, which is strictly the time of conjunction), the central surface brightness ratio in the Kepler passband ( ), the sum of the relative radii (
 ) and their ratio (
 ), the cosine of the inclination angle (
 ), and the eccentricity parameters
  and
and  , with e being the eccentricity and ω the longitude of periastron. Limb-darkening coefficients for the quadratic law were taken from Claret & Bloemen (2011) for the measured stellar properties (Teff,
  , and solar metallicity), and were assumed to be the same for the two stars given their nearly identical parameters. The linear and quadratic coefficients used are
  and
and  .
.
Because our detrending procedure for the K2 photometry, which is intended to eliminate the obvious modulation due to spots, also effectively removes any other out-of-eclipse variability, effects such as tidal distortions (ellipsoidal variability) and reflection are no longer present in the detrended light curve. Consequently, for the modeling we considered the stars to be spherical (setting the mass ratio to zero, which has no effect on any other parameters) and switched the reflection effect off in EB. Gravity darkening then becomes irrelevant. As the out-of-eclipse phases yield no useful information, we restricted the analysis to data within 0.03 in phase from the center of each eclipse (approximately 2.5 times the total duration of the eclipses). Additionally, to account for the finite time of integration of the K2 long-cadence observations, the model light curve was oversampled and then integrated over the 29.4-minute duration of each cadence before being compared with the observations (see Gilliland et al. 2010; Kipping 2010).
As indicated earlier, the photometric aperture used to extract the light curve from the K2 images contains a number of other stars that contribute flux (see Figure 1). We accounted for this extra flux by including the additional third light parameter L3 (defined such that  ), and we assumed that the contaminating stars have constant brightness as we only have a measurement of their flux at a single epoch.
Our method of analysis used the emcee7 code of Foreman-Mackey et al. (2013), which is a Python implementation of the affine-invariant MCMC ensemble sampler proposed by Goodman & Weare (2010). We used 100 walkers with chain lengths of 20,000 each, discarding the first 5000 as burn-in. Uniform (non-informative) or log-uniform priors over suitable ranges were adopted for all parameters (see below), and convergence of the chains was checked visually, requiring also a Gelman–Rubin statistic of 1.01 or smaller for each parameter (Gelman & Rubin 1992).
Despite the high quality of the K2 photometry, initial tests revealed that the radius ratio k was poorly constrained and suffered from strong degeneracies with other parameters. This is a common occurrence in eclipsing binaries such as EPIC 219394517 with similar components displaying shallow, partial eclipses. In this case the two eclipses are only about 6% deep. The most effective remedy is to take advantage of the fact that the radius ratio and the light ratio are highly correlated with each other ( ), and to constrain k indirectly by using our spectroscopic determination of
  from Section 4. We did this by applying a Gaussian prior to the light ratio. We transformed our measured spectroscopic light ratio at 5187 Å to the Kepler band by applying a small correction based on the temperature difference inferred from J (see Section 6) and synthetic spectra, obtaining
  in Kp.
We also found L3 to be poorly constrained. An external estimate of third light contamination was obtained from the brightness measurements in Table 1 of all companions within the photometric aperture (154 in radius, see Figure 1), using the magnitudes in the Sloan r′ band, which is near the K2 passband. To account for possible errors from the small wavelength difference we conservatively inflated the companion magnitude uncertainties so that they are individually no smaller than 0.2 mag. We obtained
 , and used this as a Gaussian prior in our MCMC analysis. Because this value is dominated by the brighter companions inside of 13″, and all the ones near the edge of the circular aperture are very faint, the result is completely insensitive to the treatment of partial pixels for the latter stars.
While our spectroscopic observations gave no indication that the orbit is anything other than circular, a preliminary light curve analysis uncovered a very small but statistically significant displacement of the secondary eclipse from phase 0.5, suggestive of a detectable eccentricity. The  parameter that measures this displacement appeared fairly well constrained, but the complementary parameter
  was not. Conversely, spectroscopic observations are typically more sensitive to
  than to
  in systems with appreciable eccentricity, so it is sometimes beneficial to combine the two types of measurements. In our case the apparent eccentricity is so small that spectroscopy provides almost no information on
  . Nevertheless, we took this approach of combining the data for our final analysis and solved for three additional parameters: the center-of-mass velocity of the system (γ), and the velocity semi-amplitudes K1 and K2. Light travel time across the binary was taken into account for completeness, as in some systems this can also cause a displacement of the secondary eclipse from phase 0.5, although in this case its effect is completely negligible (a delay of less than 0.5 s, two orders of magnitude smaller than the measured displacement of 91 s). The relative weighting between the photometry and the primary and secondary radial velocities was handled by including additional adjustable parameters (fK2, f1, and f2, respectively) to inflate the observational errors. These scale factors were solved for self-consistently and simultaneously with the other orbital quantities (see Gregory 2005). The initial error assumed for the photometric measurements is 200 ppm, and the initial errors for the velocities are listed in Table 4. While somewhat improved, this combined analysis still did not yield a very good determination of
  , which remained weakly constrained. However, this does not affect the quality of the solution because
  is essentially uncorrelated with the rest of the geometric properties. The significance of the resulting
  term is at the 2.8σ level. Attempts to solve for the limb-darkening coefficients also did not succeed (unsurprising given the shallow and partial nature of the eclipses), so we held them fixed at their theoretical values.
The results of our analysis are given in Table 5, where we report for each parameter the mode of the corresponding posterior distribution. Posterior distributions for all derived quantities were computed directly from the MCMC chains of the fitted parameters involved.8
Because  is so poorly constrained, we do not report a value for either the eccentricity or ω. Nevertheless, based on its posterior distribution we can constrain the eccentricity to be between 0.00012 and 0.0023 at the 99% confidence level. A few correlations remain among the variables, particularly between
  , L3, and
  , and also between
  and J, as can be seen graphically in Figure 3. The eclipses are grazing.
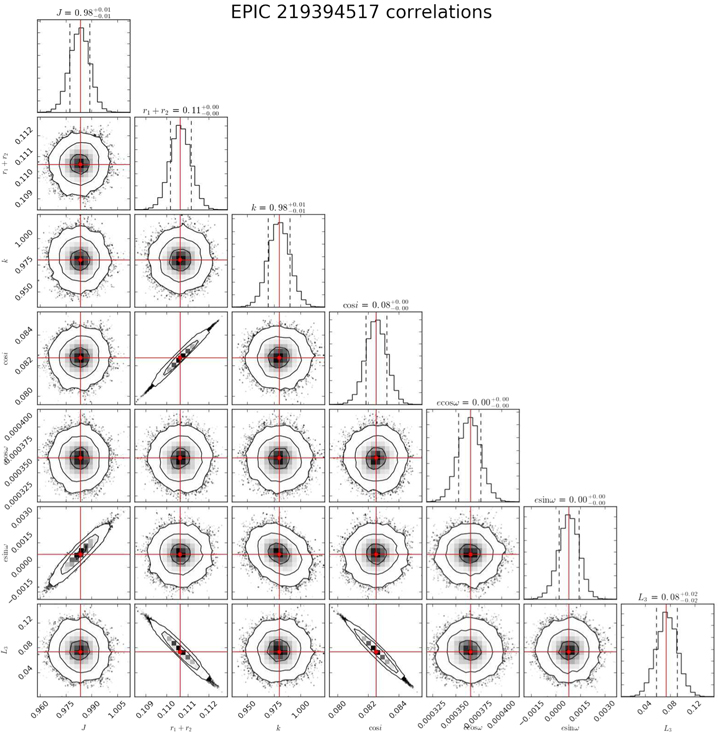
Figure 3. Corner plot (Foreman-Mackey 2016; https://github.com/dfm/corner.py) from the MCMC analysis of EPIC 219394517 illustrating the correlations among a selection of the fitted parameters of our solution. Contour levels correspond to 1, 2, and 3σ, and the histograms on the diagonal represent the posterior distribution for each parameter, with the mode and internal 68.3% confidence levels indicated. More realistic errors are discussed in the text.
Download figure:
Standard image High-resolution imageTable 5. Results from Our Combined MCMC Analysis for EPIC 219394517
| Parameter | Value | Prior |
|---|---|---|
| P (days) |

|
[6, 7] |
| T0 (HJD−2,400,000) |

|
[57342, 57347] |
| J |

|
[0.5, 1.5] |

|

|
[0.05, 0.20] |
| k |

|
[0.5, 1.5] |

|

|
[0, 1] |

|

|
[−1, 1] |

|

|
[−1, 1] |
| L3 |

|
[0.0, 0.2] |
| γ (km s−1) |

|
[30, 50] |
| K1 (km s−1) |

|
[60, 80] |
| K2 (km s−1) |

|
[60, 80] |
| fK2 |

|
[10−2, 102] |
| f1 |

|
[10−2, 102] |
| f2 |

|
[10−2, 102] |
| Derived quantities | ||
| r1 |

|
⋯ |
| r2 |

|
⋯ |
| i (degree) |

|
⋯ |

|

|
⋯ |
Note. The values listed correspond to the mode of the respective posterior distributions, and the uncertainties represent the 68.3% credible intervals that include a contribution from extra photometric noise caused by stellar activity (see the text). See also footnote 8. All priors are uniform over the specified ranges, except those for fK2, f1, and f2, which are log-uniform.
Download table as: ASCIITypeset image
Our adopted photometric model based on the parameters listed above is shown graphically in Figure 4, along with the K2 observations. Both eclipses display an obvious increase in the scatter of the residuals compared to the out-of-eclipse sections. It is conceivable that this could be caused by the detrending procedure we have applied (see Section 2), in which we simultaneously fitted the long-term stellar/instrumental variability with a basis spline, the Kepler roll systematics with cubic splines, and the eclipses with a binary model. Subtle biases in the resulting long-term variability basis spline correction (from possible crosstalk with the binary model), which we use to remove those effects from the light curve and flatten it, could in principle introduce changes in the shape of the eclipses that would result in excess scatter at those phases. However, tests in which we repeated the detrending masking out the eclipses to prevent this from happening showed that the large residuals in eclipse remain, indicating they are real, and we attribute them to spots. A similar phenomenon is commonly seen in active eclipsing systems. Some degree of activity in EPIC 219394517 is in fact expected given that the stars are rotating roughly three times more rapidly than field G stars of this age (Section 7). Furthermore, the residual scatter at the primary minimum is larger than at the other minimum, suggesting that the primary is the more active star of the two, possibly due to a difference in activity cycles given that the stars are otherwise so similar. This may also explain its larger radial-velocity uncertainties (almost a factor of two larger than the secondary; see Table 4), and the somewhat increased error in its  value as well. The impact of this extra noise during eclipse is that the uncertainties in our MCMC analysis will be underestimated.
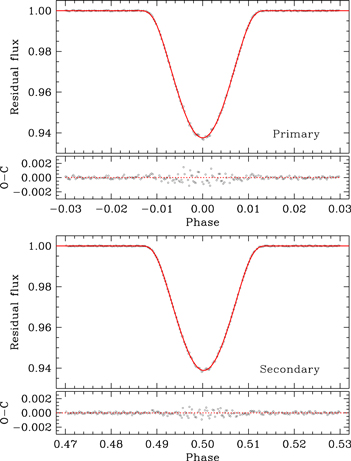
Figure 4. K2 observations of EPIC 219394517 and our adopted model. Residuals are shown at the bottom for each eclipse. Note that this model, computed from the modal values of the parameter posterior distributions, is not necessarily the best-fit model in terms of the statistical likelihood. In practice, however, the difference is imperceptible to the eye.
Download figure:
Standard image High-resolution imageTo account for this we carried out a residual permutation exercise in which we shifted the residuals from our adopted model by an arbitrary number of time indices, added them back into the model curve at each time of observation (with wrap-around), and performed the MCMC analysis again on the synthetic data set. Because the residuals in eclipse are larger than those out of eclipse, the residual permutation was done separately in these two regions to avoid producing simulated observations with smaller in-eclipse errors on average than the actual data, which would lead to underestimated parameter errors (see Hartman et al. 2018). For each new MCMC analysis we simultaneously perturbed the theoretical linear and quadratic limb-darkening coefficients by adding Gaussian noise with a standard deviation of 0.10, and used the same perturbed coefficients for both stars given that their temperatures are so similar. We repeated this 100 times, and adopted the scatter (standard deviation) of the resulting distribution for each parameter as a more realistic measure of the uncertainty that accounts for the influence of spots. Finally, we added these uncertainties in quadrature to the internal errors from our original MCMC analysis to arrive at the final uncertainties reported in Table 5. The parameters in the table for which the simulation errors dominate over the internal errors are P, T0,  ,
,  , r1, and r2.
6. Absolute Dimensions
Posterior distributions of the physical characteristics of the EPIC 219394517 stars, and other system properties, were derived by directly combining the Markov chains of the parameters on which those properties depend. We report the mode of these distributions and their 68.3% confidence intervals in Table 6. For properties that use information external to our MCMC analysis the external quantities (effective temperatures, bolometric corrections, reddening, and apparent visual magnitude) were assumed to be distributed normally and independently for combining them with the chains.
Table 6. Physical Properties of EPIC 219394517
| Parameter | Primary | Secondary |
|---|---|---|
M ( ) ) |

|

|
R ( ) ) |

|

|

|

|
|
a ( ) ) |

|
|
 (dex) (dex) |

|

|
| Teff (K) | 5930 ± 100 | 5880 ± 100 |
| L (L⊙) |

|

|
 (mag) (mag) |

|

|
| BCV (mag) | −0.055 ± 0.100 | −0.063 ± 0.100 |
| MV (mag) |

|

|
 (km s−1)a (km s−1)a
|

|

|
 (km s−1)b (km s−1)b
|
8.4 ± 0.8 | 8.2 ± 0.5 |
| E(B − V) (mag) | 0.112 ± 0.029 | |
| AV (mag) | 0.347 ± 0.090 | |
| Distance modulus (mag) |

|
|
| Distance (pc) |

|
|
| π (mas) |

|
|
 (mas) (mas) |
3.310 ± 0.040 | |
Notes. The masses, radii, and semimajor axis a are expressed in units of the nominal solar mass and radius ( ,
,  ) as recommended by 2015 IAU Resolution B3 (see Prša et al. 2016), and the adopted solar temperature is 5772 K (2015 IAU Resolution B2). Bolometric corrections are from the work of Flower (1996), with conservative uncertainties of 0.1 mag, and the bolometric magnitude adopted for the Sun appropriate for this BCV scale is
  (see Torres 2010). See the text for the source of the reddening. For the apparent visual magnitude of EPIC 219394517 out of eclipse we used V = 11.444 ± 0.034 (Henden & Munari 2014; Henden et al. 2015). See footnote 8 for an explanation of slight inconsistencies that may be present in the values reported here, which correspond to the mode of the posterior distribution of each parameter.
Download table as: ASCIITypeset image
The chemical composition (iron abundance) of EPIC 219394517 has not been measured directly, but we may reasonably assume it is the same as that of the parent cluster Ruprecht 147, which is reported to be ![$[\mathrm{Fe}/{\rm{H}}]=+0.10\pm 0.04$](https://content.cld.iop.org/journals/0004-637X/866/1/67/revision1/apjaadca8ieqn104.gif) by Curtis et al. (2013) on the basis of independent but consistent spectroscopic determinations for several dwarf and giant stars in the cluster (see also Section 5.2 of Curtis 2016).9
There is no evidence in those measurements for α-element enhancement, so we assume none.
by Curtis et al. (2013) on the basis of independent but consistent spectroscopic determinations for several dwarf and giant stars in the cluster (see also Section 5.2 of Curtis 2016).9
There is no evidence in those measurements for α-element enhancement, so we assume none.
Our adopted effective temperatures for the components are those from our spectroscopic determinations. While the formal difference between the primary and secondary temperatures of 50 ± 140 K has a large uncertainty, ΔTeff is much better determined from the difference in the eclipse depths through the J parameter in our light curve solution, which gives 25 ± 10 K. These two estimates of ΔTeff are similar enough, and the uncertainty in the absolute Teff determinations is large enough, that we have not adjusted the individual values and retain the original spectroscopic temperatures for the rest of our analysis.
Additional estimates of the mean temperature of the system may be derived from color indices based on brightness measurements available in a variety of passbands. The results, however, are strongly influenced by reddening. We have chosen here to do the reverse, i.e., to make use of the photometric temperature estimates to infer the reddening, by seeking agreement between those reddening-dependent values and our spectroscopically derived mean temperature. We used brightness measurements in the Johnson, 2MASS, and Sloan systems (Skrutskie et al. 2006; Curtis et al. 2013; Henden & Munari 2014; Henden et al. 2015) to construct nine non-independent color indices. Color–temperature calibrations from Casagrande et al. (2010) and Huang et al. (2015) were then used to derive a photometric temperature from each index and each available calibration for that index, resulting in a total of 13 Teff values. Both sets of color–temperature calibrations include terms that depend on metallicity, for which we adopted the above value of ![$[\mathrm{Fe}/{\rm{H}}]=+0.10\pm 0.04$](https://content.cld.iop.org/journals/0004-637X/866/1/67/revision1/apjaadca8ieqn106.gif) . We applied a wavelength-dependent reddening correction to each index as prescribed by Cardelli et al. (1989), and varied the amount of reddening until we found agreement between the average of the 13 photometric
. We applied a wavelength-dependent reddening correction to each index as prescribed by Cardelli et al. (1989), and varied the amount of reddening until we found agreement between the average of the 13 photometric  estimates and the luminosity-weighted spectroscopic mean temperature of the system. In this way we arrived at a reddening estimate along the sightline to EPIC 219394517 of E(B − V) = 0.112 ± 0.029 mag. The corresponding visual extinction assuming RV = 3.1 is
  mag, marginally larger than the value of
  mag favored by Curtis et al. (2013) and other estimates therein.
We point out that temperatures derived from the Casagrande et al. (2010) and Huang et al. (2015) calibrations differ in a systematic way, and this has an impact on the inferred reddening (and distance). There is considerable debate about the absolute effective temperature scale, which ultimately relies on interferometric angular diameter measurements, some of which have been suspected of being afflicted by systematic errors (see the above references for opposing views, as well as Huber et al. 2017, and references therein). Zero-point differences in the Teff scale among various authors remain at the ∼100 K level. While the calibrations of Huang et al. (2015) are based on angular diameters, those of Casagrande et al. (2010) employ the infrared flux method (IRFM), and yield temperatures systematically hotter by about 130 K. Here we have used the temperature scale of Huang et al. (2015), largely on the basis of the better agreement with other information presented in Section 8. Accordingly, the temperatures from Casagrande et al. (2010) have been adjusted by −130 K prior to averaging them with those of Huang et al. (2015). We note, however, that there is also some recent evidence (Huber et al. 2017; White et al. 2018) suggesting that the IRFM of Casagrande et al. (2010) may be somewhat more consistent with asteroseismic results as well as with spectroscopic determinations based on the excitation balance of iron lines, so the debate is not yet settled. We return to our reddening estimate in Section 8.
As an independent check on the differential extinction we measured the equivalent width of the interstellar Na i D1 line in six of our spectra in which the feature is well resolved from the stellar components. The strength of this line has been found to correlate with the amount of extinction (see, e.g., Munari & Zwitter 1997), albeit with considerable scatter. Based on a mean equivalent width of 0.27 ± 0.02 Å and the calibration from the above authors we infer a value of E(B − V) ≈ 0.10 mag, consistent with our result above.
With our adopted reddening estimate the distance we derive for EPIC 219394517 is  pc, based on the apparent out-of-eclipse visual magnitude of the system (V = 11.444 ± 0.034; Henden & Munari 2014; Henden et al. 2015) and bolometric corrections from Flower (1996). The corresponding parallax,
  mas, is consistent with the Gaia/DR2 estimate of
  mas (Gaia Collaboration et al. 2016, 2018) within about 1σ. For completeness we note that adopting the temperature scale of Casagrande et al. (2010) instead of that of Huang et al. (2015) leads to a smaller reddening of E(B − V) = 0.076 ± 0.029 mag (
 mag), and a somewhat reduced parallax of
  mas, or a distance of
  pc.
pc.
Table 6 includes the projected rotational velocities predicted by assuming spin–orbit alignment and synchronous rotation ( ), which are seen to be consistent with the spectroscopically measured
  values. Under the same assumptions the ratio (secondary/primary) of the
  values, 0.98 ± 0.11, is a direct measure of the radius ratio k, and agrees with the much more precise value from the light curve analysis.
7. Rotation and Activity
The brightness of EPIC 219394517 varies continuously with a total amplitude of about 1%, for which the usual interpretation is rotational modulation by spots on the surface of one or both stars. The variation is rather irregular (non-sinusoidal), suggesting that the spots may be moving or changing significantly with time over the span of just a few rotation periods. This is illustrated in Figure 5, where we have removed the eclipse variations as well as a long-term drift that is most likely of instrumental nature. The lower panel shows the Lomb–Scargle periodogram of the data with a dominant peak corresponding to a period of Prot = 6.89 ± 0.27 days. The uncertainty was calculated from the half width of the peak at half height. The same result for Prot was obtained from an autocorrelation analysis following McQuillan et al. (2013). This period is marginally (∼5%) longer than the orbital period, which leaves open the possibility that the rotation is not quite synchronized with the orbital motion, as we would have expected. The estimated timescale for this to happen for stars with convective envelopes is only ∼18 Myr (e.g., Hilditch 2001), which is more than two orders of magnitude shorter than the cluster age. Our spectroscopically measured projected rotational velocities are not precise enough to distinguish between synchronous and non-synchronous rotation. Alternatively, an apparently longer rotational period could also be explained if there is solar-like differential rotation and the spots occur predominantly at high latitudes.
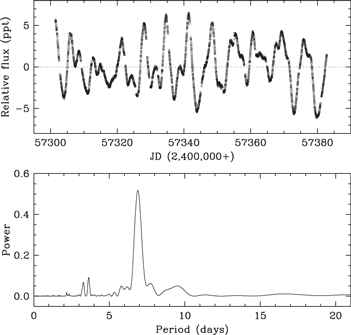
Figure 5. Top: rotational modulation in the light curve of EPIC 219394517 (relative flux in parts per thousand (ppt)). Eclipses have been removed for clarity, along with a long-term instrumental drift. Bottom: Lomb–Scargle periodogram of the observations in the top panel, showing a dominant peak at Prot = 6.89 ± 0.27 days.
Download figure:
Standard image High-resolution imageWe noted earlier that the primary appears to be the more active star of the two, judging by the larger radial-velocity uncertainties and the larger scatter of the light curve residuals during primary eclipse. As it is also slightly brighter than the secondary, it seems more likely that the rotation period we measure corresponds to the primary star, although variability in the secondary is probably also present. The very similar  values we measure imply similar rotation periods, which makes it unlikely that the pattern of modulation we see is the result of the beating of two very different frequencies. We see no obvious spectroscopic indicators of activity in our spectra, nor does EPIC 219394517 appear to have been detected as an X-ray source (e.g., by ROSAT; Voges et al. 1999) or as an ultraviolet source (GALEX; Bianchi et al. 2011).
Examination of the light curve residuals as a function of time has revealed a pattern such that occasional dips in the residuals during primary eclipse occur mostly during the first half of the K2 observations, while during the second half the primary residuals show outliers that are mostly positive. The exact opposite is seen for the secondary, as shown in Figure 6. If the spots are assumed to be dark, positive residuals would correspond to instances in which spots or spot regions on the background star are occulted by the foreground star, resulting in a temporary reduction of the eclipse depth because the surface brightness in the eclipsed area is lower than would be inferred from the out-of-eclipse baseline level. Conversely, negative residuals would result from dark spots not covered by the foreground star. The interpretation would be reversed if the spots were bright (faculae). This evolution in the pattern of residuals is another sign that spots on both stars seem to be changing on relatively short timescales of a few weeks. This is consistent with the spot decay times measured by Giles et al. (2017) in active stars of this spectral type observed by Kepler, having similar levels of photometric variability as EPIC 219394517.
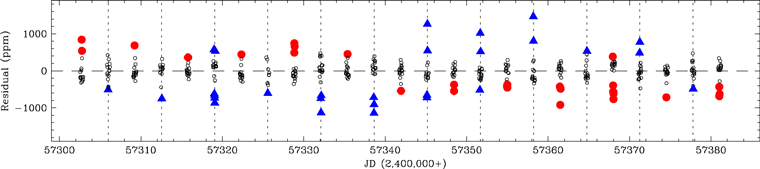
Figure 6. Residuals of the K2 observations from our light curve model during primary and secondary eclipses. Primary eclipses are marked with dotted lines. Residuals smaller than a certain threshold are represented with small dots, and larger ones are shown as blue triangles for the primary and red circles for the secondary eclipses. The thresholds were set for display purposes to 360 ppm for the secondary and 480 ppm for the more active primary. The largest residual excursions for the primary are seen mostly on the negative side for the first half of the observations, and mostly on the positive side thereafter. The residuals during secondary eclipse show the opposite behavior.
Download figure:
Standard image High-resolution image8. Comparison with Stellar Evolution Theory
Our highly precise mass and radius determinations for EPIC 219394517, with relative errors of about 0.2% and 1%, respectively, offer an opportunity for a stringent test of stellar evolution models in an open cluster of known metallicity. In the left panels of Figure 7 we present a comparison of our mass, radius, and temperature determinations with isochrones based on the PAdova-TRieste Stellar Evolution Code (version 1.2S) (PARSEC; Chen et al. 2014) for our adopted metallicity of [Fe/H] = +0.10, corresponding to Z = 0.0191 in these models. We find excellent agreement in both radius and temperature at the measured masses for an age of about 2.65 ± 0.25 ± 0.13 Gyr (based on the radii), where the two confidence intervals come from the radius and metallicity errors, respectively. Similarly good fits shown in the right panels of the figure are found to the models from the MESA Isochrones and Stellar Tracks series (MIST; Choi et al. 2016), which is based on the Modules for Experiments in Stellar Astrophysics package (MESA; Paxton et al. 2011, 2013, 2015). In this case the best-fit age for the same measured iron abundance (corresponding to Z = 0.0177 in these models) is found to be  , which is about 6% younger. Age differences between models are due in part to the different Z values, which depend on the adopted solar abundance in each case, and to other differences in the physical ingredients.
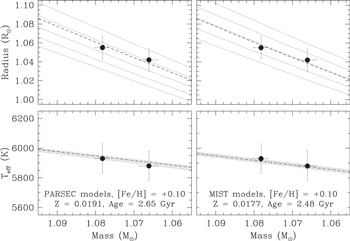
Figure 7. Comparison of the measured masses, radii, and effective temperatures of EPIC 219394517 against stellar evolution models from the PARSEC (left) and MIST series (right). The dotted lines in all of the panels correspond to model isochrones from 2 to 3 Gyr in equally spaced logarithmic intervals, and the best-fit age for each model (2.65 Gyr for PARSEC and 2.48 Gyr for MIST) is indicated with the heavier dashed line. While the adopted iron abundance for both sets is the same ([Fe/H] = +0.10), the Z values are not because of differences in the assumed solar abundance in each case.
Download figure:
Standard image High-resolution imageMembership of EPIC 219394517 in Ruprecht 147 allows for an interesting check of the models via the color–magnitude diagram that is not available for eclipsing binaries in the field. While brightness measurements in clusters are commonly used along with model isochrones to infer the age, distance modulus, reddening, and sometimes also the metallicity of the population, this type of analysis is often very challenging. Systematic errors can result from strong degeneracies usually present among the fitted model parameters, and there are also unavoidable complications having to do with contamination from field stars as well as unrecognized binarity.
With the recent release of the Gaia/DR2 catalog the problem of field star contamination has largely been eliminated from CMD studies, or at least significantly reduced, and most importantly, the distance modulus can now be considered to be known given that high-precision parallaxes, are available for nearly every star. In Ruprecht 147 the precision of the parallaxes is such that the depth of the cluster is resolved for many of its members, which helps to reduce scatter in the CMD. Reddening remains an adjustable parameter in isochrone fitting, and binarity (especially near the turnoff) can still cause biases in the age estimates.
Eclipsing binaries constrain models in a completely different way, independent of the above complications. Our analysis of EPIC 219394517 has provided robust (but model-dependent) age estimates, as well as a measure of the reddening in the direction of the binary.10 As the cluster metallicity is also known, we are in a position to compare our best-fit isochrones from PARSEC and MIST directly with brightness measurements of cluster members observed by Gaia in the native G, GBP, and GRP passbands, with no free parameters. We present such a comparison in Figure 8, based on a preliminary list of cluster members selected according to position, proper motion, parallax, and radial-velocity criteria described in more detail elsewhere (J. L. Curtis et al. 2018, in preparation). The magnitudes (adjusted for each star’s distance modulus) and colors are the measured values, and the model isochrones have been transformed to the observational plane by applying the appropriate corrections for extinction/reddening based on AV = 0.347 mag.
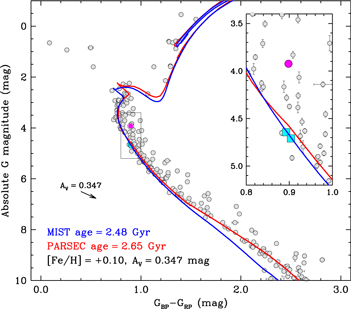
Figure 8. Color–magnitude diagram of Ruprecht 147 members based on G magnitudes,  colors, and parallaxes from the Gaia/DR2 catalog compared with isochrones from the MIST and PARSEC series (Chen et al. 2014; Choi et al. 2016) that best match the binary parameters of EPIC 219394517. Error bars for the measurements are generally too small to be visible, except in the inset. No parameters have been adjusted for this comparison: the isochrone ages are held fixed at the best-fit values derived for the binary (2.65 Gyr for PARSEC, 2.48 Gyr for MIST; see Figure 7), the reddening of E(B − V) = 0.112 mag (AV = 0.347 mag) applied directly to the isochrones is also fixed from our determination based on the spectroscopic temperatures and color–temperature calibrations (see the text), and the adopted metallicity [Fe/H] = +0.10 is the measured value for the cluster (Curtis et al. 2013). The arrow represents the reddening vector. The inset shows an enlargement around the position of EPIC 219394517, where we have deconvolved the photometry (based on our measured light ratio in the Kp band from Table 5 converted to the Gaia passbands) to show the location of the individual components of the binary (cyan squares), as well as the combined light (magenta circle).
Download figure:
Standard image High-resolution imageThe agreement in the turnoff region (most sensitive to age) and in the giant clump is quite satisfactory for both models, while the lower main sequence is clearly better matched by the PARSEC model. The improved fit to these fainter stars is due to empirical corrections described by Chen et al. (2014) that were applied to the relation between temperature and the Rosseland mean optical depth (the T–τ relation) in order to force agreement with the masses and radii of stars in the lower main sequence. As those authors showed, the same corrections also improved the fits to the CMDs of several open and globular clusters. It is therefore not surprising to find better agreement also with Ruprecht 147. An enlargement in the area of EPIC 219394517 with the location of the individual components is shown in the inset. The combined light was deconvolved using our measured Kp-band light ratio from Table 5 transformed to the Gaia passbands.
As noted in Section 6, our estimate of the extinction is dependent on a choice for the absolute temperature scale implicit in the color–temperature relations we used (Casagrande et al. 2010, or Huang et al. 2015). On the assumption that extinction is uniform across the cluster, the good agreement between models and the brightness measurements in Figure 8 favors the larger extinction value of AV = 0.347 mag based on the Huang et al. (2015) zero point over the lower value of AV = 0.236 mag derived from Casagrande et al. (2010). The latter choice would make the isochrones about 0.09 mag brighter and ∼0.05 mag bluer, resulting in a small but visible shift compared to the observations, most of which would be left to the right of the models. If, however, the extinction toward EPIC 219394517 happens to be smaller than the average for the cluster, then it is possible that the temperature scale of Casagrande et al. (2010) is more accurate (see footnote 10).
Figure 9 shows the CMD compared with the same model isochrones as before in near-infrared bands, using measurements from the WISE and 2MASS catalogs (Skrutskie et al. 2006; Wright et al. 2010). Once again the agreement is very good, though somewhat better for PARSEC at the giant branch and lower main sequence.
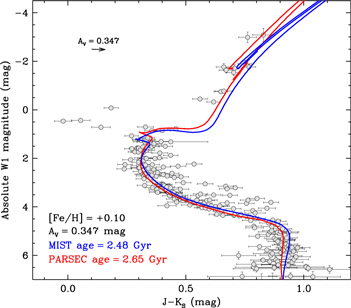
Figure 9. Same as Figure 8 using near-infrared brightness measurements from 2MASS and WISE (W1 passband at 3.4 μm).
Download figure:
Standard image High-resolution imageWhile an independent, detailed isochrone fitting analysis of the cluster CMD to determine reddening and age is beyond the scope of this work, we note, reassuringly, that preliminary results from such an exercise with the same PARSEC and MIST models used above yield in each case essentially the same ages we obtained here (J. L. Curtis et al. 2018, in preparation).
9. Discussion
With our accurate determination of the masses, radii, and effective temperatures of its components, EPIC 219394517 joins the ranks of the eclipsing binaries with the best measured properties (e.g., Torres et al. 2010). The stars are slightly evolved from the zero-age main sequence, and both appear to be somewhat active, especially the primary. Despite the relatively short period of the system, there is a hint of a very small orbital eccentricity. The theory of equilibrium tides (Zahn 1977, 1989; Claret & Cunha 1997) predicts a timescale for tidal forces to circularize the orbit of convective stars such as these of roughly 20 Gyr (Hilditch 2001), which would not be inconsistent with the observations. However, other empirical evidence suggests that tidal forces are more efficient than predicted (see, e.g., Meibom & Mathieu 2005), which would imply a shorter timescale. The comparison of our measurements against stellar evolution models in the mass–radius diagram yields fairly precise but model-dependent estimates of the age of 2.65 ± 0.25 Gyr for PARSEC and 2.48 ± 0.30 Gyr for MIST, with an additional uncertainty of 0.13 Gyr in each coming from the metallicity error. Predictions based on the same best-fit models also agree very well with our measured effective temperatures, which are less fundamental than the masses and radii. The temperatures, in turn, when combined with available standard photometry for the system, lead to an estimate of the extinction toward EPIC 219394517 that is similar to previous estimates, but is determined in a completely different way.
What distinguishes EPIC 219394517 from most other field eclipsing binaries with similarly accurate properties is its membership in a star cluster. This enables much more stringent tests of stellar evolution models, a better characterization of the parent population, and also valuable cross-validation of other techniques for dating stars based, e.g., on their oscillation frequencies or rotation periods. EPIC 219394517 belongs to Ruprecht 147 (Curtis et al. 2013), a relatively nearby (300 pc) middle-aged open cluster observed by K2, with a known metallicity determined spectroscopically from about half a dozen of its members. Using our estimate of the extinction, along with Gaia/DR2 parallaxes of cluster members, we find that the same model isochrones from PARSEC and MIST that reproduce the binary measurements in the mass–radius diagram also provide a reasonably good fit in the color–magnitude diagram of the cluster, particularly for the PARSEC model, both in the optical (G, GBP, and GRP passbands from Gaia) and in the near-infrared (W1, J, and KS passbands from WISE and 2MASS). The models therefore appear to be self-consistent in terms of their predictions of the internal structure, on the one hand, and the passband-specific fluxes, on the other, which depend on the adopted bolometric corrections, color/temperature transformations, and model atmospheres. We emphasize once again that the comparison in the CMD has no adjustable parameters: the age and extinction are determined separately based on the binary observations, the distance to all members has recently been supplied by the Gaia mission, and the metallicity is a known quantity. Few such tests have been available in the past because well-studied eclipsing binaries in clusters are rare.
Remarkably, at least four additional relatively bright (Kp < 13) detached eclipsing binaries that are amenable to study have been found in Ruprecht 147 and have high-quality space-based light curves, a situation that to our knowledge is unprecedented for an open cluster. EPIC 219394517 is the first of these eclipsing binaries to be analyzed. Spectroscopic observations of the others are well underway, and complete studies of them will be the subject of future publications by our team. Together, the components of these five binaries span a factor of two in mass (∼0.7–1.4 M⊙), reaching up to the turnoff region. Provided a similar precision as in EPIC 219394517 can be achieved for the masses and radii of the other four systems, a uniquely strong test of models in the mass–radius diagram will become possible, including perhaps a determination of the helium abundance in Ruprecht 147, given that the metallicity is known (see, e.g., Brogaard et al. 2011, 2012). We expect that the age of the cluster could be determined considerably more precisely than we have here using all five binaries simultaneously, and this could in turn serve as an important calibrator for other methods of estimating ages. For example, the K2 mission collected short-cadence photometric observations suitable for asteroseismic studies of about two dozen stars near the turnoff, as well as for a number of giants.11 Seismic ages from these data, when they become available, could be compared against the binary age. Furthermore, K2 has provided a wealth of information for measuring rotation periods in Ruprecht 147. With a precise age determined from EPIC 219394517 and the other eclipsing binaries, the rotational sequence (mass–Prot relation) for Ruprecht 147 could establish the cluster as a new reference point for gyrochronology (Barnes 2007) at an age similar to that of NGC 6819 (2.5 Gyr), allowing for a valuable comparison between two old clusters (see Meibom et al. 2015).
The spectroscopic observations of EPIC 219394517 were gathered with the help of P. Berlind, M. Calkins, G. Esquerdo, and D. Latham. J. Mink is thanked for maintaining the CfA echelle database. We are also grateful to J. Irwin for helpful conversations about light curve solutions, and to A. Dotter and L. Girardi for discussions about the MIST and PARSEC stellar evolution models. The anonymous referee is thanked for helpful comments on the original manuscript. G.T. acknowledges partial support from NASA’s Astrophysics Data Analysis Program through grant 80NSSC18K0413, and to the National Science Foundation (NSF) through grant AST-1509375. J.L.C. is supported by the NSF Astronomy and Astrophysics Postdoctoral Fellowship under award AST-1602662, and by NASA under grant NNX16AE64G issued through the K2 Guest Observer Program (GO 7035). This work was performed in part under contract with the California Institute of Technology (Caltech)/Jet Propulsion Laboratory (JPL) funded by NASA through the Sagan Fellowship Program executed by the NASA Exoplanet Science Institute. The research has made use of the SIMBAD and VizieR databases, operated at the CDS, Strasbourg, France, and of NASA’s Astrophysics Data System Abstract Service. The research was made possible through the use of the AAVSO Photometric All-Sky Survey (APASS), funded by the Robert Martin Ayers Sciences Fund, and made use of data products from the Wide-field Infrared Survey Explorer, which is a joint project of the University of California, Los Angeles, and the Jet Propulsion Laboratory/California Institute of Technology, funded by NASA. Data products were also used from the Two Micron All Sky Survey, which is a joint project of the University of Massachusetts and the Infrared Processing and Analysis Center/California Institute of Technology, funded NASA and the NSF. The work has also made use of data from the European Space Agency (ESA) mission Gaia (https://www.cosmos.esa.int/gaia), processed by the Gaia Data Processing and Analysis Consortium (DPAC, https://www.cosmos.esa.int/web/gaia/dpac/consortium). Funding for the DPAC has been provided by national institutions, in particular the institutions participating in the Gaia Multilateral Agreement.
Footnotes
- 5
- 6
- 7
- 8
We note that our choice to report the mode of the distributions will cause small but unavoidable differences between the reported values for some of the derived quantities and those that one would compute directly using the modal values of the originally adjusted parameters in Table 5.
- 9
For most of these stars the effect of microscopic diffusion on the surface abundance is very small (
 dex), and we have not attempted to apply any corrections (see Dotter et al. 2017).
 - 10
As pointed out by Curtis et al. (2013), extinction across Ruprecht 147 may be patchy, which would add scatter to the CMD.
- 11
As reported in https://keplerscience.arc.nasa.gov/data/k2-programs/GO7035.txt.
