Abstract
Multiple stellar populations (MPs) are a distinct characteristic of globular clusters (GCs). Their general properties have been widely studied among main-sequence, red giant branch (RGB), and horizontal branch (HB) stars, but a common framework is still missing at later evolutionary stages. We studied the MP phenomenon along the asymptotic giant branch (AGB) sequences in 58 GCs, observed with the Hubble Space Telescope in UV and optical filters. Using UV–optical color–magnitude diagrams, we selected the AGB members of each cluster and identified the AGB candidates of the metal-enhanced population in type II GCs. We studied the photometric properties of the AGB stars and compared them to theoretical models derived from synthetic spectral analysis. We observed the following features: (i) the spread of AGB stars in photometric indices sensitive to variations of light elements and helium is typically larger than that expected from photometric errors; (ii) the fraction of metal-enhanced stars in the AGB is lower than that in the RGB in most of the type II GCs; (iii) the fraction of 1G stars derived from the chromosome map of AGB stars in 15 GCs is larger than that of RGB stars; and (v) the AGB/HB frequency correlates with the average mass of the most helium-enriched population. These findings represent clear evidence of the presence of MPs along the AGB of Galactic GCs and indicate that a significant fraction of helium-enriched stars, which have lower mass in the HB, do not evolve to the AGB phase, leaving the HB sequence toward higher effective temperatures, as predicted by the AGB manqué scenario.
1. Introduction
A peculiar feature of the chemical composition of stars belonging to Milky Way globular clusters (GCs) is the significant variation of light elements, such as helium (He), carbon (C), nitrogen (N), oxygen (O), and sodium (Na), observed only in a tiny fraction of the Galactic bulge (∼1%; Schiavon et al. 2017) and halo field stars (∼3%; Martell et al. 2011).
In a few GCs, stars also show differences in magnesium (Mg) and aluminum (Al) content. The observed chemical variations are not random but follow trends defined by the anticorrelation of C–N, O–Na, and Mg–Al. In particular, every GC includes two main stellar groups: 1G, composed of stars with halo-like chemical composition, and 2G, composed of stars depleted in C and O and enhanced in N, Na, and He with respect to 1G. When observed in color–magnitude diagrams (CMDs) obtained by combining UV and optical observations, 1G and 2G stars lie on distinct sequences, called multiple stellar populations (MPs). The current framework of MPs in Galactic GCs largely derives from the study of the spectroscopic and photometric properties of red giant branch (RGB) stars (e.g., Milone et al. 2017; Lagioia et al. 2018; Marino et al. 2019). In a limited number of GCs it has also been possible to clearly identify MPs in fainter stars, thanks to the detection of split main sequences in CMDs (e.g., Anderson 1997; D’Antona et al. 2005; Piotto et al. 2007; Milone et al. 2013, 2015a; Bellini et al. 2017b).
The study of MPs at later evolutionary stages is more problematic. In the case of horizontal branch (HB) stars, both age–metallicity and helium mass-loss degeneracy hamper a proper understanding of the impact that chemical variations have on the color distribution of core helium-burning stars in CMDs (see, e.g., Sandage & Wildey 1967; Fusi Pecci et al. 1993; Catelan et al. 2001; Tailo et al. 2020). This indetermination propagates to the subsequent evolutionary phase, the asymptotic giant branch (AGB), where the uncertain definition of the subpopulation distribution is further amplified by statistical fluctuations due to the fast evolutionary timescale of AGB stars (Greggio & Renzini 1990).
A viable solution to this issue is provided by the direct spectroscopic determination of the atmospheric abundance of light proton-capture tracing MPs (Sneden et al. 2000). In this context, early studies have found evidence of significant differences in CN-band strength between RGB and AGB stars in NGC 5904 (M5) and NGC 6752, with the latter being biased toward CN-weak populations (see Norris et al. 1981; Smith & Norris 1993). The same disproportion in CN-band distribution was also detected later in NGC 1851 AGB stars (Campbell et al. 2012). More recently, works based on the high-resolution determination of the abundance of Na, a light element not involved in internal mixing processes during the RGB evolution (Kraft 1994; Carretta et al. 2009), confirmed the lack of Na-rich stars in the AGB of some GCs.
For instance, the Na content of 20 AGB stars of NGC 6752 analyzed by Campbell et al. (2013) was found to be lower than ∼0.2 dex, corresponding to the abundance threshold separating 1G and 2G RGB stars (Carretta et al. 2012; Milone et al. 2013). Later on, through the analysis of new spectroscopic data of the same sample of stars, Lapenna et al. (2016) confirmed a relative lack of 2G members among NGC 6752 AGB stars, with none of them associated with the most Na- and He-rich cluster population (Carretta et al. 2012; Milone et al. 2013). Interestingly, this finding seems to confirm the theoretical scenario predicted for the evolution of the hot HB stars of NGC 6752 (Villanova et al. 2009; Cassisi et al. 2014; Tailo et al. 2019b). Indeed, hot HB stars with tiny hydrogen-rich atmospheres, usually associated with the most helium-rich GC population(s) (e.g., D’Antona et al. 2002; Milone et al. 2018), would skip the early AGB (EAGB) phase, characterized by a progressive expansion and cooling of the HB star envelope, and instead evolve to higher temperatures and luminosities until they reach the white-dwarf cooling sequence. The shell helium-burning phase of these stars is therefore called AGB manqué (Greggio & Renzini 1990).
A confirmation of this prediction would come from the recent spectroscopic analysis of the AGB stars of NGC 2808, a GC known for its extended (and complex) HB morphology and linked to one of the largest internal helium variations observed among Galactic GCs (ΔY ∼ 0.124, with Y = helium mass fraction; Milone et al. 2015a). Indeed, Marino et al. (2017) identified three groups of AGB stars with distinct Na abundance, following the typical Na–O anticorrelation trend observed for the cluster RGB stars, with the distribution skewed toward lower Na RGB values (see also Wang et al. 2016), thus implying that the extremely helium-enhanced cluster stars evolved as AGB manqué.
However, a similar outcome has been found in NGC 6121 (M4), which, unlike NGC 2808, is not populated by extremely hot HB stars (Marino et al. 2008; Villanova et al. 2012) and shows a rather small internal helium enrichment (ΔY ∼ 0.01; Milone et al. 2018). As in the previous case, Marino et al. (2017) and Wang et al. (2017) found that the Na-poor and Na-rich cluster AGB stars roughly cover the lowest two-thirds of the [Na/Fe] abundance range occupied by the cluster RGB stars, thus suggesting that part of the 2G cluster stars could not reach the AGB phase (MacLean et al. 2016).
Dispersion in Mg–Al abundance has also been employed to explore MPs in the AGB stars of GCs with different HB morphologies. For instance, Lapenna et al. (2015) found no Al-rich stars among the AGB stars of NGC 6266 (M62), a result indicating the total lack of 2G AGB stars and compatible with the large helium variation detected from the main-sequence stars’ color difference by Milone (2015). In their spectroscopic analyses, García-Hernández et al. (2015) and Masseron et al. (2019) found a similar spread in the AGB and RGB stars of NGC 5024 (M53), NGC 5272 (M3), NGC 6205 (M13), NGC 6341 (M92), NGC 7078 (M15), and NGC 7089 (M2).
In principle, spectroscopic discrepancies might be reduced by claiming zero-point offsets in the abundances obtained from different data sets or with different reduction techniques (see, e.g., Campbell et al. 2017) or by the adoption of arbitrary thresholds for the selection of typical abundances in 1G and 2G AGB stars (Marino et al. 2017). However, an effective solution to the “AGB problem,” namely the unexpected high fraction of 2G stars avoiding the AGB phase (Campbell et al. 2013), requires a homogeneous definition of the observational properties of these stars in large samples of GCs. In this regard, photometry represents an ideal tool because it provides the necessary multiplexing capability. For instance, Gratton et al. (2010) adopted a statistical approach to analyze the relation between the parameter R2 = NAGB/NHB, namely the numerical fraction of AGB to HB stars in a GC (Caputo et al. 1989), and the minimum mass along the HB for a sample of 21 clusters. They found that blue-extended HB-morphology clusters attain R2 values smaller than the rest of the GCs. This result would be consistent with the AGB manqué prediction.
Another approach is represented by the study of MPs through the use of filter combinations that trace the different chemical content of stars through the variation of their flux at different wavelengths. The two main solutions adopted so far are the index or pseudo-color CF275W,F336W,F438W = (mF275W − mF336W) − (mF336W − mF438W), sensitive to C, N, and O stellar content thanks to the specific passband of the F275W, F336W, and F438W filters, available at the UV and Visual (UVIS) channel of the Wide Field Planetary Camera 3 (WFC3) on board the Hubble Space Telescope (HST; Milone et al. 2015b), and CF336W,F438W,F814W = (mF336W − mF438W) − (mF438W − mF814W), sensitive to the N, O, and He content through the F814W filter. From the previous definitions it follows that the latter index is not as sensitive as the former to the presence of MPs. Its lower accuracy is, however, counterbalanced by two clear upsides: the existence of a corresponding ground-based version CUBI = (U − B) − (B − I) (Marino et al. 2008; Monelli et al. 2013) and, as a consequence, the possibility of being used in the post-HST era (Lagioia et al. 2019a).
The measurement of the color spread of stars in both previous combinations, usually referred to as width W, provides a general view of the total chemical variations in the host GCs and can be employed for a direct comparison of the MP properties in GCs with different ages, masses, and metallicities, as already done in extensive studies of MPs in Galactic and extragalactic GCs, by using the width of RGB stars (Milone et al. 2017; Lagioia et al. 2019b). In principle, therefore, the same approach can also be adopted with AGB stars. Indeed, few recent works have clearly shown that AGB stars are spread over color intervals comparable to those observed for RGB stars, as in the cases of NGC 7089 (Milone et al. 2015b), NGC 2808 (Milone et al. 2015a), and NGC 6121 (Lardo et al. 2017; Marino et al. 2019). Moreover, direct comparison between the AGB and RGB star widths in any given cluster could provide solid evidence of missing MPs in the AGB phase (Marino et al. 2017).
The quantity W, although representing direct evidence of GC internal chemical variations, cannot provide the necessary resolution for the study of the detailed chemical composition of a cluster. A powerful tool has been recently introduced to overcome this problem: the so-called chromosome map (ChM; Milone et al. 2015a, 2015b, 2017). This photometric diagram correlates the spread of stars in two different color combinations, each sensitive to different features of the spectrum of a star. The most comprehensive ChM compilation published so far (Milone et al. 2017) includes all the 57 GCs observed in the HST UV Legacy Survey (Piotto et al. 2015) and has provided the most detailed glimpse into the complex composition of Galactic GCs. In particular, the ChM combines the information of CF275W,F336W,F438W with the large-baseline color mF275W − mF814W, which is sensitive to metallicity and helium variations. In this context, a recent analysis by Marino et al. (2017) has shown that the ChM of the AGB stars of NGC 2808 presents a degree of complexity comparable with that visible in the ChM of RGB stars (Milone et al. 2015b), with three distinct groups corresponding to as many different spectroscopic abundances. It is unfortunately not as easy to obtain the ChM of AGB stars as it is for the RGB for plain evolutionary reasons. Indeed, the AGB evolutionary timescale is about 10 times as fast as that of RGB stars brighter than HB stars (Greggio & Renzini 1990). It follows that only a limited number of GCs can provide the necessary statistical significance for a detailed MP study.
All the aforementioned findings represent a clear signature that chemical variations are also a common property of AGB stars, and offer a compelling motivation for the extension of MP analysis to a larger sample of clusters, which is the purpose of the present work. For this reason, we decided to analyze the observational properties of the AGB stars of all the clusters observed in the HST UV Legacy Survey (Piotto et al. 2015), in the same photometric bands adopted for the study of MPs along the RGB (Milone et al. 2017).
Section 2 of the present paper describes the methodology for the selection of AGB and RGB samples in each analyzed cluster, the identification of AGB stars belonging to the metal-rich population (hereafter called anomalous) in type II GCs, and the measurement of the color spread, or width, of the selected sample in specific photometric indices. Section 3 reports the computation of appropriate evolutionary models for a comparison between the observed widths and theoretical predictions. Section 4 illustrates the relation existing between the AGB and RGB widths. Section 5 shows the procedure for the construction of the ChM of clusters with well-populated AGB samples and an analysis of the population ratios. Section 6 describes the relation between the frequency of AGB stars and chemical enrichment in the GCs. Finally, Section 7 provides a summary of the analysis and a description of the contribution of this work to MP phenomenology in GCs.
2. Data Reduction and Analysis
The data set analyzed in this work comprises a total of 58 clusters, including the 57 GCs observed in the UV Legacy Survey of Galactic Globular Clusters (Piotto et al. 2015) and the distant Galactic cluster NGC 2419 (Zennaro et al. 2019). All the 57 UV Legacy Survey GCs have been observed in the WFC3/UVIS broad bands F275W, F336W, and F438W and complemented with the F606W and F814W observations collected for the Advanced Camera for Surveys (ACS) Survey of Galactic Globular Clusters (Sarajedini et al. 2007). A complete description of the image database, exposure times, and reduction techniques is reported in Piotto et al. (2015), Milone et al. (2018), and Nardiello et al. (2018). Details about the database and reduction procedure of the NGC 2419 data are provided in a recent paper by Zennaro et al. (2019), to which we refer the interested reader.
In a nutshell, photometry of every cluster has been derived by analyzing the images with the suite Kitchen Sync 2 (see Sabbi et al. 2016; Bellini et al. 2017a), originally developed by J. Anderson for the analysis of ACS images (Anderson et al. 2008). The suite is comprised of FORTRAN routines that recursively analyze the pixel values on the images and apply a local-peak finding algorithm. In each analyzed image, a selection of relatively bright stars is used to model a grid of spatially variable point-spread functions (PSFs), which represent the best-fit model for stars detected at different locations on the chip.
The position and flux of stars with different luminosities are determined with two different approaches. For bright stars, position and flux are independently determined in each single exposure and then averaged, while for faint stars an average position is computed from all the images where a star is detected, and then the flux is determined at that position by using the best-fit PSF.
Finally, stellar positions are corrected for geometrical distortion by using the solution of Bellini & Bedin (2009) and Bellini et al. (2011). Instrumental magnitudes are calibrated to the VEGAMAG system as in Bedin et al. (2005).
Selection of well-measured stars has been performed by using the parameters of photometric quality produced by the reduction software in Milone et al. (2009). The photometry of clusters affected by significant differential reddening has also been corrected as in Milone et al. (2012a). Finally, cluster membership has been established on the basis of relative proper motions as done in Milone et al. (2018).
2.1. Identification of AGB Stars
A reliable identification of the AGB stars in each GC is a critical step in our analysis. The procedure detailed below is based on the observational features of AGB stars at different wavelengths.
The AGB phase begins at the onset of helium-shell burning. In low-mass stars, this phase is characterized by an electron-degenerate CO core whose mass increases as the helium shell moves outward. During the first evolutionary stages, referred to as EAGB, the Teff of low-mass AGB stars steadily decreases while the luminosity increases, until they asymptotically reach the typical values of RGB stars. From this moment on, EAGB stars evolve by increasing their luminosity and decreasing Teff, with values slightly higher than those of RGB stars, eventually becoming colder and brighter than the brightest RGB stars near the AGB tip (see, e.g., Kamath et al. 2012).
In optical CMDs, Teff variations between stars are visible as color differences. At relatively high luminosities, random photometric errors are of the order of, or even larger than, the color differences corresponding to the small temperature differences between AGB and RGB stars, thus making it challenging to identify stars at different evolutionary stages. On the other hand, since the UV flux of EAGB stars is significantly higher than that of RGB stars at similar luminosities, the two sequences appear well distinct in far-UV–optical CMDs (Lagioia et al. 2015 and references therein). Such a behavior is shown in Figure 1, where we plot the mF336W versus (mF275W − mF814W) CMD (panel (a)) and the mF814W versus (mF606W − mF814W) CMD (panel (b)) of the brightest stars of the Galactic GC NGC 5024. In the first CMD, at mF336W ≲ 17.1 mag, we can distinguish two sequences of stars, running almost parallel in the bottom left–top right direction and separated by a color gap of less than 1 mag: the bluest and brightest sequence is populated by AGB stars, and the reddest by RGB stars. We can also recognize, at colors bluer than ∼2.5 mag, the presence of a third group, mainly composed of HB stars. The distinct location of these three stellar groups in the UV–optical CMD allows a straightforward separation of the diagram into different regions, whose boundaries, marked by dotted lines in the plot, have been used to assign an evolutionary status to the plotted stars. For the sake of clarity, we decided to represent AGB, RGB, and HB stars as red, dark-gray, and light-gray points, respectively. In passing, we note that in this CMD, the increasing F336W luminosity trend of RGB stars is reversed at (mF275W − mF814W) ≳ 6 mag because of the increasing importance of line blanketing by metals for the coldest spectral type stars at UV wavelengths (see Buzzoni et al. 2010 and references therein).
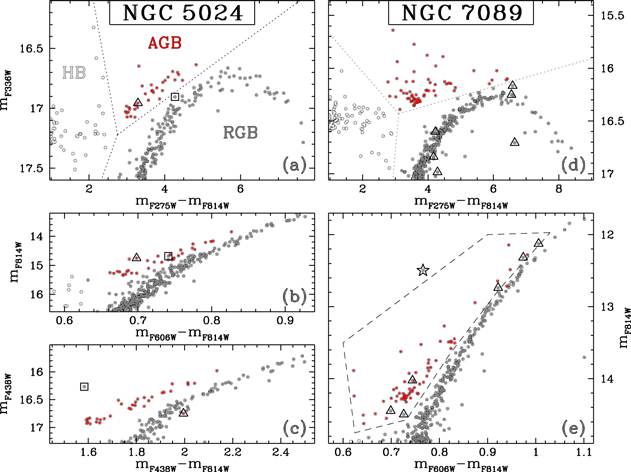
Figure 1. Panel (a): mF336W vs. (mF275W − mF814W) CMD of the brightest stars of the Galactic cluster NGC 5024. The dotted lines divide the plot into three regions that include AGB, RGB, and HB stars, represented as red, dark-gray, and light-gray points, respectively. Panel (b): mF814W vs. (mF606W − mF814W) CMD of the same stars plotted in panel (a). Panel (c): mF438W vs. (mF438W − mF814W) CMD of the same stars in panel (a). Two AGB candidates with ambiguous membership attribution have been marked with geometric symbols. Panel (d), (e): same as panel (a) but for the cluster NGC 7089. Stars marked with a star symbol have locations consistent with AGB membership in the optical CMD of panel (e). A probable post-EAGB cluster star has been marked with an open circle.
Download figure:
Standard image High-resolution imageIn the optical CMD of panel (b), we plot with the same color code the previously selected AGB, RGB, and HB stars of NGC 5024. As mentioned before, the determination of AGB evolutionary membership in optical CMDs is hindered by the small (less than 0.05 mag) color differences between AGB and RGB stars. We notice, however, that in this CMD all the AGB stars selected in the UV–optical CMD of panel (a) are bluer (hotter) than RGB stars at the same luminosity, thus demonstrating that our method produces a reliable selection of bona fide AGB stars.
Nonetheless, the selection procedure may also result in a few ambiguous attributions, which are addressed by checking the location of equivocal cases in CMDs obtained by using different band combinations. In the case of NGC 5024, for instance, we can identify two such stars. One star, which is marked by a black triangle and appears to be an AGB star in the CMD of panels (a) and (b), lies almost beyond the red RGB boundary in the mF438W versus (mF438W − mF814W) CMD displayed in panel (c). Another star, marked with a square, lies at the border of the RGB region in the CMD of panel (a) and appears as an AGB star in the optical CMD of panel (b). However in panel (c) the same star has a color too blue with respect to the rest of the AGB stars. This comparison led us to exclude both previous AGB candidates from the NGC 5024 AGB sample.
The above procedure has been applied to identify AGB candidates in every cluster of our data set except for a group of 10 peculiar GCs. These clusters, which in the extensive analysis of Milone et al. (2017) have been classified as type II GCs, as opposed to the rest of the clusters classified as type I, show a significant internal variation of [Fe/H] and heavy elements (Marino et al. 2019 and references therein). The photometric signature of this feature is revealed by the presence of a secondary RGB sequence, redder than the main one(s) in the (mF336W − mF814W) color (see Figures 10–18 in Milone et al. 2017). This group of RGB stars is usually referred to as an anomalous population.
In the case of type II CMDs, our selection method may result in a spurious bias that would exclude some AGB members belonging to the anomalous population. To show this, we plot in panel (d) of Figure 1, the mF336W versus (mF275W − mF814W) CMD of the type II GC NGC 7089 (M2). As for NGC 5024, we defined three regions containing the majority of cluster AGB, RGB, and HB stars, plotted with the previously adopted color code. In the RGB region, we can see a sparse group of stars fainter than the bulk of other RGB stars, composed by the cluster anomalous population. However, in the mF814W versus (mF606W − mF814W) CMD displayed in panel (e), the two RGB sequences are indistinguishable. As a consequence, the anomalous AGB stars will also attain the same colors of the other cluster AGB members. For this reason, we empirically defined a region, indicated by the dashed line, that includes all the stars with locations compatible with the AGB phase. We observe that six stars classified as RGB members in the UV–optical CMD and marked with an open star symbol fall in this region. We see that three of them lie along the main RGB sequence in the UV–optical CMD of panel (d), two have F336W magnitudes typical of the anomalous RGB sequence, and the remaining one lies at the border of the RGB region. Their location in both of the CMDs indicates that they are probable candidates of the AGB anomalous population, and therefore, they have been merged to the cluster AGB sample.
Interestingly, in the optical CMD we observe a star (which we mark with an open circle) having two peculiar features: (i) it is ∼0.2 mag bluer than AGB stars at the same luminosity, and (ii) it has mF336W ≈ 14.6, thus lying beyond the displayed limits of the UV–optical CMD of panel (d). The bluer optical color and the strong UV flux suggest that this star is a post-EAGB candidate—namely a star with a very small hydrogen-rich envelope—that fails to reach the thermal-pulse AGB phase, leaving the asymptotic branch toward higher Teff (Greggio & Renzini 1990). We notice that the presence of a small mass envelope is also connected with a higher mass loss during the RGB evolution, which is in turn linked to higher helium content in stars (Tailo et al. 2019a). Milone et al. (2018) found that the maximum internal helium variation,  , of NGC 7089 is as high as 0.052, therefore corroborating the hypothesis on the peculiar nature of this star.
The method described above has been used for the selection of the sample of AGB stars in all the other type II clusters, namely NGC 362, NGC 1261, NGC 1851, NGC 5139 (ω Cen), NGC 5286, NGC 6715 (M54), NGC 6388, and NGC 6934.
The total number of AGB stars, NAGB, identified in each cluster is reported in Table 1 together with the total number of RGB stars, NRGB, brighter than the faintest AGB candidate in the F814W band. We note that since no AGB stars have been found in NGC 5053 and NGC 6121, the corresponding NRGB entries are empty. In all the other 56 GCs, NAGB ranges from 1 (NGC 6397) to 161 (NGC 6441). Among them, 21 GCs have NAGB < 10. Since statistical significance is an important factor in the determination of the photometric properties of AGB stars, we empirically assumed NAGB = 10 as a lower limit for the inclusion of a GC in the following analysis.
Table 1. Number of AGB Members and Bright RGB Stars Detected in Each Cluster and the Corresponding Intrinsic Width and Error, Expressed in Magnitudes, in the Pseudo-color CF275W,F336W,F438W and CF275W,F336W,F438W
| ID | NAGB | NRGB |
|

|

|

|
|---|---|---|---|---|---|---|
| NGC 104 | 29 | 71 | 0.400 ± 0.023 | 0.439 ± 0.074 | 0.136 ± 0.023 | 0.156 ± 0.036 |
| NGC 288 | 3 | 6 | ⋯ | ⋯ | ⋯ | ⋯ |
| NGC 362 | 29 | 87 | 0.235 ± 0.051 | 0.299 ± 0.028 | 0.120 ± 0.031 | 0.116 ± 0.007 |
| NGC 1261 | 31 | 69 | 0.288 ± 0.039 | 0.305 ± 0.014 | 0.099 ± 0.016 | 0.118 ± 0.010 |
| NGC 1851 | 38 | 75 | 0.375 ± 0.031 | 0.359 ± 0.044 | 0.140 ± 0.018 | 0.129 ± 0.024 |
| NGC 2298 | 7 | 15 | ⋯ | ⋯ | ⋯ | ⋯ |
| NGC 2419 | 83 | 373 | 0.333 ± 0.025 | 0.596 ± 0.076 | 0.109 ± 0.020 | 0.142 ± 0.007 |
| NGC 2808 | 83 | 196 | 0.411 ± 0.034 | 0.464 ± 0.020 | 0.183 ± 0.015 | 0.136 ± 0.011 |
| NGC 3201 | 3 | 4 | ⋯ | ⋯ | ⋯ | ⋯ |
| NGC 4590 | 7 | 15 | ⋯ | ⋯ | ⋯ | ⋯ |
| NGC 4833 | 16 | 50 | 0.188 ± 0.025 | 0.304 ± 0.027 | 0.087 ± 0.032 | 0.099 ± 0.012 |
| NGC 5024 | 32 | 112 | 0.197 ± 0.022 | 0.227 ± 0.012 | 0.066 ± 0.016 | 0.074 ± 0.010 |
| NGC 5053 | 0 | ⋯ | ⋯ | ⋯ | ⋯ | ⋯ |
| NGC 5139 | 31 | 53 | 0.205 ± 0.052 | 0.415 ± 0.041 | 0.113 ± 0.029 | 0.190 ± 0.031 |
| NGC 5272 | 15 | 71 | 0.210 ± 0.035 | 0.282 ± 0.024 | 0.103 ± 0.025 | 0.094 ± 0.013 |
| NGC 5286 | 69 | 138 | 0.294 ± 0.042 | 0.309 ± 0.020 | 0.161 ± 0.026 | 0.155 ± 0.018 |
| NGC 5466 | 8 | 15 | ⋯ | ⋯ | ⋯ | ⋯ |
| NGC 5897 | 5 | 12 | ⋯ | ⋯ | ⋯ | ⋯ |
| NGC 5904 | 15 | 54 | 0.242 ± 0.057 | 0.285 ± 0.046 | 0.096 ± 0.042 | 0.132 ± 0.024 |
| NGC 5927 | 17 | 52 | 0.394 ± 0.025 | 0.269 ± 0.097 | 0.166 ± 0.018 | 0.136 ± 0.038 |
| NGC 5986 | 38 | 98 | 0.224 ± 0.018 | 0.314 ± 0.021 | 0.110 ± 0.027 | 0.125 ± 0.017 |
| NGC 6093 | 35 | 117 | 0.200 ± 0.039 | 0.337 ± 0.023 | 0.091 ± 0.027 | 0.111 ± 0.012 |
| NGC 6101 | 11 | 17 | 0.102 ± 0.021 | 0.119 ± 0.037 | 0.048 ± 0.027 | 0.033 ± 0.009 |
| NGC 6121 | 0 | ⋯ | ⋯ | ⋯ | ⋯ | ⋯ |
| NGC 6144 | 7 | 12 | ⋯ | ⋯ | ⋯ | ⋯ |
| NGC 6171 | 13 | 16 | 0.345 ± 0.081 | 0.277 ± 0.060 | 0.134 ± 0.047 | 0.118 ± 0.012 |
| NGC 6205 | 14 | 66 | 0.256 ± 0.030 | 0.336 ± 0.036 | 0.078 ± 0.020 | 0.117 ± 0.014 |
| NGC 6218 | 4 | 21 | ⋯ | ⋯ | ⋯ | ⋯ |
| NGC 6254 | 10 | 25 | 0.355 ± 0.056 | 0.327 ± 0.049 | 0.155 ± 0.034 | 0.114 ± 0.023 |
| NGC 6304 | 11 | 28 | ⋯ | ⋯ | ⋯ | ⋯ |
| NGC 6341 | 15 | 64 | 0.288 ± 0.069 | 0.173 ± 0.026 | 0.218 ± 0.063 | 0.066 ± 0.011 |
| NGC 6352 | 4 | 11 | ⋯ | ⋯ | ⋯ | ⋯ |
| NGC 6362 | 5 | 14 | ⋯ | ⋯ | ⋯ | ⋯ |
| NGC 6366 | 2 | 3 | ⋯ | ⋯ | ⋯ | ⋯ |
| NGC 6388 | 158 | 268 | 0.522 ± 0.027 | 0.443 ± 0.021 | 0.291 ± 0.042 | 0.211 ± 0.025 |
| NGC 6397 | 1 | 2 | ⋯ | ⋯ | ⋯ | ⋯ |
| NGC 6441 | 161 | 246 | 0.540 ± 0.026 | 0.608 ± 0.047 | 0.199 ± 0.026 | 0.216 ± 0.040 |
| NGC 6496 | 2 | 11 | ⋯ | ⋯ | ⋯ | ⋯ |
| NGC 6535 | 3 | 9 | ⋯ | ⋯ | ⋯ | ⋯ |
| NGC 6541 | 8 | 27 | ⋯ | ⋯ | ⋯ | ⋯ |
| NGC 6584 | 11 | 27 | 0.198 ± 0.044 | 0.212 ± 0.021 | 0.135 ± 0.053 | 0.107 ± 0.021 |
| NGC 6624 | 15 | 33 | 0.415 ± 0.069 | 0.444 ± 0.044 | 0.138 ± 0.025 | 0.164 ± 0.020 |
| NGC 6637 | 29 | 54 | 0.367 ± 0.031 | 0.311 ± 0.026 | 0.133 ± 0.015 | 0.129 ± 0.009 |
| NGC 6652 | 8 | 15 | ⋯ | ⋯ | ⋯ | ⋯ |
| NGC 6656 | 10 | 70 | 0.264 ± 0.036 | 0.299 ± 0.033 | 0.161 ± 0.038 | 0.178 ± 0.021 |
| NGC 6681 | 12 | 23 | 0.293 ± 0.063 | 0.381 ± 0.056 | 0.140 ± 0.035 | 0.154 ± 0.026 |
| NGC 6715 | 84 | 248 | 0.327 ± 0.037 | 0.431 ± 0.022 | 0.160 ± 0.038 | 0.146 ± 0.007 |
| NGC 6717 | 7 | 14 | ⋯ | ⋯ | ⋯ | ⋯ |
| NGC 6723 | 23 | 39 | 0.391 ± 0.047 | 0.457 ± 0.028 | 0.149 ± 0.030 | 0.128 ± 0.015 |
| NGC 6752 | 11 | 29 | 0.231 ± 0.051 | 0.435 ± 0.050 | 0.364 ± 0.072 | 0.142 ± 0.026 |
| NGC 6779 | 14 | 27 | 0.155 ± 0.022 | 0.274 ± 0.052 | 0.082 ± 0.024 | 0.078 ± 0.023 |
| NGC 6809 | 3 | 10 | ⋯ | ⋯ | ⋯ | ⋯ |
| NGC 6838 | 6 | 6 | ⋯ | ⋯ | ⋯ | ⋯ |
| NGC 6934 | 23 | 56 | 0.301 ± 0.057 | 0.329 ± 0.034 | 0.128 ± 0.029 | 0.117 ± 0.014 |
| NGC 6981 | 14 | 22 | 0.260 ± 0.074 | 0.313 ± 0.082 | 0.085 ± 0.045 | 0.109 ± 0.014 |
| NGC 7078 | 34 | 192 | 0.224 ± 0.037 | 0.257 ± 0.009 | 0.149 ± 0.039 | 0.104 ± 0.005 |
| NGC 7089 | 68 | 216 | 0.267 ± 0.021 | 0.303 ± 0.017 | 0.114 ± 0.011 | 0.124 ± 0.009 |
| NGC 7099 | 6 | 14 | ⋯ | ⋯ | ⋯ | ⋯ |
Download table as: ASCIITypeset image
It is important here to stress the fact that the procedure for the selection of AGB candidates in type II GCs can result in an incomplete definition of the sample of their anomalous population. A better understanding of this phenomenon requires, however, a deeper evaluation of the fraction of stars left out by the adopted selection method, as done in the following section.
2.2. Completeness of AGB Identifications in Type II Clusters
In the previous section we have seen that in the mF336W versus (mF275W − mF814W) CMD, the AGB sequence of the anomalous population in type II GCs intersects the RGB sequence. This implies that part of the anomalous AGB population can be left out by our selection procedure. To prevent this issue, we have also seen that we can take advantage of the (mF606W − mF814W) color, where the AGB sequences of all the cluster stellar populations occupy the same region. Conversely, optical colors are far from ideal for selecting AGB and RGB stars because the separation of the two evolutionary sequences is comparable with the typical photometric error at their characteristic luminosities. This implies that optical CMDs will only provide a partial solution to the aforementioned issue.
It is therefore necessary to evaluate the maximum fraction of anomalous AGB stars missed by our selection procedure. To this purpose, we performed a series of simulations where we constructed artificial CMDs composed of stellar populations with different iron abundances. To build the artificial CMDs, we took advantage of appropriate evolutionary models from the MESA 7 database (Choi et al. 2016). In particular, we used isochrones of 13.5, 12.5, and 11.5 Gyr at different [Fe/H] values, ranging from −2.10 to −0.5 dex in steps of 0.15 dex. For each grid point, we simulated two artificial CMDs with Δ[Fe/H] = 0.15 and 0.30 dex. The age and metallicity interval roughly covers the entire range spanned by the studied type II GCs, while the observed average difference in [Fe/H] content between metal-rich and metal-poor stars in these clusters is smaller than ∼0.35 dex (Marino et al. 2019 and references therein).
Figure 2 shows an example of our simulations obtained from 12.5 Gyr isochrones with [Fe/H] = −1.80 and [Fe/H] = −1.50, which we will refer to as the metal-poor and metal-rich populations, respectively. Each simulated population is composed of 5 × 10⁶ stars with a random flat distribution of initial masses greater than that of the corresponding model’s turnoff. Artificial magnitudes have been obtained by interpolation on the initial mass values of the isochrone. To each simulated magnitude has been assigned a random error based on a Gaussian distribution with the typical dispersion of our observations. The resulting MF336W versus MF275W − MF814W and MF814W versus MF606W − MF814W artificial CMDs are displayed in the left and right panels of the figure, where for the sake of clarity we decided to plot only 50,000 stars in each simulated population. Moreover, we mark the interval corresponding to the location of the EAGB phase with a dashed line. In particular we use a blue color for the metal-poor population and a red color for the metal-rich one.
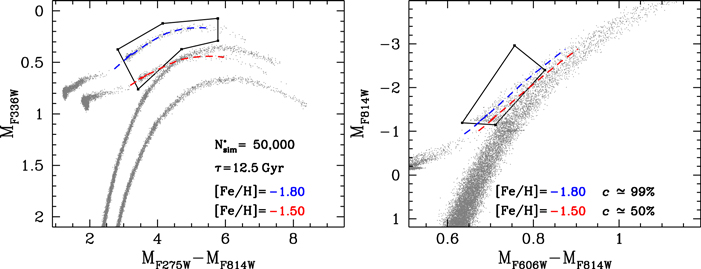
Figure 2. Procedure for the estimation of the completeness of the AGB selection procedure in type II GCs. The left and right panels display, respectively, the MF336W vs. MF275W − MF814W and MF814W vs. MF606W − MF814W CMDs of two 12.5 Gyr old synthetic stellar populations with [Fe/H] = −1.80 and [Fe/H] = −1.50, each composed of 50,000 stars. In each simulated population, the region including EAGB stars is represented by a corresponding isochrone (dashed line), whose metallicity is indicated in the legend. In both diagrams, black boxes delimit the regions including probable AGB members. Since part of the metal-rich AGB population mixes with the RGB of the metal-poor one in the first CMD, the completeness (c) of the adopted selection procedure of more metal-rich AGB stars is correspondingly lower, as reported in the right-panel legend.
Download figure:
Standard image High-resolution imageThe left diagram shows that the metal-rich AGB sequence intersects the metal-poor RGB one, so that the most evolved metal-rich AGB stars appear fainter than the brightest metal-poor RGB stars in the F336W band. This fact clearly indicates that the adopted AGB selection method can leave out part of the bright metal-rich AGB population. In order to estimate the fraction of missed stars, we performed the following steps: (i) we tagged as input AGB members simulated stars with initial masses falling in the interval defined by the upper and lower limits of the model EAGB range; (ii) as done for the observations, we defined by eye a region delimiting probable AGB candidates, as indicated by the black box in both diagrams; (iii) we flagged as AGB members stars falling in either box-delimited region; and (iv) we compared the number of recovered and input AGB stars to estimate the fraction of lost AGB stars. By applying the above procedure for different combinations of age and metallicity, we found that the maximum fraction of missed AGB stars of the metal-rich stellar population is ∼1% when Δ[Fe/H] = 0.15 and ∼50% when Δ[Fe/H] = 0.30, corresponding, respectively, to a completeness of ∼99% and ∼50%, as reported in the right panel. The missed stars are mostly composed of AGB stars at later evolutionary stages. Our simulations also show that a small fraction (∼1%) of metal-poor stars are left out by our selection: this derives from the nonperfect location and extension of the AGB-delimiting region. We can therefore consider 1% as the random error associated with our completeness estimates.
The most significant variations of completeness have been observed for the most metal-poor and metal-rich bins of the analyzed metallicity range and for Δ[Fe/H] = 0.30. In the first case the completeness of the metal-rich population is ∼30%, while it reduces to nearly zero for the most metal-rich bin, where the metal-rich AGB is fainter and redder than the metal-poor RGB. We emphasize however that none of the type II GCs in our GC database has metallicity lower than ∼–1.80 dex, and that for the most metal-rich studied type II GC, namely NGC 6388 ([Fe/H] = −0.55; Harris 1996, 2010 update), the internal iron variation is negligible (see Carretta & Bragaglia 2018). Finally, we notice that similar results have been obtained by using models of 13.5 and 11.5 Gyr.
Our analysis indicates that the maximum fraction of anomalous AGB stars missed by our selection procedure is negligible when the metallicity difference between the anomalous and other GC stars is smaller than ∼0.15 dex. This fraction rapidly increases, becoming significant at metallicity differences larger than ∼0.30 dex. Moreover, in the interval considered in our simulations, cluster age has a negligible effect on the results.
2.3. AGB Candidates of the Anomalous Population in Type II Clusters
In this section we seek AGB candidates of the anomalous population in type II clusters (Milone et al. 2017). To do this we take advantage of their mF336W versus mF336W − mF814W CMD. Indeed, as shown by Milone et al. (2017), this diagram represents an efficient tool for separating populations with different metallicities in GCs.
Figure 3 shows the mF336W versus mF336W − mF814W CMDs of the 10 type II GCs included in our database, arranged from the least metal-rich to the most. In each CMD, we mark with red points the AGB candidates found through the selection procedure described in Section 2.1. We see that in all the CMDs the majority of AGB members occupy the uppermost portion, except for a group of a few stars that have F336W luminosities comparable with or lower than those of RGB stars at the same colors. As seen in the previous section, this indicates that they are likely to be members of the AGB anomalous population. However, since our AGB selection procedure is mainly based on the location of stars in the mF336W versus mF275W − mF814W CMD, some of the AGB stars not belonging to the anomalous population may attain colors similar to those of RGB stars in the narrower color-baseline mF336W versus mF336W − mF814W CMD. According to this consideration, we identified as the most probable members of the anomalous AGB population only those AGB stars that are fainter/redder than the main RGB, while the AGB stars lying at the blue border of the main RGB sequence have been excluded. In the case of NGC 5139 and NGC 6388, since no clear separation is visible between the different cluster RGB sequences, we decided to flag as anomalous AGB stars all stars redder/fainter than the blue limit of the main RGB sequence. Since the majority of anomalous AGB candidates in NGC 6388 attain similar mF336W − mF814W colors, we decided to use a wider panel in order to stretch the horizontal scale of the plot. In each panel, the selected anomalous AGB candidates have been marked with an open star symbol in each CMD. We notice that in two clusters, namely NGC 1261 and NGC 6934, no anomalous AGB stars were found, while only one anomalous AGB candidate has been identified in NGC 6656, which is one of the clusters with the highest fraction (∼0.4) of anomalous-population RGB stars among those analyzed by Milone et al. (2017). On the other hand, the highest number of AGB candidates has been detected in the three massive GCs NGC 5139 (9), NGC 6388 (11), and NGC 6715 (8).
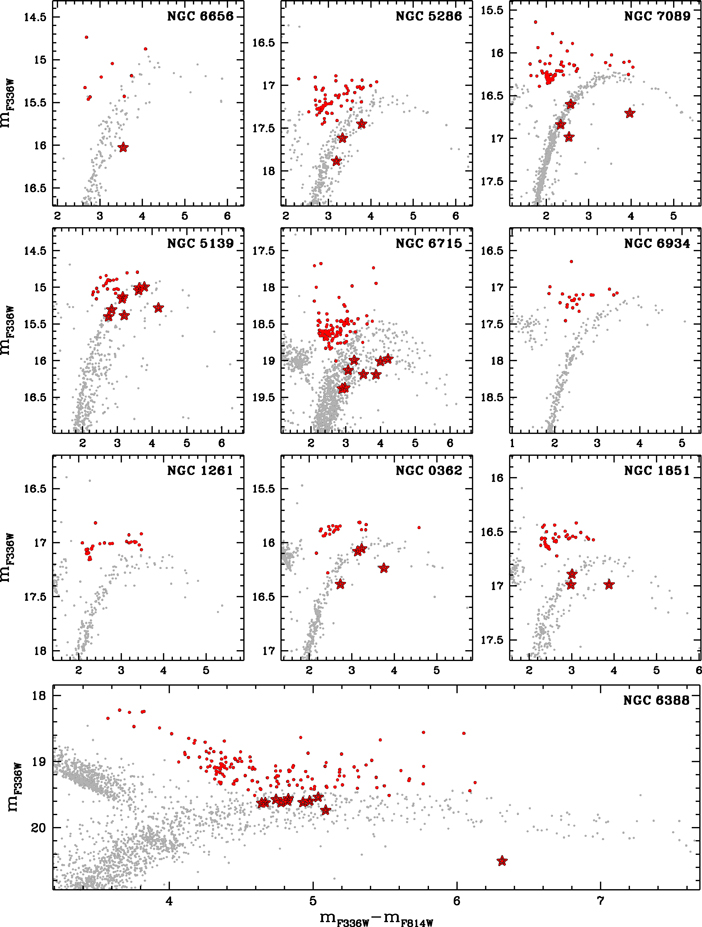
Figure 3. mF336W vs. mF336W − mF814W CMDs of the 10 type II clusters included in our database. In each GC, the AGB candidates are represented as red points, while the AGB candidates of the anomalous population have been marked with a star symbol.
Download figure:
Standard image High-resolution imageFigure 4 shows the relation between the fraction of anomalous candidate AGB stars,  , and the fraction of anomalous RGB stars,
  , determined by Milone et al. (2017). For each cluster i, the error associated with the estimate of the fraction of anomalous AGB stars has been obtained by performing 50,000 simulations of
  values randomly distributed in the interval [0, 1]. For each simulation, we evaluated the fraction of simulated values smaller than the ith
  value. Finally the 68th percentile of the resulting distribution has been taken as the error associated with the anomalous AGB fraction. The black dashed line in the plot marks the identity relation.
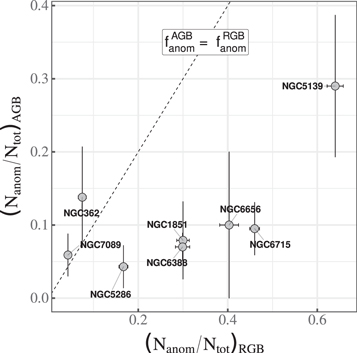
Figure 4. Fraction of anomalous AGB stars vs. fraction of anomalous RGB stars of eight type II clusters included in our database. The black dashed line represents the identity relation.
Download figure:
Standard image High-resolution imageWe see that in six GCs the fraction of anomalous RGB stars is significantly higher than that of anomalous AGB stars, thus suggesting that part of their anomalous population does not reach the asymptotic branch. In NGC 362 and NGC 7089 the fraction of anomalous AGB stars is higher, but consistent within 1σ with that of anomalous RGB stars. We also notice that these two clusters are among the type II GCs with the lowest fraction of anomalous RGB stars (respectively ∼8% and ∼4%; Milone et al. 2017). As a consequence, small random statistical fluctuations can significantly affect the estimate of their fraction of anomalous AGB stars.
2.4. Determination of the AGB and RGB Widths
The photometric footprint of the presence of MPs in GCs is represented by the color spread of the stars, observed in CMDs where specific color combinations, sensitive to the content variation of light elements and helium, are used. The two main choices adopted so far are the indices CF275W,F336W,F438W and CF336W,F438W,F814W: the first mostly traces chemical differences in O, N, and C, while the second traces those in N, C, and He.
The mF814W versus CF275W,F336W,F438W pseudo-CMDs of the brightest stars in all the analyzed GCs, sorted in ascending order of metallicity, are displayed in Figures 5–11. For the sake of convenience we decided to not show the mF814W versus CF336W,F438W,F814W pseudo-CMDs of our targets. In each CMD, the gray points represent the cluster RGB and HB stars, while the red points represent the AGB candidates. The black error bars on the left side of each panel indicate the typical photometric errors of the AGB stars.
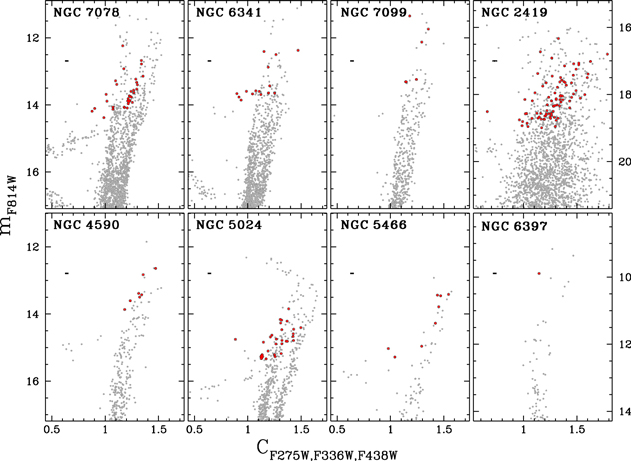
Figure 5. mF814W vs. CF275W,F336W,F438W of NGC 7078, NGC 6341, NGC 7099, NGC 2419, NGC 4590, NGC 5024, NGC 5466, and NGC 6397. AGB stars are represented as red points, and their average error bar is shown on the upper left side of each panel.
Download figure:
Standard image High-resolution image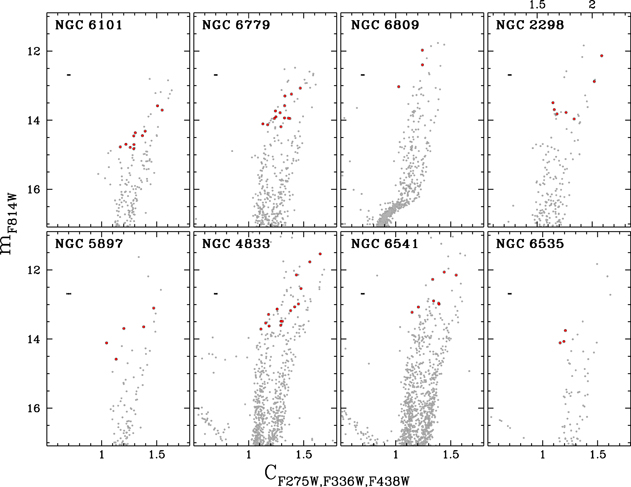
Figure 6. Same as Figure 5 but for NGC 6101, NGC 6779, NGC 6809, NGC 2298, NGC 5897, NGC 4833, NGC 6541, and NGC 6535.
Download figure:
Standard image High-resolution image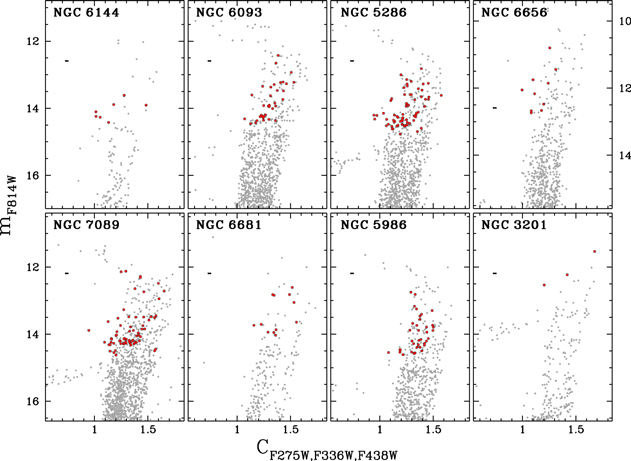
Figure 7. Same as Figure 5 but for NGC 6144, NGC 6093, NGC 6656, NGC 5286, NGC 7089, NGC 6681, NGC 5986, and NGC 3201.
Download figure:
Standard image High-resolution image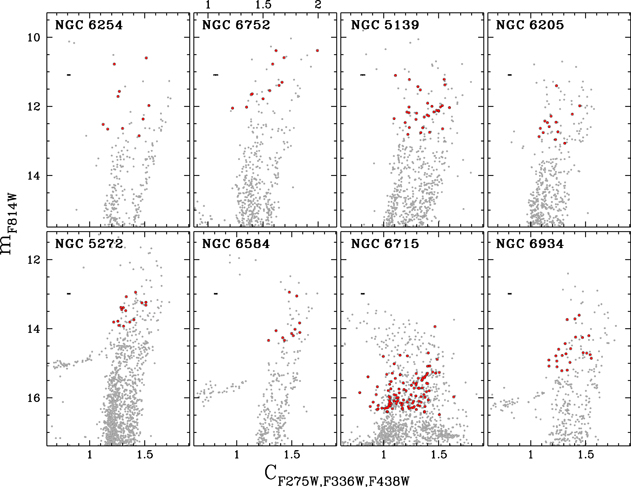
Figure 8. Same as Figure 5 but for NGC 6254, NGC 6752 NGC 5139, NGC 6205, NGC 5272, NGC 6584, NGC 6715, and NGC 6934.
Download figure:
Standard image High-resolution image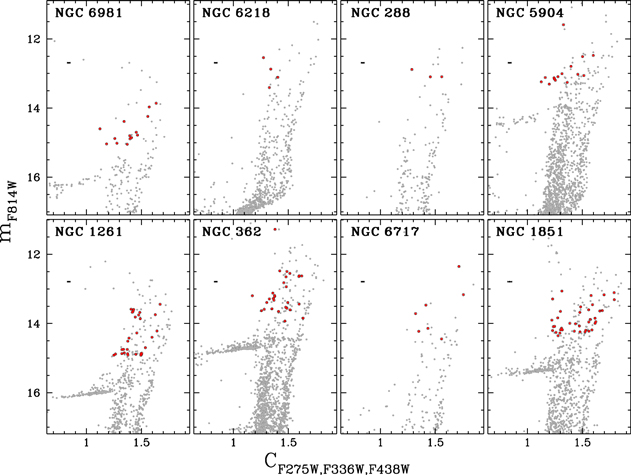
Figure 9. Same as Figure 5 but for NGC 6981, NGC 6218, NGC 288, NGC 5904, NGC 1261, NGC 362, NGC 6717, and NGC 1851.
Download figure:
Standard image High-resolution image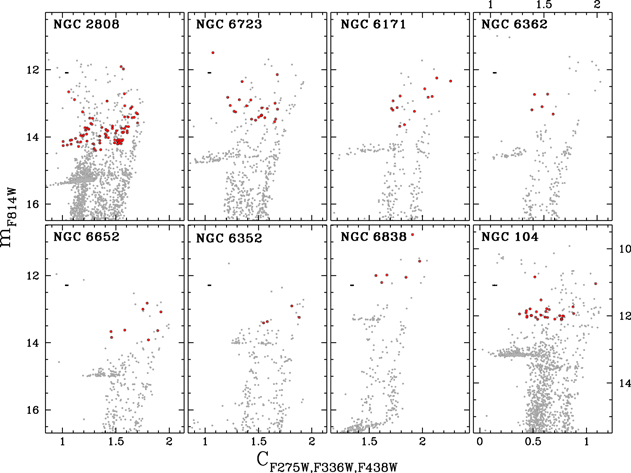
Figure 10. Same as Figure 5 but for NGC 2808, NGC 6723, NGC 6171, NGC 6362, NGC 6652, NGC 6352, NGC 6838, and NGC 104.
Download figure:
Standard image High-resolution image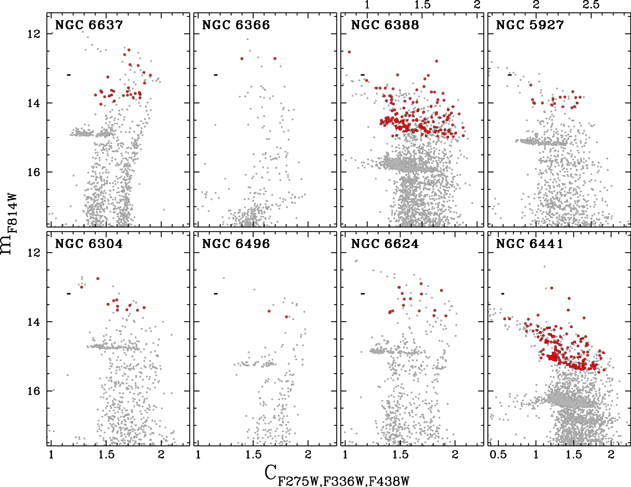
Figure 11. Same as Figure 5 but for NGC 6637, NGC 6366, NGC 6388, NGC 5927, NGC 6304, NGC 6496, NGC 6624, and NGC 6441.
Download figure:
Standard image High-resolution imageA quick look at the CMDs shows that the AGB sequences are much wider than the spread expected from observational errors alone in all the analyzed GCs, except in eight clusters, namely NGC 7099, NGC 4590, NGC 5466, NGC 6397, NGC 6809, NGC 6535, NGC 6218, and NGC 6496, that have a poorly populated sequence of AGB stars with a spread comparable with the pseudo-color error. On the other hand, the poorly populated AGB sequence of NGC 2298, NGC 5897, NGC 6541, NGC 6144, NGC 3201, NGC 288, NGC 6717, NGC 6362, NGC 6352, NGC 6838, and NGC 6366 displays a clear spread. The pseudo-color broadening observed in the CMDs clearly shows that MPs are a common characteristic of the analyzed GCs.
A deeper view into the properties of MPs can be obtained through the analysis of their color extension. Figure 12 illustrates the procedure for the measurement of the width of the AGB and upper RGB stars of NGC 7089. Panel (a) shows the mF814W versus CF275W,F336W,F438W pseudo-CMD of the brightest cluster stars, where gray and red points represent, respectively, RGB/HB members and AGB candidates. We also highlight the anomalous AGB stars of the clusters with the usual red star symbol. We do the same with the post-EAGB candidate, marked with a black star symbol. The stars in this diagram follow an almost vertical trend along the entire displayed magnitude interval until ≈12.2 mag, where they move toward bluer colors because of the effect of line blanketing, as seen in the previous section. As such, all AGB/RGB stars brighter than this threshold were excluded from the following computation. We therefore defined a magnitude interval (delimited by the long-dashed horizontal lines) extended from the brightest to the faintest cluster AGB star not belonging to the cluster anomalous AGB sample, which was discarded in the following procedure. We then divided this luminosity range in three magnitude bins, delimited by the dotted horizontal lines. For each bin i, we measured the 80th percentile of the pseudo-color distribution of the AGB and RGB star samples, indicated, respectively, by open circles and triangles. Then, we linearly interpolated these points along the magnitude values attained by the AGB and RGB stars included in the selected magnitude interval. The interpolation line was then used to “verticalize” the CMD of the AGB stars (panel (b)) and RGB stars (panel (c)). In these two diagrams, the abscissa of each star,  and
and  , corresponds to the difference between its pseudo-color and the pseudo-color of the interpolating function at the same F814W magnitude, whose abscissa is now identically equal to zero. Finally, we computed the 10th and 90th percentiles of the
  distribution, marked by red (gray) short-dashed vertical lines in panel (b) (panel (c)), and took the absolute difference between these two values as the width of the cluster AGB (RGB) stars,
  .
.
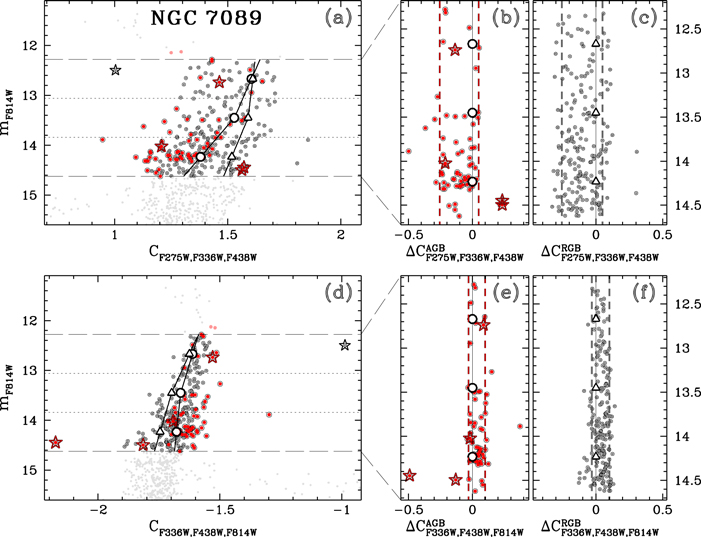
Figure 12. Determination of the width of AGB and RGB stars of NGC 7089. Panel (a): mF814W vs. CF275W,F336W,F438W CMD of the cluster AGB (red points) and RGB/HB (gray points) stars included in the selected F814W magnitude interval, marked by long-dashed horizontal lines. AGB stars brighter than the selected luminosity threshold are represented as light-red points. Anomalous AGB candidates have been marked with a red star symbol, while the only post-EAGB candidate star has been marked with a black star symbol. Panels (b), (c): verticalized CMDs of the cluster AGB (panel (b)) and RGB (panel (c)) stars, where the horizontal displacement between the two dashed vertical lines represents the corresponding observed width. Panels (d)–(f): same as panels (a)–(c) but for the pseudo-color CF336W,F438W,F814W.
Download figure:
Standard image High-resolution imageThe same method was applied to obtain the pseudo-color CF336W,F438W,F814W width of the cluster AGB (RGB) stars,  , as shown in panels (d)–(f) of Figure 12. In this case we used the 20th percentile distribution of the AGB (RGB) stars in the selected magnitude interval, as shown in panel (d). Since the x-axis interval of the diagrams in panels (b), (c), (e), and (f) spans 1 mag, we can see that the observed width of the cluster AGB (RGB) stars in CF336W,F438W,F814W is about a factor of two smaller than that measured in the pseudo-color CF275W,F336W,F438W.
The error in the determination of the width of the AGB and RGB stars, in both pseudo-colors, has been estimated by performing 10,000 bootstrapping tests on random sampling with replacement. Each test was carried out by generating a simulated sample containing sequential copies of  and
and  . Then a random subsample composed of a number of stars equal to the observed one was extracted, and the resulting width was computed. The 68.27th percentile of the distribution of simulated measurements was taken as the standard error of the observed width.
The procedure described so far has been applied to measure the AGB and RGB widths of the other clusters. Since the number of detected AGB stars varies from one cluster to another, as does the covered F814W magnitude interval, the number of adopted bins has been changed accordingly from a minimum of 2 to a maximum of 3. The AGB members of NGC 6304 are oddly distributed in magnitude, with the majority of them spanning a very narrow interval. For this reason, it has not been possible to get a reliable estimate of their pseudo-color extension, and the cluster has not been included in the analysis described in the forthcoming section.
Photometric errors also affect the observed pseudo-color spread by introducing a spurious contribution to the intrinsic width of the cluster AGB and RGB stars. To estimate this additional spread we took advantage of the photometric errors previously determined, to simulate an artificial pseudo-color distribution and measure the corresponding width, with the same procedure used for the observations. The simulated width values have been subtracted in quadrature from the corresponding observed width values to obtain the intrinsic widths  ,
,  ,
,  , and
, and  . We report the AGB and RGB intrinsic widths together with the corresponding errors in Columns 4–7 of Table 1 for the pseudo-colors CF275W,F336W,F438W and CF275W,F336W,F438W.
The listed  and
and  values indicate that the intrinsic color spread of AGB stars in all clusters with more than nine AGB members is larger than that expected from photometric errors alone. This finding, based on the largest database of GCs analyzed so far, provides a clear indication that the AGB sequences of the 35 analyzed GCs host MPs.
3. Impact of Light Elements on the Colors of AGB Stars
To qualitatively investigate the typical effects of changing the abundances of He, C, N, and O on the colors and magnitudes of AGB stars, we combined isochrones and synthetic spectra of AGB stars with appropriate chemical compositions. We used the evolutionary code ATON 2.0 (Ventura et al. 1998; Mazzitelli et al. 1999; Ventura et al. 2009) to calculate 12 Gyr old isochrones with [Fe/H] = −1.5 and [α/Fe] = 0.4 but different RGB mass loss, helium content, and C, N, and O abundance (see D’Antona et al. 2002; Tailo et al. 2019b, 2020, for details).
We first investigated the effect of helium and mass-loss variations on the AGB stars. We calculated an isochrone with pristine helium content (Y = 0.25), [C/Fe] = 0.0, [N/Fe] = 0.0, [O/Fe] = 0.4, and an RGB mass loss μ = 0.30M⊙. Moreover, we derived two helium-enhanced isochrones with Y = 0.28 with the same C, N, and O content as above and different mass losses of μ = 0.30M⊙ and μ = 0.45M⊙. Finally, we computed three isochrones with Y = 0.28, [C/Fe] = −0.5, [N/Fe] = 1.21, [O/Fe] = −0.1, and μ = 0.30M⊙, 0.45M⊙, 0.60M⊙.
To account for the effect of C, N, and O variations on the studied isochrones, we extended the procedure by Milone et al. (2012b, 2018) to the AGB. We identified five points along each isochrone with [C/Fe] = 0, [N/Fe] = 0, and [O/Fe] = 0.4 and extracted their Teff and gravity (g). We used the ATLAS12 and SYNTHE computer programs (e.g., Castelli 2005; Kurucz 2005; Sbordone et al. 2007, 2011) to calculate a spectrum with [C/Fe] = 0.0, [N/Fe] = 0.0, and [O/Fe] = 0.4 (reference spectrum) and a spectrum with enhanced N [N/Fe] = 1.21 and depleted C and O ([C/Fe] = −0.5 and [O/Fe] = −0.1). All spectra were computed over the wavelength interval between 2000 and 10000 Å and were convoluted with the throughput of the F275W, F336W, and F438W WFC3/UVIS filters and the F606W and F814W ACS/WFC filters used in this paper.
As an example, the uppermost panel of Figure 13 compares the spectra of two AGB stars with Y = 0.25, μ = 0.30M⊙, Teff = 4875 K, and  . The red spectrum is representative of a 1G star and has [C/Fe] = 0.0, [N/Fe] = 0.0, and [O/Fe] = 0.4, whereas the C, N, and O content of the blue spectrum resembles that of 2G stars ([C/Fe] = −0.5, [N/Fe] = 1.21, and [O/Fe] =−0.1). We calculated the magnitude difference between each point of the two spectra as −2.5 times the logarithm of their flux ratio and plotted this quantity as a function of the wavelength. For comparison, we overplotted the transmission curves of the five filters used in this paper. Clearly, the 2G spectrum provides F336W magnitudes fainter than the 1G ones, mostly due to the NH band around 3600 Å. The 2G stars also exhibit brighter F275W and F438W magnitudes, as a consequence of the strength of the OH and CH molecular bands, respectively. Hence, C, N, and O variations in the spectra of AGB stars show a qualitative behavior similar to that observed in RGB stars (e.g., Milone et al. 2012b).
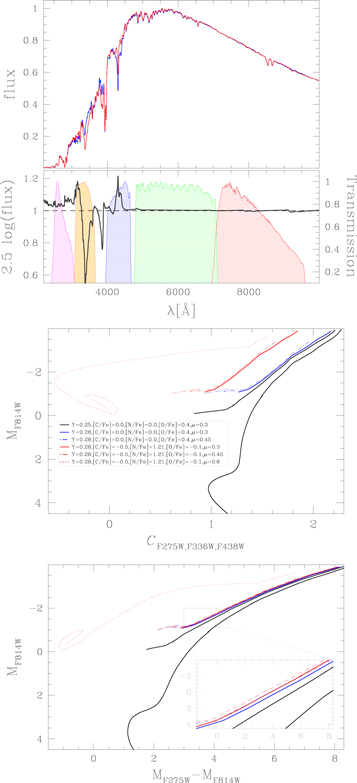
Figure 13. Upper panels: comparison between the spectra of AGB stars with the same atmospheric parameters but with chemical composition typical of 1G (red spectrum) and 2G stars (blue spectrum). The magnitude difference between the two spectra is plotted as a function of the wavelength at the bottom, where we also show the normalized transmission curves of the F275W (magenta), F336W (orange), F438W (blue), F606W (green), and F814W (red) filters used in this paper. Middle and lower panels: isochrones of a 13 Gyr old stellar population with [Fe/H] = −1.5 and [α/Fe] = 0.4 (black isochrone) in the MF814W vs. CF275W,F336W,F438W and MF814W vs. MF275W − MF814W CMDs. The colored isochrones correspond to AGB stars with different chemical composition and mass loss, as reported in the middle panel.
Download figure:
Standard image High-resolution imageThe synthetic spectra were convoluted with the throughput of the five filters used in this paper to derive the corresponding magnitudes. The magnitude differences between the comparison and reference spectra were added to the corresponding magnitudes of the isochrones with 1G-like chemical composition to derive the corresponding isochrones enhanced in N and depleted in C and O.
4. Comparison between AGB and RGB Widths
The photometric width as the standard measurement of the amount of internal chemical variations gives us the ability to compare the properties of MPs across the entire parameter space spanned by GCs. In this regard, recent works have demonstrated that a significant correlation exists between the spread of the RGB in the indices CF275W,F336W,F438W and CF336W,F438W,F814W and the cluster’s metallicity and mass (Milone et al. 2017; Lagioia et al. 2019a). For this reason we decided to study the relation between the AGB and RGB widths.
In the top panel of Figure 14, we plot  versus
  of the 35 clusters, listed in Table 1, for which the measurement of the relative quantities is available. In the diagram, each point has been color-coded according to the corresponding cluster’s metallicity [Fe/H] (Harris 1996, 2010 update), mapped to the color scale reported in the legend. We see that the two represented quantities follow, on average, a positive correlation. In order to provide a reference for the comparison, we overplotted three lines representing the identity relation WAGB = WRGB (dashed line) and the relations WAGB = 1.5WRGB and WAGB = 0.5WRGB (top and bottom dotted lines). We observe that the majority of GCs (27 out of 35 GCs) have AGB widths smaller than the RGB width and that among them, seven GCs have WAGB < 0.5WRGB, with the remarkable cases of NGC 2419, NGC 5139 (ω Cen), and NGC 6752, the three GCs with the lowest AGB/RGB width ratios. On the other hand, NGC 6341 and NGC 5927 are the only two clusters lying above the WAGB = 0.5WRGB line. Their relatively large error bars, however, do not allow us to draw strong conclusions. The color distribution seems to suggest the presence of a mild monotonic trend between the AGB intrinsic width and metallicity, with the most metal-rich clusters having on average larger width values.
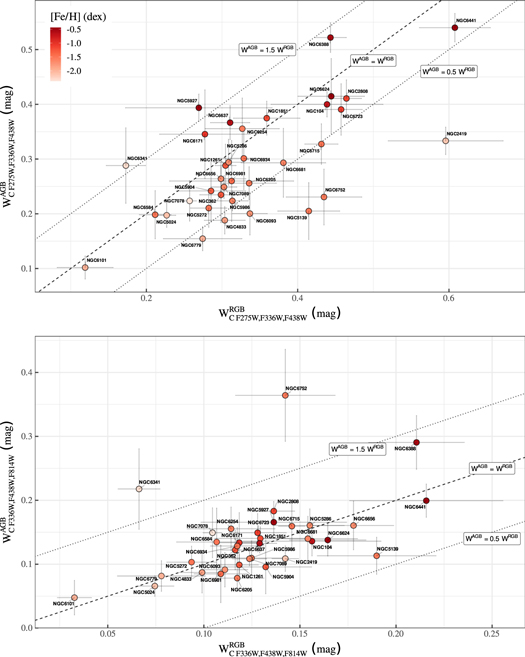
Figure 14. Top:  vs.
vs.  of the 35 GCs in Table 1. The color of each point maps the cluster’s metallicity, according to the scale reported in the legend. Bottom:
  vs.
vs.  of the same clusters. The reference dashed and dotted lines overplotted in each panel represent the relations indicated by the corresponding labels.
Download figure:
Standard image High-resolution imageThe bottom panel displays a scatter plot of  versus
  . As before, we overplotted the same three reference lines. We observe that all the clusters lie within the region defined by the WAGB = 1.5WRGB and WAGB = 0.5WRGB lines, with the clusters quite uniformly distributed above and below the identity relation line. Only two clusters, namely NGC 6341 and NGC 6752, have AGB/RGB width ratios higher than 1.5. While the first cluster shows a behavior similar to that observed in the previous case, the behavior of NGC 6752 is reversed. However, we highlight the fact that the AGB width estimate of this cluster has been derived from a relatively low number of stars (11), and as a consequence, it is poorly constrained, as also indicated by its large error bars. Therefore, again, no firm conclusion can be achieved about these two GCs. We finally note the absence of any trend with metallicity in this color combination.
The relation between AGB and RGB width visible in both diagrams clearly indicates that none of the observed clusters have a monopopulated AGB sequence. The trend visible in the top panel shows that, on average, the AGB width is smaller than the RGB width. In the hypothesis that in each cluster all the stellar populations in the RGB evolve to the AGB, we would expect to observe AGB widths comparable with or larger than those of the corresponding RGB stars. The displayed trend instead indicates that the AGB width is on average smaller than the RGB width. This finding clearly suggests that in the majority of clusters a significant fraction of 2G stars do not evolve to the AGB, as predicted by the AGB manqué scenario. Our finding, based on a large sample of GCs, provides robust evidence of the existence of this phenomenon.
We emphasize that the displayed trend may include some spurious scatter due to the specific evolutionary conditions of each cluster: mass loss has, indeed, an important effect on the color spread of AGB stars, as seen in the previous section. This implies that a precise evaluation of the chemical variations corresponding to every AGB width measurement can be obtained through comparison between observations and theoretical models suitably tailored to the specific properties of each analyzed cluster. However, a one-to-one comparison between the AGB and RGB widths of each cluster is beyond the purpose of the present analysis.
5. Chromosome Maps of AGB Stars
The analysis of the AGB width presented in the previous section provides a strong indication about the presence of MPs along the AGB of the analyzed GCs as well as of a partial depletion of MPs due to the evolution of the most chemically enriched stars as AGB manqué. To further investigate this phenomenon, we exploited the ChM of AGB stars. The construction of the ChM of the GCs analyzed in the present work, shown in Figure 15 for the template cluster NGC 2808, is based on the method introduced by Milone et al. (2015a) and extended to the AGB by Marino et al. (2017). In the figure, panel (a) displays a portion of the mF814W versus CF275W,F336W,F438W pseudo-CMD of the cluster zoomed in on the AGB stars. AGB stars are represented as red points, while all other visible stars, mainly composed of bright RGB stars, are represented as light-gray points. As described in Section 2.4, we excluded the brightest AGB cluster stars, which are shown as light-red points. Long-dashed horizontal lines delimit the selected luminosity interval. The left and right dashed black curves represent, respectively, the 4th and 96th percentiles of the pseudo-color distribution of the AGB stars. They have been obtained by dividing the entire luminosity interval into four bins and then computing, for each bin, the color corresponding to the 4th and 96th percentiles of the color distribution. We then applied a boxcar-average smoothing to the observed distribution points and finally fit the resulting pseudo-colors by a cubic spline along the central magnitude of the bins. We then performed a double normalization by subtracting from the pseudo-color of each star the corresponding value along the 96th-percentile fit curve and dividing the result by the distance between the points of the 4th and 96th fit curves at the same magnitude (see Equations (1) and (2) in Milone et al. 2017). The ratio has been finally multiplied by the factor  , corresponding to the intrinsic width of the AGB stars. This quantity is defined as the observed distance between the fit curves at a reference luminosity equal to 5 mag brighter than the main-sequence turnoff in the F814W band minus the contribution due to the photometric error, as described in the previous section.
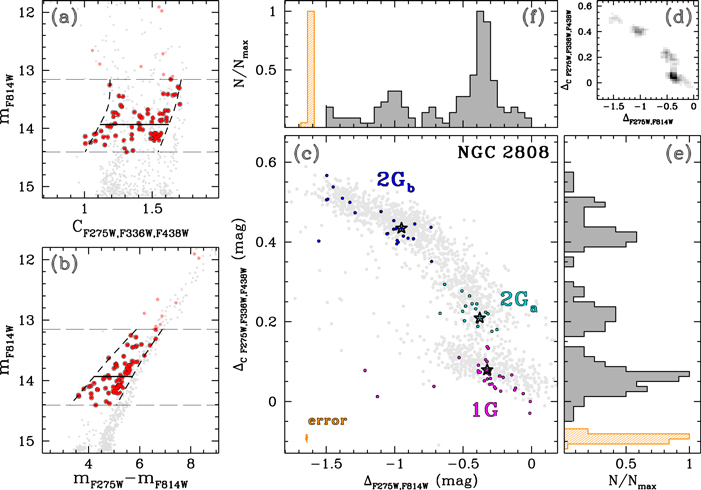
Figure 15. ChM of NGC 2808 AGB stars. Panel (a): mF814W vs. CF275W,F336W,F438W CMD of the brightest cluster stars. AGB stars are represented as red points. AGB members excluded from the analysis are color-coded in light red. The left and right dashed black curves represent, respectively, the 4th and 96th percentiles of the pseudo-color distribution of the AGB stars in the selected magnitude interval, delimited by the two long-dashed horizontal lines. The horizontal solid black line outlines the 4th–96th pseudo-color width of the AGB stars. Panel (b): same as panel (a) but in the mF814W vs. mF275W − mF814W CMD. Panel (c): ChM of the cluster AGB stars. The labels mark the different populations of AGB stars with the corresponding colors. Black star symbols identify the spectroscopic targets by Marino et al. (2017). Background gray points mark the scaled-up ChM of the cluster RGB stars (Milone et al. 2017; see text for details). Orange points mark the ChM of the photometric errors. Panel (d): density map diagram of the cluster AGB ChM. Panels (e), (f): histogram distribution of the ChM along the vertical and horizontal axes, respectively. The orange-shaded histogram corresponds to the histogram distribution of the ChM of the photometric error.
Download figure:
Standard image High-resolution imageThe luminosity of the main-sequence turnoff has been determined by applying the naive estimator method (Silverman 1986). This procedure consists in subdividing a preselected F814W magnitude range centered on the turnoff region of the CMD into a number of magnitude bins. For each bin the median color and magnitude of stars are computed. The same algorithm is applied in sequence by shifting the first bin magnitude by a fraction of the bin width. The magnitude and color of all median points are then boxcar-average smoothed. Finally the bluest color of the interpolating function is taken as the  value. We found
  mag. The result of the double normalization is a new quantity called ΔC F275W,F336W,F438W. The same procedure has been applied to the mF814W versus mF275W − mF814W CMD displayed in panel (b). We found in this case
  mag and obtained the new quantity ΔF275W,F814W.
Panel (c) displays the ChM, namely the ΔC F275W,F336W,F438W versus ΔF275W,F814W diagram, of the AGB stars of NGC 2808. A glance at the distribution of the stars immediately shows that in this cluster, the AGB stars are not evenly distributed but rather clustered in at least four distinct groups (see Marino et al. 2017 for comparison). In order to understand if the observed scatter can be accounted for by the photometric error, we derived the ChM expected for a monopopulated cluster. In this case the scatter is mostly due to the observational errors. The center of the resulting distribution has been arbitrarily shifted at coordinates (ΔF275W,F814W, ΔC F275W,F336W,F438W) = ∼(−1.65, −0.85). It appears as an ellipse flattened along the horizontal direction, with a major semiaxis of ≈0.025 mag. We see that the vertical extension of the AGB ChM is ∼0.1 mag, therefore about four times as large as the error distribution.
The density diagram plotted in panel (d) further confirms the presence of discrete stellar populations. It shows indeed two main groups of stars at coordinates ≈ (−0.30, 0.15) and ≈ (−1.00, 0.15) and two less populated groups at ≈ (−0.40, 0.25) and ≈ (−1.40, 0.30). With the aim of properly assigning a membership to each star in the various groups, we built the histogram distribution of AGB stars along the y-axis and x-axis. The results are shown in panels (e) and (f), respectively. Each histogram has been obtained by splitting the horizontal and vertical intervals in bins of 0.10 mag and computing the number of clusters falling in each bin at steps equal to half the bin width. This choice mitigates the arbitrary decision of a given bin width. In the histogram of panel (e), we can recognize three distinct sections, centered at ΔC F275W,F336W,F438W = ≈0.06, 0.21, 0.40 mag. The histogram of the last section shows a secondary split at ≈0.38 mag, in agreement with the density map in panel (d). The histogram in panel (f) shows two main peaks at ΔF275W,F814W = ≈–0.30 mag and ≈–0.95 mag. Therefore, we used the vertical histogram distribution to subdivide the ChM into three groups, which we named 1G (magenta points), 2Ga (azure points), and 2Gb (blue points). The nomenclature follows the subdivision adopted by Marino et al. (2017). For the sake of clarity, we used a different color code for the three groups of stars. We finally cross-matched the three AGB spectroscopic targets by Marino et al. (2017) and marked them with a black star symbol in the ChM of panel (c). We see that these stars, which have different O and Na abundances, belong to the different groups identified in the AGB ChM, thus providing definitive confirmation that 1G, 2Ga, and 2Gb correspond to distinct stellar populations with different light-element abundances.
A detailed interpretation of the MP composition of the cluster AGB stars can be obtained by comparing the present ChM with that obtained from the analysis of RGB stars (Milone et al. 2017). Since ChMs are built from the measurement of the spread of stars in specific color combinations, such a comparison is ultimately connected to that of the widths. However, as already mentioned before, this implies a precise evaluation of the factors affecting the evolutionary path of post-HB stars, which is not the purpose of the present analysis. Notwithstanding, we decided to perform a crude comparison by assuming that the effect of the presence of 1G and 2G stars in the extension of the ChM of AGB and RGB stars is comparable. Therefore, we decided to scale up the width of the RGB stars in mF275W − mF814W and CF275W,F336W,F438W (see Milone et al. 2017, Table 2) to that of the AGB stars derived in this work. The scaled RGB ChM is represented by the gray points plotted on background in panel (c).
Table 2. Number of 1G and 2G AGB Stars Identified in 13 GCs, Fraction of 1G AGB Stars with Respect to the Total, and Corresponding Fraction Obtained from the RGB ChMs
| ID |

|

|

|
 a
a
|
|---|---|---|---|---|
| NGC 362 | 10 | 18 | 0.357 ± 0.107 | 0.279 ± 0.015 |
| NGC 1261 | 9 | 22 | 0.290 ± 0.097 | 0.359 ± 0.016 |
| NGC 1851 | 15 | 23 | 0.395 ± 0.079 | 0.264 ± 0.015 |
| NGC 2808 | 34 | 41 | 0.453 ± 0.053 | 0.232 ± 0.014 |
| NGC 5024 | 12 | 19 | 0.387 ± 0.097 | 0.328 ± 0.020 |
| NGC 5139 | 7 | 23 | 0.233 ± 0.067 | 0.086 ± 0.010 |
| NGC 5286 | 15 | 52 | 0.224 ± 0.045 | 0.342 ± 0.015 |
| NGC 5986 | 11 | 25 | 0.306 ± 0.083 | 0.246 ± 0.012 |
| NGC 6093 | 11 | 23 | 0.324 ± 0.088 | 0.351 ± 0.029 |
| NGC 6388 | 40 | 114 | 0.260 ± 0.032 | 0.245 ± 0.010 |
| NGC 6715 | 29 | 53 | 0.354 ± 0.049 | 0.267 ± 0.012 |
| NGC 7078 | 23 | 10 | 0.697 ± 0.091 | 0.399 ± 0.019 |
| NGC 7089 | 19 | 47 | 0.288 ± 0.061 | 0.224 ± 0.014 |
Note.
a From Milone et al. (2017).Download table as: ASCIITypeset image
Interestingly, we observe that the AGB ChM broadly reproduces the overdensities corresponding to the subpopulations observed in the RGB ChM. In particular we observe a similar elongation between the AGB and RGB 1G populations, with three AGB stars (ΔF275W,F814W ≲ −0.5 mag) attaining ΔC F275W,F336W,F438W values bluer than the blue ΔF275W,F814W tail of the RGB stars. On the other hand, 2Ga and 2Gb AGB stars appear to follow the same trend of subgroups C and D of the 2G RGB population (see Marino et al. 2017). We also notice the presence of a blue ΔF275W,F814W tail in the 2Gb group, which overlaps the location of the extreme helium-enhanced cluster (E) population (δY ≥ 0.1; Milone et al. 2015a). This appears to be in contrast with the predictions of evolutionary models of very helium-rich stars, which must avoid the AGB phase (e.g., Chantereau et al. 2016). Of course, spectroscopic investigation is mandatory to understand whether these AGB stars are the counterparts of RGB and main-sequence stars with extreme helium abundances or if they have intermediate helium content but have experienced severe RGB mass loss.
For reference we also computed the histogram distribution of the ChM of the photometric errors. The corresponding orange-shaded histograms appear to be spread over an interval visibly narrower than the substructures visible in both ChM histogram distributions in panels (e) and (f).
We used the same procedure to build the ChM of all other GCs with NAGB > 25 in our database (see Column 2 of Table 1). The heterogeneous F814W magnitude distribution of the AGB stars of NGC 104 and NGC 6637 in the CMDs used to build their ChM did not allow us to obtain reliable estimates of the AGB widths. For this reason, these two GCs have been excluded from the following analysis.
We ended up with a sample of 14 GCs including NGC 362, NGC 1261, NGC 1851, NGC 2419, NGC 5024, NGC 5139, NGC 5286, NGC 5986, NGC 6093, NGC 6388, NGC 6441, NGC 6715, NGC 7078, and NGC 7089. The ChMs of these GCs, sorted by increasing metallicity, are displayed in Figure 16. In the ChMs of type II GCs we also highlight anomalous AGB stars with the usual red star symbol. As for NGC 2808, in each panel we plot on background the scaled-up ChM of the corresponding cluster RGB stars. In passing we note that we have also derived the ChM of the RGB stars of NGC 2419 for the first time in this paper. For the sake of comparison, the probable 1G and 2G RGB members of each cluster (Milone et al. 2017) have been colored, respectively, light green and magenta, except for NGC 2419 and NGC 6441, for which it is not possible to obtain a straightforward population classification of the RGB stars. In all the type II GCs’ diagrams, anomalous RGB stars are represented as gray points.
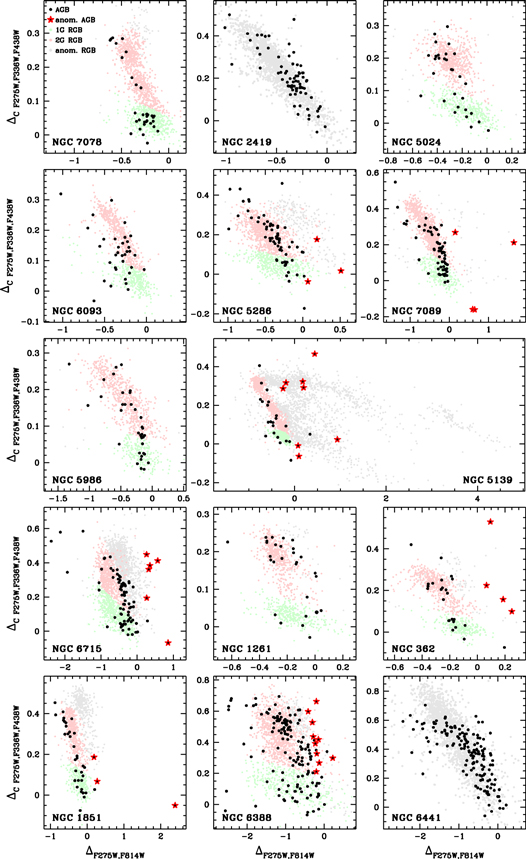
Figure 16. ChM of the AGB stars of NGC 7078, NGC 2419, NGC 5024, NGC 6093, NGC 5286, NGC 7089, NGC 5986, NGC 6715, NGC 1261, NGC 362, NGC 1851, NGC 6388, NGC 6441, and NGC 5139. In each panel, AGB stars are represented as black points, and anomalous AGB stars are marked with a red star symbol; light green, magenta, and gray points indicate, respectively, the 1G, 2G, and anomalous RGB stars in the ChM of the corresponding cluster. Since no univocal classification is available for NGC 6441 and NGC 5139, all the RGB stars of these two clusters are represented as gray points.
Download figure:
Standard image High-resolution imageIn the majority of the GCs, the distribution of AGB stars does not appear clustered in separate groups, except for those in NGC 7078, NGC 1261, NGC 362, and perhaps NGC 6388, where we can recognize a subdivision that resembles that of the overlapped RGB ChM. We also notice that, similar to what is observed in the RGB ChM, anomalous AGB stars in the type II GCs lie on the rightmost part of the diagram.
The ChMs of Figure 16 clearly show that, in each GC, the observed color spread is not compatible with the presence of a single population. Moreover they show that the MPs in the AGB can be associated with the different groups visible in the RGB ChMs.
5.1. Population Ratios
A quantitative estimate of the fraction of stars that skipped the AGB phase can be obtained from a comparison of the ratio between the 2G stars in the AGB and RGB. To identify the different groups of stars in the AGB we decided to adopt the subdivision of the RGB ChM as a guideline for membership definition: all AGB stars falling in the area occupied by the RGB 1G (2G) stars have then been flagged as 1G (2G) in the AGB. In type II GCs, anomalous AGB stars have been considered as part of the 2G sample.
This crude selection allowed us to estimate the population ratio  of the 1G AGB stars of NGC 2808 and 12 out of the 14 GCs displayed in Figure 16. Indeed, as mentioned in the previous section, it is not possible to derive a clear subdivision of the RGB populations of NGC 2419 and NGC 6441 from their ChMs. The resulting 1G fractions,
  , are listed in Table 2. The error of each observed population ratio has been obtained with the same method used for the estimate of the anomalous AGB fraction, described in Section 2.3. We see that the values range from ∼0.2 in NGC 5139 and NGC 5286 to ∼0.7 in NGC 7078. For comparison, we also report the fraction of 1G RGB stars,
  , from Milone et al. (2017; see their Table 2).
In the left panel of Figure 17 we plot  versus
  of the clusters in Table 2. For reference, we also plot a dashed line marking the identity relation. We observe that four GCs, namely NGC 7089, NGC 6388, NGC 1261, and NGC 6093, are consistent, within the errors, with an equal proportion of 1G stars in both evolutionary phases. Four clusters, namely NGC 5139, NGC 2808, NGC 6715, and NGC 7078, definitely exhibit a shortage of 2G AGB stars: all these GCs have, indeed, a very prominent hot HB component, expected to skip the EAGB and evolve instead along the AGB manqué channel. We also see that NGC 5286 has a higher fraction of 1G RGB stars.
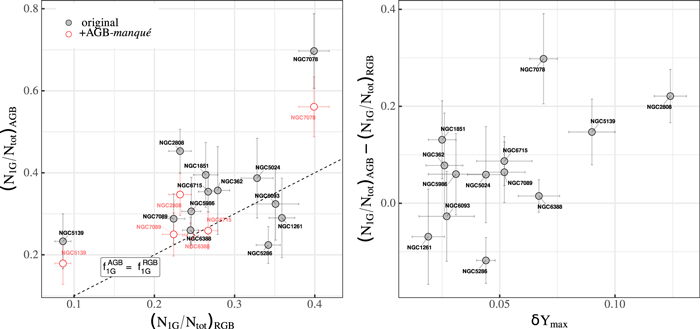
Figure 17. Left: comparison between fractions of 1G AGB stars and 1G RGB stars (from Milone et al. 2017) for the 13 GCs in Table 2. The dashed line marks the relation  . The red points represent the location that NGC 2808, NGC 5139, NGC 6388, NGC 6715, NGC 7078, and NGC 7089 would have if AGB manqué stars were included in the total AGB cluster population (see text for details). Right: difference between fractions of 1G AGB and RGB stars vs. maximum internal helium variation
  .
.
Download figure:
Standard image High-resolution imageIn the right panel of Figure 17 we plot the difference between the fractions of 1G AGB and RGB stars as a function of the maximum internal helium enrichment,  , determined by Milone et al. (2018). We observe a clear direct correlation between the two quantities. The trend suggests that in the GCs with the most helium-enriched 2G component, the fraction of 1G AGB stars is higher. These results represent a further, independent confirmation of the predictions of the AGB manqué scenario.
As a simple experiment, we decided to verify to which extent the differences observed between the 1G AGB and RGB population ratios can be reconciled if the stars that evolved as AGB manqué are included in the 2G population of the AGB. To this aim, we sought AGB manqué candidates in the analyzed GCs by looking at their UV CMDs. An example is shown in Figure 18, which displays the mF336W versus mF275W − mF336W CMD of four GCs with extended HB morphology: NGC 2808, NGC 7078, NGC 6715, and NGC 7089. The AGB members of each cluster have been represented as red points.
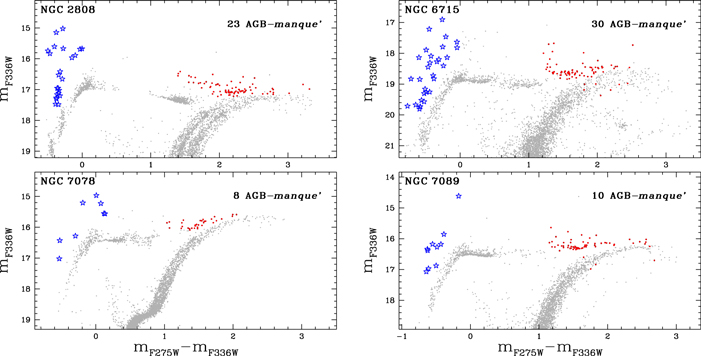
Figure 18. Identification of AGB manqué candidates in four GCs with extended HB. AGB stars are represented as red points, while AGB manqué candidates are marked with a blue star symbol.
Download figure:
Standard image High-resolution imageSince AGB manqué stars have very thin envelopes, their evolution will be entirely spent at Teff higher than ≈25,000 K, approaching luminosities typical of post-EAGB stars (Greggio & Renzini 1990). According to this, we expect to observe AGB manqué stars at the bluest end of the HB, with luminosities comparable to those of EAGB stars. Therefore, we empirically selected as AGB manqué candidates the stars occupying the bluest portion of the CMD, with F336W magnitudes brighter than those of the group of stars at the hottest end of the HB, which are mainly composed of early HB stars (e.g., Tailo et al. 2015). We mark the candidate stars with a blue star symbol. We cannot exclude the possible presence of a few bright blue stragglers in the selected samples. Moreover, they could also potentially include post-EAGB and/or post-AGB stars, although the probability of observing one of these stars in a cluster is very low, because of their very rapid evolution timescale (≲106 yr; D’Cruz et al. 1996; Schiavon et al. 2012). The low incidence of these stars, however, does not affect our conclusions.
We identified 23 AGB manqué candidates in NGC 2808, 9 in NGC 5139, 8 in NGC 6388, 30 in NGC 6715, 8 in NGC 7078, and 10 in NGC 7089. If the AGB manqué candidates represented the total fraction of lost stars of the 2G population of these GCs, we would then observe a smaller fraction of 1G AGB stars, which is ≈0.35 for NGC 2808, ∼0.18 for NGC 5139, ∼0.25 for NGC 6388 and NGC 6715, ∼0.56 for NGC 7078, and ∼0.25 for NGC 7089, and relative errors comparable with the previous ones.
The red points in the left panel of Figure 17 mark the new location in the plot of the previous six GCs. We see that, in this case, NGC 6388, NGC 6715, and NGC 7089 would be consistent, within 1σ, with the same fractions of 1G AGB and RGB stars. We also notice that the fraction of 1G AGB stars in NGC 6715 is slightly higher than the RGB one, and this is probably due to some spurious additional contribution in the AGB manqué count if this cluster, which has strong contamination from the background stars of the Sagittarius Dwarf Spheroidal Galaxy. On the other hand, the new population ratios of NGC 5139, NGC 2808, and NGC 7078 would be consistent with the same fraction of 1G RGB stars only within about 2σ. We notice that since both the AGB manqué and EAGB-phase stars are burning helium in a shell, the shell helium burning should run for the same time; therefore by adding the AGB manqué candidates, the AGB ratio should become equal to the RGB ratio. While the fact that the anomalous population of NGC 5139 spans an extreme interval of metallicity (∼1.5 dex; e.g., Johnson et al. 2009; Marino et al. 2011) could potentially mitigate the observed discrepancy in this cluster, the relative predominance of 1G AGB stars in the other two GCs could be reconciled by assuming a shorter evolutionary timescale of the AGB manqué stars. Indeed, since the major difference between AGB manqué and normal AGB stars lies in their core mass within the hydrogen–helium discontinuity, the shorter timescale of the former would derive from the fact that these stars are the progeny of hot (extreme) HB stars, which experience almost no core-mass increase, as opposed to the precursors of standard AGB stars, namely normal HB stars, which instead undergo a steady increase of the core mass (Greggio & Renzini 1990).
6. AGB Frequency and Multiple Populations
The study of AGB frequency relative to HB stars plays an important role in the context of MPs. In particular, since AGB manqué stars are the progeny of HB stars with mass lower than ∼0.5M⊙ (Moehler et al. 2019; Prabhu et al. 2020), which are associated with the most helium-rich stellar components in a cluster (D’Antona et al. 2002; Tailo et al. 2020), differences in internal helium variations between clusters can affect the AGB/HB ratio. This prediction is quantified by the evolutionary parameter R2 (Caputo et al. 1989), namely the number ratio between AGB and HB stars, which is proportional to the ratio between the lifetimes of stars in these two evolutionary phases. According to theoretical predictions, R2 should not be higher than about 0.2 (Cassisi et al. 2014).
To explore this phenomenon, we took advantage of a large database of homogeneously defined AGB samples in GCs, determined in the present work, and of the independent measurements of maximum internal helium variations,  , obtained by Milone et al. (2018). For each GC, we determined the frequency of AGB stars relative to HB stars, (NAGB/NHB), by counting HB members in the corresponding mF606W versus mF606W − mF814W CMD. The error of each frequency measurement has been estimated with the same method used in Section 2.3. With the purpose of limiting spurious outcomes due to stochastic fluctuations, we decided to limit the following analysis to the 36 GCs in our database with NAGB ≥ 10, for which we report the corresponding frequency values in Table 3.
Table 3. Observed AGB/HB Frequency for Clusters in Our Database with NAGB ≥ 10
| ID | NAGB/NHB |
|---|---|
| NGC 104 | 0.099 ± 0.015 |
| NGC 362 | 0.086 ± 0.014 |
| NGC 1261 | 0.161 ± 0.022 |
| NGC 1851 | 0.126 ± 0.018 |
| NGC 2419 | 0.185 ± 0.017 |
| NGC 2808 | 0.108 ± 0.011 |
| NGC 4833 | 0.117 ± 0.026 |
| NGC 5024 | 0.111 ± 0.019 |
| NGC 5139 | 0.172 ± 0.024 |
| NGC 5272 | 0.089 ± 0.022 |
| NGC 5286 | 0.172 ± 0.017 |
| NGC 5904 | 0.105 ± 0.025 |
| NGC 5927 | 0.071 ± 0.016 |
| NGC 5986 | 0.124 ± 0.017 |
| NGC 6093 | 0.125 ± 0.019 |
| NGC 6101 | 0.151 ± 0.036 |
| NGC 6171 | 0.289 ± 0.052 |
| NGC 6205 | 0.058 ± 0.016 |
| NGC 6254 | 0.132 ± 0.035 |
| NGC 6304 | 0.092 ± 0.023 |
| NGC 6341 | 0.114 ± 0.027 |
| NGC 6388 | 0.175 ± 0.011 |
| NGC 6441 | 0.120 ± 0.009 |
| NGC 6584 | 0.125 ± 0.030 |
| NGC 6624 | 0.106 ± 0.026 |
| NGC 6637 | 0.158 ± 0.024 |
| NGC 6656 | 0.167 ± 0.043 |
| NGC 6681 | 0.119 ± 0.027 |
| NGC 6715 | 0.128 ± 0.012 |
| NGC 6723 | 0.149 ± 0.028 |
| NGC 6752 | 0.092 ± 0.023 |
| NGC 6779 | 0.127 ± 0.032 |
| NGC 6934 | 0.176 ± 0.032 |
| NGC 6981 | 0.179 ± 0.043 |
| NGC 7078 | 0.077 ± 0.013 |
| NGC 7089 | 0.126 ± 0.013 |
Download table as: ASCIITypeset image
In the left panel of Figure 19 we plot (NAGB/NHB) and  for these GCs, where the color, size, and shape of each point map, respectively, the metallicity (Harris 1996, 2010 update), present-day mass (Baumgardt & Hilker 2018), and cluster type (Marino et al. 2019), as indicated in the legend. The diagram shows a scattered distribution, with all the GCs having frequency values smaller than ∼0.2 except NGC 6171, which has (NAGB/NHB) ≲ 0.3. We observe that the bulk of the GCs does not seem to follow any clear trend. It is necessary to consider that the AGB of type II GCs can suffer a significant depletion of anomalous population stars, as seen in Section 2.3. Hence, the resulting shortage of AGB stars in these GCs would significantly affect the observed AGB/HB frequency—in a way that is difficult to predict. This implies that no strong conclusions can be derived for these GCs.
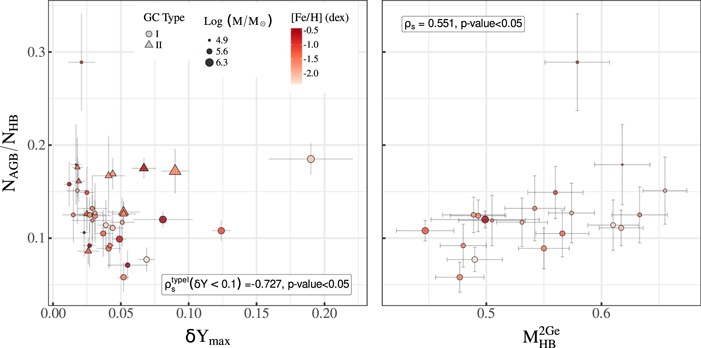
Figure 19. Left: AGB/HB frequency of stars vs. maximum internal helium variation  . The shape, size, and color of each point indicate, respectively, the type, total mass, and metallicity of the corresponding cluster. Right: AGB/HB frequency vs. average mass of the most helium-enriched population of 20 type I GCs in our database.
Download figure:
Standard image High-resolution imageOn the other hand, if we limit our analysis to type I GCs with  , therefore excluding the two massive GCs NGC 2808 and NGC 2419, which are the type I clusters with the highest internal helium variations (
 ; Milone et al. 2018) and among the GCs with the most complex MP patterns (Milone et al. 2015a; Zennaro et al. 2019), the majority of points display an inverse monotonic trend, with lower AGB frequencies attained by clusters with higher internal helium variations. This impression is confirmed by the high value of Spearman’s coefficient (ρs = −0.727) reported in the bottom right corner. Finally we notice that the distribution of points shows no correlation with the cluster metallicity.
Finally, we verified that the analysis of the AGB/RGB frequency shows a similar trend, resulting therefore in the same conclusions. For the sake of convenience we decided to not show the corresponding plot.
Another way of investigating AGB depletion and helium enrichment is through the analysis of the relation between observed frequency and minimum mass along the HB. Gratton et al. (2010) showed that a direct correlation exists between the minimum mass along the HB and the numeric frequency of AGB stars relative to the RGB, with lower frequencies attained by clusters with smaller minimum HB mass. In the right panel of Figure 19 we plot (NAGB/NHB) versus  , where the latter quantity indicates the average mass of HB stars belonging to the most helium-enriched population (recently determined by Tailo et al. 2020), available for 20 type I GCs in our database. The color and size of each point follow the convention adopted in the left panel. With the exception of the outlier NGC 6171, we observe a clear correlation, which confirms the expectation of the AGB manqué scenario of lower AGB frequencies in clusters with smaller minimum mass in the HB (Prabhu et al. 2020). A mild monotonic trend is also indicated by the value of Spearman’s coefficient, ρs = 0.551. In passing we also note that clusters with higher total mass have, on average, smaller minimum HB mass, while no clear trend is visible with metallicity.
The two plots in Figure 19 indicate, in general, a mild correlation between the frequency of AGB stars and internal helium variations in clusters, which are in turn directly related to the mass of their hottest HB stars. The lack of strong evidence of correlation is potentially connected to the fact that the parameters ruling the distribution of HB stars are degenerate. For instance, at a given helium enrichment, we would expect more massive HB stars in slightly younger GCs and thus a smaller proportion of AGB manqué stars. The same conclusion would also be true for clusters of the same age but of different metallicity.
7. Summary and Conclusions
MPs are a common property of Galactic GCs. They have been widely characterized along main-sequence, RGB, and HB stars in large samples of clusters (e.g., Anderson 1997; D’Antona et al. 2005; Piotto et al. 2007; Milone et al. 2017; Lagioia et al. 2019b; Marino et al. 2019; Tailo et al. 2020; Dondoglio et al. 2021). A coherent picture at later evolutionary stages is, however, still missing.
Recent spectroscopic analyses have revealed that a lower fraction of 2G stars populate the AGB of some clusters, like NGC 6752 (Campbell et al. 2013; Lapenna et al. 2016), NGC 6121 (M4; MacLean et al. 2016; Marino et al. 2017), NGC 6205 (M62; Lapenna et al. 2015), and NGC 2808 (Marino et al. 2017). Although no univocal consensus has been achieved on the interpretation of the results, the lack of a more or less significant fraction of 2G stars corresponds to the predictions of the AGB manqué scenario (Greggio & Renzini 1990), according to which the most helium-enriched stars have envelope masses too low in the HB phase, so they do not evolve toward the Hayashi track as normal AGB stars but rather toward higher temperatures until they reach the white-dwarf cooling sequence.
In order to shed new light on this problem we decided to analyze the photometric properties of AGB stars in the largest sample of GCs analyzed so far, composed by 58 objects observed by the HST in the UV and optical bands (Sarajedini et al. 2007; Piotto et al. 2015). Suitable combinations of filters allowed us to disentangle MPs in CMDs and study their properties in statistically significant samples of stars. Through a procedure that exploits CMDs in different color combinations we selected the most probable AGB candidates in every analyzed cluster. Then, we derived their properties through analysis of their photometric features and comparison with theoretical models. Our methods and findings are summarized in the following:
- 1.We investigated AGB stars in type II GCs and identified, for the first time, AGB stars associated with their metal-rich (anomalous) stellar populations. The fraction of anomalous AGB stars with respect to the total number of AGB stars is significantly lower than the corresponding fraction of stars in the anomalous RGB, with NGC 7089 and NGC 362 as possible exceptions.
- 2.We constructed the mF814W versus CF275W,F336W,F438W CMD of the bright stars of 56 GCs with at least one AGB detection. We find that the AGB sequences of at least 48 clusters exhibit larger pseudo-color spread than that expected from photometric errors alone. Hence, they host MPs. In eight clusters, namely NGC 7099, NGC 4590, NGC 5466, NGC 6218, NGC 6397, NGC 6496, NGC 6535, and NGC 6809, there is no evidence of intrinsic CF275W,F336W,F438W broadening among AGB stars with similar luminosities. However, the small number of AGB stars in these clusters prevents us from any conclusion on the presence of MPs among their AGBs. We conclude that in the studied clusters all 2G stars avoid the AGB phase.
- 3.We used synthetic spectra with appropriate chemical composition and theoretical stellar models from the Roma database (Ventura et al. 1998; Mazzitelli et al. 1999) to derive, for the first time, isochrones of 1G and 2G AGB stars. We show that 2G stars define AGB sequences with smaller values of CF275W,F336W,F438W and bluer MF275W − MF814W colors than 1G stars with the same luminosity. The flux difference is mostly due to NH molecular bands that affect the spectral region covered by the F336W filter and the OH and CN molecules enclosed by the F275W and F438W filters, respectively. Since 2G stars are enhanced in N and depleted in C and O, they have fainter F336W and brighter F275W and F438W magnitudes than 1G stars with the same luminosity. Moreover, 2G stars are helium-enhanced with respect to 1G stars; hence they have colors bluer than 1G stars at the same luminosity. In addition to the He, C, N, and O content, the amount of mass loss experienced during the RGB phase affects the colors of AGB stars. In particular, an increase in mass loss can dramatically shift to the blue end of the AGB sequences.
- 4.We measured the intrinsic width of AGB stars in the pseudo-colors CF275W,F336W,F438W for 35 GCs with NAGB ≥ 10 and compared it with the corresponding quantity obtained from RGB stars. We observe that the intrinsic width of AGB stars is on average smaller than that of RGB stars. This finding suggests that a substantial part of the RGB stars in these GCs do not evolve to the AGB.
- 5.We constructed a ChM for 15 GCs with well-populated AGB sequences and identified their 1G and 2G AGB stars: this allowed us to derive the fraction of 1G stars along the AGB. On average, AGB stars host fractions of 1G stars larger than those in the RGB, and NGC 2808, NGC 5139, NGC 6715, and NGC 7078 are the clusters with the most pronounced differences. This result is consistent with the AGB manqué scenario, where some 2G stars skip the AGB phase (Campbell et al. 2013) due to their typical mass being lower than that of 1G stars. Indeed, 2G stars are enhanced in helium (Lagioia et al. 2018; Milone et al. 2018) and lose more mass in the RGB phase compared to 1G stars (Tailo et al. 2019a, 2020). This scenario is corroborated by evidence from this paper and from Gratton et al. (2010) that the frequency of AGB/HB stars of type I GCs correlates with the minimum mass of HB stars; the AGB frequency of type I GCs with
 also anticorrelates with the maximum helium abundance of 2G stars.

This work has received funding from the European Research Council under the European Union’s Horizon 2020 research innovation program (grant agreement ERC-StG 2016, No. 716082, “GALFOR,” PI: A. Milone). A.P.M., M.T., and E.D. were supported by MIUR under PRIN program 2017Z2HSMF (PI: R. Bedin). M.T., A.P.M. and E.D. acknowledge support from MIUR through the FARE project R164RM93XW SEMPLICE (PI: A. Milone).
Facilities: HST (ACS - , WFC3). -