Abstract
Recently, slowly cooling white dwarfs (WDs) are a new class of WD that have been identified in two globular clusters (namely M13 and NGC 6752), showing a horizontal branch (HB) morphology with an extended blue tail. The cooling rate of these WDs is reduced by stable thermonuclear hydrogen burning in their residual envelope, and they are thought to originate by stars that populate the blue tail of the HB and then skip the asymptotic giant branch phase. Consistently, no evidence of such kind of WDs has been found in M3, a similar cluster with no blue extension of the HB. To further explore this phenomenon, we took advantage of deep photometric data acquired with the Hubble Space Telescope in the near-ultraviolet and investigated the bright portion of the WD cooling sequence in M5, another Galactic globular cluster with HB morphology similar to M3. The normalized WD luminosity function derived in M5 was found to be impressively similar to that observed in M3, in agreement with the fact that the stellar mass distribution along the HB of these two systems is almost identical. The comparison with theoretical predictions is consistent with the fact that the cooling sequence in this cluster is populated by canonical (fast cooling) WDs. Thus, the results presented in this paper provide further support to the scenario proposing a direct causal connection between the slow cooling WD phenomenon and the horizontal branch morphology of the host stellar cluster.
Original content from this work may be used under the terms of the Creative Commons Attribution 4.0 licence. Any further distribution of this work must maintain attribution to the author(s) and the title of the work, journal citation and DOI.
1. Introduction
White dwarfs (WDs) constitute the final evolutionary stage of stars with low and intermediate initial mass (below 8M⊙, possibly up to 11M⊙; e.g., Córsico et al. 2019). This mass range includes the overwhelming majority of stars in our universe (∼98%; e.g., Winget & Kepler 2008; Woosley & Heger 2015). As the ending point of stellar evolution, WDs gather tremendous information about the evolutionary history of their progenitors. In addition, they are characterized by relatively simple structures, thus providing the ideal laboratory for studying the behavior of matter in extreme high-density physical conditions (Garcia-Berro et al. 1995).
WDs are thought to be the remnant core of stars that have terminated their thermonuclear activity and have released their outer layers. Because of the lack of energy production, the evolution of WDs is generally described as a cooling process. Thus, WD aging is essentially characterized by a progressive cooling and fading at roughly fixed radius as a function of time (the so-called cooling time). This provides a natural link between WD luminosities and their cooling ages, which is often adopted as a cosmic chronometer to measure the age of stellar populations in the galaxy (e.g., the Galactic disk, and globular and open clusters; see e.g., Hansen et al. 2007; Bedin et al. 2010, 2023; Bellini et al. 2010; Kilic et al. 2017).
However, recent theoretical models (Althaus et al. 2015) have shown that small extra amounts of residual hydrogen (a few 10−4 M⊙) that are left on the WD surface from the previous evolutionary stages is sufficient to allow quiescent thermonuclear burning. This process provides a non-negligible source of energy that can significantly decrease the cooling rate with respect to that of normal WDs, especially in the regime of low-mass (about <0.56M⊙) WDs and low-metallicity (Z < 0.001) progenitors (Renedo et al. 2010; Miller Bertolami et al. 2013), thus generating a new class of WDs that we have named slowly cooling WDs. The increase in the cooling timescale is expected to enhance the number of WDs in the brightest and intermediate portions of the cooling sequence, with an observable modification of the shape of the WD luminosity function (LF). This implies that the effect of possible residual hydrogen burning cannot be neglected when reading the cooling time (hence, the WD age) along the cooling sequences, especially in Galactic globular clusters (GGCs), which are the oldest and most metal-poor stellar populations in the Milky Way (thus hosting populations of low-mass WDs produced by low-metallicity progenitors).
The first observational evidence of the existence of slowly cooling WDs was presented by Chen et al. (2021), who compared the WD LFs of the twin clusters M13 and M3, discovering a significant WD excess in the former. These two clusters share many physical properties (e.g., metallicity, age, central density, etc.; Harris 1996; Dotter et al. 2010), with the notable exception of the horizontal branch (HB) morphology, which is completely different in the two systems (Ferraro et al. 1997a; Dalessandro et al. 2013a). The HB morphology in M13 is characterized by an extended blue tail (see also Ferraro et al. 1998), while no blue extension is present in the HB of M3 (Buonanno et al. 1994; Ferraro et al. 1997b). Chen et al. (2021) confirmed that the HB morphologies are related to the presence or lack thereof of slowly cooling WDs because they correspond to quite different mass distributions: stellar masses increase from the blue edge to the red edge of the HB, which implies that most of the HB stars in M13 are less massive than that in M3. Meanwhile, the stellar mass in the HB phase is the key parameter that sets the subsequent evolution. Theoretical HB models demonstrate that extremely low-mass HB stars (less massive than 0.56M⊙ at intermediate metallicities) skip the thermal pulses and associated third dredge-up, which is a mixing process that occurs during the Asymptotic Giant Branch (AGB), and is the evolutionary phase immediately following the HB and preceding the WD stage. This process efficiently mixes the material present in the envelope of AGB stars with hotter inner layers, bringing hydrogen into deeper regions where it is burned. Consequently, a star experiencing the third dredge-up reaches the final WD stage with almost no residual hydrogen envelope and no efficient hydrogen burning. Conversely, HB stars less massive than 0.56M⊙ skip this critical event and reach the WD stage with a residual hydrogen envelope that is thick enough to allow stable thermonuclear burning, which provides the WD with an extra-energy production that delays its cooling (Althaus et al. 2015). Thus, while all the (red) HB stars in M3 are more massive than this value, and are therefore expected to experience the third dredge-up in the AGB phase, the majority of the stars in M13 populating the HB blue tail (hence, less massive than the mass threshold) are predicted to skip this event and thus produce slowly cooling WDs. This scenario has been fully confirmed by Chen et al. (2022) in the case of NGC 6752, which is a GGC with almost the same metallicity and the same (extended blue) HB morphology of M13. Therefore, the results obtained in M13 and NGC 6752 provided firm evidence for the existence of slowly cooling WDs and solid empirical support to the predicted physical origin of these objects (i.e., the fact that their progenitors skip the third dredge-up). This also consolidated the connection between the occurrence of this phenomenon and the HB morphology: significant populations of slowly cooling WDs are expected in GCs with a HB displaying a well-populated and extended blue tail.
To further verify the scenario in the case of a cluster with no HB blue extension, in this paper we use deep near-ultraviolet photometry secured with the HST to investigate the LF of the brightest portion of the WD cooling sequence in M5. This is a luminous (MV = −8.8) and well studied GGC (e.g., Lanzoni et al. 2007, 2016, 2018; Ferraro et al. 2012; Miocchi et al. 2013; Pallanca et al. 2014; Piotto et al. 2015; Nardiello et al. 2018), which is relatively close to the Sun (at a distance of ∼7.5 kpc). The HB morphology of M5 is similar to that of M3, with no blue-tail extension, characterized by a rich population of RR Lyrae (Arellano Ferro et al. 2016a, 2016b). According to the scenario discussed earlier, this should imply that most of the HB stars in M5 experience the third dredge-up and end their evolution as canonical WDs.
This paper is organized as follows. In Section 2, we describe the data reduction and artificial star tests. The WD sample selection and analysis are presented in Section 3. Finally, the discussion and conclusions of the work are provided in the Section 4.
2. Data Reduction
In this work, we use the deep and high-resolution photometric data in the near-ultraviolet band, obtained with the HST/WFC3 camera in the UVIS channel. The data set has been acquired as a part of the HST Large Legacy Treasury Program (GO-13297, PI: Piotto; see Piotto et al. 2015) and is composed of four frames (two with exposure time  s, two with
  ) in the F275W filter and four frames (each with
  s) in the F336W filter.
For the photometric analysis, we used UVIS exposures with _flc extension, which are calibrated and corrected for Charge Transfer Efficiency (CTE). After the pre-reduction procedure, which includes the extraction of the science images (chip1 and chip2) from the raw fits files and the application of the Pixel Area Map correction, we performed a Point-Spread Function (PSF) fitting following the so-called UV-route to derive the star magnitudes. This is a photometric procedure that is specifically optimized for the detection of blue and hot objects, such as hot HB stars, blue straggler stars, and WDs in crowded fields (see, e.g., Ferraro et al. 1997a, 1997b, 2001, 2003, 2018; Lanzoni et al. 2007; Dalessandro et al. 2013a, 2013b; Raso et al. 2017). In particular, Raso et al. (2017) discussed the net advantages of using this UV-Guided search of the sources with respect to the standard optical-driven selection to derive complete samples of blue and faint objects in high-density old clusters, where the optical emission is primarily dominated by a large population of bright and cool (3500–5000 K) giants. Specifically, in this paper we followed the approach described in Cadelano et al. (2019) and Cadelano et al. (2020a, but see also Cadelano et al. 2017a, 2022a; Raso et al. 2017, 2020; Chen et al. 2021, 2022). The main idea of this procedure is to created a master list of sources that are detected in the near-ultraviolet images and then force the detection in images acquired at longer wavelengths (e.g., blue and optical bands).
In brief, we first selected about ∼250 bright and unsaturated stars that are uniformly distributed in the entire field of view to properly model the PSF function for each exposure. We then applied the resulting model to all of the sources detected above 5σ from the background and combined the stars appearing in at least two images, thus building the master list. Second, we performed the forced photometry with DAOPHOT/ALLFRAME (Stetson 1994) on all of the images at positions corresponding to the stars in the master list, even in a location where the signal is below 5σ. Finally, the magnitudes of all of the stars in each filter were homogenized, and the magnitudes and corresponding errors were calculated from their weighted mean and standard deviation.
After correcting the instrumental positions for geometric distortions, we calibrated the instrumental magnitudes to the VEGMAG system and aligned the instrumental coordinates to the International Celestial Reference System by cross-correlation with the reference catalog of the HST UV Globular Cluster Survey (Piotto et al. 2015; Nardiello et al. 2018). We also executed an additional visual inspection to clean up the sample from fake sources caused by saturation of extremely bright stars. As a result of the data reduction process, a final catalog listing almost 40,000 stars has been finally obtained.
2.1. Color–Magnitude Diagram
The color–magnitude diagram (CMD) that we obtained for M5 is presented in Figure 1. All of the main evolutionary sequences are clearly defined and they appear negligibly affected by contamination from field stars or background extra-Galactic sources. The CMD extends from mF275W = 15 to mF275W ≃ 25, spanning more than 10 mag, and provides a panoramic over-view of the stellar population hosted in the cluster. As expected, the near-ultraviolet CMD appears significantly different from the classical optical CMD: the luminosity of red giant branch (RGB) stars is significantly suppressed (the RGB-tip is at mF275W ∼ 19), and the same holds for the AGB, which is clearly distinguishable from the RGB in the color range 1.6 < (mF275W − mF336W) < 3. The luminosity in the F275W band is instead dominated by HB stars, which are clearly visible at (mF275W − mF336W) < 1.2. A well-defined sequence of blue straggler stars (see also Lanzoni et al. 2007) is seen emerging from the main sequence turn-off (MS-TO, at mF275W ∼ 19) and extends up to the HB at mF275W ∼ 16. A copious population of RR Lyrae variables (observed at random phases) is also visible as a sort of stream of stars diagonally crossing the HB at 0.5 < (mF275W − mF336W) < 1. The brightest portion of the WD cooling sequence appears as a well-defined and populated, almost vertical, sequence at (mF275W − mF336W) ∼ −0.8, extending for almost 6 mag from mF275W ∼ 25.5 up to mF275W ∼ 19.
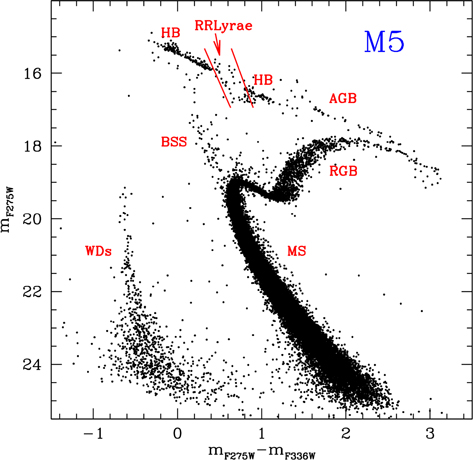
Figure 1. The near-ultraviolet CMD of the 39114 stars detected in M5. The various stellar populations are indicated. The two red lines delimitate the CMD region where most of the RR Lyrae are found.
Download figure:
Standard image High-resolution imageThe overall morphology of the CMD appears to be very similar to that observed in M3. This can be easily appreciated in Figure 2, where the CMD of M3 (from Chen et al. 2021) has been shifted to match the color and magnitude location of the evolutionary sequences of M5. Indeed, apart from the slightly different metal content ([Fe/H]∼ −1.5 and [Fe/H]∼ −1.3 for M3 and M5, respectively; see Harris 1996) that introduces some second-order differences, the evolutionary sequences in the two clusters (M3 and M5) are impressively similar. In particular, the color extension of the HB is fully comparable, with the extremely blue part, at (mF275W − mF336W) < −0.1, being essentially not populated in both cases. For the sake of comparison, we also included the CMD of M13 in the same figure (from Chen et al. 2021, shifted to match the color and magnitude location of the evolutionary sequences of M5), which instead shows a clearly different HB morphology with a pronounced blue-tail population. The impressive similarity of the HB morphologies in M5 and M3 suggests an analogous post-HB evolutionary path for the stars in these two clusters, which is surely different from that expected in M13. Thus, on the basis of the HB morphology, a population of canonical WDs (similar to that found in M3) and no presence of slowly cooling WDs (as those observed in M13) are expected in M5.
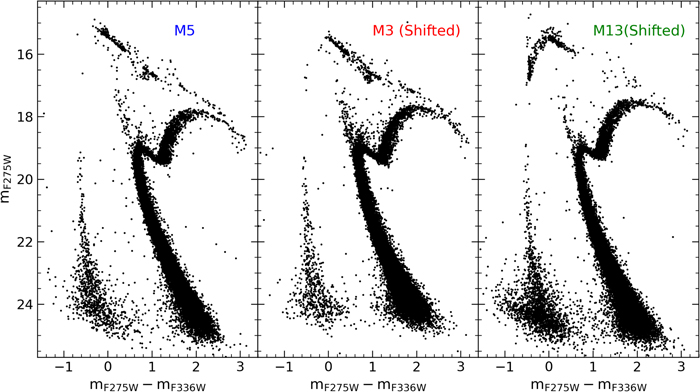
Figure 2. CMD of M5 (left-hand panel) compared to those of M3 (middle panel) and M13 (right-hand panel). CMDs of M3 and M13 (from Chen et al. 2021) have been shifted, respectively, by ΔmF275W = −0.35 and ΔmF275W = +0.20 in magnitude and by Δ(mF275W − mF336W) = +0.13 and Δ(mF275W − mF336W) = +0.07 in color.
Download figure:
Standard image High-resolution image2.2. Artificial Star Tests
A meaningful quantitative study of the properties of the LF of faint objects such as WDs requires, as a mandatory step, the empirical determination of the level of photometric completeness of the WD cooling sequence at different levels of magnitudes and distances from the cluster center. This procedure should provide a first-order estimate of the amount of sources that have been lost during the data reduction process because of their intrinsic faintness and the level of crowding of the surrounding environment. The evaluation of the photometric completeness was performed by means of extensive artificial star experiments. The standard recipe to perform these tests is described in detail in Bellazzini et al. (2002, see also Dalessandro et al. 2015; Cadelano et al. 2020b, 2022b; Chen et al. 2021), thus here we only summarize the main steps of the procedure adopted for M5. As first step, we created a list of artificial stars with an input F275W magnitude sampling the observed extension of the WD cooling sequence. Figure 1 shows that the observed WD cooling sequence in M5 extends from mF275W ≈ 19 to mF275W ≈ 25.5. For each of these stars a corresponding magnitude in the F336W filter was assigned according to the mean ridge line of the cooling sequence in the (mF275W, mF275W − mF336W) CMD. A large number of artificial stars were generated and then added to each real image with DAOPHOT/ADDSTAR software. All of the artificial stars were placed onto the images following a regular grid of 23 × 23 pixels (corresponding to about 15 times the FWHM of the stellar sources). Note that to avoid an artificial increase of the crowding conditions, only one artificial star was arranged in each cell. The entire photometric analysis was then repeated following exactly the same procedure described in Section 2. The procedure was then iterated several times to ensure a sufficiently large sample and, at the end, more than 160,000 artificial stars were simulated in the entire field of view, which covers a region within approximately 90″ from the cluster center.
To quantify the level of photometric completeness, the completeness parameter Φ was determined as the ratio between the number Nr
of artificial stars recovered by the photometric analysis and the number of stars that were actually simulated (number of input stars, Ni
). Of course the value of Φ is expected to be strongly dependent on both crowding (hence, the distance from the cluster center) and luminosity: it commonly decreases in the innermost regions of the clusters (due to the large stellar density) and at faint magnitudes. To properly trace both of these effects, we divided the sample of simulated stars in radial bins at different distances from the cluster center (with steps of 5″) and in F275W magnitudes bins (in steps of 0.5 mag), and for each cell of this grid we counted the number of input and recovered stars, calculating the corresponding value of Φ. The computed value of Φ was then assigned to each WD according to its radial position and magnitude. The size of the adopted magnitude and radial distance steps was set to guarantee reasonable statistics, while maintaining a sufficiently high spatial resolution and sensitivity of the Φ parameter to the stellar luminosity. The uncertainties on the completeness value (σΦ) were computed by propagating the Poisson errors and are typically on the order of 0.05. The radial distances have been computed with respect to the center of gravity quoted in Lanzoni et al. (2007, see also Lanzoni et al. 2010, 2019; Miocchi et al. 2013; Cadelano et al. 2017b for the details on the method adopted to estimate GC centers), which is located at R.A. αJ2000 = 15h 18m 3353, and decl.
 , with a 1σ uncertainty of 0
5 in both of these coordinates. The construction of such a completeness grid allowed us to assign the appropriate Φ value to each observed WD, with given F275W and F336W magnitudes, and located at any distance from the cluster center. The behavior of the completeness parameter as a function of the magnitude is shown in Figure 3 for all of the detected WDs. According to previous works, we limited the analysis of the WD LF to the brightest portion of the cooling sequence (mF275W < 23.5), where the completeness level is larger than 50% at any cluster-centric distance.
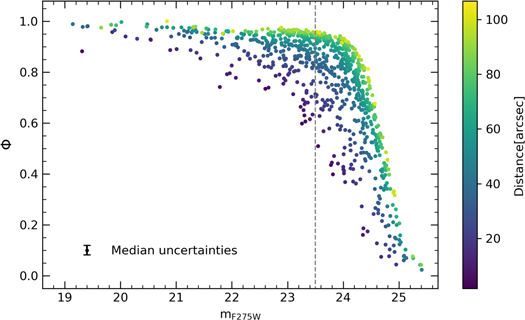
Figure 3. Completeness parameter Φ of the selected WDs as a function of the mF275W magnitude, with the radial distance from the cluster center color-coded as indicated in the colorbar. The median uncertainty on Φ is marked in the panel. All the WDs located on the left of the vertical dashed line have completeness Φ > 0.5.
Download figure:
Standard image High-resolution image3. Analysis
3.1. Sample Selection and WD LF
Figure 4 shows a portion of the CMD of M5 zoomed in the WD region. The carbon-oxygen WD cooling track (Salaris et al. 2010) of a 0.54M⊙ with hydrogen atmosphere is overplotted to the data, which nicely matches the observed cooling sequence (even in its brightest portion). For the sake of comparison, we also overplotted a 12.5 Gyr, α-enhanced isochrone with metal abundance Z = 0.002 and helium mass fraction Y = 0.248 taken from the BaSTI models (Pietrinferni et al. 2006; see also Hidalgo et al. 2018; Pietrinferni et al. 2021), which well reproduces the MS-TO region of the cluster.
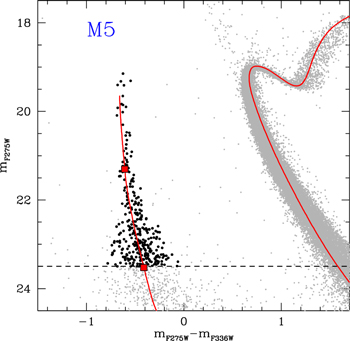
Figure 4. CMD of M5 zoomed in the WD cooling sequence region. The analyzed WDs are marked with black dots and the cut-off magnitude is marked with the horizontal-dashed line located at mF275W = 23.5. The red line is the cooling track of a 0.54M⊙ WD, along which two reference cooling ages (10 and 100 Myr) are marked with red squares. The 12.5 Gyr old isochrone (with Z = 0.002 and helium mass fraction Y = 0.248) from the BaSTI models (Pietrinferni et al. 2006) well reproduces the cluster MS-TO.
Download figure:
Standard image High-resolution imageFor a proper study of the LF, we selected a sample of bona fide WDs by following the same procedure that was already adopted in previous papers (see Chen et al. 2021, 2022): (1) we considered all of the objects located within 3σ from the mean ridge line of the WD cooling sequence, with σ being the photometric error at the corresponding magnitude level, and the mean ridge line essentially corresponding to the 0.54M⊙ WD track; and (2) as discussed earlier, we conservatively retained only WDs with completeness level above 50%, thus limiting the sample to WDs brighter than mF275W = 23.5 mag. This magnitude cut corresponds to a cooling time of ∼100 Myr, which is comparable to the threshold adopted in the case of M3 and M13 by Chen et al. (2022).
Following the adopted selection criteria, we obtained a sample of 311 WDs in M5. Their LF, computed in bins of 0.5 mag, is shown in Figure 5 for both the observed and the completeness-corrected samples (gray-shaded and blue histograms, respectively). It is worth noting that the conservative criteria adopted for the sample selection strongly limit the impact of incompleteness: the global correction for completeness is smaller than 14% (43 stars in total), with the completeness-corrected population of WDs amounting to 354 stars.
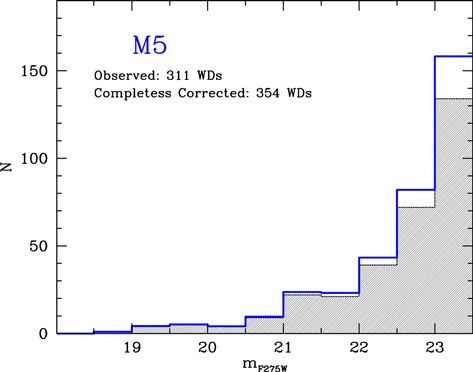
Figure 5. Observed (gray-shaded) and completeness-corrected (blue) LF of the selected WD sample in M5.
Download figure:
Standard image High-resolution image3.2. Comparing WD LFs
We can now compare the completeness-corrected WD LF of M5 with those previously obtained for the twin clusters M3 and M13 (see Chen et al. 2022). Intriguingly, both the limiting magnitude and the total number of WDs selected in M5 are very similar to those of M3. Indeed, this already suggests that the LFs observed in these clusters can be compared directly, with no need for normalization factors. In addition, by adopting the integrated apparent luminosity quoted by Harris (1996), and the distance modulus and reddening values listed in Ferraro et al. (1999, see also Table 1), we found that the integrated absolute magnitudes of the three clusters are quite similar (∼ −8.8; see Table 1), denoting comparable total masses and total numbers of stars. According to this evidence, we then compared the three WD LFs in terms of absolute star counts (with no normalization) as a function of the absolute F275W magnitude (MF275W). Figure 6 shows that the LFs of M3 and M5 appear to be very similar, and they are both clearly different from the LF of M13.
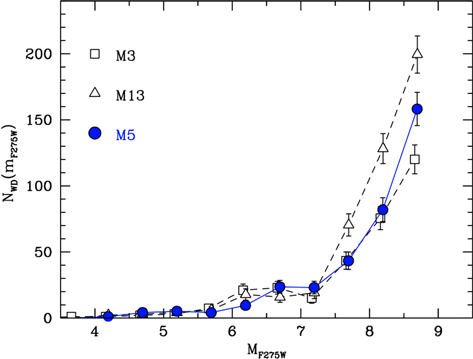
Figure 6. Completeness-corrected WD LF of M5 (blue circles), compared to that of M3 (empty squares) and M13 (empty triangles). The apparent m275W magnitude has been transformed in absolute magnitude by adopting distance modulus and reddening of each cluster (from Ferraro et al. 1999; see also Table 1).
Download figure:
Standard image High-resolution imageTable 1. Photometric and Structural Parameters of M5, M13 and M3
| Cluster | (m − M)0 | E(B − V) | Vt | rc | c | MV | Lsampled |
|---|---|---|---|---|---|---|---|
| M5 | 14.37 | 0.03 | 5.65 | 28″ | 1.66 | −8.81 | 1.67 × 10⁵ L⊙ |
| M3 | 15.03 | 0.01 | 6.19 | 22 | 1.85 | −8.87 | 1.78 × 10⁵ L⊙ |
| M13 | 14.43 | 0.02 | 5.78 | 49 | 1.32 | −8.71 | 1.25 × 10⁵ L⊙ |
Note. Vt is the total integrated V-band magnitude (from Harris 1996); (m − M)0 and E(B − V) are, respectively, the distance modulus and reddening (from Ferraro et al. 1999); MV is the derived absolute magnitude; Lsampled is the luminosity sampled by the observations, obtained from the integration of the best-fit King model to the star density profile of each system (from Miocchi et al. 2013).
Download table as: ASCIITypeset image
To double check this result and for a more rigorous comparison (taking into proper account the slightly different intrinsic richness of each cluster), we then determined the total luminosity sampled by the adopted observations. The HST-WFC3 pointings sampled the innermost ∼90″ from the center of each cluster. However, due to the different intrinsic structures in terms of core radius and concentration (Miocchi et al. 2013; see Table 1), this may correspond to different fractions of the total luminosity. Thus, we estimated the amount of total luminosity sampled at r < 90″ in each system by integrating the corresponding best-fit King model (from Miocchi et al. 2013). The results are listed in the last column of Table 1 and show that the differences are admittedly small (on the order of 10%–15%). However, they go in the direction of making the WD LF of M5 more similar to that of M3 and increase the difference with the LF of M13, as clearly shown by Figure 7, which displays the WD LFs normalized to the sampled luminosities in units of 105 L⊙. The number of WDs per 105 L⊙ sampled luminosity with a cooling time <100 Myr is found to be approximately half (47%–56%) of that counted in M13.
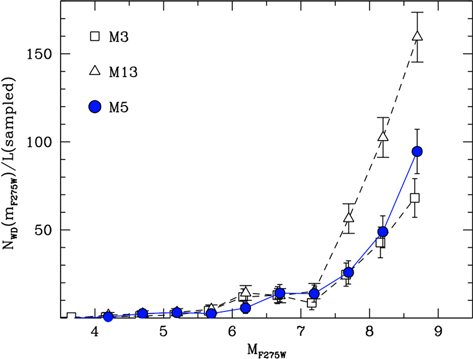
Figure 7. Completeness-corrected WD LFs of M5 (blue circles), M13 (empty triangles), M3 (empty squares) normalized to the sampled luminosity in units of 105 L⊙, as a function of the absolute F275W magnitude.
Download figure:
Standard image High-resolution image4. Discussion and Conclusions
The scenario presented in Chen et al. (2021, see also Chen et al. 2022) suggests the existence of a special class of slowly cooling WDs, whose cooling rate is slowed down by some stable hydrogen burning in a very thin but massive enough (of the order of 10−4 M⊙; Renedo et al. 2010) residual hydrogen-rich outer layer. The observational signature of these objects is an excess of WDs in the brightest portion of the LF, with respect to that observed in clusters where they are not present, and to predictions from models of canonical (i.e., fast cooling, with no hydrogen burning) WDs (e.g., Salaris et al. 2010). This excess was indeed detected in M13 and NGC 6752, but not in M3.
A convincing picture of the physical origin of these objects must take into account that the mass of any residual hydrogen in proto-WDs is regulated by the occurrence (or lack of) of the third dredge-up during the AGB evolutionary phase (Althaus et al. 2015). In fact, during the third dredge-up, convection carries carbon up to the stellar surface, while hydrogen is mixed into inner regions where it is burned. Thus, the occurrence of the AGB third dredge-up is expected to generate proto-WDs with very small (in terms of mass) hydrogen envelopes, where thermonuclear burning cannot take place. Consequently, these stars end up as canonical WDs. Conversely, stars able to skip the third dredge-up reach the WD stage with a residual hydrogen envelope that is thick enough (with masses at least a few times 10−4 M⊙) to allow stable thermonuclear burning, and this process provides the WD with an extra-energy production that delays its cooling—slowly cooling WDs are thus generated. Chen et al. (2021) convincingly demonstrated that the occurrence of this phenomenon is linked to the cluster HB morphology: significant populations of slowly cooling WDs are expected in GCs with well-populated and extended blue HB morphologies. In fact, the presence of an extended HB blue tail indicates the existence of a significant fraction of stars with an envelope mass that is so small that the subsequent AGB thermally pulsing phase (hence, the third dredge-up) cannot occur. Thus, in M13 and NGC 6752 (both having blue-tail HBs), ∼70% of the HB stars are expected to completely or partially skip the AGB, which guarantees the survival of a significant residual hydrogen envelope and the consequent generation of slowly cooling WDs. Conversely, in M3 (where the HB morphology does not display an extended blue tail) essentially all of the HB stars are expected to evolve along the AGB, experience thermal pulses and third dredge-up, and thus produce canonical WDs.
From the analysis presented in this paper, the WD LF that is observed in M5 appears to be similar to that obtained by Chen et al. (2021) in M3. According to the scenario summarized above, the WD cooling sequence of M5 is thus expected to be essentially populated by canonical WDs, whose progenitors all experienced the third dredge-up during the AGB phase. This is fully consistent with the expected mass distribution along the HB in these two clusters, which appears morphologically similar, with no extended blue tail (see Figure 2 and Dalessandro et al. 2013a for the HB mass function in M3).
To further corroborate this conclusion, we have compared the observed HB star distribution in both the UV and F606W-(F606W-F814W) optical CMDs of M5, with theoretical models from the BaSTI database. Specifically, we used the 0.56M⊙, α-enhanced HB tracks from Pietrinferni et al. (2006) at the cluster metallicity ([Fe/H]= −1.3) to identify the position of stars with this mass along the HB of M5. The adopted value marks approximately the lower limit of the HB masses that eventually go on experiencing the third dredge-up. To take into account the presence of a range of He abundances up to ΔY ∼ 0.04 (see Milone et al. 2018), we employed tracks for both normal (Y = 0.248) and enhanced (Y = 0.30) helium mass fractions. We found that only 10% (at most) of the HB stars have mass smaller than 0.56M⊙, which confirms that basically all cluster WDs are expected to be canonically (fast) cooling objects.
Finally, we quantitatively tested this prediction by comparing the completeness-corrected WD LF of M5 (blue circles in Figure 8) with a theoretical WD LF that is computed in the case of 100% canonical WDs (dashed line in the figure). The theoretical LF is normalized to have the same total number of objects as in the brightest portion of the observed LF (for mF275W < 21: gray-shaded region in the figure). As expected, the WD LF of M5 is found to be in excellent agreement with the theoretical sequence, clearly demonstrating that the WD population in this cluster with no blue HB tail is entirely constituted by canonical objects.
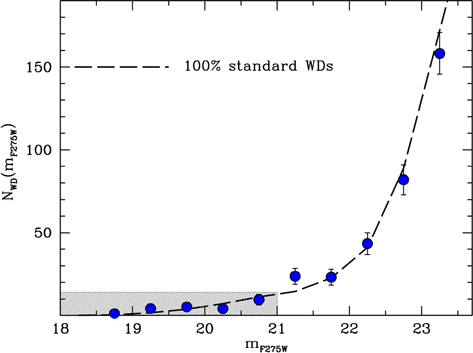
Figure 8. Completeness-corrected WD LF of M5 (blue circles), compared to the theoretical LF expected for a population of canonical (fast cooling) WDs (dashed line). The two LFs are normalized to the total number of WDs detected in the brightest portion of the cooling sequence (mF275W < 21), indicated by the gray-shaded region.
Download figure:
Standard image High-resolution imageThe results that are presented in this work provide further solid support to the scenario traced in Chen et al. (2021, 2022) about the origin of slowly cooling WDs and their link with the HB morphology of the parent cluster. The extension of this investigation to clusters with extended HB blue tails in the extreme low-metallicity regime ([Fe/H] = −2.2), where the phenomenon is expected to reach its maximum efficiency, is now urged to fully verify the theoretical predictions and provide an empirical measure of the impact of these results on the use of the WD cooling sequences as chronometers to measure cosmic ages.
This research is part of the project Cosmic-Lab at the Physics and Astronomy Department of the University of Bologna (http://www.cosmic-lab.eu/Cosmic-Lab/Home.html). The research has been funded by project Light-on-Dark, granted by the Italian MIUR through contract PRIN-2017K7REXT (PI: Ferraro). J.X.C. acknowledges the support from China Scholarship Council (CSC).
Facility: HST(WFC3) - Hubble Space Telescope satellite
Software: DAOPHOT (Stetson 1987), DAOPHOT/ALLFRAME (Stetson 1994).