Abstract
The giant spiral galaxy M101 is host to the nearest recent Type Ia supernova (SN 2011fe) and thus has been extensively monitored in the near-infrared to study the late-time light curve of the SN. Leveraging this existing baseline of observations, we derive the first Mira-based distance to M101 by discovering and classifying a sample of 211 Miras with periods ranging from 240–400 days in the SN field. Combined with new Hubble Space Telescope (HST) WFC3/IR channel observations, our data set totals 11 epochs of F110W (HST YJ) and 13 epochs of F160W (HST H) data spanning ∼2900 days. We adopt absolute calibrations of the Mira period–luminosity relation based on geometric distances to the Large Magellanic Cloud and the water megamaser host galaxy NGC 4258, and find μM101 = 29.10 ± 0.06 mag. This distance is in 1σ agreement with most other recent Cepheid and tip of the red giant branch distance measurements to M101. Including the previous Mira SN Ia host, NGC 1559, and SN 2005df, we determine the fiducial SN Ia peak luminosity,  mag. With the Hubble diagram of supernovae Ia, we derive H0 = 72.37 ± 2.97 km s−1 Mpc−1, a 4.1% measurement of H0 using Miras. We find excellent agreement with recent Cepheid distance ladder measurements of H0 and confirm previous indications that the local universe value of H0 is higher than the early universe value at ∼95% confidence. Currently, the Mira-based H0 measurement is still dominated by the statistical uncertainty in the SN Ia peak magnitude.
Original content from this work may be used under the terms of the Creative Commons Attribution 4.0 licence. Any further distribution of this work must maintain attribution to the author(s) and the title of the work, journal citation and DOI.
1. Introduction
Distances play a fundamental role in astronomy by allowing us to convert observed fluxes and angular separations into physical luminosities and sizes. Through the use of distance ladders, we can then extend these nearby geometric calibrations to cosmologically relevant scales (Riess et al. 1998; Perlmutter et al. 1999).
As one of the only cosmological parameters that can be measured in a model-independent manner, the rate of expansion of the universe at the present day, the Hubble constant (H0), offers a unique opportunity to test the physical underpinnings of the standard Lambda cold dark matter (ΛCDM) model of cosmology. Recent comparisons of the direct local determinations of H0 (late Universe), and the values predicted using cosmological model calibrated observations of the cosmic microwave background (CMB; early Universe), show a persistent ∼9% difference, which has become known as the Hubble tension. The most precise local measurement (SH0ES, Riess et al. 2022) disagrees with the most precise value inferred from the early Universe (Planck Collaboration et al. 2020) by >5σ, which may be an intriguing indication of new physics (see reviews by Di Valentino et al. 2021; Perivolaropoulos & Skara 2022; Kamionkowski & Riess 2023; Hu & Wang 2023).
Hubble Space Telescope (HST) observations of the Leavitt law of Cepheid variables have been used with great success to calibrate the distances to nearby Type Ia supernovae (SNe Ia) in distance ladder determinations of H0 (e.g., Freedman et al. 2001; Riess et al. 2022). The uncertainty on the most precise Cepheid-based measurement (Riess et al. 2022) is now approaching 1%, but the tension has only grown as the measurement uncertainties have decreased. Thus, independent calibrations of SNe Ia can provide a cross check of the systematics and strengthen the evidence for additions to the standard model of cosmology (ΛCDM). To this end, a number of other intermediate distance indicators have been used as alternatives to calibrate SNe Ia, including the tip of the red giant branch (TRGB) and oxygen-rich (O-rich) Mira variables.
At present, TRGB-based measurements of H0 made with several different methods (Freedman et al. 2019; Anand et al. 2022; Anderson et al. 2023; Scolnic et al. 2023) have slightly larger uncertainties and range of values than Cepheid-based measurements. The results of Anand et al. (2022), Anderson et al. (2023), and Scolnic et al. (2023) agree with each other and the SH0ES measurement to within 1σ. The Freedman et al. (2019) TRGB result from the Carnegie-Chicago Hubble Program (CCHP) prefers a somewhat lower value and sits between the early and late Universe measurements. An analysis by Scolnic et al. 2023, see their Table 5) traces most of the differences in H0 in these TRGB-based studies to differences in their treatment of SNe Ia, totaling 2.0 km s−1 Mpc−1.
In Huang et al. (2020), we discovered and classified Mira variables—fundamentally pulsating asymptotic giant branch (AGB) stars—in NGC 1559, host to SN 2005df. We then used this sample to derive a calibration of the SN Ia fiducial luminosity and a measurement of H0 using the single SN Ia calibrator. This distance ladder was composed solely of geometry, Miras, and SN Ia, and thus, was completely independent of Cepheids or TRGBs. This resulted in a measurement of H0 = 73.3 ± 4.0 km s−1 Mpc−1, which, due to its large uncertainties, is within 1σ of H0 derived using Cepheids and 1.5σ of the value of H0 inferred by Planck Collaboration et al. (2020). The ∼5.5% uncertainty of this measurement is dominated by the statistical uncertainty in the peak magnitude of the sole SN Ia calibrator.
Significantly improving the precision of this measurement requires calibrating additional SNe Ia. While well-sampled light curves generally reduce the uncertainty in the peak luminosity of an SN Ia, there is typically still a ∼0.10 mag uncertainty in the peak magnitude after standardization. Even with the inclusion of spectroscopy, Murakami et al. (2023) found an overall ∼0.12 mag level of scatter remained for SNe Ia in the distance ladder. Thus, in this work, we focus on reducing the uncertainties on the Mira-based H0 by calibrating a second SN Ia, SN 2011fe, located in the nearby giant spiral galaxy M101.
AGB stars are a natural choice for standard candles since they are typically the brightest stars in old and intermediate-age populations. Their luminosities allow them to bridge the gap between geometric measurements and the local host galaxies of SNe Ia, which are typically within 40 Mpc. While AGB pulsation can be classified into several modes, and many types of AGB stars have long periods (P > 30 days) and follow period–luminosity relations (PLRs), fundamentally pulsating Mira stars are arguably the easiest subset of long-period variables to classify thanks to their large amplitudes of pulsation. They have long but stable periods that can be recovered with multi-epoch data covering several phase points and spanning at least one cycle of pulsation. Their pulsational periods and luminosities have been known to be related for several decades (Glass & Lloyd Evans 1981). Among Miras, the short-period (P < 400 days), oxygen-rich (O-rich) subgroup are the most commonly employed for the cosmic distance ladder due to their small intrinsic scatter at near-infrared (NIR) and longer wavelengths (Yuan et al. 2017a, 2017b; Huang et al. 2020). The more massive carbon-rich (C-rich) Miras are also known to follow PLRs, particularly in the mid-infrared (e.g., Iwanek et al. 2021). C-rich AGB stars have also been proposed collectively as a separate indicator (JAGB; Madore & Freedman 2020).
Mira variables are highly evolved, fundamental-mode, thermally pulsing stars at the tip of the AGB. In the NIR and longer wavelengths, they generally follow a tight (σ ∼ 0.13 mag in H) PLR similar to the Leavitt law for Cepheids. They have large amplitudes (frequently ΔV > 2.5 mag or ΔK > 0.4 mag are used) and long periods generally ranging from ∼100–2000 days (e.g., Whitelock et al. 2006; Soszyński et al. 2009; Samus’ et al. 2017). Miras can be classified as O-rich or C-rich depending on their surface chemistries. Stars entering the AGB will begin as oxygen-rich; during this evolutionary phase, carbon synthesized through triple-alpha reactions is dredged up to the surface of the star, gradually increasing the photospheric C/O ratio. If this ratio exceeds 1, the star is classified as carbon-rich. The relative abundances of carbon and oxygen on the surface of a star will determine the molecular features present in its spectra. Thus, C-rich and O-rich Miras do not always follow the same PLR, and separation of the two spectral subtypes is important to reduce scatter and bias of the PLR.
The Miras used in the cosmic distance ladder are short-period (P < 400 days) O-rich variables since this subgroup has simpler physics, is the easiest to isolate, and follows the tightest PLR at the NIR wavelengths accessible to HST. The majority of short-period Miras are O-rich, which limits C-rich Mira contamination in the PLR. At longer periods, some O-rich Miras may have increased luminosity due to hot-bottom burning (carbon-burning at the base of the outer convective layer) and will lie above the PLR (Whitelock et al. 2003). Restricting the period range to shorter periods also has the benefit of enabling a shorter baseline of observations for characterization than would be necessary to determine the periods of the more slowly varying Miras.
The rest of the paper is structured as follows. In Section 2, we discuss the observations, data reduction, and photometry process. In Section 3, we explain the variable search process and the selection criteria applied to obtain the Mira sample. In Section 4, we discuss the potential impact of extinction and metallicity on our results. In Section 5, we outline the individual rungs of the distance ladder, the derivation of H0, and the error budget. In Section 6, we present and discuss the results and compare our measurement of the distance to M101 with previous distances obtained using Cepheids and TRGBs. Finally, we conclude in Section 7. Throughout the paper, we use amplitude to refer to the total (peak-to-trough) variation of a star’s light curve as determined from the coefficients of the sinusoidal fit.
2. Observations, Data Reduction, and Photometry
2.1. Observations
Due to the long period of variability of Miras (around 100–400 days for our intended targets), we found it advantageous to use a combination of archival and new observations to create the longest possible baseline. As the host to the nearest modern Type Ia SN 2011fe, the SN field of M101 was observed eight times over the course of 3 yr in the NIR to study the late-time light curve of the SN. Thus, we chose to target this region of the galaxy for additional Mira observations which improved the sampling and increased the area of the observations. With a combination of archival and new, more recent time series, we are able to both increase the observational footprint and extend the observational baseline, doubling the number of recovered variables over using just the archival observations. The field that we targeted and the locations of the Miras discovered in the galaxy using the selection criteria from Section 3 are shown in Figure 1. A summary of these observations and their exposure times can be found in Table 1.
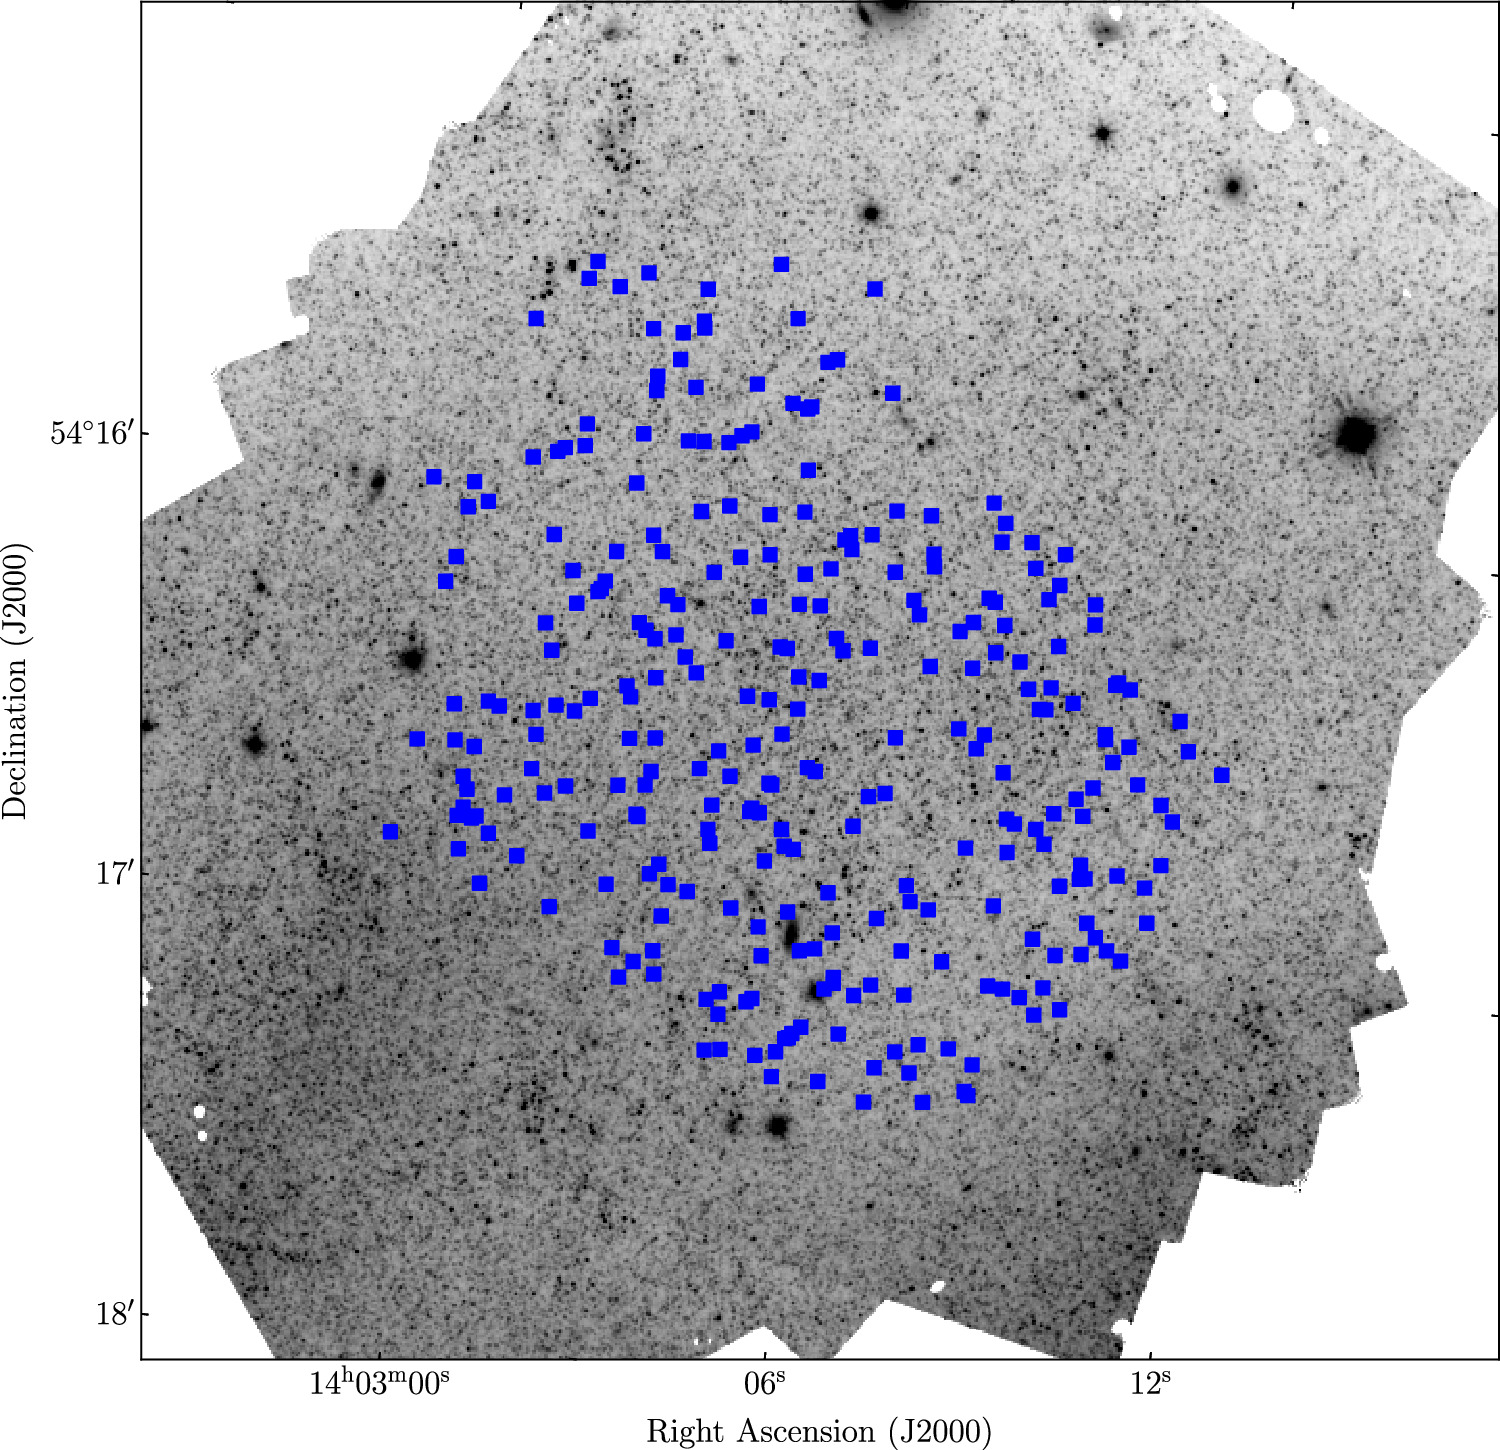
Figure 1. Locations of Miras (blue squares) discovered using the selection criteria outlined in Section 3.1, plotted on the F160W stacked image comprising 47 stacked individual exposures.
Download figure:
Standard image High-resolution imageTable 1. Summary of HST Observations
| Epoch | Date | Filter | Exposure (s) | No. Dithers | Proposal ID | Data Set |
|---|---|---|---|---|---|---|
| 1 | 2014 Oct 9 | F160W | 1398.46 | 2 | 13737 | ICOY01 |
| 1 | 2014 Oct 9 | F110W | 1598.47 | 2 | 13737 | ICOY01 |
| 2 | 2015 Jan 24 | F160W | 827.72 | 3 | 13824 | ICL0A1 |
| 3 | 2015 Apr 6 | F160W | 1398.46 | 2 | 13737 | ICOY02 |
| 3 | 2015 Apr 6 | F110W | 1598.47 | 2 | 13737 | ICOY02 |
| 4 | 2015 Jul 14 | F160W | 1398.47 | 2 | 13737 | ICOY04 |
| 4 | 2015 Jul 14 | F110W | 1598.47 | 2 | 13737 | ICOY04 |
| 5 | 2015 Sep 10 | F160W | 1655.45 | 6 | 13824 | ICL0A2 |
| 6 | 2016 Feb 19 | F160W | 1398.46 | 2 | 14166 | ICZJ01 |
| 6 | 2016 Feb 19 | F110W | 1598.47 | 2 | 14166 | ICZJ01 |
| 7 | 2016 Sep 27 | F160W | 8795.40 | 6 | 14166 | ICZJ03 |
| 7 | 2016 Sep 27 | F110W | 5195.40 | 6 | 14166 | ICZJ03 |
| 8 | 2017 Jun 17 | F160W | 1911.74 | 4 | 14678 | ID6V02 |
| 8 | 2017 Jun 17 | F110W | 4011.74 | 4 | 14678 | ID6V02 |
| 9 | 2021 Dec 3 | F160W | 1311.76 | 4 | 16744 | IEQ601 |
| 9 | 2021 Dec 3 | F110W | 1211.74 | 4 | 16744 | IEQ601 |
| 10 | 2021 Dec 24 | F160W | 1311.76 | 4 | 16744 | IEQ602 |
| 10 | 2021 Dec 24 | F110W | 1211.74 | 4 | 16744 | IEQ602 |
| 11 | 2022 Feb 10 | F160W | 1311.76 | 4 | 16744 | IEQ603 |
| 11 | 2022 Feb 10 | F110W | 1211.74 | 4 | 16744 | IEQ603 |
| 12 | 2022 Apr 16 | F160W | 1311.76 | 4 | 16744 | IEQ604 |
| 12 | 2022 Apr 16 | F110W | 1211.74 | 4 | 16744 | IEQ604 |
| 13 | 2022 Aug 19 | F160W | 1311.76 | 4 | 16744 | IEQ605 |
| 13 | 2022 Aug 19 | F110W | 1211.74 | 4 | 16744 | IEQ605 |
Note. All HST observations are analyzed in this paper. The full data set can be accessed at 10.17909/z80p-1q97.
Download table as: ASCIITypeset image
We use archival observations of the galaxy acquired in four separate proposals (GO-13737, PI: Shappee; GO-13824, PI: Kerzendorf; GO-14166, PI: Shappee; and GO-14678, PI: Shappee) in 2014–2017 using the infrared (IR) channel of the Wide Field Camera 3 (WFC3) instrument on board HST in two filters: F110W and F160W (the HST wide YJ and wide H filters, respectively). All of the observations were centered on or near the location of SN 2011fe (α = 14h03m05711,
 , Equinox:J2000). The number of dithers ranged from 2–6 and the cadence for these observations is uneven, ranging from 58–220 days with a total baseline of 982 days. These data have not previously been analyzed in order to search for Miras or other periodic variables.
In addition, we acquired five new epochs of HST WFC3/IR F110W and F160W imaging (GO-16744, PI: Huang) from 2021 December to 2022 August. For each filter and epoch, there are four subpixel-dithered exposures. These observations are centered on the SN and span a baseline of 258 days with an uneven, approximately power-law cadence varying from 20–124 days that was designed to reduce aliasing (Freedman et al. 1994). The more recent observations were timed to improve recovery of the short-period Miras, allowing us to observe at least three phase points in one cycle for all periods >100 days. Combined with the archival observations, the total baseline is 2871 days. Regions close to the SN, with maximum overlap from the individual exposures, have up to 13 epochs of observations. Figure 2 shows the full baseline of archival and recent observations for selected variables with periods ranging from 200–500 days.
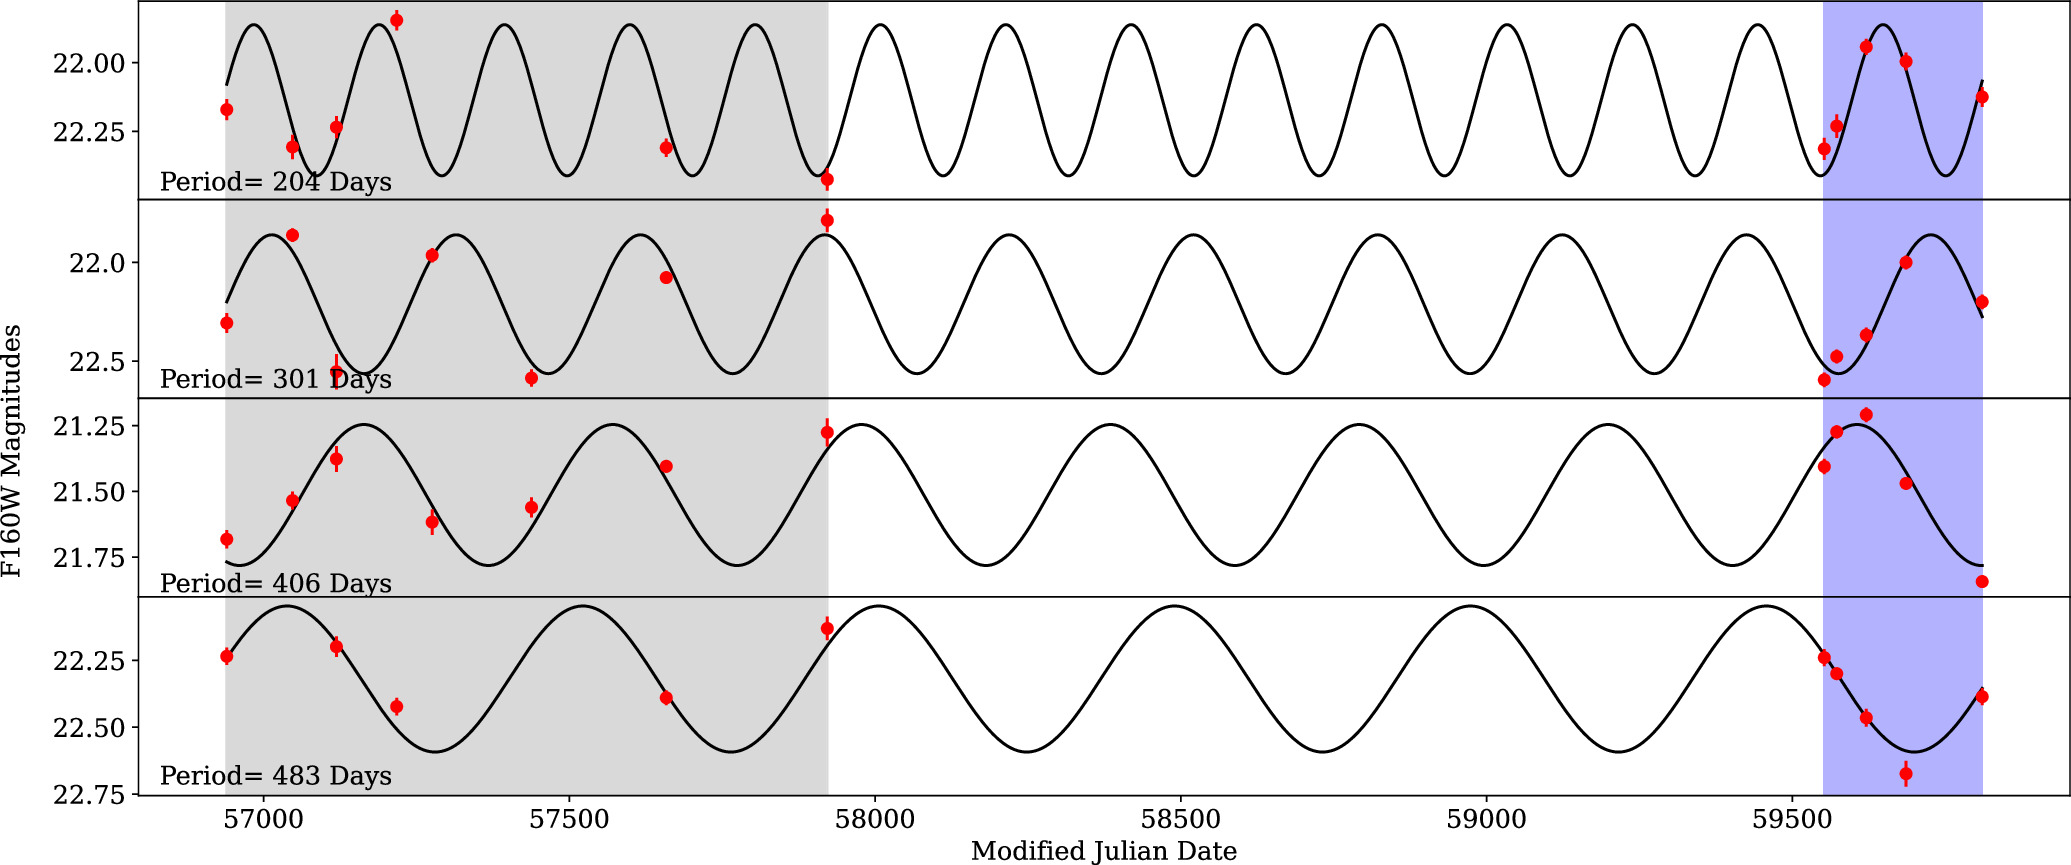
Figure 2. Four representative light curves of candidate Miras with periods ranging from 204–472 days. The sinusoidal fit is shown in black and observations in red. Gray-shaded regions indicate the span of time of the archival observations while blue-shaded regions span the new Cycle 29 observations.
Download figure:
Standard image High-resolution image2.2. Filter Selection
Previous observations of Miras in NGC 1559 (Huang et al. 2020) and NGC 4258 (Huang et al. 2018) also used F160W for the Mira PLR. However, due to its close match in wavelength with the ground-based J-band filter, GO-13445 (PI: Bloom) used F125W instead of F110W to obtain J-band observations in NGC 4258. In Huang et al. (2018), we discovered that the zero-point of the Mira PLR remained the same regardless of whether a cut based on F125W−F160W color or F814W variability was applied during the selection process for NGC 4258. This issue is discussed in greater detail in Section 3.5, but the NIR wide filters encompass molecular features in the spectra of both subtypes, thus limiting our ability to separate O- and C-rich Miras using only NIR colors derived from HST wide bands. The F814W filter should improve this separation, but even using F814W variability as a selection criterion in Huang et al. (2018) did not change the zero-point by more than ∼0.02 mag compared to using only F160W, which may suggest low C-rich contamination, or similarity of magnitudes for C-rich and O-rich Miras in the HST NIR bands. Thus, only F160W observations were obtained for NGC 1559.
In this work, we attempt once again to separate C- and O-rich Miras on the basis of their colors in addition to the O- and C-rich separation and other criteria developed in Huang et al. (2018, 2020), which are discussed in greater detail in Section 3.1. We have chosen to use F110W because of its greater wavelength separation from the F160W filter and wider wavelength coverage (to improve signal to noise) compared to the F125W filter used in the previous Mira study. The F110W filter extends from 9000–14,000 Å, overlapping with the F814W by about 600 Å, while the F125W filter extends from 11,000–14,000 Å. This allows us to achieve increased signal to noise and somewhat better C- and O-rich separation using F110W.
2.3. Data Reduction and Photometry
We retrieve all the WFC3/IR images from the Mikulski Archive for Space Telescopes (MAST) as flt files. These are pipeline-processed, calibrated, flat-fielded individual exposures. We then generate drizzled and stacked images using Drizzlepac 3.1.8, aligned relative to the ninth epoch (first new epoch) of observations. We create stacked images for each epoch and filter for time-series photometry and a deep detection image stacking all of the exposures for each filter. Each filter and epoch of observation contains at least two dithers, allowing us to sample the point-spread function (PSF) at a subpixel level and produce drizzled images with a scale of 012 pixel−1, slightly below the native WFC3/IR scale of 0
128 pixel−1.
We use the DAOPHOT/ALLSTAR/ALLFRAME suite of crowded-field photometry software (Stetson 1987, 1994), to perform aperture and PSF photometry on the drizzled images. We generate a source list using the DAOPHOT procedure FIND to detect objects with >3σ significance in the F160W stacked image, taking into account the sky background, readout noise, and number of stacked images. We use the DAOPHOT procedure PHOT to perform aperture photometry on this source list, which is then input into ALLSTAR to perform PSF photometry and generate a source-subtracted image. We then perform a second round of aperture and PSF photometry on the source-subtracted stacked image, resulting in a final source list of ∼100,000 point sources.
In the next step, we input the source list into ALLFRAME to perform time-series photometry on the 13 individual epochs. ALLFRAME simultaneously fits the profiles of all sources across the full baseline of epochs, allowing it to maintain a constant source list through multiple epochs and improving image registration and photometry of sources closer to the detection limit. For F110W, we transform the coordinates from the source list derived from the deeper F160W stacked image and repeat these photometry steps to create the F110W source list.
2.4. Calibration
We select 500 bright field stars to use for the zero-point calibration. We use the ninth epoch as the reference observation for the calibration as we did for the photometry. We calculate the offsets between the reference and each of the other epochs. For each pair of observations, we calculate the differences in magnitude for each star and perform an iterative 3σ clip to remove outliers before calculating the mean magnitude difference for that pair. We also 3σ clip any problematic pairs that have a particularly large magnitude difference. In our case, we found that the mean offsets between the reference and each epoch were all quite small, ranging from 0.0008–0.01 mag, and we did not need to remove any epochs. We take the mean pairwise difference of all the epochs from the reference—0.0035 mag—to be the overall instrumental zero-point offset. We then correct each epoch by the overall instrumental zero-point as well as their individual offsets from the reference epoch.
Next, we convert from PSF to aperture magnitudes using aperture corrections. This also corrects for imperfections in our PSF model. To determine the aperture corrections, we visually select bright and isolated stars using the stacked image. We then subtract all other detected sources from it and perform aperture photometry on the selected stars in the subtracted image. Then we calculate the difference between the PSF photometry and the aperture photometry (Δm) at a range of aperture sizes to derive a growth curve. Figure 3 shows the individual magnitude differences for each of the reference stars and the mean aperture correction. Finally, to correct to an infinite aperture, we use the WFC3/IR encircled energy tables 8 to determine the percentage of flux encircled at each aperture. We then add this to Δm, the aperture correction, to obtain the correction to an infinite aperture. Finally, we apply the Vega magnitude HST WFC3/IR photometric zero-points (Deustua et al. 2017) of 26.042 mag for F110W and 24.662 mag for F160W. To summarize, going from the instrumental magnitude mi to the final calibrated magnitudes mf ,

where t is the exposure time, aDAO is 25, aHST is 24.662 for F160W, and Δmb is the bias correction, which is discussed in detail later, in Section 3.2.
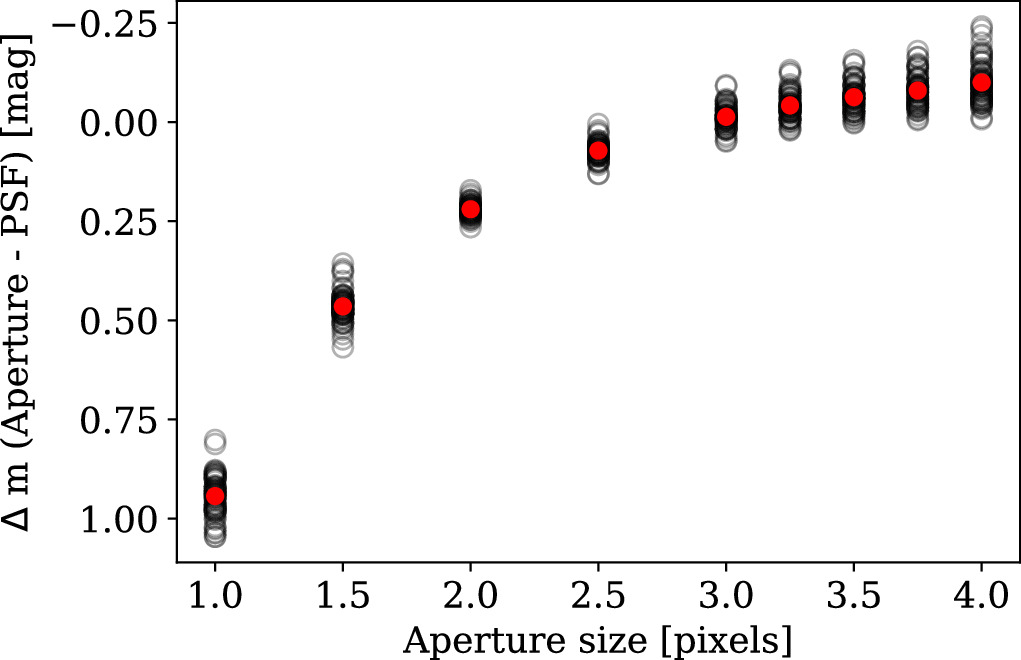
Figure 3. The difference in aperture and PSF magnitudes for ∼70 bright, isolated stars in our field. The difference in magnitude for the individual stars is given by the black open circles, while the final aperture correction derived from these measurements is shown in red. Uncertainties for the final aperture corrections are smaller than the individual points.
Download figure:
Standard image High-resolution image3. Methodology
We detect ∼100,000 point sources in the stacked image. From there, we derive a clean sample of Mira variables using cuts based on the robustness of variability, amplitude, color, and period. The optical light curves of Miras are known to vary cycle to cycle in both shape and magnitude at a given phase (Ludendorff 1928), although the light curves of short-period, O-rich Miras are generally symmetric (Vardya 1988) and often close to sinusoidal (Lebzelter 2011). At NIR and IR wavelengths, their shapes are also well approximated by a sinusoid. Huang et al. (2018) found that cycle-to-cycle variations of the mean H-band magnitude are ∼0.07 mag and that only about 1% of stars with F160W light curves required a higher-order Fourier component fit. Thus, following both Huang et al. (2018) and Huang et al. (2020), we fit the periods and light-curve parameters of our candidate Miras with a sine function.
3.1. Selection Criteria
We use the TRIALP code provided by Stetson (1996) to obtain initial light curves and determine the Welch–Stetson variability index L for the entire source list. This index selects for objects with a more sinusoidal or square-wave shape (rather than Gaussian variations, or random spikes) and also considers whether the variations are correlated between pairs of observations or pairs of filters. A lower L value generally indicates that a particular source is less likely to be a bona fide variable. Conversely, a source with a high L value is more likely but not necessarily a variable. Thus, the L index threshold is just a first step to creating a starting list of possible variables which are then subject to other selection criteria. Figure 4 shows the distribution of L index values for all objects that had 10 or more epochs of observation. Similarly to our previous studies, we keep only sources with L > 0.75 to begin our search.
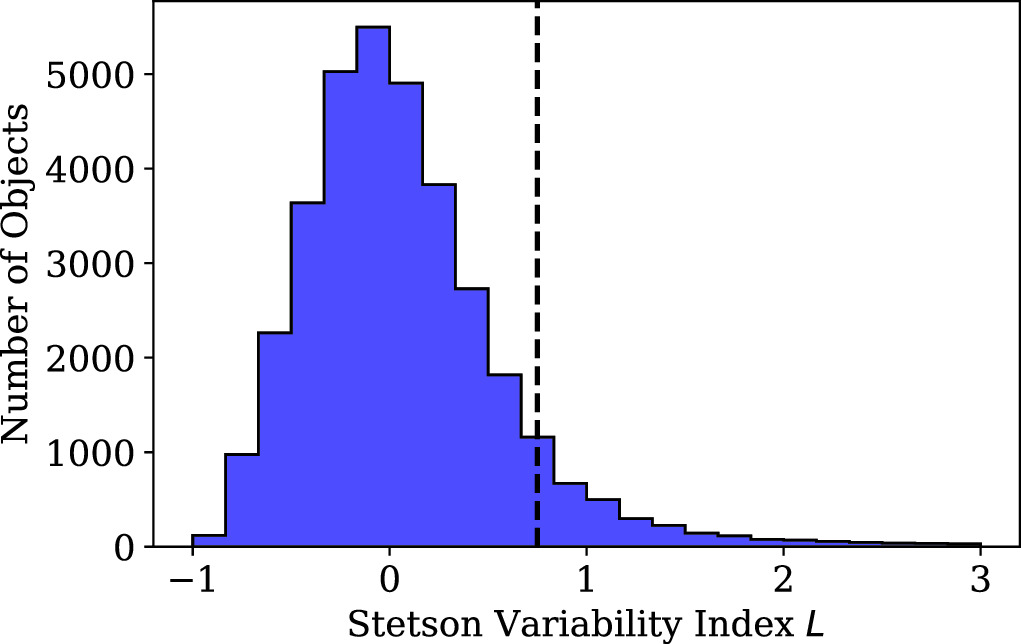
Figure 4. Histogram of Welch–Stetson variability index L values for all sources with at least 10 epochs of observation—a total of 35,000 objects. The dashed black line indicates the L = 0.75 threshold we used to begin our variability search.
Download figure:
Standard image High-resolution imageAfter removing sources with fewer than 9 epochs of F160W observation, we calculate periods for the remaining 3960 light curves using χ2 minimization on a grid search of periods ranging from 100–1000 days—the relevant period range for Miras. Each light curve is fit with a sine function, leaving amplitude, mean magnitude, and phase as free parameters.
We then use an F-test to remove any sources whose fit does not favor a sinusoid over a first-order polynomial and apply an amplitude cut of 0.4 mag < ΔF160W < 0.8 mag and an initial period cut of 200 days <P < 500 days. Previously, in both Huang et al. (2018) and Huang et al. (2020), we used P < 400 days as an initial upper limit for the period. This was limited both by the observational baseline (∼400 days in both of the previous studies) which prevented us from measuring the periods of more slowly varying stars and by physics (since longer-period Miras may be undergoing hot-bottom burning). However, thanks to the considerably longer observational baseline for M101, we are able to extend the initial search up to 500 days. It is possible that some stars in the 400–500 days range may be undergoing hot-bottom burning and thus bias the PLR. Thus, for the final distance measurement, both the upper and lower bounds of the period range are redetermined empirically in Section 3.3. The minimum period is motivated by completeness while the upper bound is to avoid bright outliers which may be undergoing hot-bottom burning.
We next impose a color cut of F110W−F160W < 1.3. This removes the reddest objects, which are more likely to be C-rich. At this stage, we are left with 324 sources, which have passed all of the initial criteria for being Mira candidates. A summary of the cuts used and their comparisons with previous Mira searches in NGC 1559 and NGC 4258 can be found in Table 2.
Table 2. Mira Sample Selection Criteria
| Selection Criteria | M101 | NGC 1559 | NGC 4258 (gold) |
|---|---|---|---|
| Period cut | 200 days <P < 500 days | 240 days <P < 400 days | P < 300 days |
| Amplitude cut | 0.4 mag < ΔF160W < 0.8 mag | 0.4 mag < ΔF160W < 0.8 mag | 0.4 mag < ΔF160W < 0.8 mag |
| Color cut | mF110W−mF160W < 1.3 mag | ⋯ | mF125W−mF160W < 1.3 mag |
| Surface brightness cut | ⋯ | 421 counts s−1 | ⋯ |
| F-statistic |

|

| ⋯ |
| F814W detection | ⋯ | ⋯ | Slope fit to F814W data >3σ |
| F814W amplitude | ⋯ | ⋯ | ΔF814W > 0.3 mag |
| Study | This work | Huang et al. (2020) | Huang et al. (2018) |
Note. A comparison of the criteria for the final Mira sample in M101 with those used for NGC 1559 and NGC 4258. As a result of differences in available data, we were unable to match the criteria exactly.
Download table as: ASCIITypeset image
3.2. Bias Corrections
In crowded-field photometry, measurement bias can result from a high density of unresolved background sources, which may affect the determination of the sky background and PSF fits. This typically has the effect of artificially increasing the brightness of measured sources. We correct for this bias due to crowding using artificial star tests, which have also been employed in Cepheid distance measurements for decades (e.g., Ferrarese et al. 2000a; Hoffmann et al. 2016; Yuan et al. 2020; Riess et al. 2022). These crowding (or bias) corrections derived from the artificial star tests are a statistical correction. However, individual stars may also suffer from blending, where a bright nearby source may make an individual Mira appear anomalously brighter and decrease its amplitude. Blending can be the result of physical association or close chance superposition but is generally not compensated by the crowding corrections from artificial star tests. Instead, we consider Mira candidates which are within one full-width half maximum (2.5 pixels) of a source of the same magnitude or brighter to be blended and remove them from the sample (a total of 36 objects).
For the remaining Mira candidates, we fit an initial PLR. To determine the starting magnitudes of the artificial stars, we use each star’s period and the initial PLR to create an artificial star at the magnitude predicted by the PLR. The artificial star is then randomly dropped within a 20 pixel (24) radius of the original Mira, so that both are in the same environment. To avoid introducing additional crowding into the image, we create 100 images, each including only one artificial star per Mira. We then perform aperture and PSF photometry on the images with injected artificial stars exactly as we would with real data. The difference in magnitude between the input artificial stars and the recovered sources is used to obtain an estimate of the crowding corrections. We then correct the magnitude of the original Miras using the crowding corrections and refit the PLR to determine a new input magnitude for the artificial stars. This process is repeated until the recovered magnitudes of the artificial stars converge with the measured magnitudes of the Miras.
Overall, bias corrections for this galaxy were small (mean: 0.076 mag, median: 0.047 mag, σ = 0.171 mag) but with a non-Gaussian distribution. The small size of the crowding corrections is likely due to M101's relative proximity compared to other SN host galaxies and the more isolated SN Ia field in which we have observed Miras compared to the more central disk regions targeted for Cepheids or Miras in other galaxies. Figure 5 shows that the distribution of crowding corrections for this galaxy is asymmetric with a long tail at the bright end. We interpret this as a real effect caused by the artificial stars occasionally landing close to a field star. While most lines of sight through the galaxy are clear, these occasional interlopers cause a long tail in the distribution of the crowding corrections towards the bright end.

Figure 5. Left: Distribution of all crowding corrections from every run of the artificial star tests. The peak of this distribution is close to zero and depends on the binning chosen. Middle: Distribution of the mean crowding correction for each Mira. The blue-dashed line in both plots indicates the mean of the distribution, 0.080 mag and 0.074 mag, respectively. Right: Distribution of zero-points for the 260 day < P < 400 day sample obtained through bootstrap Monte Carlo application of crowding corrections. Histogram of the Monte Carlo in blue, Gaussian distribution in red.
Download figure:
Standard image High-resolution imageRather than apply the median (biased estimator) or mean (unbiased estimator) of the final crowding corrections for each star, as done in Huang et al. (2018) and Huang et al. (2020) where the distribution of the corrections was nearly Gaussian, we instead account for the asymmetry by using a bootstrap Monte Carlo method to randomly draw a crowding correction for each Mira from its artificial star tests while assuming flat uncertainties for the crowding correction of each star. We then fit and 3σ clip the corrected magnitudes with a PLR. The resulting distribution of the PLR zero-points is approximately Gaussian, as expected from the central limit theorem. The distribution of zero-points is shown in the right panel of Figure 5. We take the mean and standard deviation of the resulting distribution as the zero-point and the statistical uncertainty in the PLR when including the photometric uncertainties, intrinsic scatter, and uncertainties due to the crowding corrections. In Section 6, we compare this result with that obtained from using the mean crowding correction for each star and fitting a PLR using linear regression and 3σ clipping and find very good agreement between the two methods.
3.3. Refining the Period Range
C-rich Miras are the largest contaminant in the O-rich Mira PLR. However, they are also generally more massive and younger stars and are thus less common at shorter periods (Feast et al. 2006). The mass at which C-rich AGB stars form is dependent on metallicity. At higher metallicities, C stars are rarer than O-rich AGB stars. This can be seen in the Milky Way, where the average period of a C-rich Mira is P ∼ 520 days, while in the LMC it is ∼400 days. Thus, the period cut imposed on the short-period end is motivated by completeness, not astrophysics. The intrinsic width of the PLR can create a bias at shorter periods if the stars below the mean value of the PLR are not detected.
At the upper range, we are both excluding C-rich stars and O-rich stars, which may be undergoing hot-bottom burning. Similarly to Huang et al. (2020), we determine the limits empirically by using a boxcar with a width of 75 days to calculate the zero-point of the PLR at a small range of periods. Figure 6 shows the results of the boxcar fit. We find that the zero-point is roughly flat when considering a range of starting periods between 260 and 400 days (also relatively consistent with the range determined for NGC 1559 in Huang et al. 2020) but shows a trend at both short and long periods. At short periods, the zero-point is biased bright—consistent with completeness—and at long periods, the zero-point is biased faint—consistent with potential C-rich contamination.
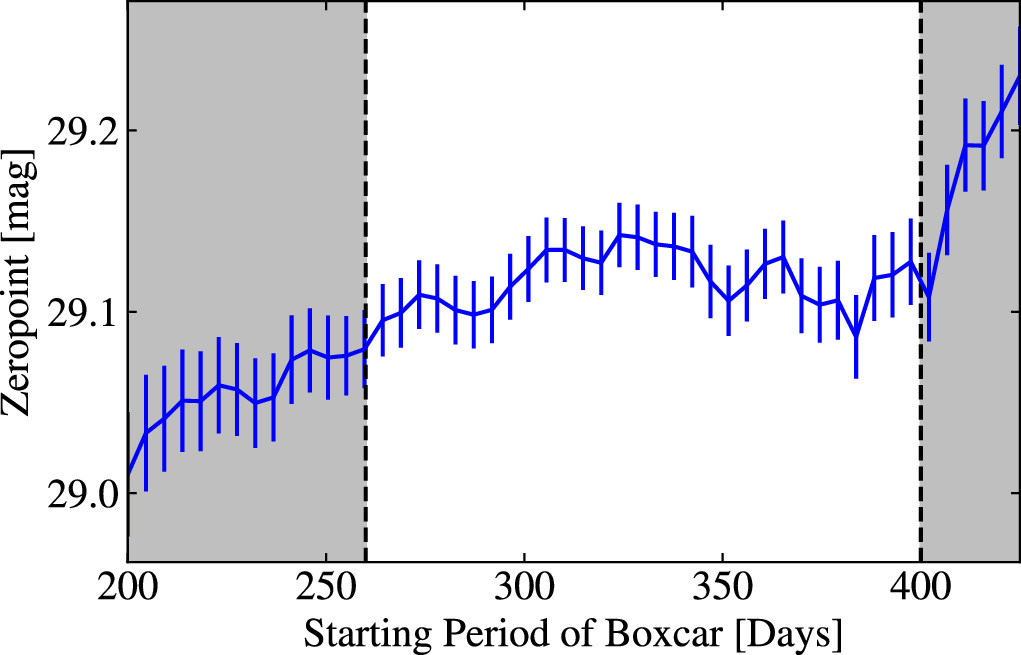
Figure 6. Zero-point as a function of period using a boxcar fit with a width of 75 days. The gray-shaded regions show the period ranges that are excluded in our best-fit analysis.
Download figure:
Standard image High-resolution image3.4. PLR
In Huang et al. (2020), we compared the results from two slopes for a linear PLR. The first was determined for the H band by Yuan et al. (2017b) using ground-based data from OGLE-III and the Large Magellanic Cloud Near-infrared Synoptic Survey (Macri et al. 2015). Since our observations are in F160W, we also used a color transformation derived from O-rich Mira spectra to convert this into an F160W slope (see section 3.4.3 of Huang et al. 2018 for a more detailed explanation). The results for both slopes were found to be in ∼0.02 mag agreement in the previous studies. Thus for simplicity, our best-fit result here uses only the PLR with the color-transformed F160W slope,

where mF160W is the magnitude in F160W bandpass, a is the zero-point and magnitude of a 200 days Mira, and P is the period in days.
Total uncertainties for individual Miras (σtot) are given by

the quadrature sum of the photometric error (σphot, ∼ 0.02–0.1 mag) and the intrinsic scatter of the Mira PLR in the NIR (σint, ∼ 0.13 mag). We typically also include the uncertainty due to crowding bias in the total uncertainty for each Mira. However, in this case, the distribution of the individual crowding corrections is non-Gaussian, so the total uncertainty on the resulting zero-point of the PLR comes from the results of the Monte Carlo bootstrap resampling and naturally incorporates the uncertainties from the crowding corrections already.
3.5. C-rich Contamination
In ground-based studies, C- and O-rich Miras are often separated on the basis of their J − H or J − Ks colors. In these bands, C-rich AGB stars are typically redder than their O-rich counterparts. Similar to the cut used in Huang et al. (2018) we apply a color cut of F110W−F160W < 1.3 to remove the reddest stars. Unfortunately, as we can see from Figure 7, the WFC3/IR color–magnitude diagram is relatively featureless and we cannot readily distinguish the spectral types of AGB stars in it. This is due to the NIR filter combination–both bands are too broad to target the distinctive molecular features of the two spectral types which is in agreement with findings from other stellar populations. Dalcanton et al. (2012) showed that the majority of C-rich AGB stars in their stellar populations occupied similar locations in the WFC3/IR color–magnitude diagrams as the O-rich AGB stars.
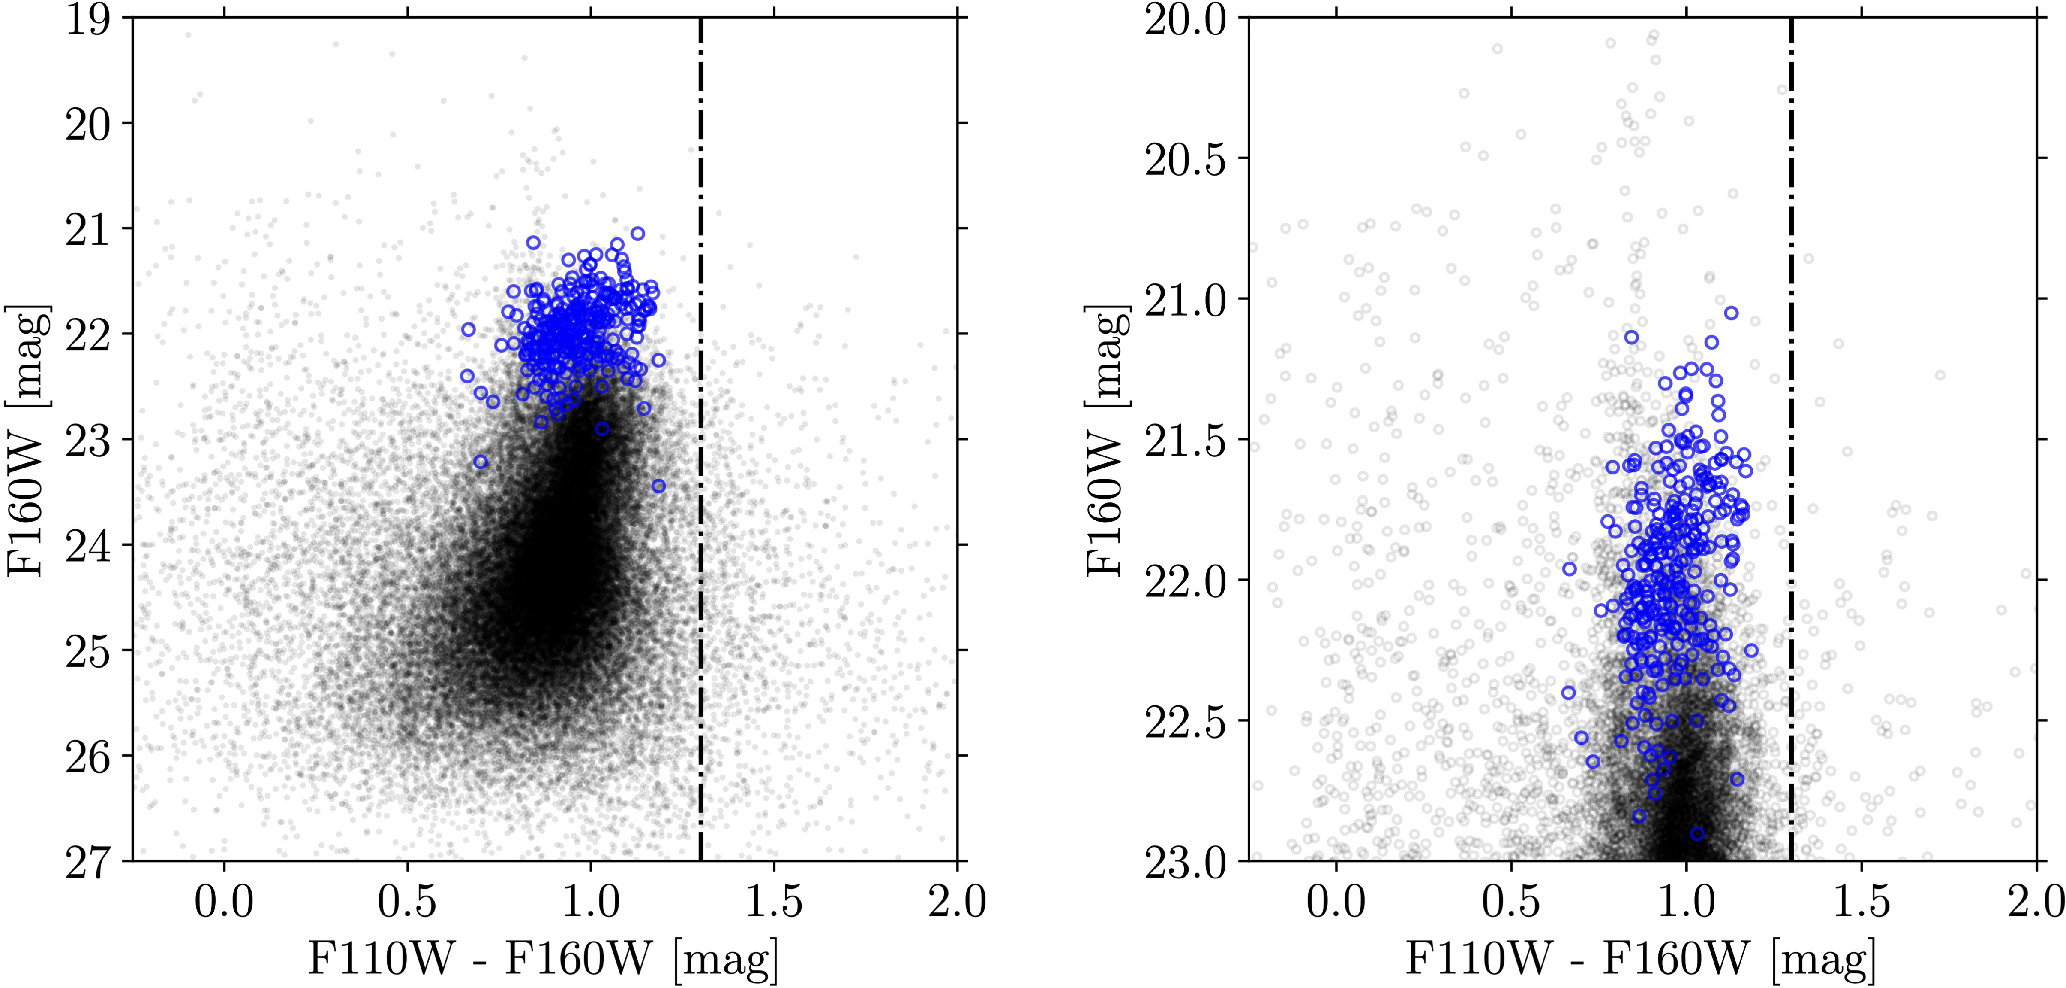
Figure 7. Left: full F110W−F160W color–magnitude diagram for M101 stars with the Miras are shown in blue. Dashed black line shows the color cut of F110W − F160W < 1.3 mag. Right: Same F110W−F160W color–magnitude diagram but showing only the stars with magnitudes ∼0.5 mag of the estimated TRGB stars or brighter.
Download figure:
Standard image High-resolution imageSince we cannot fully remove C-rich Miras from our samples, we instead estimate their potential bias on the PLR following the method introduced in Section 3.5 of Huang et al. (2020). We use the J- and H-band observations of Miras from the LMC from Yuan et al. (2017b) for comparison. We estimate the amplitudes of the variables using the minimum and maximum magnitudes reported in the data set. The minimum and maximum H-band magnitudes in this data set are sparsely sampled but cover multiple cycles. We then use the previously derived color transformation for O-rich Miras from Huang et al. (2018),

where mF160W is the magnitude in F160W, mH is the H-band magnitudes and mJ is the J-band magnitude, to convert the ground-based H-band magnitudes and amplitudes to their F160W equivalents.
Next, we examine the difference in zero-point for both of these samples as a function of period. Assuming that C-rich Miras will have a similar effect on the PLR in the LMC as in M101, we can correct for the change in the zero-point due to C-rich Mira contamination by fitting the mixed zero-point-versus-period curve from the LMC to the M101 zero-point-versus-period relationship. We calculate the zero-point as a function of period in 50 day period bins for the contaminated sample of LMC Miras. Then, we model the zero-point-versus-period curve of M101 with the LMC curve using

where Zhost(P) is the zero-point as a function of period for the Miras (assumed to be contaminated) in a given host. We then fit α and β, which simply scale and shift the zero-points in the fit to match each galaxy. Scaling the size of the correction changes the level of C-rich contamination while shifting the zero-point allows us to correct for the difference in the distance moduli of the hosts. We note that the difference between the zero-point of the entire LMC mixed and O-rich samples in our relevant period range is 0.025 mag, so this is a relatively small correction even for the C-rich dominated LMC.
For the fit, we only consider period bins that are above the completeness limit of M101 (estimated at 240 days). We find that for this range, the best fit is α = 0.19 ± 0.16. This small value of α is primarily driven by the final bin, which has the largest residual between the LMC and M101. Thus, if we refit while excluding this point we find α = 0.67 ± 0.23. However, neither of these fits is significantly better than when assuming no dependence (a straight line). As a result, we do not correct for C-rich contamination for the M101 sample. Figure 8 shows the LMC curves for the mixed and pure O-rich populations as well as the fit of the LMC mixed curve to the M101 observations after excluding the longest-period bin and the periods below the completeness limit. While the fit appears good, the fluctuations in zero-point are still within the uncertainties, and thus the curve is not significantly favored over the null result of no relation. This implies that the C-rich correction is likely not significant for a metal-rich galaxy like M101 (which will be dominated by O-rich stars) compared to a metal-poor galaxy like the LMC (which is dominated by C-rich stars).
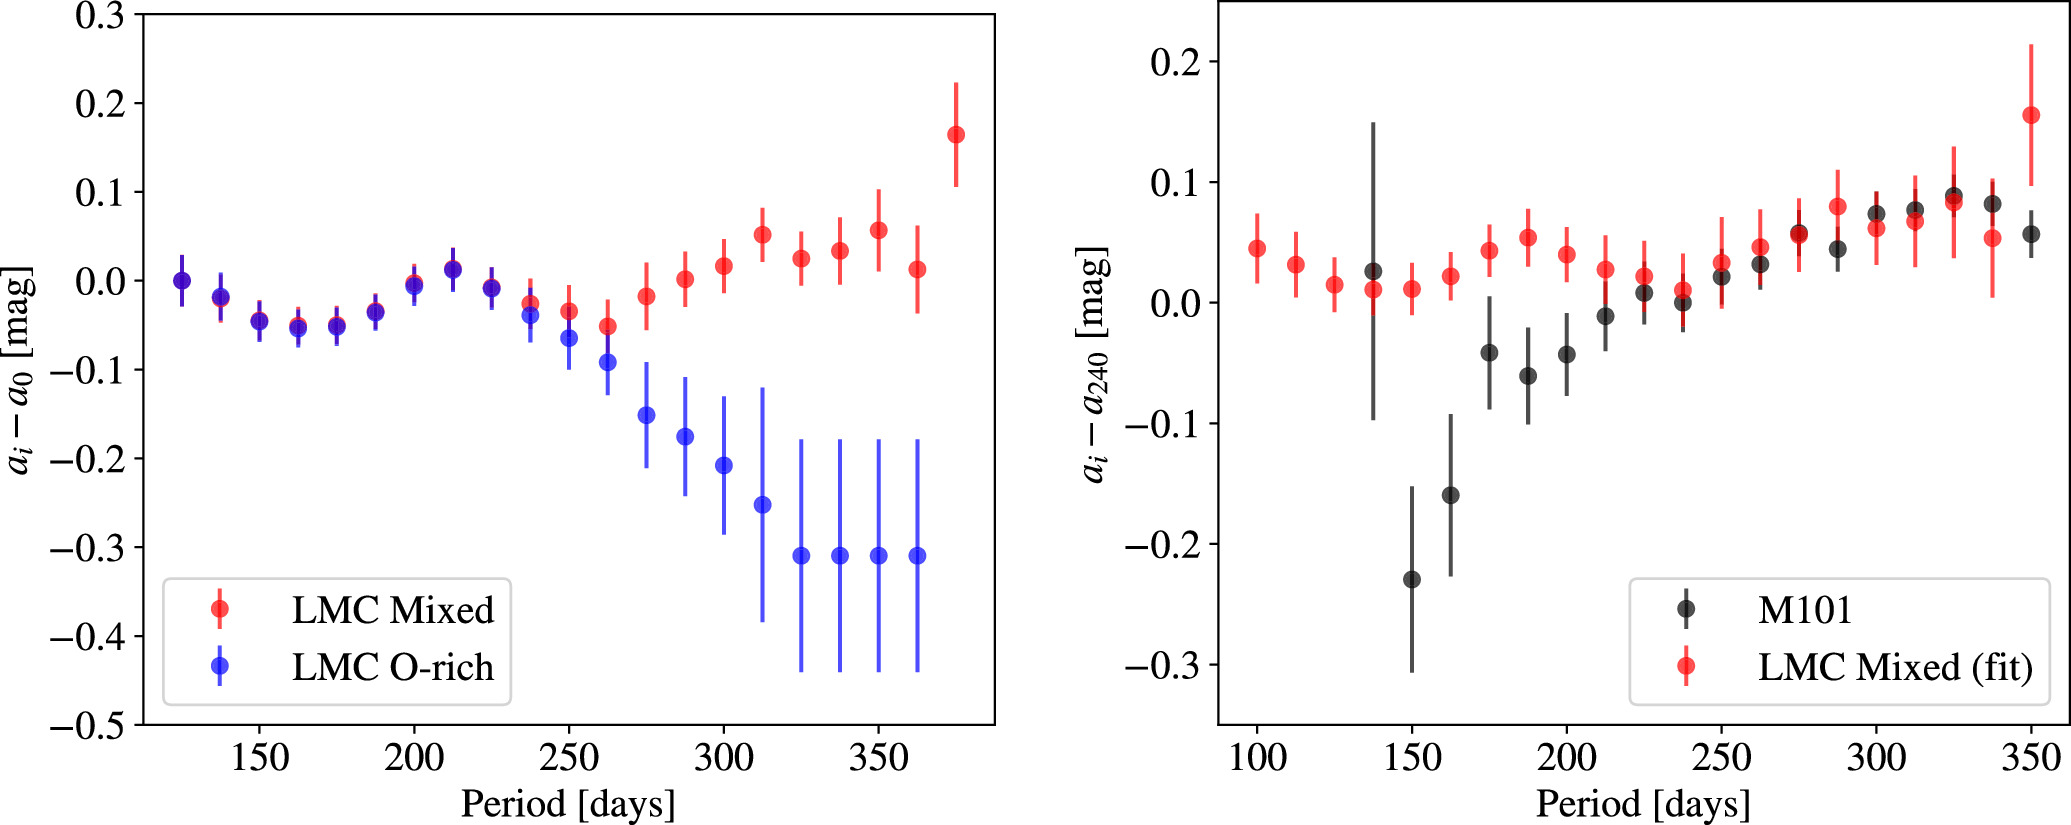
Figure 8. Left: the relationship between period and zero-point for the two LMC populations of Miras we used in the C-rich contamination model (spectrally classified O-rich) and a mixed population. ai is the zero-point at a particular period bin and a0 is the zero-point of the Mira PLR at 200 days. The mixed population consists of 33 C-rich Miras and 96 O-rich Miras that passed the period and amplitude cuts. Right: the same mixed LMC population curve but fit using Equation (5) to the M101 points after excluding all of the bins below the completeness limit and the last bin.
Download figure:
Standard image High-resolution image4. Sources of Systematic Uncertainty
4.1. Extinction
We correct for extinction from the Milky Way along our line of sight assuming an extinction to reddening ratio AV /E(B − V) = 3.1 and using the Ab /E(B − V) values for the WFC3 F110W and WFC3 F160W bands given in Table 6 of Schlafly & Finkbeiner (2011). The differential extinction between the hosts and the anchors and the variation in extinction within the anchor and host galaxies can have an effect on the measurements. Using the dust maps, we correct for the extinction along the line of sight within the Milky Way. We find F160W extinction values to NGC 4258, NGC 1559, and M101 of 0.008, 0.015, and 0.005 mag, respectively.
While this addresses the extinction along the line of sight from the Milky Way, the Schlafly & Finkbeiner (2011) dust maps do not account for extinction within the Mira host galaxies. Furthermore, with only two colors, we are unable to estimate the extinction of individual Miras using only our observations. Qualitatively, the Mira fields in the SN Ia hosts are relatively homogeneous in their surface brightness/dust distribution and are typically not located near dusty regions of the galaxy. Extinction in the NIR is usually also relatively small. Thus, we expect internal extinction to be of similar scale to the Milky Way line-of-sight extinction and to be relatively consistent from star to star. Based on the consistency of the relative distance moduli from the LMC and NGC 4258 (which is more representative of a typical SN Ia host), we estimate this internal extinction to be no more than ∼0.02 mag.
For Cepheids, the Wesenheit (reddening-free)  mean magnitudes are often used to fit the PLR. While Wesenheit JK (WJK) magnitudes appear to minimize the scatter of the Mira NIR PLR, there is evidence that a Mira PLR using Wesenheit JH (WJH) mean magnitudes shows a larger scatter than fitting a PLR using only the H-band mean magnitudes (see Yuan et al. 2017b, Figure 8). Thus, without a K-band equivalent, we use only F160W magnitudes for the PLR.
4.2. Metallicity
Theoretical models suggest that metallicity may have an effect on the Mira PLR (Wood 1990; Qin et al. 2018). However, this effect has generally not been confirmed by observational studies. Since there has been no significant metallicity effect observed for Mira variables in the NIR, we only include a statistical uncertainty (of ∼0.03 mag) to account for such a potential undiscovered effect. This upper limit is estimated from the level of consistency between AGB star PLRs in environments of varying metallicity. Goldman et al. (2019) found no discernible difference in the pulsational properties or the PLRs of stars in metal-poor (1.4% solar metallicity) and more metal-rich (50% solar) environments. Other studies have confirmed this when examining K-band PLRs of stars in the LMC, SMC, Galaxy, and Galactic globular clusters (Whitelock et al. 1994, 2008; Bhardwaj et al. 2019).
Though we do not know the metallicity dependence of the Mira PLR, we can approximate the metallicity of the Mira field in M101 to confirm that it falls within the range of environments in which the pulsation of AGB stars has previously been studied. Using the relationship derived by Kennicutt et al. (2003) from abundance measurements of H ii regions in M101, the metallicity (or more precisely, the oxygen abundance) as a function of radial distance is given by

where R is the radial distance from the center and R0 is the scale length of the galaxy. Assuming an M101 distance of 7.5 Mpc, R0 = 32.4 kpc. For the distances of the Mira field, this relation gives  –8.7, somewhere between solar and LMC metallicity. This is well within the range of previously studied AGB environmental metallicities, for which no discernible dependence was detected. Thus, it is unlikely that metallicity will have a measurable effect on the M101 distance.
Environmental oxygen abundance is known to affect the ratio of O- to C-rich AGB stars. Stars entering the AGB with a lower photospheric C/O ratio require more carbon to be dredged to the surface to become C-rich (stars with C/O >1 are considered C-rich and C/O <1 are O-rich). Galaxies with higher metallicity typically exhibit larger ratios of O- to C-rich Miras (Battinelli & Demers 2005; Hamren et al. 2015; Boyer et al. 2017). Thus, cleanly separating spectral types or correcting for C-rich contamination is more important in lower metallicity environments where C-rich Miras may be more common.
5. Determining the Hubble Constant
Determining H0 is typically a three-step (or rung) process in which geometric calibrations to the more common primary standard candles such as Miras are used to determine the absolute magnitude of the PLR. Then, we use Miras to solve for the peak SN Ia luminosity, MB 0. Finally, SNe Ia in the Hubble flow (the regime where recessional velocities can be primarily attributed to the expansion of the universe and not local gravitational interactions) measure H0 directly.
5.1. Anchors
In the first rung, we use the same anchors as Huang et al. (2020)—the water megamasers in NGC 4258 with distances determined in Pesce et al. (2020) and the detached eclipsing binary distance to the LMC from Pietrzyński et al. (2019), which are precise to 1.5% and 1.2%, respectively. The geometric distance to NGC 4258 is μN4258 = 29.397 ± 0.0324 mag and the geometric distance to the LMC is μLMC = 18.477 ± 0.004 (stat)±0.026 (sys) mag. A new set of WFC3/IR photometric zero-point calibrations has been published since Huang et al. (2020; previously the infinite aperture Vegamag zero-point for F160W was 24.6949 mag and it is currently 24.662 mag). Solving for a0, the absolute magnitude of the Mira PLR zero-point, while accounting for the new Vegamag zero-points, we find that a0 = −6.30 ± 0.053 mag using the LMC and a0 = −6.28 ± 0.043 mag for NGC 4258.
For the final Mira PLR zero-point, we take the weighted mean of these two calibrations, which gives

using inverse-variance weighting.
The Milky Way has been suggested as a potential third anchor for the Mira distance ladder by Sanders (2023), who derived a calibration of the Mira PLR using candidates from the Gaia long-period variable catalog (Mowlaviet al. 2018), single epoch NIR photometry from the Two Micron All Sky Survey, and parallaxes from Gaia. Their final results have a steeper slope than previous studies, which causes the variables to be fainter than the previous LMC calibrations at the short-period end.
However, several other works have shown that even with Gaia DR3, obtaining precise parallax distances to Miras and other very red AGB stars remains challenging (El-Badry et al. 2021; Andriantsaralaza et al. 2022; Maíz Apellániz 2022). El-Badry et al. (2021) used the nearly identical parallaxes of the binary companions to verify Gaia’s parallax measurements between pairs of stars, demonstrating that bright red stars (which include AGB stars such as Miras) with well-behaved uncertainties can still have parallax uncertainties underestimated by ∼30%–80%. Andriantsaralaza et al. (2022) confirmed this result when comparing Gaia parallaxes with very long baseline interferometry (VLBI) parallaxes of AGB stars with masing circumstellar envelopes. They showed empirically that parallax uncertainties for AGB stars are greatly underestimated, in agreement with theoretical models (Chiavassa et al. 2018). Andriantsaralaza et al. (2022) also found significant, asymmetrical errors for over 40% of their sample of AGB stars. While VLBI parallaxes (such as those in Andriantsaralaza et al. 2022) using maser emission in the circumstellar envelope of AGB stars can provide accurate parallaxes to nearby AGB stars, the subset of Miras with circumstellar maser emission is different from those that we used in the distance ladder.
These large uncertainties are expected for Gaia DR3 parallaxes—Galactic Miras exist at a confluence of several difficulties for Gaia. They are bright, very red, extended objects with changing chromaticity, all of which contribute to parallax errors and/or uncertainties. Miras have large convection cells, and many have radii >1 au. As parallax and radius (angular size) both scale as ∼1/d, this means that Miras for which parallaxes can be obtained will also be resolved and convection will cause their photo centers to move (e.g., Chiavassa et al. 2018).
While the Milky Way may eventually serve as a reliable third anchor for the Mira distance ladder, given the disagreement with previous literature findings, the large scatter in the Mira PLR from Gaia (as evidenced by Figure 5 of Sanders 2023), and large individual uncertainties of objects fit in the Gaia calibration, we currently use only NGC 4258 and the LMC as anchors in our analysis.
5.2. SN Ia Calibrators
In the second rung, we compare the apparent magnitude zero-point of the Mira PLRs, ahost, with the apparent standardized SN Ia magnitudes,  , in the same galaxies.
  is the maximum-light apparent magnitude of the SN Ia, which has been corrected for variations of fiducial color, luminosity, and host dependence in accordance with the guidelines of Pantheon+ (Brout et al. 2022; Scolnic et al. 2022). Similar to Scolnic et al. (2023), we also define the difference in apparent magnitude for the two standard candles (Miras and SN Ia) in the same host, ΔS, which is

We can then calculate  , the weighted average of ΔS over the hosts with the weights again given by inverse-variance weighting. This is the weighted average of the difference in apparent magnitude for individual hosts using the sum of the inverse error squared for each component’s weight. In Huang et al. (2020), the single calibrating SN Ia was SN 2005df, with
  mag (Scolnic et al. 2022). Again updating this with the new Vegamag zero-point for F160W, and using Miras with 260 < P < 400 days. This was the completeness range for NGC 1559 (the host of SN 2005df) determined via the boxcar fit and used in the baseline distance determination to NGC 1559. With this period range of Miras, we find aN1559 = 25.110 ± 0.064 mag, which gives ΔS = 12.966 ± 0.107 mag from this galaxy.
From Scolnic et al. (2023), the color and light-curve corrected peak magnitude of the SN Ia in M101, SN 2011fe, is 9.808 ± 0.116 mag. From the Miras with 240 < P < 400 days in M101 (again with the period range estimated using the boxcar fits), we determine aM101 = 22.809 ± 0.053 mag and ΔS = 13.001 ± 0.127 mag. The final PLR determined for M101 is shown in Figure 9. Taking the weighted mean of these two values gives us  mag. This
  is the mean difference in brightness between the peak luminosity of an SN Ia and the mean magnitude of a 200 day Mira.
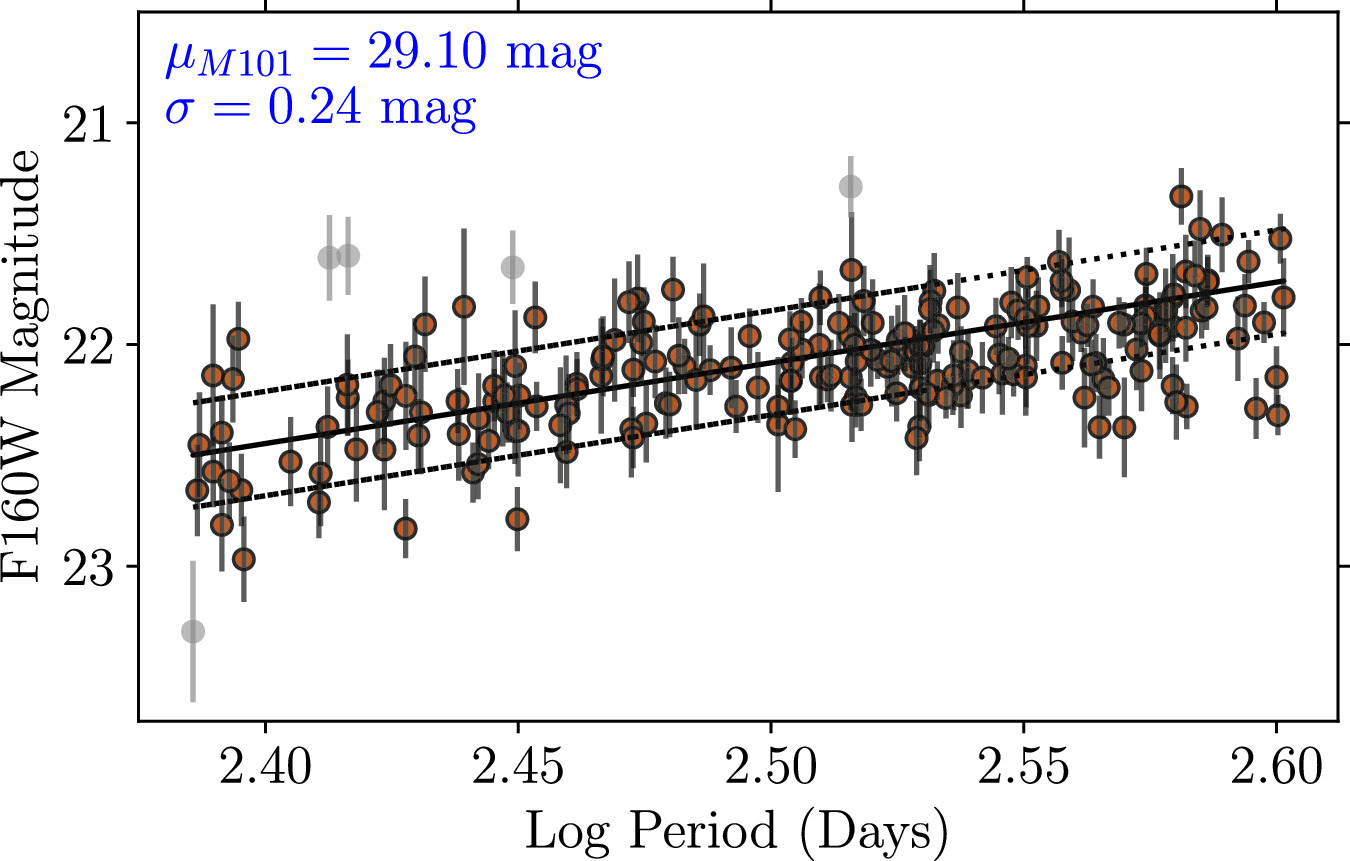
Figure 9. PLR with mean crowding correction of Miras 240 < P < 400 days used in the baseline H0 result. The red points are Miras used in the final fit and gray points are stars that have been removed through iterative 3σ clipping.
Download figure:
Standard image High-resolution imageThe geometric calibration from the anchors and the magnitude difference in the SN Ia hosts yield  , the fiducial peak SN Ia luminosity, as follows:

from which we obtain  mag.
mag.
5.3. Hubble Flow SNe
In the third rung, SNe Ia in the Hubble flow—where their recessional velocities are dominated by the expansion of the Universe rather than by local peculiar gravitational interactions—are used to measure aB , the intercept of the magnitude (or distance) and redshift relation (Hubble diagram). Thus, this rung is completely separable from the previous two and does not directly involve Miras. For an arbitrary expansion history and redshift, aB is given by
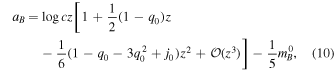
where q0 is known as the deceleration parameter, and j0 is the jerk—the second and third order time derivatives of the scale factor, respectively (Visser 2004). For measuring H0, we consider the small redshift limit (z ≈ 0). This equation then approximates to

where z is redshift and includes peculiar velocity corrections.
In our determination of H0, we use the baseline value of aB from Riess et al. (2022),

which is determined from the Hubble diagram of 277 SNe Ia in the Hubble flow. These are SNe from the Pantheon+ sample (Scolnic et al. 2022; Brout et al. 2022), which have 0.0233 < z < 0.15, pass the same quality cuts, and share the properties of Cepheid hosts, which are in late-type galaxies (Riess et al. 2022). Despite the fact that Miras are an ubiquitous older population, this value for aB is appropriate for our determination since the two local Mira calibrators (NGC 1559 and M101) are both also Cepheid hosts. However, if the sample of Mira SN Ia hosts is eventually expanded to include early-type hosts as well then it may be more appropriate to include an aB value determined using Hubble flow SNe Ia in all host types.
5.4. Sources of Uncertainty
Table 3 contains a summary of the various sources of uncertainty in our measurement in comparison to the previous Mira SN H0 measurement from Huang et al. (2020). The primary reduction in uncertainty originates from the addition of a second SN Ia calibrator. In addition, the constraint on the peak magnitude of SN 2005df (the SN Ia in NGC 1559) has improved. Huang et al. (2020) used the Pantheon+ calibration of mB = 12.14 ± 0.11 mag from Scolnic et al. (2018). In the new Pantheon+ SN Ia sample, the peak magnitude for this SN is now mB = 12.141 ± 0.086 mag.
Table 3. Sources of Uncertainty
| Term | Description | Huang+ (2020) | This Work | ||
|---|---|---|---|---|---|
| LMC | NGC 4258 | LMC | NGC 4258 | ||
| σμ,anchor [mag] | Anchor distance | 0.0263 | 0.032 | 0.0263 | 0.0324 |
| σPLR,anchor [mag] | Mean of the PLR in the anchor galaxy | 0.010 | 0.017 | 0.010 | 0.017 |
| σanchor [mag] | Total anchor uncertainty | 0.022 | 0.022 | ||
| σPLR [mag] | PLR slope, differential extinction, metallicity | 0.047 | 0.047 | ||
| σPL,hosts [mag] | Mean of PLR in SN Ia host(s) | 0.038 | 0.015 | ||
 [mag] [mag] | Mean of SN Ia calibrator(s) (# SN) | 0.11 (1) | 0.069 (2) | ||
| σaB [mag] | Intercept of SN Ia Hubble diagram | 0.00176 | 0.0085 | ||
| Total systematic uncertainty [mag] | 0.045 | 0.045 | |||
| Total statistical uncertainty [mag] | 0.116 | 0.074 | |||
Total uncertainty on  [%] [%] | 5.5 | 4.1 | |||
Note. The error budget for our measurement compared with the error budget for the previous Mira-based H0 from Huang et al. (2020). Numbers are approximations for comparison since the two papers follow two slightly different procedures (Huang et al. 2020 did not use Monte Carlo bootstrapping or ΔS formulation) for determining H0.
Download table as: ASCIITypeset image
The systematic uncertainties primarily originate from the uncertainty in the slope of the PLR (which is relatively small, at ∼0.01 mag) and the uncertainty in the differential extinction and metallicity between the anchors and the hosts. Unlike NGC 4258 and the SN Ia host galaxies, which are late-type spiral galaxies, the LMC is an irregular dwarf galaxy. In Huang et al. (2018), we investigated the potential effects of the different environments by comparing the relative distance modulus of the LMC and NGC 4258 determined using Miras with the difference in their distance moduli determined using geometric methods. We found no indication of a systematic difference and that these two relative distances were consistent within their statistical uncertainties.
This agrees well with the assumption that internal (to the host or anchor galaxy) extinction is low in the NIR in the locations of short-period Miras and that there is little dependence of the PLR on metallicity. Therefore, our systematic uncertainty budget is relatively conservative.
6. Results and Discussion
6.1. The Final Mira Sample
Our final sample consists of 211 Miras with periods ranging from 200–500 days. Their properties are listed in Table 4. Figure 10 shows the composite light curve of all of the Miras plotted as a function of phase for a range of period bins. These light curves have not been scaled by amplitude and are thus also representative of the spread in amplitudes for our sample. We find that the light curves are approximately sinusoidal in F160W. In addition, this allows us to verify the phasing and period determinations since the observations span between six and 15 cycles, depending on the period of each Mira.
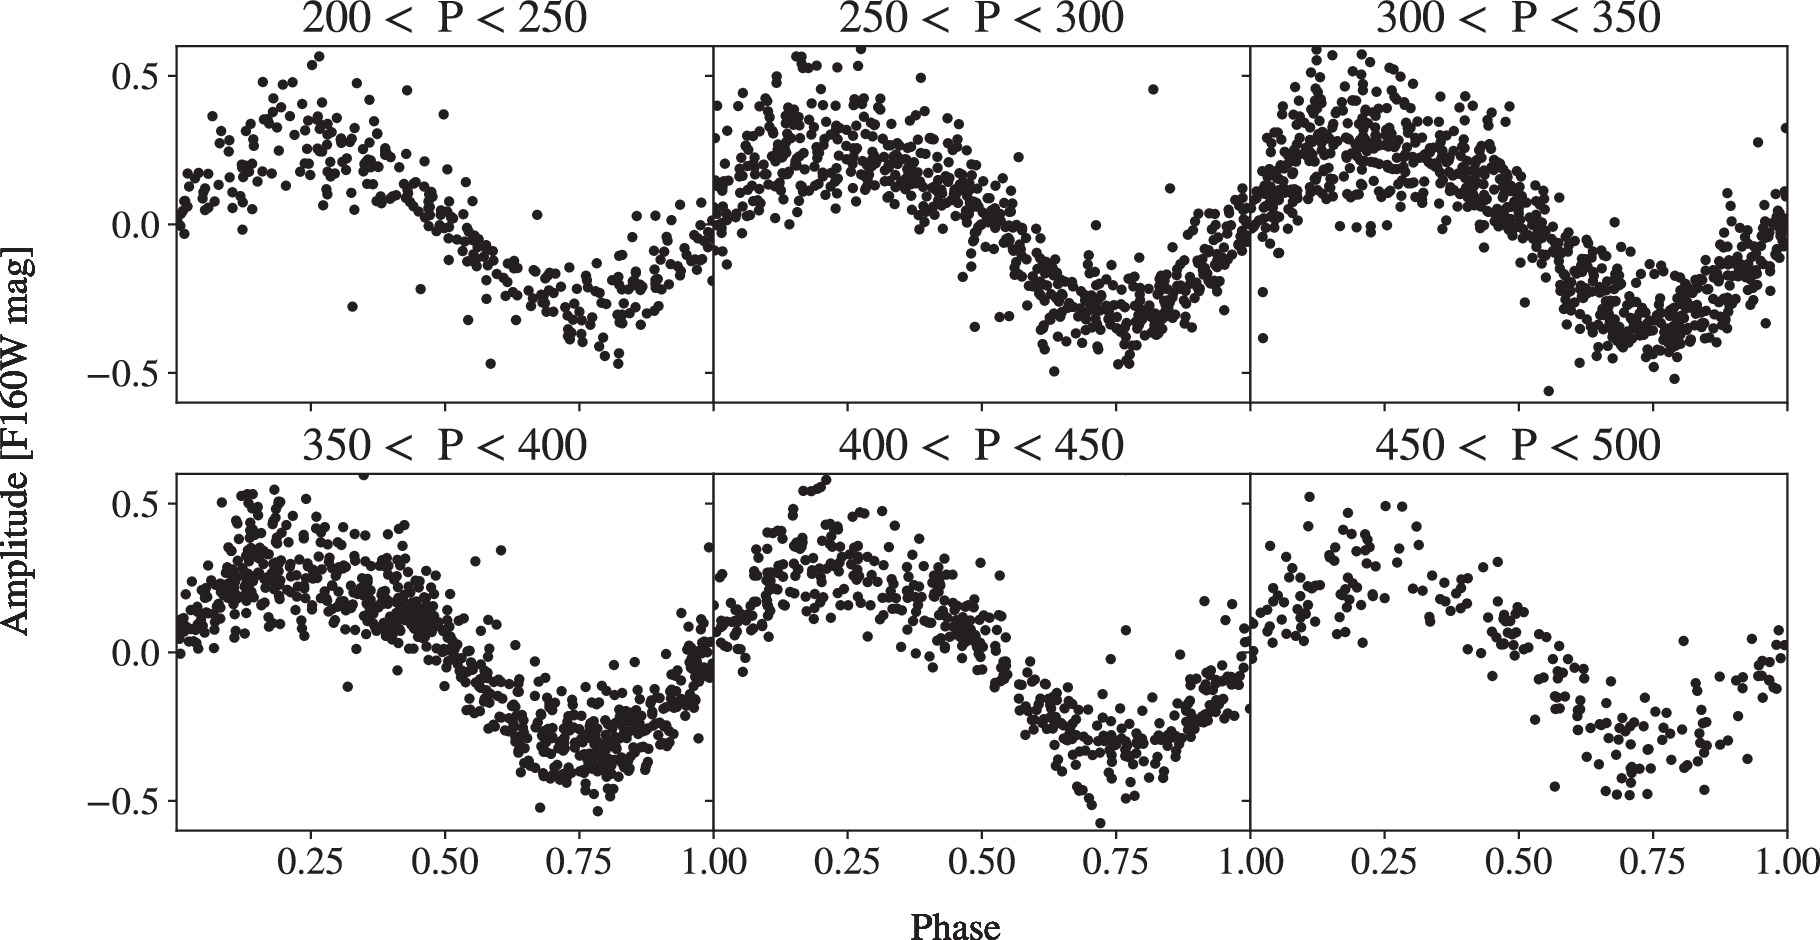
Figure 10. The composite, phased light curves of Miras at a range of periods in our sample and exhibiting a roughly sinusoidal variation. Mean magnitudes have been subtracted and individual observations converted to their fit phase, but amplitudes of the stacked Miras have not been scaled.
Download figure:
Standard image High-resolution imageTable 4. Final Mira Sample
| Star ID | α | δ | Period | X | Y | F160W | σF160W | Amp | Δmb |
|---|---|---|---|---|---|---|---|---|---|
| (J2000) | (J2000) | (days) | (pix) | (pix) | (mag) | (mag) | (mag) | (mag) | |
| 11847 | 14h3m8 |

| 278.797 | 955.520 | 343.315 | 22.202 | 0.023 | 0.518 | 0.055 |
| 15574 | 14h3m07 | +54°17′03 | 375.028 | 839.670 | 434.390 | 21.745 | 0.039 | 0.784 | 0.079 |
| 17867 | 14h3m10 | +54°16′54 | 327.769 | 1096.264 | 488.428 | 21.906 | 0.017 | 0.489 | 0.056 |
| 19646 | 14h3m07 | +54°16′51 | 323.505 | 884.815 | 529.661 | 22.125 | 0.031 | 0.469 | 0.023 |
| 20101 | 14h3m04 | +54°16′53 | 301.450 | 630.333 | 541.294 | 22.212 | 0.026 | 0.703 | 0.053 |
| 20855 | 14h3m10 | +54°16′45 | 339.800 | 1121.022 | 558.962 | 22.190 | 0.026 | 0.760 | 0.038 |
| 23593 | 14h3m08 | +54°16′39 | 375.068 | 994.737 | 623.863 | 21.824 | 0.038 | 0.619 | 0.048 |
| 23699 | 14h3m00 | +54°16′46 | 269.624 | 389.271 | 627.473 | 22.101 | 0.040 | 0.805 | 0.205 |
| 23734 | 14h3m00 | +54°16′46 | 328.050 | 367.864 | 628.169 | 21.572 | 0.049 | 0.561 | 0.092 |
| 24253 | 14h3m04 | +54°16′41 | 344.309 | 658.342 | 639.815 | 21.787 | 0.021 | 0.664 | 0.046 |
| 24555 | 14h3m10 | +54°16′35 | 278.777 | 1074.337 | 646.583 | 22.124 | 0.018 | 0.455 | 0.063 |
Note. Miras used in the distance measurement to M101. F160W magnitudes are calibrated in Vegamag but do not include the crowding corrections. σF160W includes only the photometric uncertainties (when fitting we also include an intrinsic PLR uncertainty of ∼0.12 mag). Δmb is the mean crowding correction for each Mira derived from artificial star tests.
Only a portion of this table is shown here to demonstrate its form and content. A machine-readable version of the full table is available.
Download table as: DataTypeset image
6.2. The Mira Distance to M101
Using Equations (2) and (7), and applying a bootstrap Monte Carlo fit of the crowding corrections as described in Section 3.2, we determine the distance modulus to M101 of

which includes systematic and statistical uncertainties. If we instead fit for the distance modulus similar to Huang et al. (2020) by using linear regression, mean crowding corrections, and 3σ clipping where we remove one outlier at a time, we find that the distance modulus is μM101 = 29.10 ± 0.06 mag, which is identical to bootstrapping result. The fit for this result is shown in Figure 9.
While this is the first Mira distance to this galaxy, there have been numerous previous distance measurements to M101 using a variety of other methods and distance indicators. Here, we focus on comparisons with literature measurements made using Cepheids and TRGB since these are the intermediate distance indicators most commonly used in the extragalactic distance ladder. Table 5 summarizes the literature distances determined to M101 using these indicators. A comparison of our result and these literature distances is shown in Figure 11 along with the weighted (by the uncertainty) mean of all of the TRGB and Cepheid distance moduli to this galaxy (μM101 = 29.19 ± 0.01 mag) and the weighted mean Cepheid and TRGB distance modulus when using only measurements from the past 15 yr (μM101 = 29.15 ± 0.02 mag). Our results are within 1σ from the mean of the recent distance moduli measured for this galaxy, and in 2σ agreement with nearly all of the recent measurements. The agreement with literature distance moduli is even better when taking an unweighted average of the recent measurements, which gives μM101 = 29.13 ± 0.02 mag.
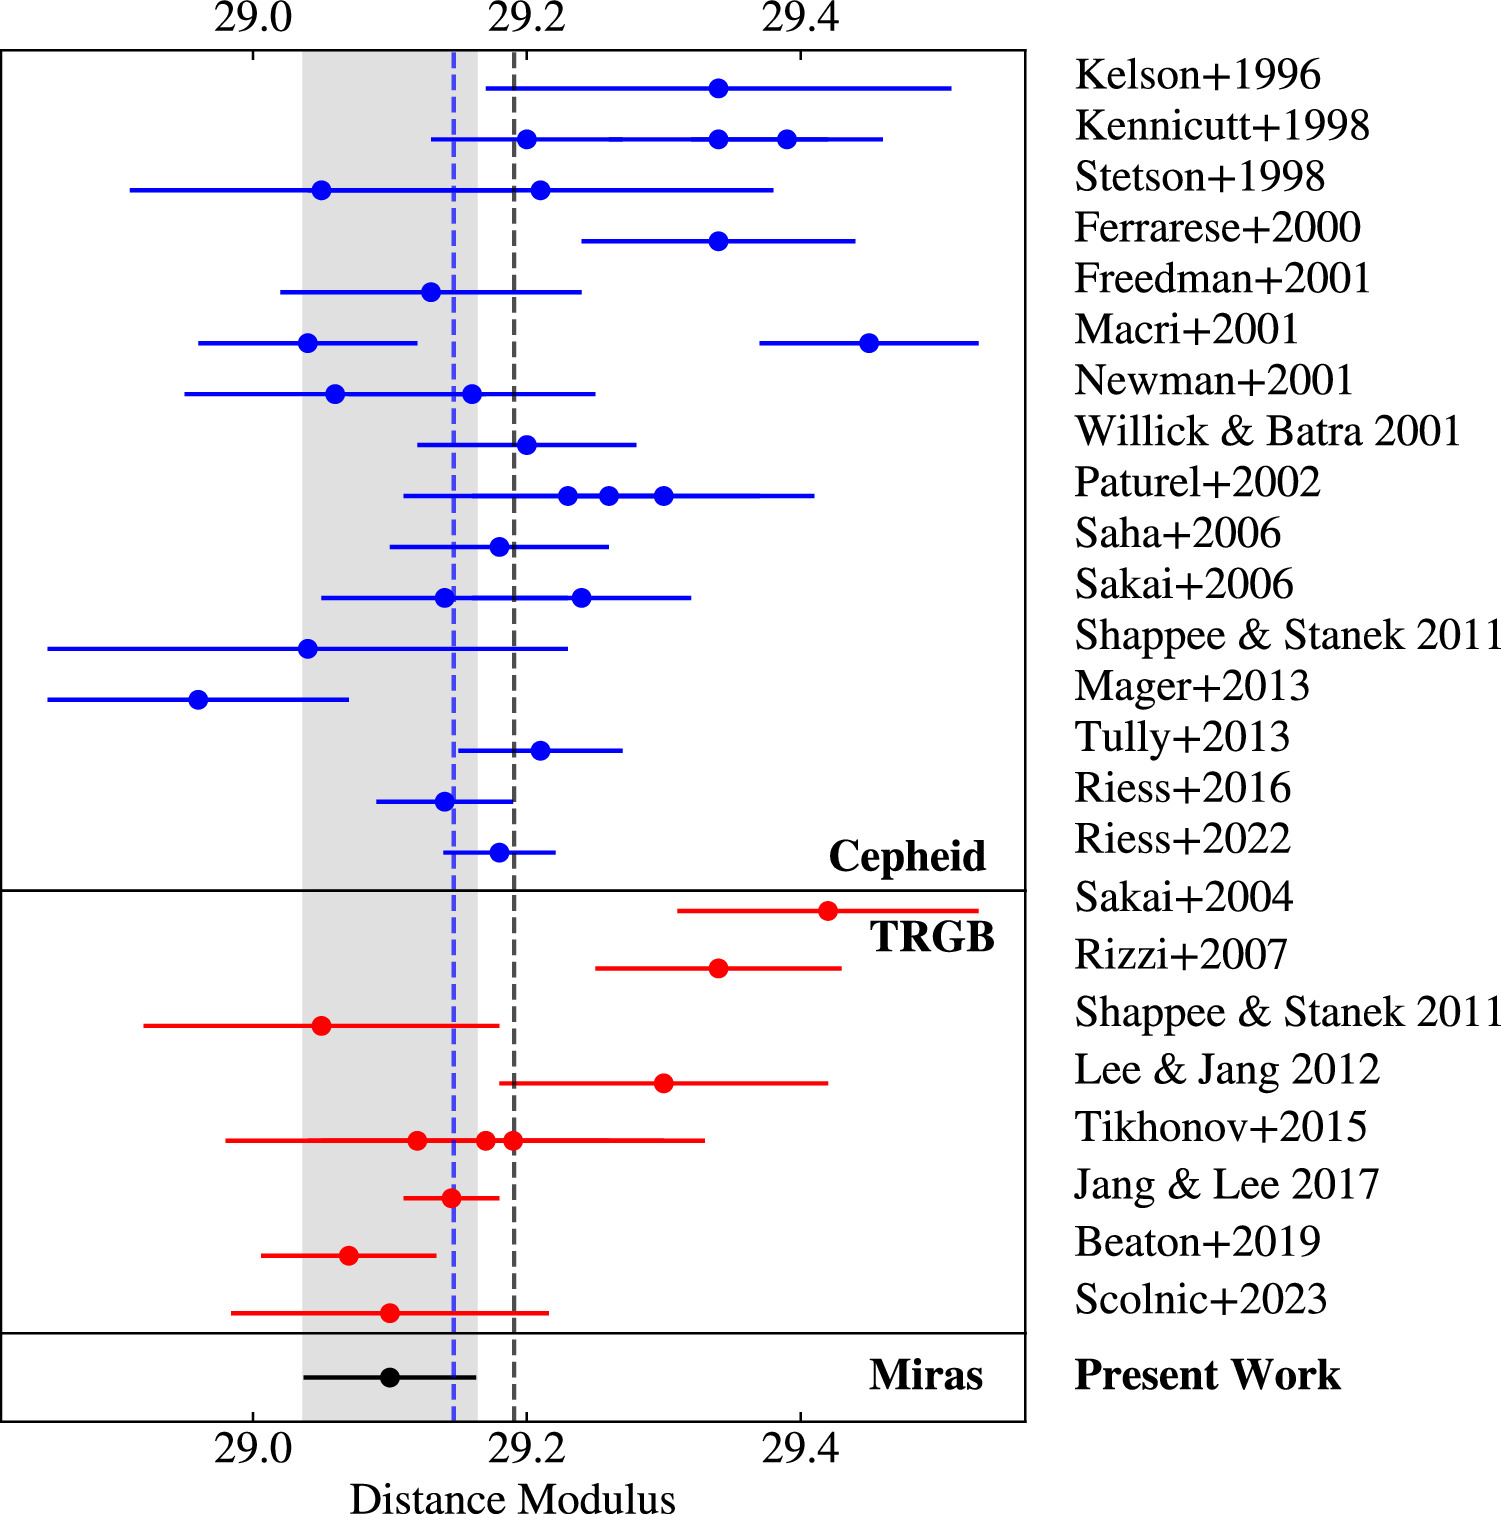
Figure 11. Literature distance moduli to M101 measured using Cepheid (blue) and TRGB (red). Gray-shaded region and black point show the measurement from this work (Miras) of μM101 = 29.10 ± 0.06 mag. The weighted mean distance modulus of all of the previously published measurements is μM101 = 29.19 ± 0.01 mag (black-dashed line) and the weighted mean distance modulus of the measurements published in the past 15 yr for all calibrators is μM101 = 29.15 ± 0.02 mag (blue-dashed line) and falls within the 1σ of the distance derived here using Miras.
Download figure:
Standard image High-resolution imageTable 5. Measured Distances to M101
| Reference | Distance Modulus (mag) | Notes |
|---|---|---|
| Cepheid Distances | ||
| Kelson et al. (1996) | 29.34 ± 0.17 | |
| Stetson et al. (1998) | 29.05 ± 0.14 | |
| 29.21 ± 0.17 | ||
| Kennicutt et al. (1998) | 29.20 ± 0.07 | |
| 29.34 ± 0.08 | ||
| 29.39 ± 0.07 | ||
| Ferrarese et al. (2000b) | 29.34 ± 0.10 | |
| Macri et al. (2001) | 29.04 ± 0.08 | Inner field, F160W |
| 29.45 ± 0.08 | Outer field, F160W | |
| Newman et al. (2001) | 29.06 ± 0.11 | |
| 29.16 ± 0.09 | ||
| Willick & Batra (2001) | 29.20 ± 0.08 | |
| Freedman et al. (2001) | 29.13 ± 0.11 | Final result of the HST Key Project |
| Paturel et al. (2002) | 29.30 ± 0.07 | |
| 29.23 ± 0.07 | ||
| 29.26 ± 0.15 | ||
| Sakai et al. (2004) | 29.14 ± 0.09 | |
| 29.24 ± 0.08 | ||
| Saha et al. (2006) | 29.18 ± 0.08 | |
| Shappee & Stanek (2011) | 29.04 ± 0.05 (stat) ± 0.18 (sys) | |
| Mager et al. (2013) | 28.96 ± 0.11 | |
| Tully et al. (2013) | 29.21 ± 0.06 | |
| Nataf (2015) | 29.20 ± 0.03 | Using the Cepheid sample from Shappee & Stanek (2011) |
| Riess et al. (2016) | 29.14 ± 0.05 | SH0ES 2016 result |
| Riess et al. (2022) | 29.178 ± 0.041 | Distance without the inclusion of SN, SH0ES 2022 result |
| TRGB distances | ||
| Sakai et al. (2004) | 29.42 ± 0.11 | |
| Rizzi et al. (2007) | 29.34 ± 0.09 | |
| Shappee & Stanek (2011) | 29.05 ± 0.06 (stat) ± 0.12 (sys) | |
| Lee & Jang (2012) | 29.30 ± 0.01 (stat) ±0.12 (sys) | |
| Tikhonov et al. (2015) | 29.12 ± 0.14 | |
| 29.17 ± 0.13 | ||
| 29.19 ± 0.14 | ||
| Jang & Lee (2017) | ||
| 29.145 ± 0.035 | ||
| Beaton et al. (2019) | 29.07 ± 0.04 (stat) ±0.05 (sys) | CCHP result |
| Scolnic et al. (2023) | 29.10 ± 0.116 | Assuming tip luminosity  mag mag |
| Mira distances | ||
| Huang et al. 2023 (this work) | 29.10 ± 0.06 | |
Note. Distances published before 2019 are compiled from the NASA/IPAC Extragalactic Database.
Download table as: ASCIITypeset image
Since there are no previous Mira distances to the galaxy, in Table 5 and Figure 11 we have used the final TRGB and Cepheid distances derived by the authors without attempting standardization. However, a direct comparison of the TRGB apparent magnitudes (which can eliminate some potential zero-point calibration differences) can be found in Beaton et al. (2019). We also refer the reader to Beaton et al. (2019) for a detailed review and context of TRGB and Cepheid (Leavitt law) distances published before 2019. Since Beaton et al. (2019), there has also been one new Cepheid distance (Riess et al. 2022) and one new TRGB distance (Scolnic et al. 2023), which we will briefly discuss here.
Riess et al. (2022) fit a Leavitt law using a total of 259 Cepheids found using observations in two M101 fields (called Field 1 and Field 2) on opposite sides of the nucleus of the galaxy. The original observing campaign was carried out in 2006 and each field was visited 12 times with a temporal spacing of ∼1–5 days between visits. Riess et al. (2022) concluded that even with the addition of two later epochs of observation, which were spaced by 1 week, the overall baseline was insufficient to provide reliable periods for Cepheids with P > 35 days. Therefore, they excluded M101 Cepheids with P > 35 days from their analysis, approximately 10% of the Riess et al. (2016) Cepheid sample for this galaxy. M101 was also one of the two nearest SN Ia hosts, so the mean Cepheid period for this galaxy was shorter, at 15.8 days, compared to an average of 36.5 days across the entire SN Ia calibrator sample. The Cepheid-calibrated distance to this galaxy that they derive without the inclusion of any SNe Ia is μM101 = 29.178 ± 0.041 mag and is in relatively good agreement with our results, with about a 1.2σ difference. The standard process for detecting and classifying the Cepheids is explained in greater detail in Hoffmann et al. (2016) and Riess et al. (2022).
The second recent measurement from Scolnic et al. (2023) uses an unsupervised algorithm called Comparative Analysis of TRGBs (CATs) to reduce variance in the distances derived from different TRGB halo fields. They define a quantity R, known as the contrast ratio, which is the ratio of the number of stars 0.5 mag below versus above the tip. For M101, They reported a raw (uncorrected for extinction) I-band TRGB magnitude of mI,TRGB = 25.080 ± 0.111 mag and R = 4.4. Using their Equation (1), this can be standardized to give  mag. Their absolute geometric calibration from NGC 4258 gives a fiducial tip luminosity of
  mag. The resulting distance modulus obtained with this combination of apparent magnitude and tip luminosity is μM101 = 29.10 ± 0.115 mag, which is nearly identical to the Mira distance to this galaxy.
6.3. Hubble Constant Measurement
With the peak SN Ia magnitude determined in Section 5.2 from the combination of the first two rungs and the aB determined from the Hubble diagram of SN Ia as described in Section 5.3, we can solve for H0 using

which gives us

This result includes both systematic (discussed in Section 4) and statistical uncertainties and is a 4.1% measurement of H0. Like the previous Mira-based H0 measurement from Huang et al. (2020), the uncertainty remains dominated by the statistical uncertainty in the peak magnitude of the SN Ia calibrators. However, the addition of a second SN Ia calibrator, has decreased the overall error budget by  from 5.5% to 4.1%.
This result is in very good agreement with the most recent Cepheid measurement from the SH0ES team (Riess et al. 2022), which has a baseline result of 73.04 ± 1.04 km s−1 Mpc−1. More relevant is the Cepheid result that only uses the same anchors as we use, NGC 4258 and LMC, 73.35 ± 1.17 km s−1 Mpc−1, which also agrees well with our findings. Results from TRGB from the CCHP, EDD, and CATs (Freedman et al. 2019; Anand et al. 2022; Scolnic et al. 2023, respectively) sit under 1σ from our measurement.
We can also test the hypothesis that the local measurement of H0 is greater than the early Universe value. The null hypothesis states that our measurement does not exceed Planck’s. We then determine the probability of rejecting that null hypothesis,

where  and
and  are the posterior probabilities of the Planck measurement (assumed to be Gaussian with mean and standard deviation from H0,Planck = 67.4 ± 0.5 km s−1 Mpc−1) and our measurement, respectively. As a result, we find that there is a <5% chance that our value is lower than Planck’s (Planck Collaboration et al. 2020). On the other hand, repeating this analysis but with a comparison to SH0ES instead, we find that there is virtually no preference for a higher or lower value. Overall, this indicates that our result reinforces the current tension (i.e., that the local value of H0 exceeds the CMB-based value) with 95% confidence. Greater precision will be necessary for more definitive results in this fast-evolving field.
7. Summary and Conclusions
We use a combination of recent and archival HST WFC3/IR F110W and F160W observations to discover and characterize Miras in the giant spiral galaxy M101, host to SN 2011fe. The combination of multiple observing campaigns—some originally obtained to study the late-time light curve of SN 2011fe—results in a baseline of up to ∼2900 days for regions of the SN field with the maximum observational overlap. From an initial sample of ∼3000 candidate variable stars, we create a list of 288 oxygen-rich Mira candidates with derived periods ranging from 200–500 days. We then use the dependence of zero-point as a function of period to help determine upper (potential faint bias due to C-rich Mira contamination) and lower (potential bright bias due to incompleteness) period bounds of 240–400 days for the final fit. The 211 Miras with periods within this range are then used to fit a PLR to this galaxy.
Combined with the absolute calibration from the LMC and NGC 4258 samples obtained in Huang et al. (2018), these Miras are then used to derive an independent distance measurement to M101 (the first with Mira variables) of μM101 = 29.10 ± 0.06 mag, which is in 1σ agreement with the weighted average of recent literature Cepheid and TRGB distances to this galaxy.
We also use the Mira measurement to calibrate the luminosity of its SN Ia, SN 2011fe, and find  mag. This is the second SN Ia host galaxy, after NGC 1559 (Huang et al. 2020), with a Mira distance. When taking the weighted average of both SN Ia peak luminosities, we find
  mag. With the intercept of the Hubble diagram, aB
= 0.714158 ± 0.0085 (Riess et al. 2022), determined from 277 SNe from the Pantheon+ sample (Scolnic et al. 2022; Brout et al. 2022), we find H0 = 72.37 ± 2.97 km−1s−1 Mpc, a 4.1% measurement of H0 using only geometry, Miras, and SNe Ia. This is an approximately
mag. With the intercept of the Hubble diagram, aB
= 0.714158 ± 0.0085 (Riess et al. 2022), determined from 277 SNe from the Pantheon+ sample (Scolnic et al. 2022; Brout et al. 2022), we find H0 = 72.37 ± 2.97 km−1s−1 Mpc, a 4.1% measurement of H0 using only geometry, Miras, and SNe Ia. This is an approximately  reduction in uncertainty from the previous result of Huang et al. (2020) and is consistent with the measurement being dominated by the statistical uncertainty in the peak SN Ia magnitude.
The H0 value obtained here, H0 = 72.37 ± 2.97 km s−1 Mpc−1, agrees well with the baseline SH0ES measurement of 73.04 ± 1.04 km s−1 Mpc−1 as well as the NGC 4258 + LMC only value of 73.35 ± 1.17 km s−1 Mpc−1 (Riess et al. 2022). Our measurement also agrees to within 1σ with the value obtained by CCHP using TRGB, H0 = 69.8 ± 1.9 km s−1 Mpc−1, and thus, does not definitively address the smaller local disagreement between the Cepheid-based SH0ES and the TRGB-based CCHP measurements. However, the result derived here does corroborate previous findings that the local value is higher than the early Universe Planck result at a 95% confidence level.
Acknowledgments
C.D.H. thanks the anonymous referee for their helpful comments and suggestions and Andrea Sacchi and Catherine Zucker for their helpful discussions and is deeply grateful to Odin Snowfoot and Nikhil Anand for their unwavering support during the writing of this paper. P.A.W. and J.W.M. acknowledge research support from the National Research Foundation. Support for HST programs AR-16132 and GO-16744 was provided by NASA through a grant from the Space Telescope Science Institute, which is operated by the Association of Universities for Research in Astronomy, Inc., under NASA contract No. NAS5-26555. This research has made use of Astropy, a community-developed core Python package of Astronomy (Astropy Collaboration et al. 2018), and data obtained from the Mikulski Archive for Space Telescopes (MAST) at the Space Telescope Science Institute.
Facility: HST(WFC3/IR) - Hubble Space Telescope satellite.
Software: Astropy (Astropy Collaboration et al. 2013, 2018), Matplotlib (Hunter 2007), NumPy (Harris et al. 2020), DAOPHOT Stetson (1987, 1994).
Footnotes
- 8