Abstract
We present supernova (SN) 2023ufx, a unique Type IIP SN with the shortest known plateau duration (tPT ∼ 47 days), a luminous V-band peak (MV = −18.42 ± 0.08 mag), and a rapid early decline rate (s1 = 3.47 ± 0.09 mag (50 days)−1). By comparing observed photometry to a hydrodynamic MESA+STELLA model grid, we constrain the progenitor to be a massive red supergiant with MZAMS ∼ 19–25 M⊙. Independent comparisons with nebular spectral models also suggest an initial He-core mass of ∼6 M⊙, and thus a massive progenitor. For a Type IIP, SN 2023ufx produced an unusually high amount of nickel (56Ni) ∼0.14 ± 0.02 M⊙, during the explosion. We find that the short plateau duration in SN 2023ufx can be explained with the presence of a small hydrogen envelope ( ∼ 1.2 M⊙), suggesting partial stripping of the progenitor. About ∼0.09 M⊙ of circumstellar material through mass loss from late-time stellar evolution of the progenitor is needed to fit the early time (≲10 days) pseudo-bolometric light curve. Nebular line diagnostics of broad and multipeak components of [O i] λλ6300, 6364, Hα, and [Ca ii] λλ7291, 7323 suggest that the explosion of SN 2023ufx could be inherently asymmetric, preferentially ejecting material along our line of sight.
Original content from this work may be used under the terms of the Creative Commons Attribution 4.0 licence. Any further distribution of this work must maintain attribution to the author(s) and the title of the work, journal citation and DOI.
1. Introduction
Most massive stars (≳8 M⊙) evolve rapidly, culminating in a cataclysmic core-collapse supernova (CCSN) explosion. Among these CCSNe, hydrogen-rich Type II SNe (SNe II) are the most commonly observed (e.g., W. Li et al. 2011; N. Smith et al. 2011; I. Shivvers et al. 2017). The amount of hydrogen at core-collapse likely results in the diversity of observed subtypes of SNe II (see I. Arcavi 2017, for a review). Based on the shape of their light curves, R. Barbon et al. (1979) first proposed a division of SNe II into Type IIP (SNe IIP) and Type IIL (SNe IIL).
In the SNe IIP subtype, the SN luminosity generally plateaus for ∼100 days after maximum as the ionized hydrogen in the envelope recombines (e.g., D. V. Popov 1993; D. Kasen & S. E. Woosley 2009; L. Dessart & D. J. Hillier 2010; J. A. Goldberg et al. 2019). The subtype SNe IIL on the other hand shows a linear decline in luminosity after a rapid rise to peak luminosity (R. Barbon et al. 1979; A. V. Filippenko 1997). The stripped-envelope (SE) subtype SNe IIb retains only a few percent of the initial hydrogen envelope. Spectroscopically they show clear evidence for hydrogen and helium in the initial phases, but later the hydrogen lines become weak or absent (e.g., A. V. Filippenko et al. 1993).
While SNe IIP and IIL were originally suggested to be two distinct classes (e.g., I. Arcavi et al. 2012; T. Faran et al. 2014a, 2014b), larger statistical studies of IIP and IIL populations at optical wavelengths have supported a more continuous distribution of properties (F. Patat et al. 1994; J. P. Anderson et al. 2014; N. E. Sanders et al. 2015; S. Valenti et al. 2015, 2016; L. Galbany et al. 2016). SNe IIP and IIL show a continuous range of spectroscopic properties in the optical regime (e.g., C. P. Gutiérrez et al. 2017a, 2017b), but at near-infrared (NIR) wavelengths, a possible dichotomy has been reported between the spectroscopic properties of SNe IIP and IIL, although with a much smaller sample size than corresponding optical data (S. Davis et al. 2019). This emphasizes the need for more complementary and contemporaneous observations of SNe II at NIR and optical wavelengths.
Hydrogen-rich SNe II that show narrow H emission lines indicating the presence of strong circumstellar material (CSM) interaction are classified as IIn (see E. M. Schlegel 1990; N. Smith 2017, for a review). Even in the absence of such narrow emission lines, hydrodynamic modeling of other SNe II (IIP/L) have suggested that CSM interaction might play a key role at early times (V. Morozova et al. 2017, 2018; F. Förster et al. 2018; T. J. Moriya et al. 2023). They showed that SNe IIP from red supergiants (RSGs) with additional CSM around them could produce SNe IIL. Thus, SNe II with a rapid (IIL-like) early decline in their luminosity could be a direct probe into the immediate mass-loss history of the progenitor before explosion.
Pre-explosion imaging of the progenitors of SNe IIP have been identified as RSGs with a zero-age main sequence (ZAMS) mass of ∼8–17 M⊙ (S. D. Van Dyk et al. 2003; S. J. Smartt 2009, 2015; S. D. Van Dyk 2017). However, theoretical evolutionary codes predict the progenitors of SNe IIP can have initial masses ≲30 M⊙ (e.g., A. Heger et al. 2003; S. Ekström et al. 2012) and the observed RSG population in our Galactic neighborhood is expected to have a ZAMS mass range of ∼9–25 M⊙ (e.g., E. M. Levesque et al. 2006; M. S. Gordon et al. 2016). This apparent discrepancy between progenitor masses of SNe II and our understanding of RSG evolution is often dubbed the RSG problem in stellar evolution (S. J. Smartt 2015). Due to uncertainties in late-stage evolution of massive stars and the small sample size of SNe studied, the statistical significance of the RSG problem is highly debated and still is an open question (e.g., J. Walmswell & J. Eldridge 2012; J. J. Eldridge et al. 2013; C. S. Kochanek 2014; G. Meynet et al. 2015; T. Sukhbold et al. 2016; S. M. Adams et al. 2017; B. Davies & E. R. Beasor 2018; B. Davies & E. R. Beasor 2020; C. S. Kochanek 2020; Ó. Rodrìguez 2022; E. R. Beasor et al. 2025).
As plateau length is correlated with the duration of hydrogen recombination, analytical and numerical simulations of SNe IIP light curves have predicted a continuous scaling of photospheric plateau duration (D. V. Popov 1993; D. Kasen & S. E. Woosley 2009; T. Sukhbold et al. 2016; D. Hiramatsu et al. 2021a), though there are some degeneracies with explosion energies and progenitor radii. Short plateau SNe (SPSNe) with a plateau duration of the order of tens of days are rarely observed (e.g., D. Hiramatsu et al. 2021a; R. S. Teja et al. 2022, 2023). The origin of luminous SPSNe with a small hydrogen envelope (H-envelope) have been suggested to be due to partial stripping of a massive progenitor (MZAMS ≳ 18 M⊙) based on a small sample size (D. Hiramatsu et al. 2021a; L. Martinez et al. 2022). The recent well-observed event SN 2023ixf appears to have arisen from a partially stripped and similarly high-mass RSG progenitor as well (B. Hsu et al. 2024; Q. Fang et al. 2025). In fact, a recent broad study of SNe II through hydrodynamic modeling has suggested that partial stripping of envelopes could be a common feature among SNe II and is likely a key factor to explain their light-curve diversity (Q. Fang et al. 2025).
In this paper, we present optical photometry and spectroscopy and NIR spectroscopy of SN 2023ufx, an SN II with an exceptionally short plateau. Recently, SN 2023ufx was also studied by M. A. Tucker et al. (2024), where several unique aspects of its photometric and spectroscopic evolution were discussed in the context of massive star evolution. We will compare our interpretations with these results in the appropriate Sections.
In Section 2, we describe the discovery and observations, and in Section 3, we estimate the interstellar extinction. We present the photometric and spectroscopic evolution of SN 2023ufx in Sections 4 and 5, respectively. We discuss comparisons of our observations with synthetic models to infer progenitor properties in Section 6. The proposed explosion asymmetry in SN 2023ufx is discussed in Section 7, and we present our summary and conclusions in Section 8.
2. Discovery and Observations
SN 2023ufx was discovered by the Asteroid Terrestrial-impact Last Alert System (ATLAS; J. L. Tonry et al. 2018; K. W. Smith et al. 2020) on 2023 October 6 at 13:55:52 (MJD = 60224.1; J. Tonry et al. 2023). Throughout this work, all dates/times are reported in the Coordinated Universal Time (UTC) standard. The closest available nondetection before discovery is from the Zwicky Transient Facility (ZTF; E. C. Bellm et al. 2019; M. J. Graham et al. 2019; F. J. Masci et al. 2023) on 2023 October 5 at 11:12:46 (MJD = 60222.5). Given a ∼1 day nondetection constraint, we adopt the explosion epoch (t0) to be the midpoint between these two epochs at MJD = 60223.3 ± 0.5 (2023 October 6). However, given the closest g-band ZTF nondetection is at ∼19 mag and the inferred shape of the rising light curve in o (we discuss this in Section 3; Figure 2), it is possible for the explosion epoch to be earlier by 1 day.
SN 2023ufx was initially considered a fast evolving blue optical transient (S. Srivastav et al. 2023; M. A. Tucker 2023). However, Gemini GMOS-N spectroscopy classified it as a young Type IIP supernova at a redshift of z = 0.0146 ± 0.0007 (A. Chrimes et al. 2023). We adopt this redshift in our work, which corresponds to a distance of ∼63.2 ± 3.1 Mpc (based on the cosmological calculator22 as described in E. L. Wright 2006) and a distance modulus of 34.01 ± 0.11 assuming H0 = 70 km s−1 Mpc−1, Ωm = 0.3, and Ωvac = 0.7.23
SN 2023ufx was identified to be associated with the faint host galaxy SDSS J082451.43+211743.3 (g = 20.86 ± 0.04 mag, r = 20.62 ± 0.07 mag, i = 20.86 ± 0.12 mag), exploding at a distance of ≈2 7 (∼0.8 kpc) from its nucleus (M. A. Tucker et al. 2024). These gri magnitudes can be converted to V = 20.72 ± 0.08 mag, based on empirical transformation relations described in R. H. Lupton et al. (2005).24
For our assumed distance of ∼63.2 ± 3.1 Mpc, this implies a host luminosity of log(L/L⊙) = 7.2 ± 0.1 dex, with MV,⊙ = 4.84 as the absolute V magnitude of the Sun. Adopting the luminosity–metallicity relationship of E. N. Kirby et al. (2013), we estimate [Fe/H] = −1.32 ± 0.19. Thus, the host metallicity of SN 2023ufx can be expressed as log(Z/Z⊙) = −1.32 ± 0.19 dex. Such a low host-galaxy metallicity for SN 2023ufx (as an SN IIP) is also generally consistent with independent estimate of log(Z/Z⊙) < −0.9 dex by M. A. Tucker et al. (2024) using a Keck Cosmic Web Imager (P. Morrissey et al. 2018) spectrum of SDSS J082451.43+211743.3.
7 (∼0.8 kpc) from its nucleus (M. A. Tucker et al. 2024). These gri magnitudes can be converted to V = 20.72 ± 0.08 mag, based on empirical transformation relations described in R. H. Lupton et al. (2005).24
For our assumed distance of ∼63.2 ± 3.1 Mpc, this implies a host luminosity of log(L/L⊙) = 7.2 ± 0.1 dex, with MV,⊙ = 4.84 as the absolute V magnitude of the Sun. Adopting the luminosity–metallicity relationship of E. N. Kirby et al. (2013), we estimate [Fe/H] = −1.32 ± 0.19. Thus, the host metallicity of SN 2023ufx can be expressed as log(Z/Z⊙) = −1.32 ± 0.19 dex. Such a low host-galaxy metallicity for SN 2023ufx (as an SN IIP) is also generally consistent with independent estimate of log(Z/Z⊙) < −0.9 dex by M. A. Tucker et al. (2024) using a Keck Cosmic Web Imager (P. Morrissey et al. 2018) spectrum of SDSS J082451.43+211743.3.
2.1. Photometric Observations
Shortly after discovery, we performed high-cadence photometric (U, B, g, V, r, and i) follow-up of SN 2023ufx with the worldwide Las Cumbres Observatory network of 1.0 m robotic telescopes (T. M. Brown et al. 2013). These observations were triggered through the Global Supernova Project (D. Howell 2019). The images were reduced using the PyRAF-based photometric reduction pipeline, lcogtsnpipe25 (S. Valenti et al. 2016). The pipeline calculates the instrumental magnitudes using a standard point-spread function (PSF) fitting technique. Apparent magnitudes for g, r, and i images were calibrated with the APASS catalog (A. A. Henden et al. 2016). The U, B, and V apparent magnitudes were calibrated with a Landolt catalog (A. U. Landolt 1992) constructed using standard fields observed with the same telescope and night combination as the SN observations. Since background contamination from the host galaxy is minimal (faint host and significant offset from SN; see Section 2), the PSF photometry was obtained directly from the unsubtracted images.
We used the ATLAS forced photometry service (J. L. Tonry et al. 2018; K. W. Smith et al. 2020) to obtain photometry in two filters cyan (c) and orange (o). Additionally, we obtained ZTF photometry data (g and r) from the Automatic Learning for the Rapid Classification of Events broker (F. Förster et al. 2021).
SN 2023ufx was also observed by the Neil Gehrels Swift Observatory (N. Gehrels et al. 2004). The UVOT images were reduced using the High-Energy Astrophysics software (HEASoft26 ). The source region is centered at the position of the SN with an aperture size of 5″, and the background is measured from a region without contamination from other stars with an aperture size of 5″. We use a larger source aperture size than recommended,27 as the PSFs in several images were not good due to Swift’s temporary gyroscope related issues, affecting some UVOT observations in 2023 October (see B. Cenko 2023, 2024a, 2024b, for a detailed timeline). Zero-points for photometry were chosen from A. A. Breeveld et al. (2010) with time-dependent sensitivity corrections updated in 2020.
2.2. Spectroscopic Observations
We performed several optical and NIR spectral observations of SN 2023ufx starting on 2023 October 13 (∼6 days after discovery) and continued through 2024 May 4 (∼211 days after explosion). The observation log associated with all optical and NIR spectra used in this work are presented in Table A1
2.2.1. Optical Spectroscopy
We obtained high-cadence low-resolution optical spectra using the FLOYDS spectrographs mounted on the 2.0 m Faulkes Telescope North (FTN) at Haleakala (USA) and the identical 2.0 m Faulkes Telescope South at Siding Spring (Australia), which are part of the Las Cumbres Observatory network. The observations were performed with a 2 0 wide slit placed on the target at the parallactic angle. We extracted, reduced, and calibrated the 1D spectra using the standard FLOYDS reduction pipeline as described in S. Valenti et al. (2014).
We obtained five spectra with the Low-Resolution Imaging Spectrometer (LRIS; J. B. Oke et al. 1995) mounted on the Keck I telescope. The observations were performed with a 1 0 wide slit, and the data were reduced utilizing standard procedures in the fully automated reduction pipeline for LRIS longslit spectra, LPipe (D. A. Perley 2019).
An optical spectrum was obtained with the Multi-Object Double Spectrographs (R. W. Pogge et al. 2010, MODS) on the twin 8.4 m LBT at Mount Graham International Observatory. These spectra were reduced using standard techniques, including bias subtraction and flat-fielding via the modsCCDRed package (R. Pogge 2019). Cosmic-ray rejection, local sky subtraction, and extraction of 1D spectra were done using IRAF (D. Tody 1986), and flux calibration was done with standard-star observations taken on the same night at similar airmass.
We present a Southern Astrophysical Research Telescope (SOAR) Goodman-RED spectrum taken on 2024 January 28 (∼114 days after explosion). We reduced the spectrum using the Goodman HTS Pipeline28 and calibrated it to a spectrophotometric standard star observed on the same night using PyRAF (Science Software Branch at STScI 2012).
We also present a spectrum from the Boller and Chivens Spectrograph (B&C) on the University of Arizona’s Bok 2.3 m telescope taken on 2024 February 13 (∼130 days after explosion). This spectrum was reduced using standard IRAF routines (D. Tody 1986).
We obtained three optical spectra with the Kast double spectrograph (J. Miller & R. Stone 1994) mounted on the Shane 3 m telescope at Lick Observatory. A 2 0 slit was used with the slit oriented at the parallactic angle. The data were reduced following standard techniques for CCD processing and spectrum extraction (J. M. Silverman et al. 2012) utilizing IRAF (D. Tody 1986) routines and custom Python and IDL codes.29
The spectra were flux calibrated and telluric corrected using observations of appropriate spectrophotometric standard stars observed on the same night, at similar airmasses, and with an identical instrument configuration.
0 slit was used with the slit oriented at the parallactic angle. The data were reduced following standard techniques for CCD processing and spectrum extraction (J. M. Silverman et al. 2012) utilizing IRAF (D. Tody 1986) routines and custom Python and IDL codes.29
The spectra were flux calibrated and telluric corrected using observations of appropriate spectrophotometric standard stars observed on the same night, at similar airmasses, and with an identical instrument configuration.
A nebular spectrum of SN 2023ufx was taken with the Blue arm of the Hobby-Eberly Telescope Low Resolution Spectrograph 2 (HET LRS2-B) on 2024 May 4 (∼211 days after explosion). The spectrum of the SN was extracted from the background-subtracted data cube produced by the Panacea30 pipeline. A detailed prescription on reducing LRS2 data can be found in B. P. Thomas et al. (2022).
2.2.2. Near-infrared Spectroscopy
We observed SN 2023ufx in a zJ spectroscopic setup on 2023 December 3 (∼58 days after explosion) using the MMT and Magellan Infrared Spectrograph (MMIRS; B. McLeod et al. 2012) on the 6.5 m MMT located on Mt. Hopkins in Arizona. The spectrum was taken using a 1 0 longslit. The data were manually reduced using the MMIRS pipeline (I. Chilingarian et al. 2015), then the 1D spectral outputs were telluric and absolute flux corrected following the method described in W. D. Vacca et al. (2003) with the XTELLCOR_GENERAL tool (M. C. Cushing et al. 2004; part of Spextool package) using a standard A0V star observed at similar airmass and time.
We observed SN 2023ufx with the TripleSpec spectrograph(E. Schlawin et al. 2014) on the SOAR telescope on 2023 December 18 (∼73 days after explosion). The spectrum was taken in the cross-dispersed mode using a 1 1 longslit and was reduced following the TripleSpec specific modification (J. D. Kirkpatrick et al. 2011)31
of the reduction software, Spextool (M. C. Cushing et al. 2004). The standard A0V star observed at similar airmass adjacent to the science target was used for telluric correction following the prescription in W. D. Vacca et al. (2003).
1 longslit and was reduced following the TripleSpec specific modification (J. D. Kirkpatrick et al. 2011)31
of the reduction software, Spextool (M. C. Cushing et al. 2004). The standard A0V star observed at similar airmass adjacent to the science target was used for telluric correction following the prescription in W. D. Vacca et al. (2003).
We obtained an NIR spectrum of SN 2023ufx on 2023 December 30 (∼85 days after explosion), with the Near-InfraRed Echellette Spectrometer (NIRES; J. C. Wilson et al. 2004) on Keck II telescope. The observations were performed with NIRES fixed single slit (0 55 × 18″), and data were reduced using the semiautomated Python-based open-source facility spectroscopic reduction software Pypeit.32
Pypeit automatically identifies the trace in the 2D frames and performs spectral 1D extractions. A sensitivity function is computed by comparing observations of the A0V standard to the model spectrum and the telluric absorption spectrum at Maunakea constructed using the Telfit code (K. Gullikson et al. 2014). This sensitivity function is then used to flux calibrate and coadd science observations.
55 × 18″), and data were reduced using the semiautomated Python-based open-source facility spectroscopic reduction software Pypeit.32
Pypeit automatically identifies the trace in the 2D frames and performs spectral 1D extractions. A sensitivity function is computed by comparing observations of the A0V standard to the model spectrum and the telluric absorption spectrum at Maunakea constructed using the Telfit code (K. Gullikson et al. 2014). This sensitivity function is then used to flux calibrate and coadd science observations.
3. Extinction
The equivalent widths (EWs) of Na i D absorption lines can be empirically related to the overall reddening toward an SN, as it is generally a good tracer of gas and dust (e.g., D. Poznanski et al. 2012). We measured the reddening along the line of sight toward SN 2023ufx by considering contributions from Milky Way and the host galaxy. In Figure 1, we present a medium-resolution (R ∼ 2000) red-side MODS spectrum obtained on 2023 November 9.
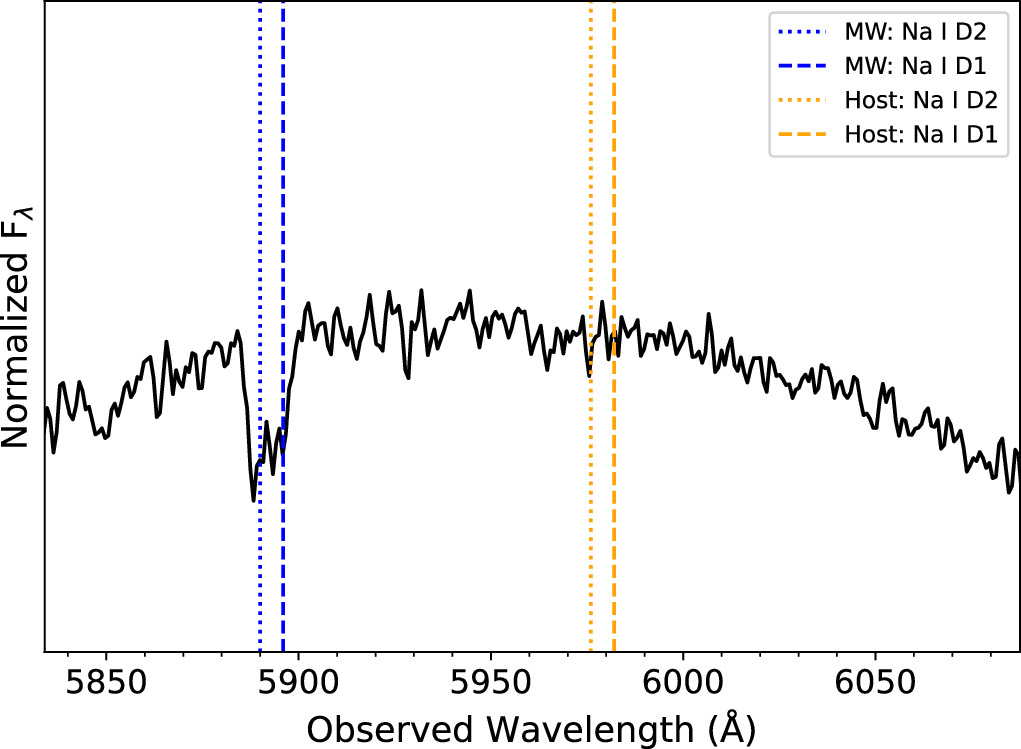
Figure 1. Red-side MODS LBT spectrum of SN 2023ufx on 2023 November 9. Na i D2 and Na i D1 expected from the host galaxy (orange) and Milky Way (blue) are marked. There is no discernible absorption due to the host galaxy.
Download figure:
Standard image High-resolution imageTo estimate the EWs of Na i D line absorption due to Milky Way (MW), we continuum-normalize the observed spectrum and fit the Na i D2 and Na i D1 absorption due to MW with a combination of two Gaussians. We estimate a total EW of Na i D from MW to be 0.48 ± 0.04 Å. From the relation between EW and E(B − V) (see Equation (9) of D. Poznanski et al. 2012), we estimate a corresponding total reddening of E(B − V)MW = 0.04 ± 0.01 mag. A similar result is obtained if we use the more recent empirical relation between E(B−V) and EW of Na i D in Ó. Rodrìguez et al. (2023) There are no discernible Na i D absorption dips associated with the host galaxy at observed wavelengths, λ5976 D2 and λ5982 D1 (Figure 1). We estimate an upper limit on the EW of Na i D from the host to be <0.04 Å. This corresponds to E(B − V)host < 0.01 mag. As this upper limit is comparable to the uncertainty in E(B − V)MW, we assume E(B − V)host to be negligible.
Reddening due to the MW in the direction of SN 2023ufx based on the dust maps of E. F. Schlafly & D. P. Finkbeiner (2011) is E(B − V)MW = 0.042 ± 0.001 mag, which is consistent with the reddening estimate from our EW measurement of Na i D lines. Thus, in this paper, we adopt E(B − V)MW = E(B − V)total ∼ 0.04 mag, assuming the extinction law of J. A. Cardelli et al. (1989) with Rv = 3.1 for multiband extinction corrections.
4. Photometric Evolution
The full extinction-corrected multiband light curves of SN 2023ufx are shown in Figure 2. In the first ∼6 days after detection, only ATLAS o data was obtained, making the rise time of SN 2023ufx in other bands uncertain. To estimate peak brightness in V, we fit a window of 35 days around the earliest observed photometry using a polynomial fit, where a fiducial nondetection point with an average limiting magnitude of ∼22 mag is assumed. This approach has already been implemented in the literature to ensure a consistent procedure to estimate peak magnitude and the corresponding epoch irrespective of the very early photometry coverage of an SN II within the sample (e.g., S. Valenti et al. 2016; K. A. Bostroem et al. 2019; Y. Dong et al. 2021; N. Meza-Retamal et al. 2024). We find that the data are best-fit with a sixth-order polynomial (Figure 2; right panel), and the measured peak brightness is MV = −18.42 ± 0.08 mag on MJD 60230.12, ∼7 days after explosion. If instead of polynomial fitting, we assume the first photometry point in V to be the peak, our results for peak magnitude and epoch are nearly identical. Since ATLAS o is the only filter where we catch the rise for SN 2023ufx, we also estimate its magnitude and epoch of peak luminosity. Following the same fitting procedure as for V, we find that the peak brightness in o is Mo = −18.27 ± 0.02 mag on MJD 60229.1. This is generally consistent with our predicted epoch of peak magnitude in V (given a ∼1 day uncertainty in the explosion epoch), and we can constrain the rise time to peak brightness in SN 2023ufx to be ≲7 days.
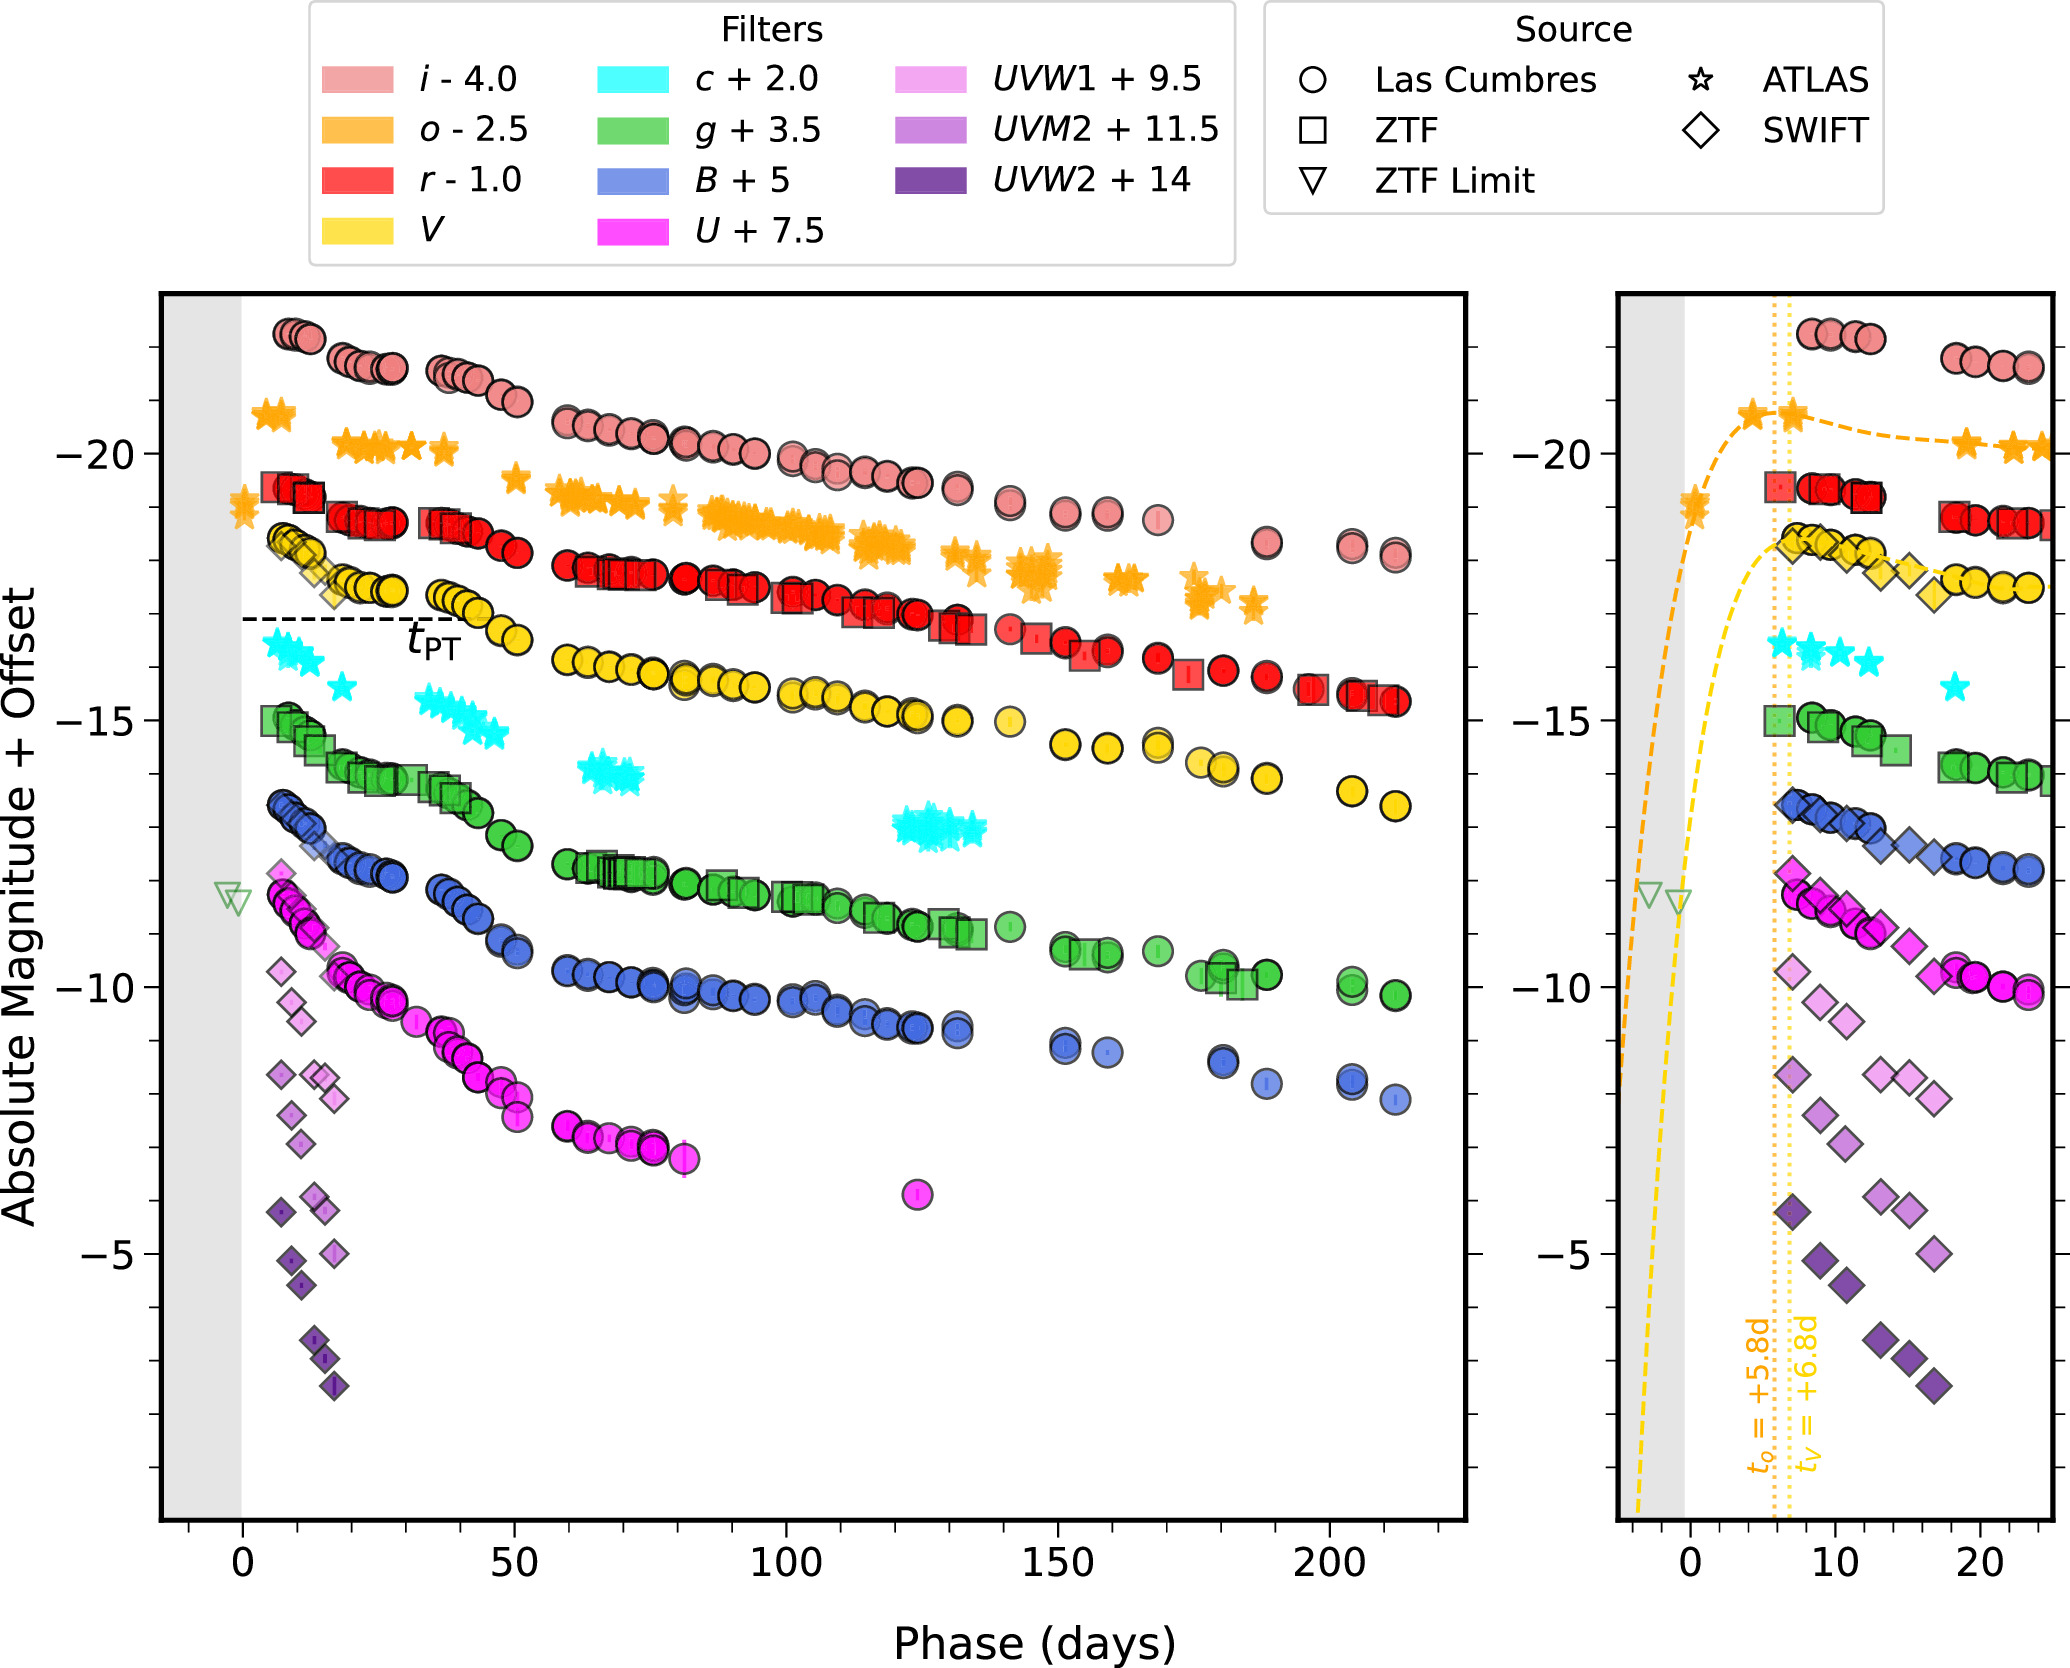
Figure 2. Left panel: multiband extinction-corrected light curves of SN 2023ufx from Las Cumbres Observatory, ZTF, ATLAS, and Swift data with respect to epoch of explosion (t0) on 2023 October 6. The SN 2023ufx V-band plateau length (tPT), as described and measured in Section 4.2, is marked. Right panel: zoom in showing the first ATLAS (o) detection of SN 2023ufx and last known nondetection from ZTF (g), along with other bands. Epochs of peak brightness in o (to) and V (tV) are within ∼1 day of each other and are marked (dotted lines). Best-fit polynomial to estimate peak magnitude in o and V are plotted (dashed curves). Between the last ZTF (g) nondetection and the first o detection (∼0.5 day), the brightness jumped by ∼2 mag. Gray band in both panels indicates the time before SN detection.(The data used to create this figure are available.)
Download figure:
Standard image High-resolution image4.1. Early Rapid Decline
Soon after the first Las Cumbres Observatory and ZTF observations, a rapid multiband decline is observed, with faster decline in bluer bands. In order to understand where SN 2023ufx lies compared to other SNe II in the literature, we quantify the rate of decline after maximum light.
Comprehensive statistical studies of decline rates in brightness have been shown to have a correlation with the peak absolute magnitude (see W. Li et al. 2011; J. P. Anderson et al. 2014; L. Galbany et al. 2016; S. Valenti et al. 2016). It has also been noted that some SNe II show a change in the decline rate around 10–20 days (R. Barbon et al. 1979; J. P. Anderson et al. 2014). For these SNe, a single slope cannot account for the different decline rates until the end of hydrogen recombination. SN 2023ufx has a significant slope change in all bands around day 20, so we follow the procedure in S. Valenti et al. (2016) to measure the decline rate of the initial steeper slope of the light curve in V, s1. To be consistent with definitions in the literature, we present s1 in units of mag per 50 days as described in J. P. Anderson et al. (2014).
For SN 2023ufx, the best-fit slope for early decline is s1 = 3.47 ± 0.09 mag / 50 days. This is the fastest early decline observed among all SNe II samples in J. P. Anderson et al. (2014), S. Valenti et al. (2016), T. de Jaeger et al. (2019),33 and J. P. Anderson et al. (2014), where there is a discernible early decline before the plateau phase. Along with a high MV, this puts SN 2023ufx in a previously unexplored parameter space. We present this comparison in Figure 3, where we combined the sample data in J. P. Anderson et al. (2014) and S. Valenti et al. (2016). SN 2018ivc is another unique SN II, where four clear slope changes during the decline were observed in the first 30 days of evolution, though it did not have a single plateau like an SN IIP (K. A. Bostroem et al. 2020; A. Reguitti et al. 2024). We mark other known SNe II with a single short plateau SNe 2006Y, 2006ai, 2016egz (D. Hiramatsu et al. 2021a), 2018gj (R. S. Teja et al. 2022), and 2020jfo (R. S. Teja et al. 2022) in the plot. We also mark the more IIL-like 2017ahn (L. Tartaglia et al. 2021). All of the high peak luminosity SPSNe (especially SN 2006Y and SN 2023ufx) have faster-than-average (SNe II) decline rates. We discuss the potential origin of such a rapid early decline further in Section 6.1.
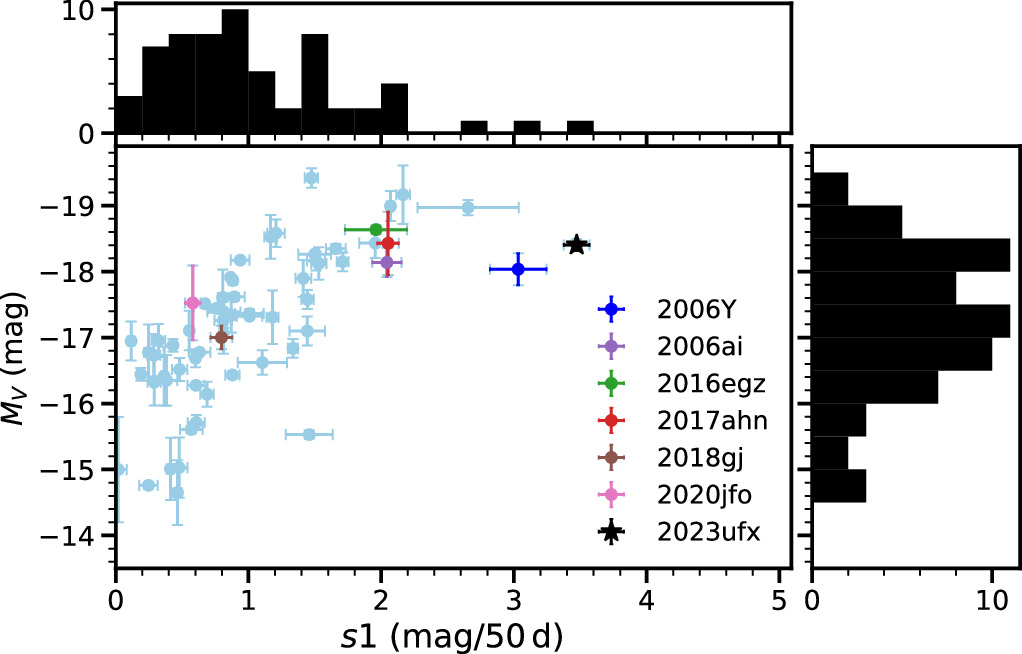
Figure 3. The peak magnitude, MV compared to early decline slope, s1 for SN 2023ufx and a sample of SNe II from J. P. Anderson et al. (2014), S. Valenti et al. (2016), T. de Jaeger et al. (2019), and J. P. Anderson et al. (2024), where there is a distinct slope at early times. Some other SPSNe are marked. SN 2023ufx is both luminous and is one of the fastest declining SNe II at early times.
Download figure:
Standard image High-resolution image4.2. Short-plateau
After the rapid decline in the first ∼20 days, SN 2023ufx settles on an extremely short plateau (of ∼20 days), before a significant drop in brightness as the hydrogen recombination phase ends. While other significantly short plateau SNe (with ≲50 days on the plateau) have been discussed previously in the literature (D. Hiramatsu et al. 2021a), SN 2023ufx is the shortest yet.
During the fall from the plateau phase, the observed light curve can be characterized by a Fermi–Dirac phenomenological formulation (E. F. Olivares et al. 2010; S. Valenti et al. 2016; Y. Dong et al. 2021; Ó. Rodrìguez et al. 2021):

where a0 indicates the depth of the drop, tPT represents the “length of plateau” as described in S. Valenti et al. (2016), and w0 inversely indicates the slope of the post-plateau light-curve phase before the radioactive tail phase begins. We fit the V-band light curve with this phenomenological model using Markov Chain Monte Carlo (MCMC) sampling with the Python package, emcee (D. Foreman-Mackey et al. 2013). The corresponding best-fit values are: a0 = 1.16 ± 0.08 mag; tPT = 46.5 ± 0.5 days; and w0 = 4.6 ± 0.6 days. We uniformly vary our priors for a0 (0.5–2.5 mag), tPT (0–200 days), and w0 (1–20 days). All other SNe in our sample are fit in the same way as described for SN 2023ufx to ensure a consistent comparison of tPT. We find that SN 2023ufx has the shortest tPT among all SNe in our comparison database. We plot s1 with respect to tPT in Figure 4, where SN 2023ufx and other SPSNe are marked. From Figures 3 to 4, it is clear that luminous short-plateau SNe explore a different parameter space in their early-phase light-curve evolution compared to a more typical SN II. We note here that a rapid spectroscopic evolution is also observed for SN 2023ufx in comparison to more typical SNe IIP as the photospheric phase spectra quickly transition into the nebular phase between ∼86 and 114 days after explosion (see Section 5.1).
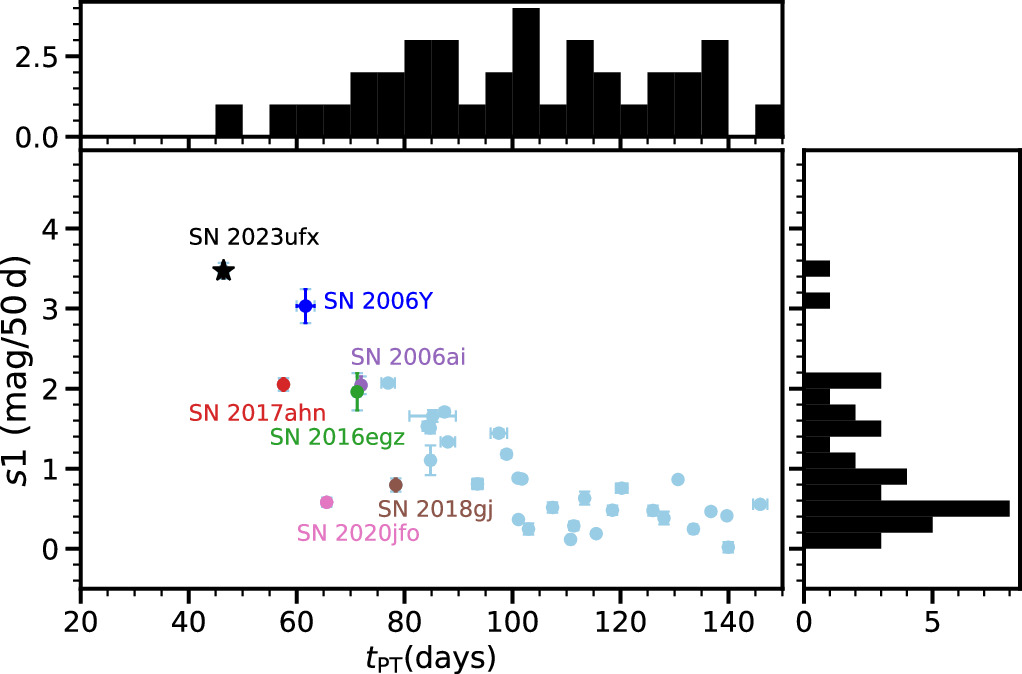
Figure 4. The early decline rate, s1 is plotted against the plateau length tPT for a sample of SNe IIP including SN 2023ufx and some other SPSNe. SN 2023ufx has the shortest plateau length among all SNe IIP in literature.
Download figure:
Standard image High-resolution image4.3. Nickel Mass
After the fall from plateau, the light curve of SN 2023ufx starts on the radioactive tail phase, presumed to be powered primarily by the radioactive decay of 56Co → 56Fe. We compare the V-band light curves of the SPSNe discussed in this work and a typical SN II in the left panel of Figure 5. We find that SN 2023ufx is most similar to other luminous SPSNe (SN 2006Y, SN 2006ai, and SN 2016egz), though with an even shorter plateau length. In the right panel of Figure 5, we indicate the photometric parameters discussed in Sections 4.1 and 4.2 on the absolute V-band light curve of SN 2023ufx. We find that the brightness of SN 2023ufx declines faster (∼0.02 mag day−1) than expected with complete gamma-ray trapping (∼0.0098 mag day−1) at these times.
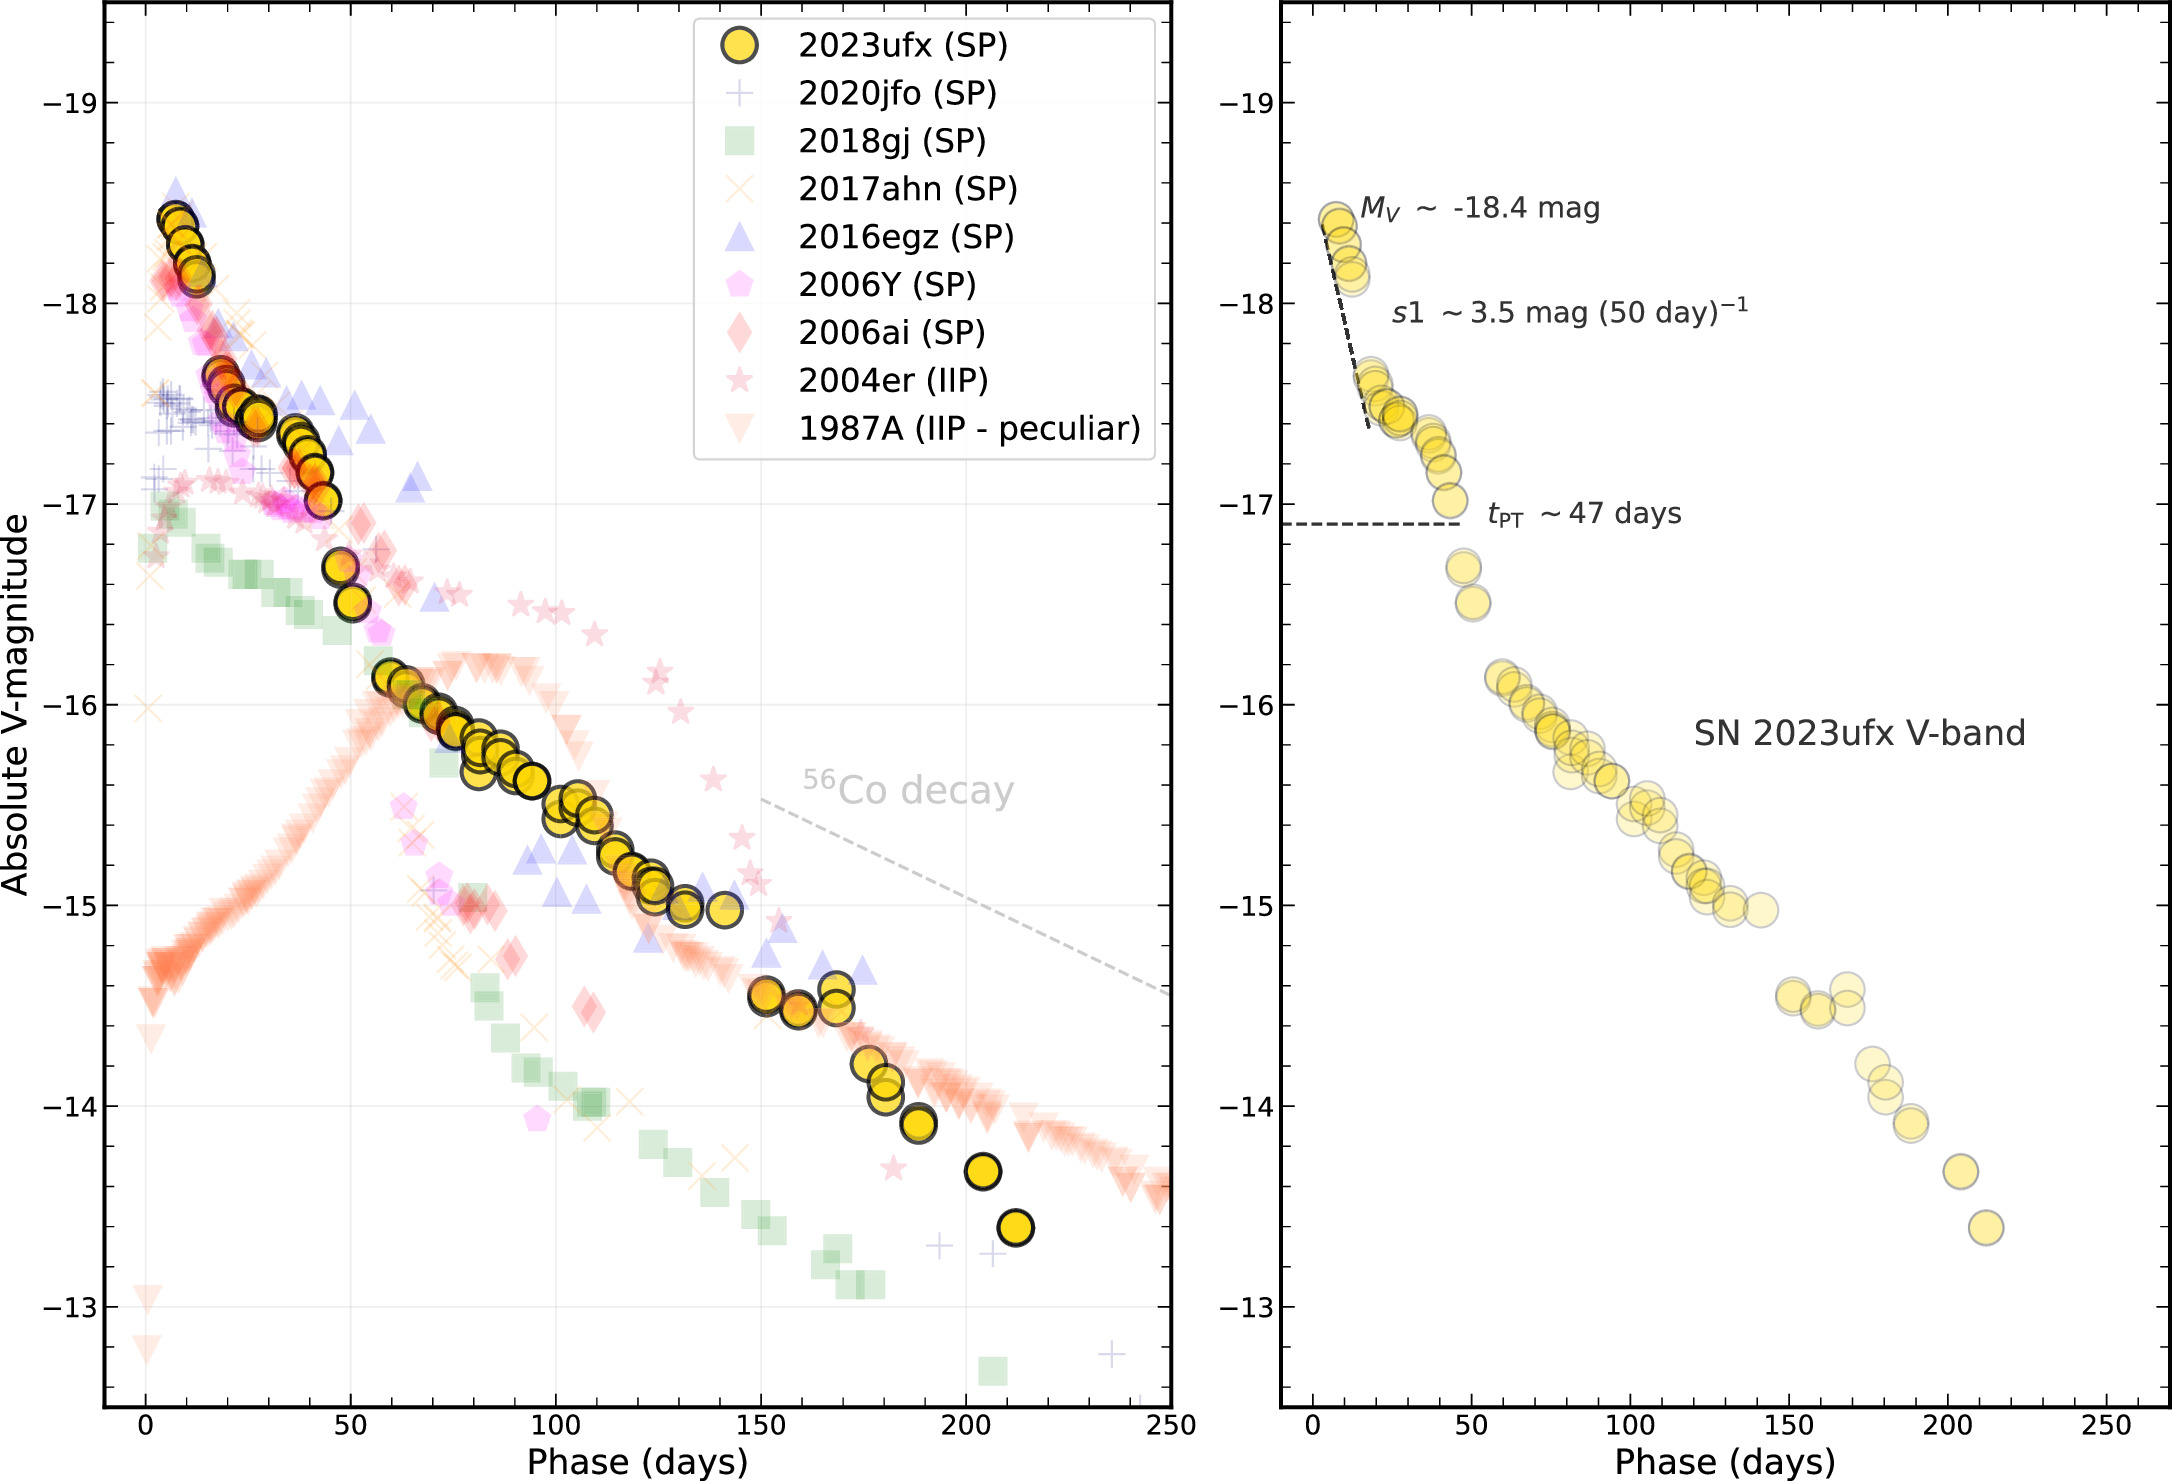
Figure 5. Left panel: absolute magnitude V-band light-curve comparison between SPSNe (including SN 2023ufx) and a more typical SN IIP (SN 2004er) with a significantly longer plateau phase duration. The peculiar SN IIP 1987A along with the typical 56Co-decay rate are also plotted for comparison. SN 2023ufx is among the most luminous SPSNe with a rapid early decline before the plateau phase. The references for data on other SNe used in this plot are as follows: SN 2020jfo (R. S. Teja et al. 2022), SN 2018gj (R. S. Teja et al. 2023), SN 2017ahn (L. Tartaglia et al. 2021), SN 2016egz, SN 2006Y, SN 2006ai (D. Hiramatsu et al. 2021a), SN 2004er (J. P. Anderson et al. 2014), and SN 1987A (R. M. Catchpole et al. 1987, 1988; J. W. Menzies et al. 1987; D. Richardson et al. 2001; D. Y. Tsvetkov et al. 2004). Right panel: absolute magnitude V-band light curve of SN 2023ufx with the photometric parameters, MV, s1, and tPT as defined in Sections 4.1 and 4.2 marked.
Download figure:
Standard image High-resolution imageThe amount of 56Ni produced through explosive nucleosynthesis can be estimated from evolution of the radioactive tail of the optical light curve, during the optically thin nebular phase. The spontaneous radioactive decay processes produce γ-rays that are reprocesssed by the ejecta, radiating at optical wavelengths. If these γ-rays are completely trapped by the ejecta (i.e., the same trapping as SN 1987A), the 56Ni mass at explosion can be estimated by scaling the pseudo-bolometric luminosity of the SN at nebular times to that of the extremely well characterized SN 1987A (assuming the SN has the same SED as SN 1987A) with the following equation (see S. Spiro et al. 2014, and references therein):

where MNi is the synthesized 56Ni mass, and  and L87A(t) are the pseudo-bolometric luminosities of the SN of interest and SN 1987A at time t, constructed using a common set of filters. However, from a sample study of SNe II, J. P. Anderson et al. (2014) and C. P. Gutiérrez et al. (2017b) showed that most fast-declining SNe show a radioactive tail decline faster than that expected from 56Co decay with complete trapping, suggesting an incomplete trapping of γ-rays. To account for the luminosity deficit due to incomplete trapping, we can modify Equation (2) by simplifying the incomplete trapping terms in A. Clocchiatti & J. C. Wheeler (1997) as
where, T0 is the characteristic trapping parameter that represents γ-ray escape time associated with the SN. The trapping parameter associated with SN 1987A is fixed at 530 days (A. Jerkstrand 2011). As the decline rate of SN 2023ufx is faster than typically expected from complete trapping like in SN 1987A (see Figure 5), we use Equation (3) to estimate the mass of 56Ni.
For estimating the pseudo-bolometric luminosity of SN 2023ufx, we followed the method described in S. Valenti et al. (2008). We converted the observed magnitudes to flux at each band and numerically integrated using the Simpson’s rule. We perform a two-parameter (MNi and T0) MCMC sampling based on Equation (3). For this, we compare the pseudo-bolometric luminosities of SN 2023ufx and SN 1987A in the common set of UBgVri filters between days 125 and 225, when both objects are on their respective radioactive tails. Note that for SN 2023ufx, the radioactive tail phase starts as early as ∼60 days (Figures 2 and 5), but at this time, SN 1987A is still in the photospheric phase (Figure 5). For our sampling, we use a log likelihood function based on the standard χ2 formulation. Results from our MCMC sampling are presented as posterior distributions in Figure 6. We find a best-fit MNi = 0.137  M⊙, where the systematic errors on MNi due to distance are included. The best-fit trapping parameter for SN 2023ufx, T0 = 154.93
  is significantly smaller than that of SN 1987A (i.e., T0 = 530 days; A. Jerkstrand 2011) as expected.
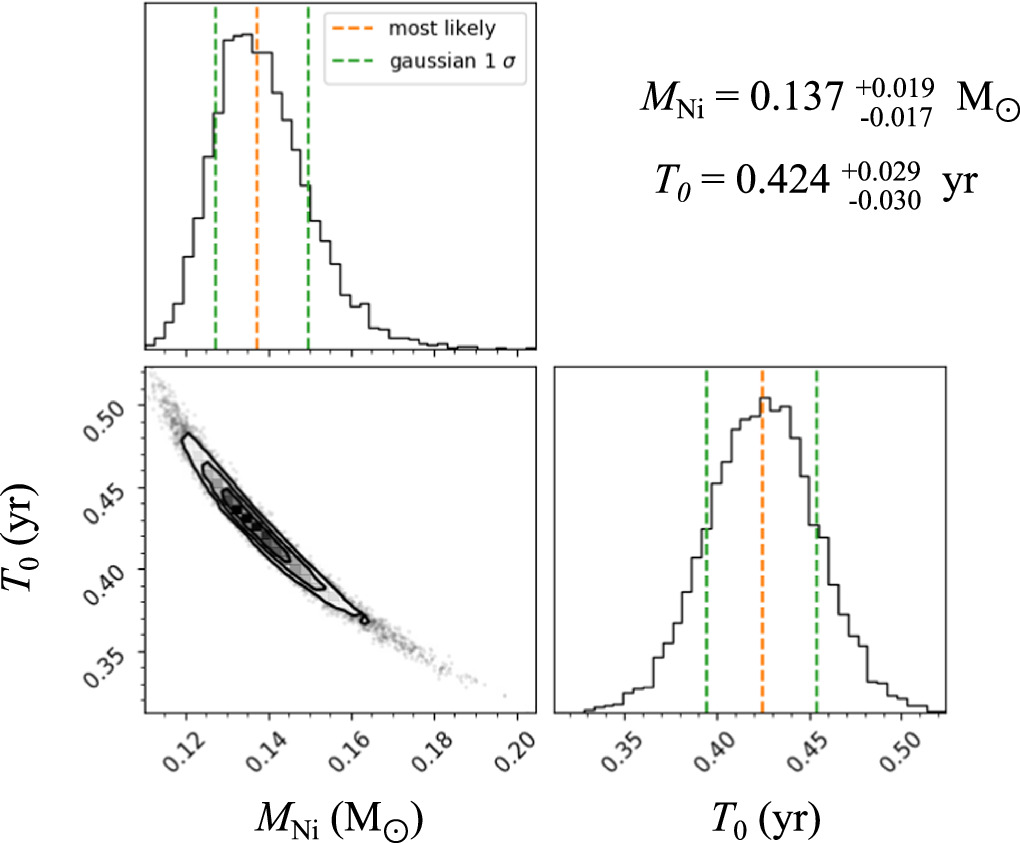
Figure 6. Posterior distribution of nickel mass, MNi and the characteristic trapping parameter, T0 from MCMC sampling of the radioactive decay tail of SN 2023ufx assuming incomplete trapping of γ-rays. The mean of the posterior distribution and 1σ uncertainties are marked.
Download figure:
Standard image High-resolution imageThe estimated MNi of SN 2023ufx is significantly higher than the observed median nickel mass (MNi = 0.03 M⊙) for several SNe II samples (see J. P. Anderson et al. 2014; S. Valenti et al. 2016; Ó. Rodrìguez et al. 2021). The high nickel mass estimate in SN 2023ufx is consistent with corresponding estimates in the short-plateau SN 2006Y, SN 2006ai, and SN 2016egz where a massive progenitor scenario was proposed (MZAMS > 17 M⊙; D. Hiramatsu et al. 2021a). On the other hand, the two other SPSNe in our comparison sample—SN 2018gj and SN 2020jfo, with estimated nickel masses more typical of SNe II—were inferred to have a low-mass progenitor (MZAMS < 12–13 M⊙; R. S. Teja et al. 2022, 2023). This could indicate that SN 2023ufx had a massive progenitor. We note that the interacting SN IIn 1998S, which was proposed to have a massive progenitor (He-core mass of ∼4 M⊙) also has a similar MNi (A. Fassia et al. 2001). One general caveat to note with this method of estimating MNi is the assumption that all luminosity at nebular phases is coming from radioactive decay. If there is additional powering due to interaction (as we discuss later in Sections 5.2, 6.2, and 7), this MNi of SN 2023ufx can be an overestimate.
Hydrodynamic light-curve models of SNe II find that as an RSG loses H-envelope mass, the plateau becomes shorter—but also declines more rapidly (D. Hiramatsu et al. 2021a). They find that SPSNe in particular may be the result of stars with very small H envelopes left at core-collapse and high MNi (MNi ≳ 0.05 M⊙). The high MNi observed in SN 2023ufx, one of the shortest-plateau SNe in literature, is consistent with these results. We further discuss comparisons between hydrodynamic model grids in D. Hiramatsu et al. (2021a) and the pseudo-bolometric light curve of SN 2023ufx in Section 6.1.
5. Spectroscopic Evolution
5.1. Optical Spectra
The optical spectroscopic evolution of SN 2023ufx between days 7 and 86 is shown in Figure 7. The late-time evolution between days 114 and 211 is shown in Figure 8.
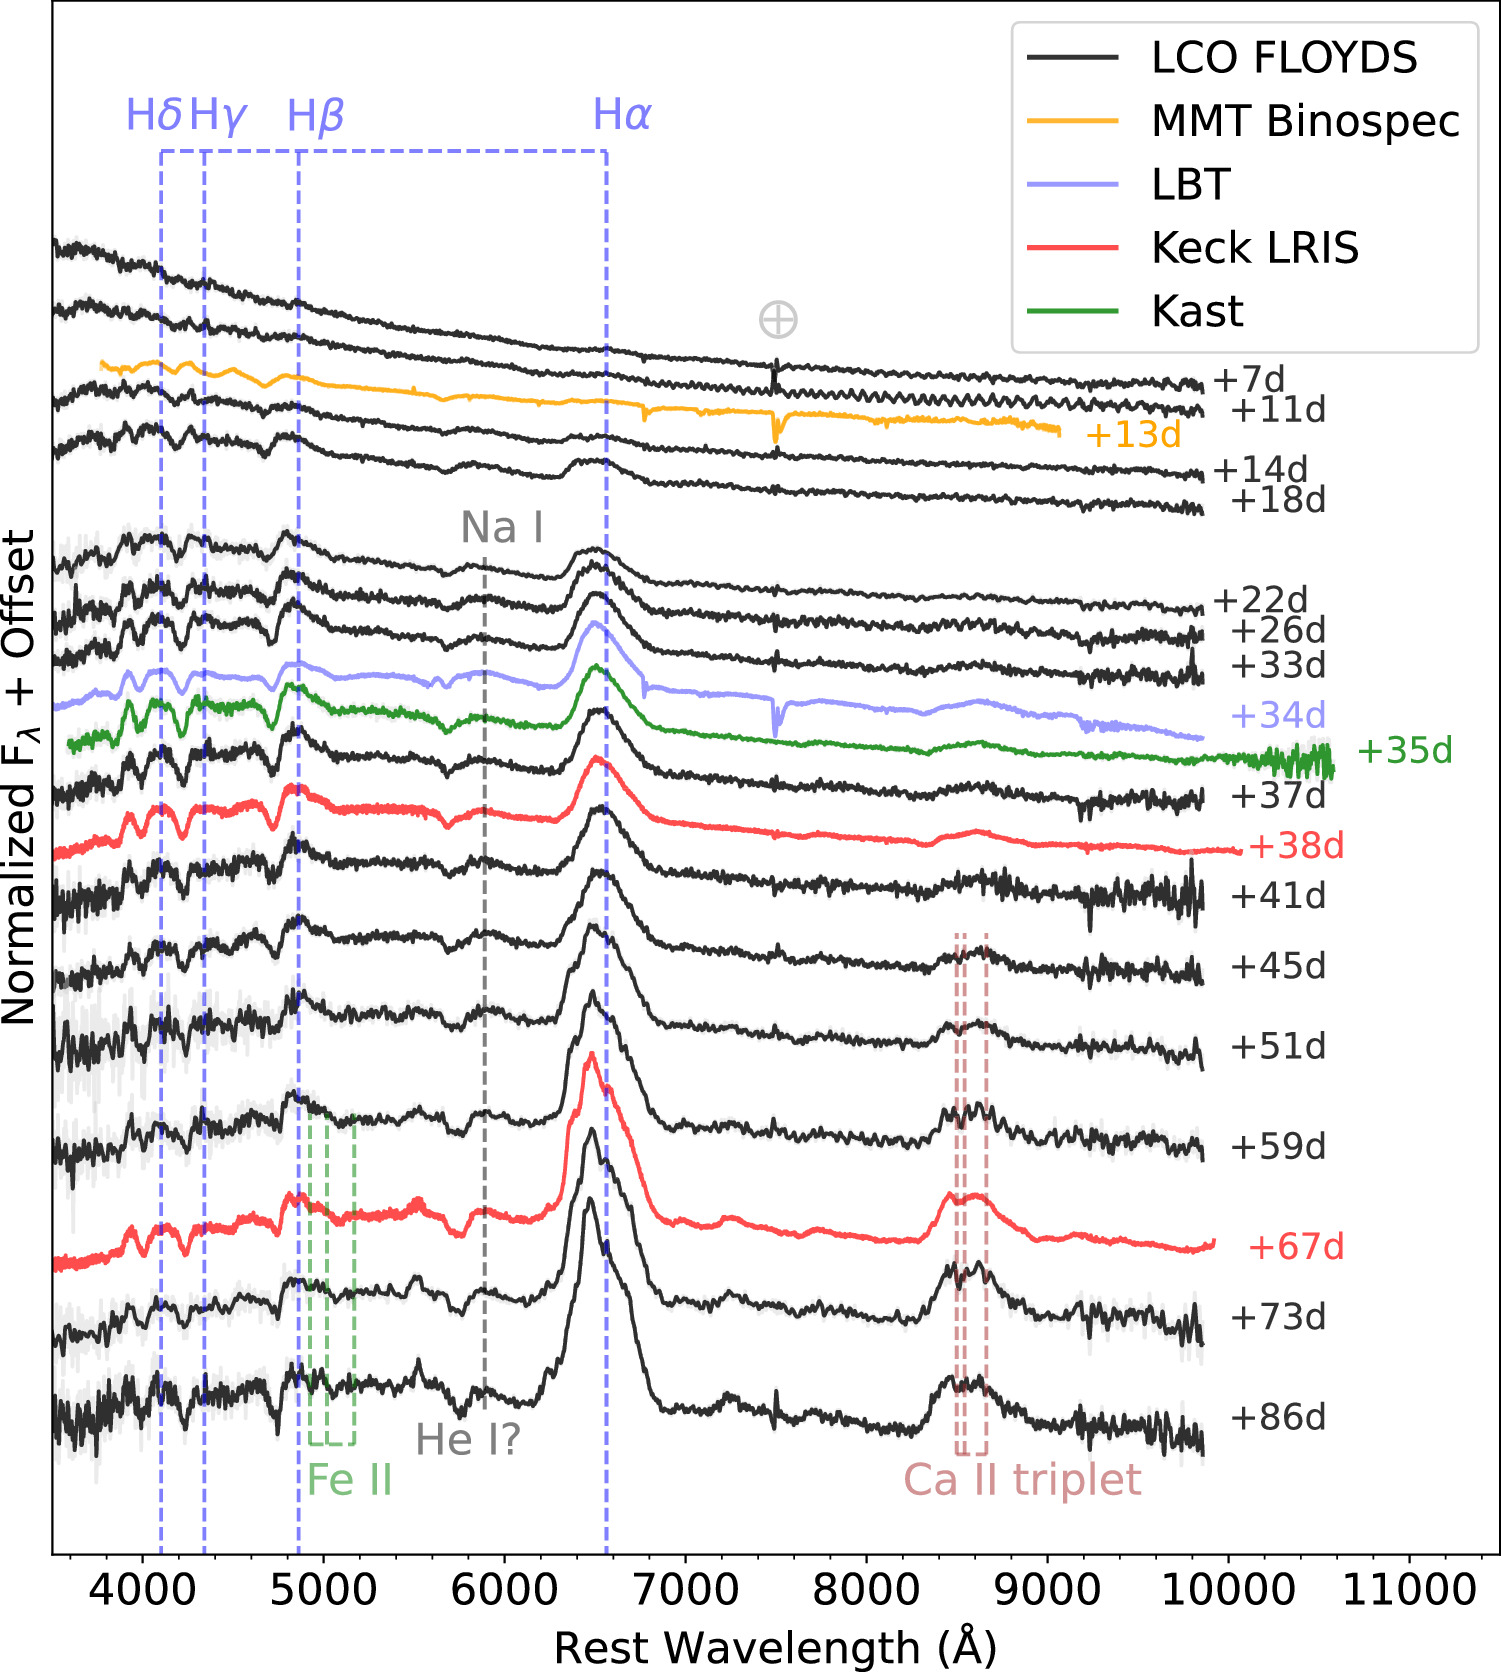
Figure 7. Evolution of photospheric optical spectra of SN 2023ufx between 7 and 86 days. All spectra have been corrected for redshift and total reddening. A minimal smoothing has been performed on some of the spectra where the original unsmoothed data are in light gray. Identified spectral features are marked.(The data used to create this figure are available.)
Download figure:
Standard image High-resolution image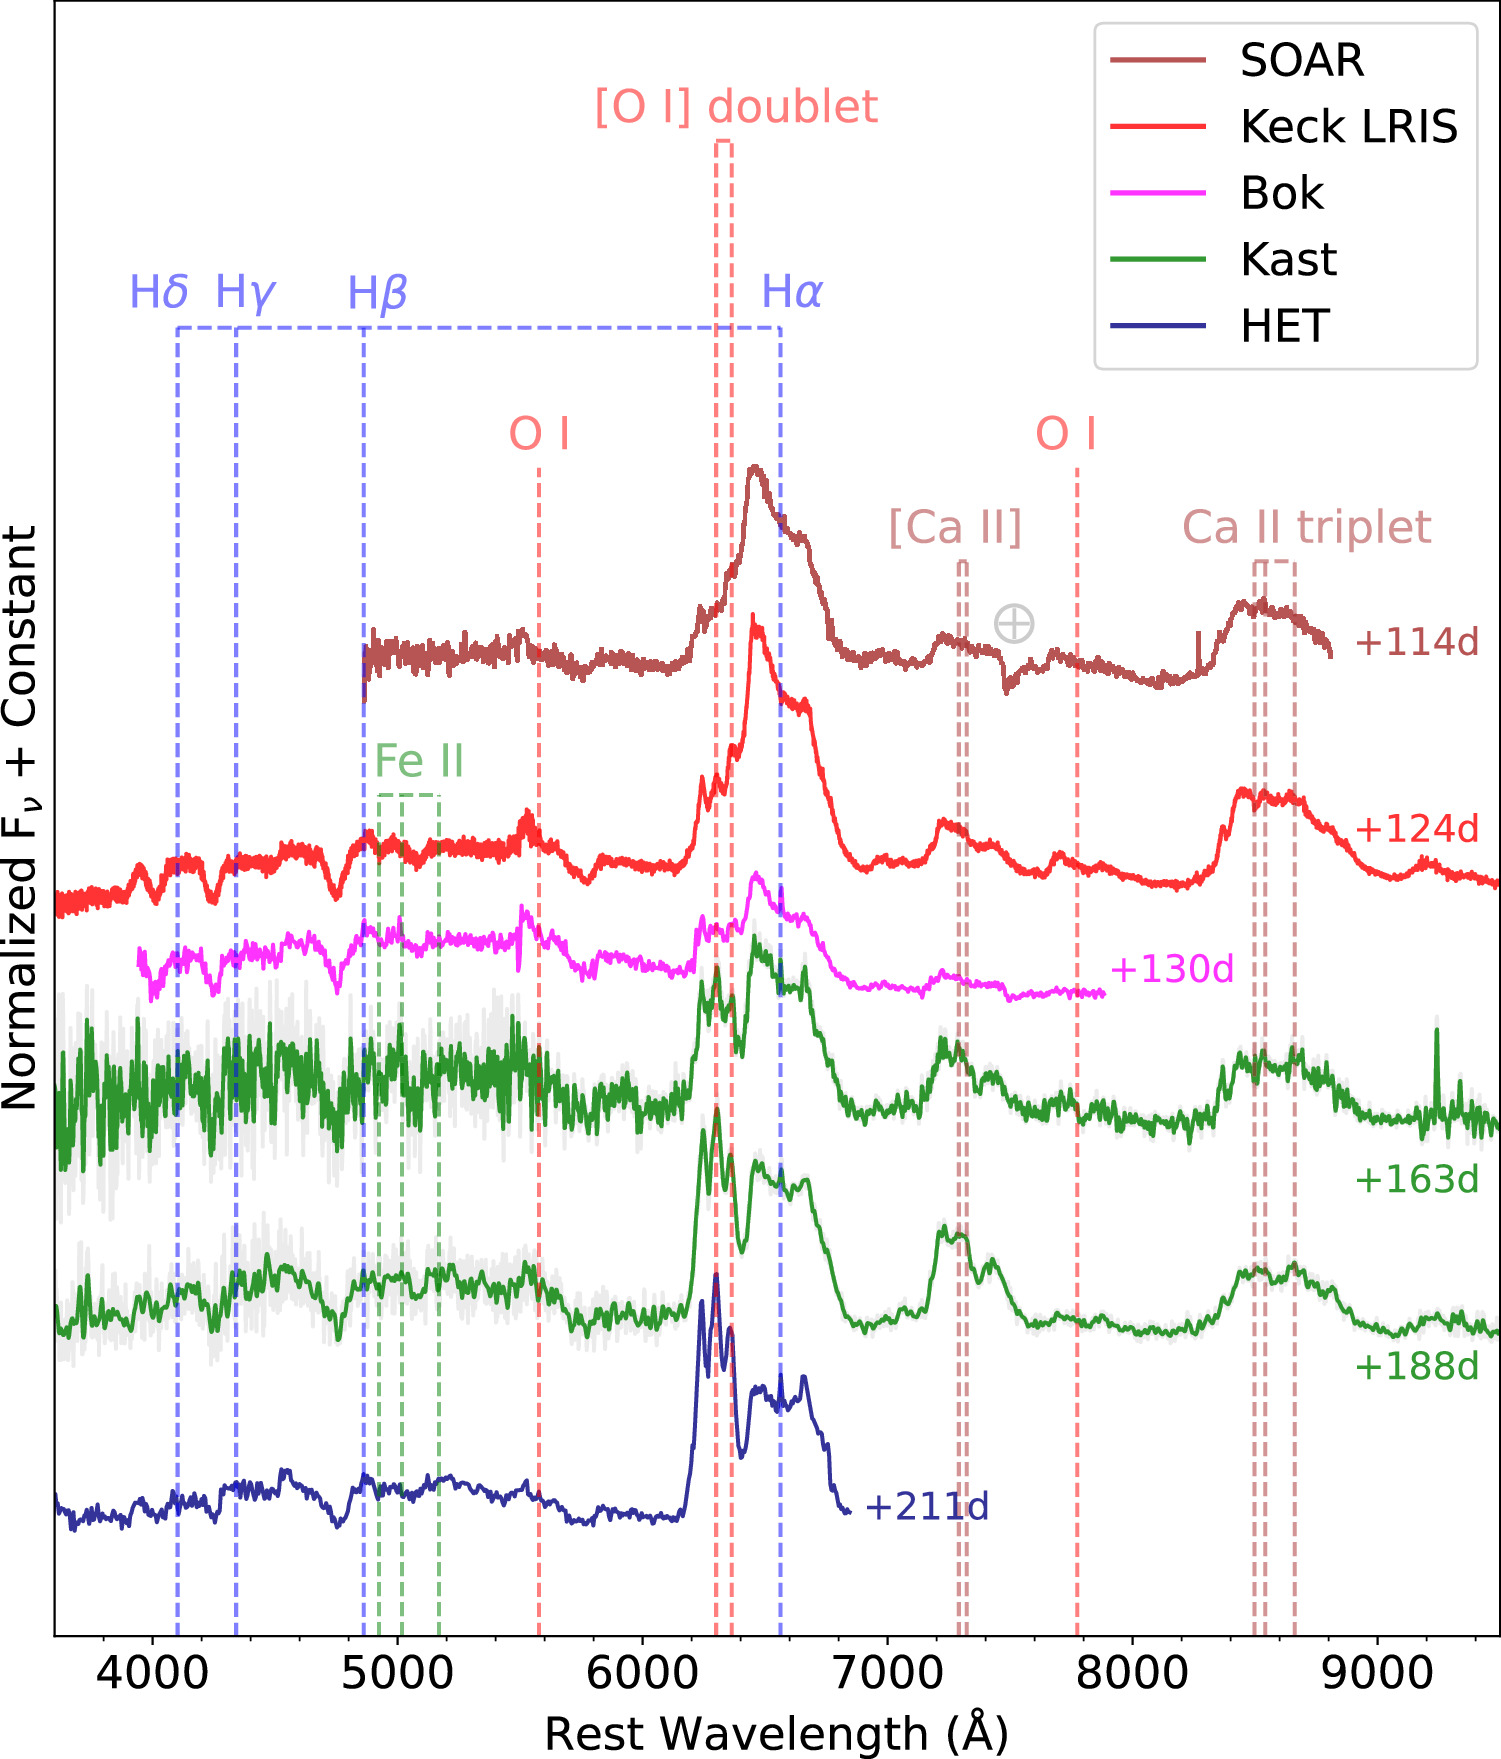
Figure 8. Evolution of late-time optical spectra of SN 2023ufx between 114 and 211 days. All spectra have been corrected for redshift and total reddening. Identified spectral features are marked. High-velocity additional peaks are observed for [O i] λλ 6300, 6364, Hα, and [Ca ii] λλ 7321, 7339 emission lines. A marginal smoothing has been performed on some of the spectra where the original unsmoothed data are in light gray.(The data used to create this figure are available.)
Download figure:
Standard image High-resolution imageAt early times (∼7–11 days), the optical spectra of SN 2023ufx show a blackbody-like continuum with no emission or absorption features. We present a comparison between the available early spectra of several short-plateau SNe discussed in this work in Figure 9(a). The lower-luminosity SPSNe (SN 2020jfo and SN 2018gj) start showing the emergence of hydrogen Balmer lines at this time while the more luminous SN 2016egz shows a similar continuum as SN 2023ufx. As the earliest available spectrum in our study of SN 2023ufx is at day 7, we do not observe the fleeting narrow high-ionization CSM emission lines (e.g., from H, He i, He ii; also called flash features) observed in the early spectra of some SNe II (e.g., A. Gal-Yam et al. 2014; N. Smith et al. 2015; D. Khazov et al. 2016; O. Yaron et al. 2017; R. J. Bruch et al. 2021, 2023; D. Hiramatsu et al. 2021b, 2023; L. Tartaglia et al. 2021; G. Terreran et al. 2022; K. A. Bostroem et al. 2023; L. Dessart & W. V. Jacobson-Galán 2023; W. V. Jacobson-Galán et al. 2023, 2024; M. Shrestha et al. 2024). This is strengthened by the observations of M. A. Tucker et al. (2024), where an even earlier spectrum of SN 2023ufx at ∼3.5 days does not show any flash features.
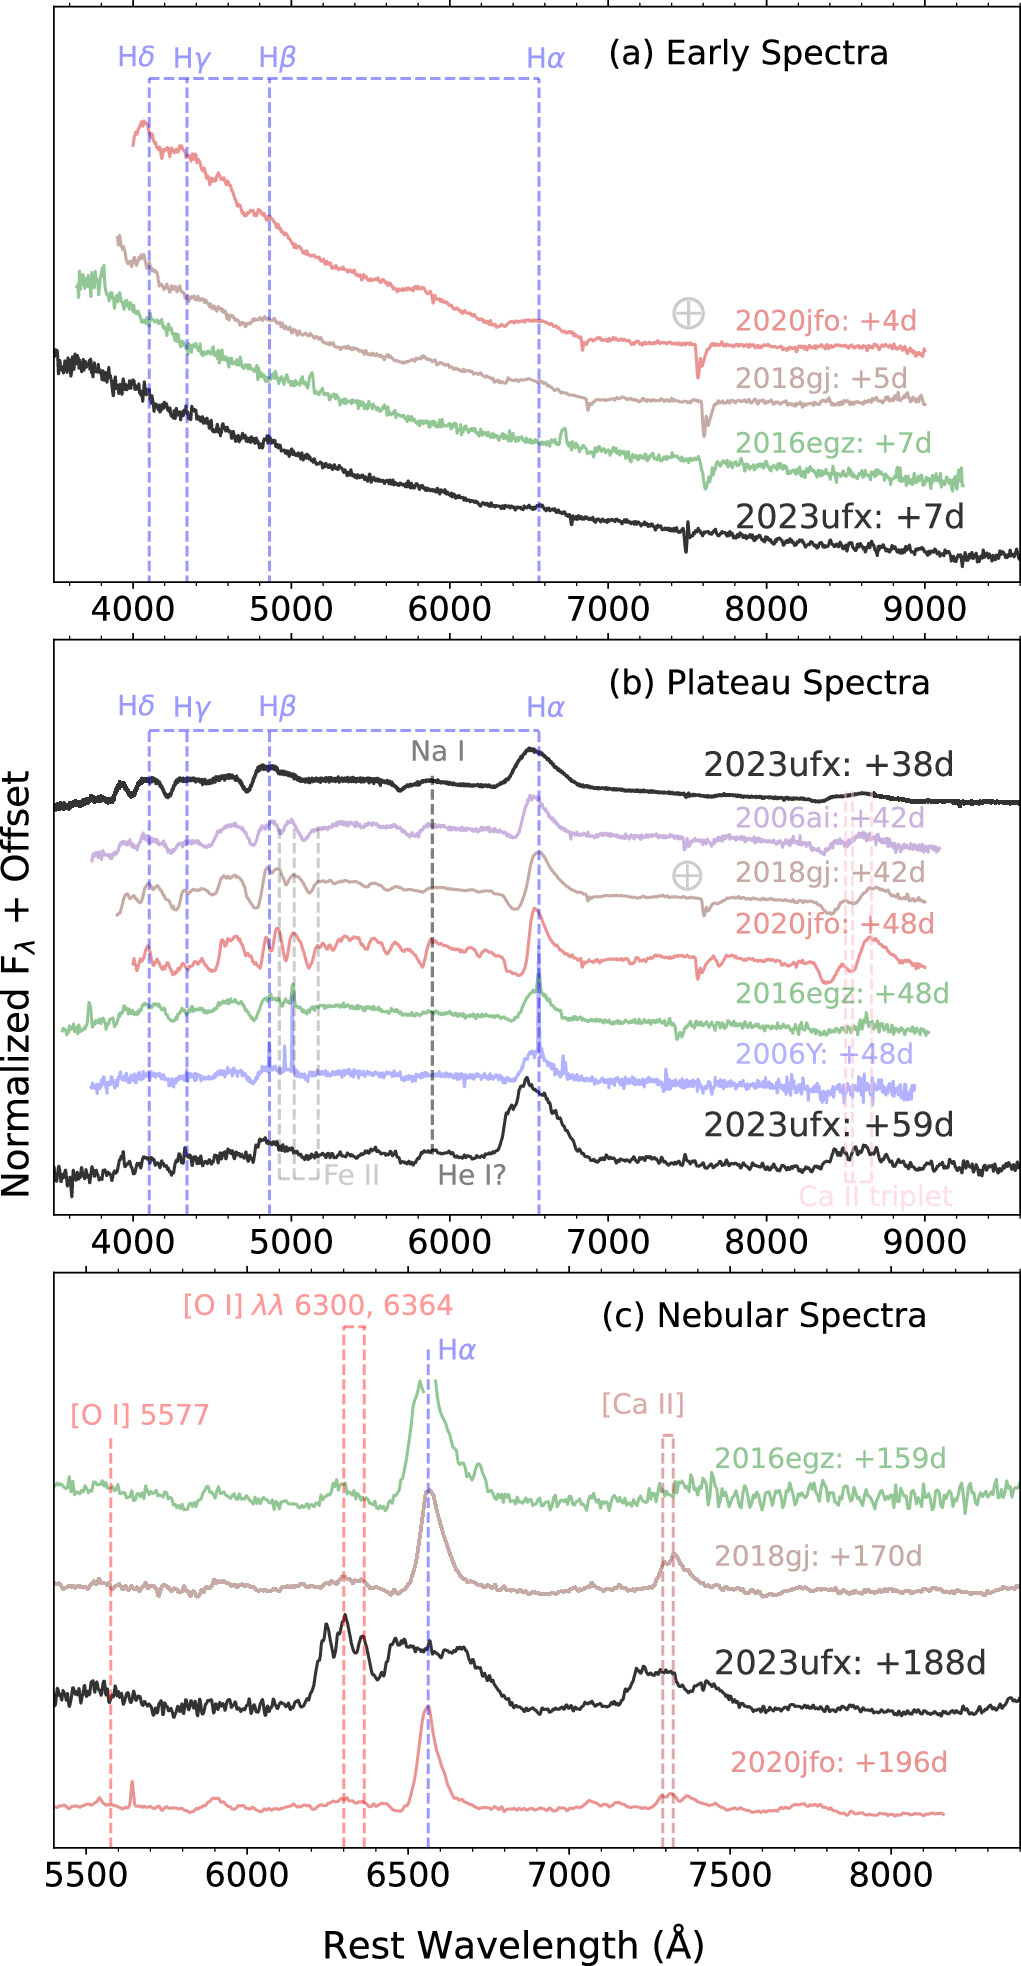
Figure 9. Comparison of redshift- and extinction-corrected optical spectra between the SPSN sample in this work at (a) early, (b) plateau, and (c) nebular phases. No early flash features are observed in these SPSNe. Fe ii absorption in SN 2023ufx is significantly weaker than other SPSNe, even near the end of the plateau phase (∼59 days). SN 2023ufx has the lowest absorption to emission strength in Hα among all of the SPSNe sample. The nebular emission lines of O, H, and Ca in SN 2023ufx are significantly different in width and morphology compared to other SPSNe. Reference for data: SN 2006Y and SN 2006ai (C. P. Gutiérrez et al. 2017a); SN 2016egz (D. Hiramatsu et al. 2021a); SN 2018gj (R. S. Teja et al. 2023); SN 2020jfo (R. S. Teja et al. 2022).
Download figure:
Standard image High-resolution imageAs SN 2023ufx enters the plateau phase around day ∼20, the spectra start becoming redder, showing hydrogen Balmer-series features, with a broad Hα detection. The Hα profile has a strong emission feature with negligible absorption. Among the SNe II samples of J. P. Anderson et al. (2014) and C. P. Gutiérrez et al. (2014, 2017a, 2017b), SPSNe 2006ai and 2006Y were noted to have the lowest absorption-to-emission strength (a/e) ratios. These studies found significant correlations between a/e and plateau length with more IIL-like SNe having weaker ratios. Additionally, SN 2016egz (another luminous short-plateau) was also shown to have low a/e (D. Hiramatsu et al. 2021a). We show the comparison of Hα profile with our SPSN sample during the plateau phase in Figure 9(b).
For a consistent comparison between absorption to emission strengths, we fit the continuum-subtracted plateau phase P-Cygni Hα profile of all SPSNe in our sample with a combination of an absorption and an emission Gaussian component. For SN 2018gj and SN 2020jfo, we estimate a range 0.3 < a/e < 0.5 for the ratio. The luminous SN 2006Y, SN 2006ai, and SN 2016egz in our sample have a ratio 0.1 < a/e < 0.2, which is consistent with their low estimates reported in the literature (C. P. Gutiérrez et al. 2017a; D. Hiramatsu et al. 2021a). SN 2023ufx has negligible absorption in Hα (Figure 9(b)), and we can only estimate an upper limit of 0.08 from its plateau phase spectra. At ∼40 days, the average a/e of a large sample of SNe II was reported to be between 0.2 and 0.5 (C. P. Gutiérrez et al. 2017a). This suggests that SN 2023ufx has a significantly lower absorption to emission strength compared to most SNe II at roughly similar phases. Several potential scenarios have been proposed to explain a low a/e, including significantly lower hydrogen envelope mass ( ) than typical SNe II (e.g., E. M. Schlegel 1996; C. P. Gutiérrez et al. 2014, 2017b). Thus, the low a/e in SN 2023ufx (similar to other luminous SPSNe: SN 2016egz, SN 2006ai, and SN 2006Y) could be indicative of a small hydrogen envelope mass in the aftermath of partial stripping. Additionally, the Hα profile in SN 2023ufx is significantly broader and starts showing signs of multiple components by day ∼59 days (Figure 9(b)). These observations point to a unique and rapid spectral evolution in SN 2023ufx.
One evident difference (from a typical SN II) in the optical spectral evolution of SN 2023ufx is the absence of strong metallic absorption features in the photospheric phases (Figure 7). The weak absorption of Fe ii 5169 Å only shows up at ∼59 days, while Fe ii absorption lines are evident in the early plateau phase for majority of the SPSNe (Figure 7). Weak metal lines could be due to a low-metallicity progenitor of SN 2023ufx as suggested by M. A. Tucker et al. (2024). By comparing the optical spectra of SN 2023ufx with the metallicity-dependent model spectra of L. Dessart et al. (2013), they found that the Fe ii and Ca ii features in SN 2023ufx are weaker than ∼0.1 Z⊙ metallicity models at comparable epochs.
Hydrogen Balmer lines can be used to probe the expansion velocities associated with SNe II (e.g., C. P. Gutiérrez et al. 2017a). The evolution of the line profile of Hα in SN 2023ufx is significantly more rapid than other SPSNe. As the SN ends the plateau phase, the single broad Hα peak develops two distinct emission components between days ∼51 (Figure 7) and ∼211 (Figure 8). In velocity space, these emission components are at ∼4800 km s−1 from the reference rest wavelength of Hα at 6563 Å (Figure 10).
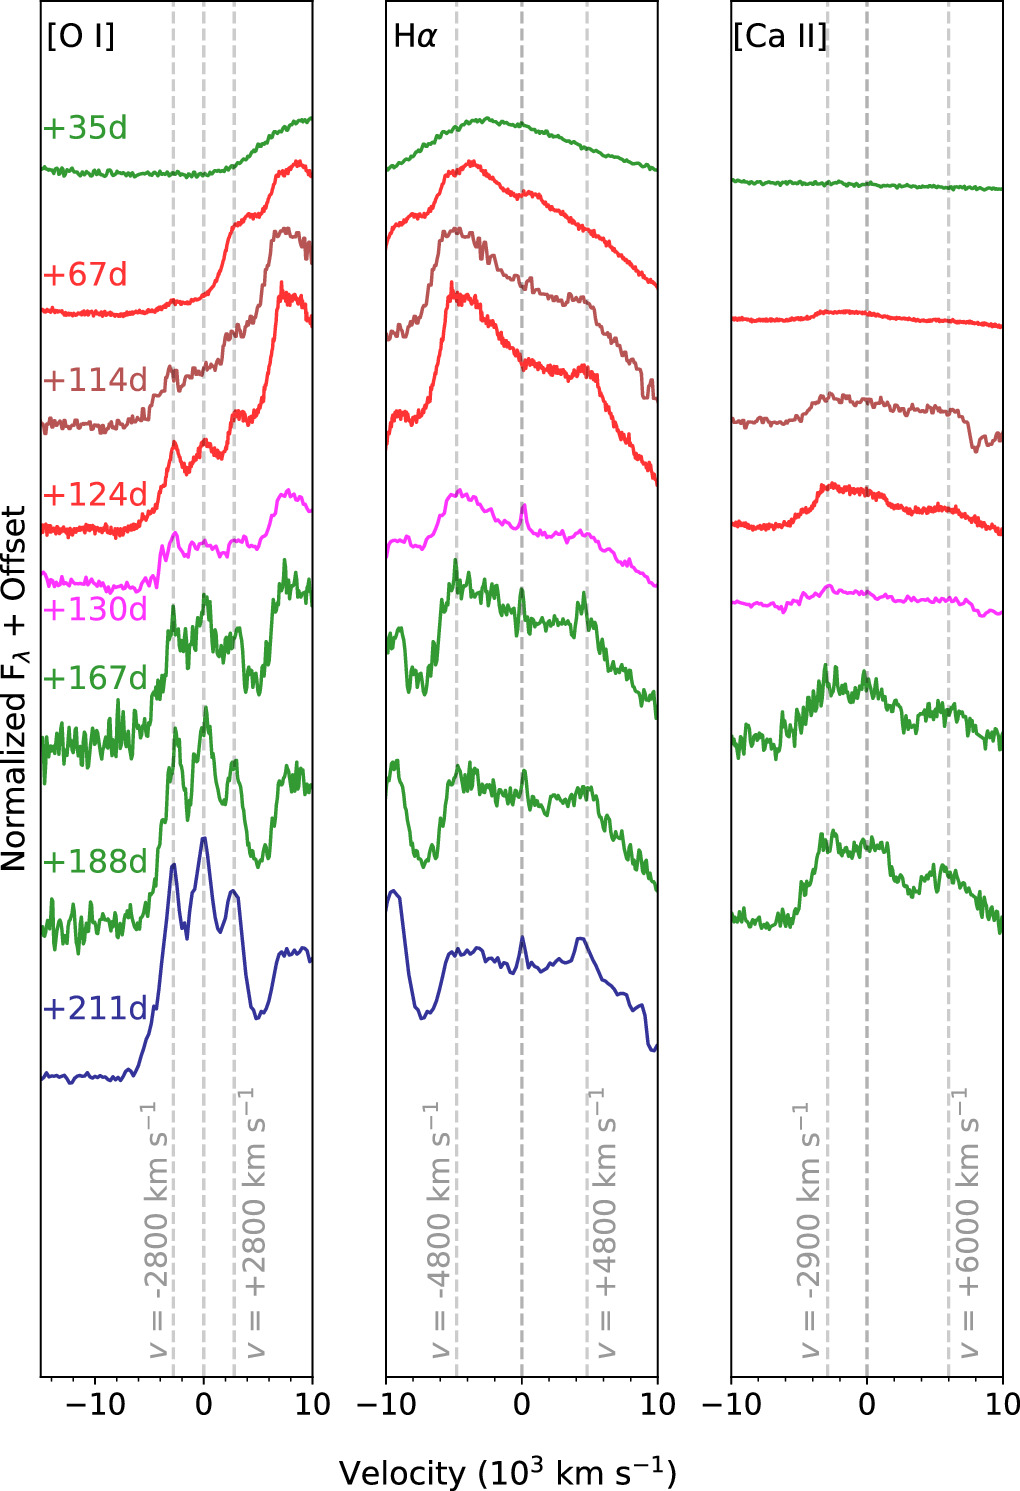
Figure 10. Evolution of the velocity profiles of [O i] λλ6300, 6364 doublet (left), Hα (middle), and [Ca ii] λλ7321, 7339 doublet (right) at few representative epochs between photospheric and nebular phases. The zero velocities for [O i] λλ6300, 6364 doublet, Hα, and [Ca ii] λλ7321, 7339 doublet are at 6300, 6564, and 7321 Å, respectively. The velocities associated with the observed peaks calculated relative to the corresponding zero velocities in each panel have been marked.
Download figure:
Standard image High-resolution imageThe other Balmer lines (Hβ, Hγ, and Hδ) in SN 2023ufx show strong and persistent absorption lines. The velocity evolution of Hβ based on absorption minimum, compared with the SNe II sample average of C. P. Gutiérrez et al. (2017a) and other SPSNe discussed in this work is shown in Figure 11. Systematically, the velocities in SN 2023ufx are higher than a typical SN II at comparable epochs. While all other SPSNe fall within the 1σ variation of typical SNe II, SN 2023ufx has significantly faster Hβ throughout its evolution. This could suggest faster expansion velocities and higher explosion energies than typical SNe II.

Figure 11. Comparison of Hβ absorption minimum velocities with the Type II sample in C. P. Gutiérrez et al. (2017a) and other SPSNe discussed in this work. The 1σ uncertainties on the sample measurements are shaded in gray. The Hβ in SN 2023ufx is consistently at higher velocities than a typical Type II SN and all other SPSNe in the literature. Reference for SPSNe data: SN 2006Y and SN 2006ai (C. P. Gutiérrez et al. 2017a); SN 2016egz (D. Hiramatsu et al. 2021a); SN 2018gj (R. S. Teja et al. 2023); SN 2020jfo (R. S. Teja et al. 2022).
Download figure:
Standard image High-resolution imageWe favor comparisons of velocities with Hβ absorption minimum as an insignificant absorption and the presence of multiple components in the Hα profile introduce significant uncertainties in its velocity measurements. Differences in evolution of the other Balmer lines (mostly in absorption) compared to Hα (mostly in emission) could be due to differences in optical depths and blending from Fe-group lines (C. P. Gutiérrez et al. 2017a).
In the nebular phase, the single broad Hα peak develops into two distinct emission components between days ∼59 (Figure 7) and ∼211 (Figure 8). In the velocity space, the two components are roughly at −4800 and 4800 km s−1 with respect to the rest wavelength of Hα (Figure 10). Over time, the profile appears to become more “boxy” or “flat-topped.” In addition to Hα, strong evolution is seen in [O i] λλ6300, 6364 and [Ca ii] λλ7321, 7339. Between days ∼114 and ∼211, the [O i] λλ6300, 6364 doublet strengthens dramatically, developing three distinct peaks by the latest nebular spectrum in our campaign (Figure 10). While the central peak aligns with the rest wavelength of 6300 Å, the two peaks on either sides are at velocities of −2800 and 2800 km s−1 with respect to 6300 Å. For the [Ca ii] doublet, a blue- and redshifted peak are seen at −2900 and +6000 km s−1 with respect to the rest wavelength of 7291 Å (Figure 10). The development of a flat-top could be indicative of CSM interactions powering the emission lines and nebular phase luminosity (e.g., like in SN 1993J; T. Matheson et al. 2000a, 2000b), while the differences in velocities between H, O, and Ca could suggest a spatially separated origin for their emission. We discuss some of the different physical geometries suggested by these nebular line profiles of H, O, and Ca in Section 7.
5.2. Near-infrared Spectra
To understand the multipeaked Hα profile, we can compare the optical emission features with those in NIR that are generally better isolated (e.g., Paγ, Paβ). The NIR spectral coverage of SN 2023ufx is shown in Figure 12. Between day 51 and 86 when the optical Hα starts developing a two-component profile, we observed SN 2023ufx three times at NIR wavelengths. While the S/N was not ideal in the first two epochs, the Keck NIRES spectrum at day 85 clearly shows double peaks for Paγ and Paβ line profiles (Figure 12). We also compare the NIR spectra of SN 2023ufx with those of the well-studied SN 2017eaw (J. Rho et al. 2018) at nearby epochs of 53 and 107 days. The starkest difference is the presence of double-peak Paschen line profiles in SN 2023ufx compared to the more typical single-peak Paschen profiles in SN 2017eaw (Figure 12).
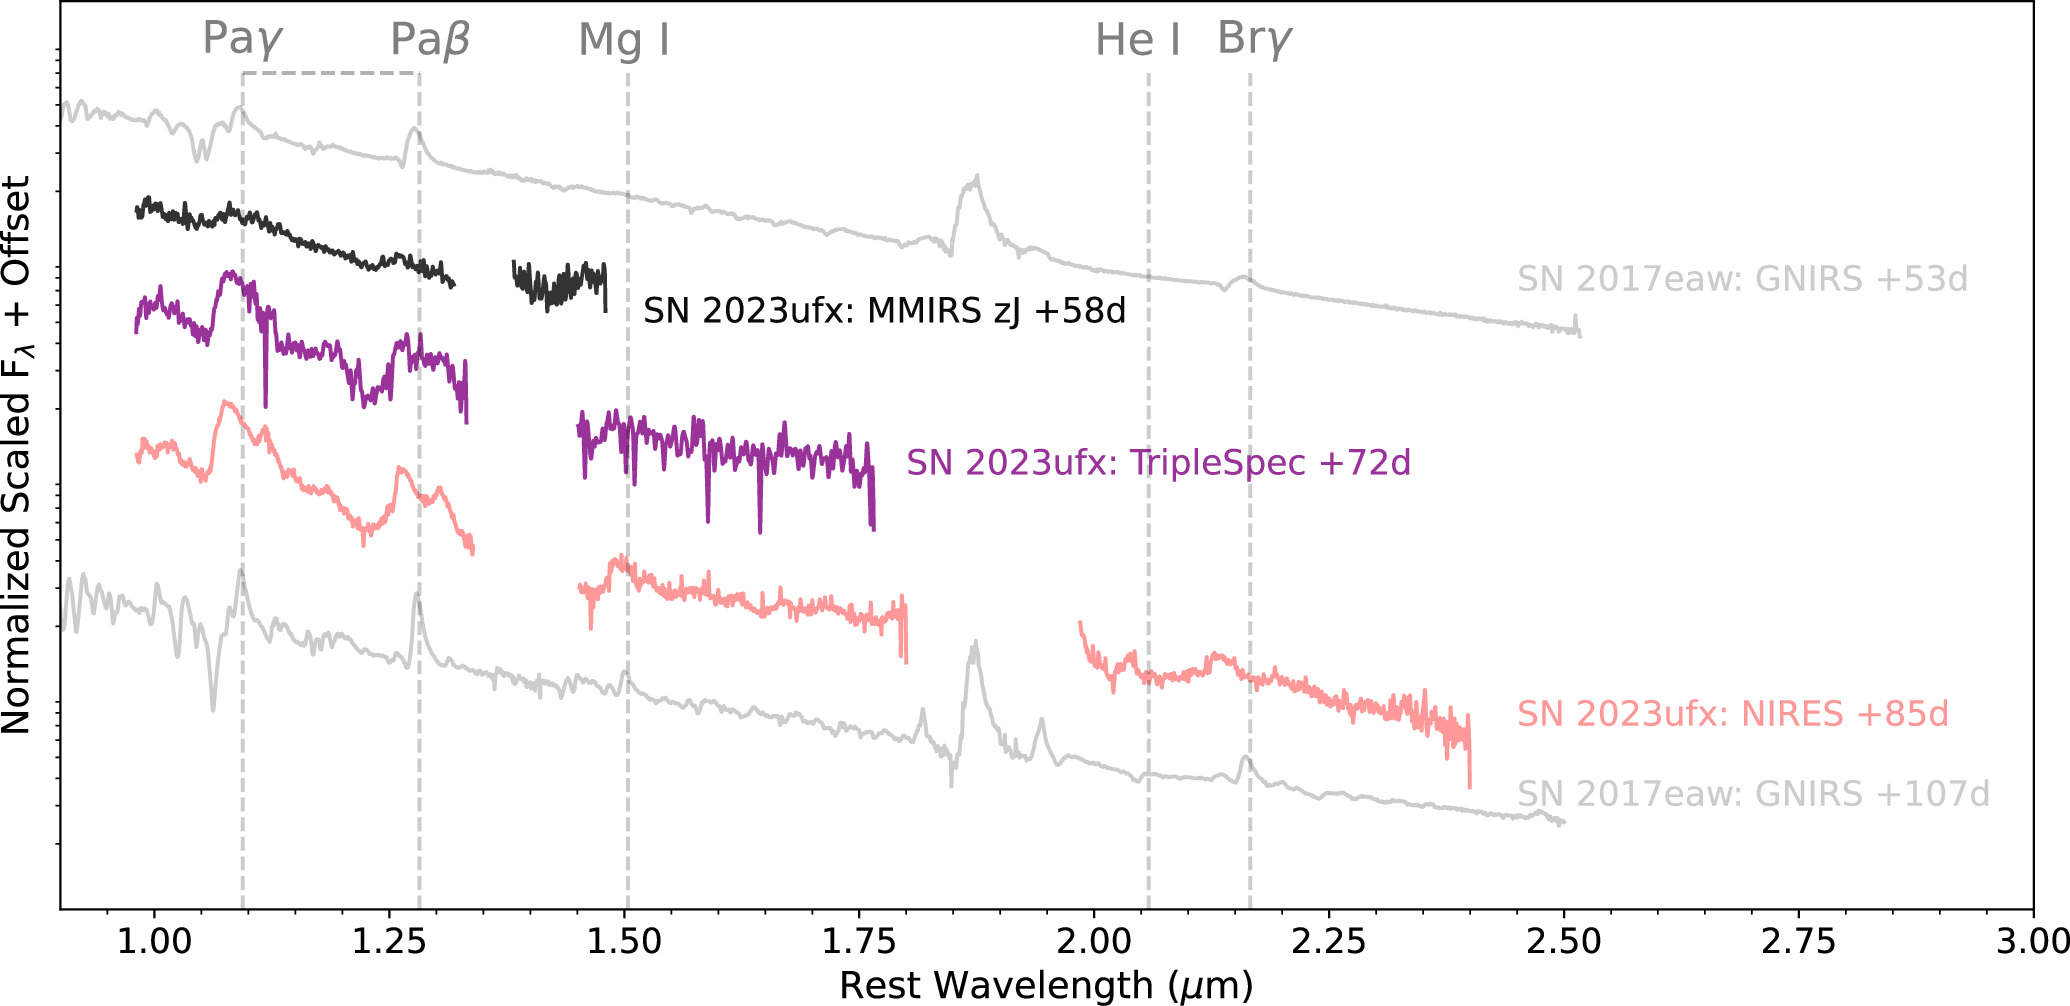
Figure 12. NIR spectra of SN 2023ufx between 58 and 85 days. All spectra have been corrected for redshift and reddening. Regions of high telluric absorption have been masked out. By day 81, the Paγ and Paβ H lines develop a clear double peak. Two NIR spectra of the more typical SN IIP 2017eaw (J. Rho et al. 2018) at closest epochs to SN 2023ufx are plotted for comparison.
Download figure:
Standard image High-resolution imageWe compare the scaled and normalized Paγ and Paβ profiles with Hα in the velocity space in Figure 13. The similarities in the overall line profile shapes and line widths (∼10,000 km s−1) between them in SN 2023ufx suggest that the developing second peak in Hα (which is later clearly seen in nebular spectra; Figure 8) is likely due to hydrogen emission and not blending of other species. We note that Paγ in particular can be contaminated by He i 10830 Å, but given the similarities between Paγ and Paβ line profiles, it is likely that this contamination (if any) is not significant. The marginal excess on the blue side of the Hα over Paγ and Paβ could be due to the emerging presence of [O i] λλ6300, 6364 around day ∼86, which strengthens significantly in the nebular spectra (Figure 8). While the overall line widths are similar between optical and NIR, the Paschen lines show the presence of two distinct peaks that appear to be more blended in the optical Hα profile (Figure 13). This could be due to hydrogen spectral lines in the Paschen and Balmer series having transitions starting at different energy levels (n = 3 versus n = 2 in the orbitals of a hydrogen atom) and thus potentially a different transparency to the ejecta.
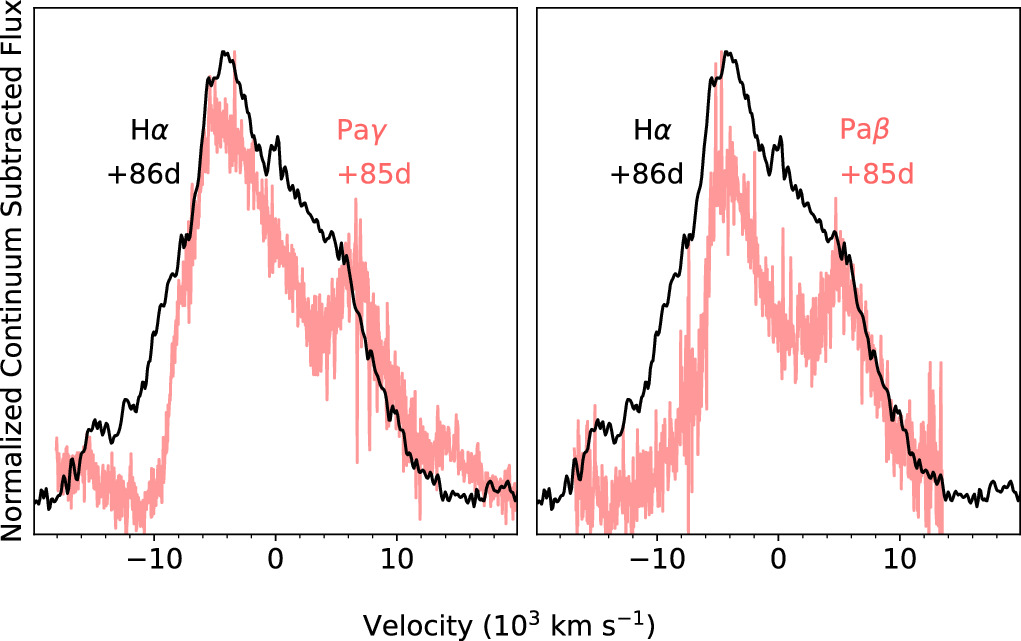
Figure 13. Comparison between optical Hα line profile on day 86 with Paγ (left) and Paβ (right) line profiles in the NIR on day 81 in the velocity space. Rest wavelengths of Hα, Paγ, and Paβ are assumed to be at zero velocity. Double peaks in the NIR H lines suggest that observed asymmetry in the optical could be due to the asymmetry of the H-ejecta distribution from the SN explosion. The narrow line atop the broad Hα is possibly from the host.
Download figure:
Standard image High-resolution image6. Progenitor Properties
6.1. Hydrodynamic Models: MESA+STELLA Model Grid
To explore the effects of the hydrogen-rich envelope (H-envelope) being stripped during stellar evolution of SNe II progenitors, D. Hiramatsu et al. (2021a) constructed a large MESA (B. Paxton et al. 2011, 2013, 2015, 2018, 2019) +STELLA (S. I. Blinnikov et al. 1998, 2006; S. Blinnikov et al. 2000; S. Blinnikov & E. Sorokina 2004; P. V. Baklanov et al. 2005) model grid assuming a single progenitor channel (i.e., mass loss due to stellar winds alone). In the construction of the MESA+STELLA model grid, D. Hiramatsu et al. (2021a) considered SPSNe as a transitional class between SNe IIL and IIb, having a narrow range of H-envelope mass left at core-collapse (0.91 M⊙ ≲  ≲ 2.12 M⊙) with a higher-than-average nickel nucleosynthesis. A detailed description of the model grid and dependent parameters is presented in the Appendix of D. Hiramatsu et al. (2021a).
The H-envelope in the model grid is stripped arbitrarily by varying ηwind and, there exists no one-to-one mapping between the total mass left at core-collapse, Mtot and MZAMS. Thus, following D. Hiramatsu et al. (2021a), we split the mass at core-collapse in the models into  and
and  , such that
  = Mtot -
  at core-collapse. The
  is less sensitive to H-rich envelope stripping and metallicity for massive stars with MZAMS ≲ 30M⊙ (S. E. Woosley & T. A. Weaver 1995; S. E. Woosley et al. 2002), although binary interaction, which is not accounted for in these models, may alter the relation (e.g., E. Zapartas et al. 2019, 2021). We can then translate the estimated
  to MZAMS by using the relation between these parameters from the stellar evolution model grid of T. Sukhbold et al. (2016).
The model grid constructed with MNi fixed at 0.1 M⊙ is the closest to the observed 56Ni mass of MNi ∼ 0.14 M⊙. In order to avoid any systematic effects in the comparison between data and the model grid, we scale our pseudo-bolometric light curve to match the fixed 0.1 M⊙56Ni mass of the model grid. Theoretical models have suggested that the extra heating from additional 56Ni does not generally affect the luminosity of the IIP light curve during the plateau phase (e.g., D. Kasen & S. E. Woosley 2009; M. C. Bersten 2013; J. A. Goldberg et al. 2019). Similarly, the early part of the light curve dominated by shock cooling is also likely to be independent of 56Ni. Thus, we scale the pseudo-bolometric (UBgVri) light curve of SN 2023ufx constructed as described in Section 4.3 after the end of the plateau phase (i.e., after tPT) to compare with the model grid of D. Hiramatsu et al. (2021a) with the MNi fixed at 0.1 M⊙. We note that scaling down for nickel mass in our procedure does not affect the peak and plateau luminosities.
We perform χ2 fitting between the scaled pseudo-bolometric light curve and the complete set of model grid light curves (MNi = 0.1 M⊙). The best-fit model has the highest likelihood value, assuming the standard definition of χ2 as our likelihood function. In Figure 14, we show the best-fit model with the highest likelihood to the scaled pseudo-bolometric light curve. We find that the extreme short-plateau of SN 2023ufx can be approximately reproduced with  ∼ 1.2 M⊙ and an Mtot ∼ 8–9.5 M⊙. We present univariate marginal likelihood distributions of
  and Mtot in Figure 15.
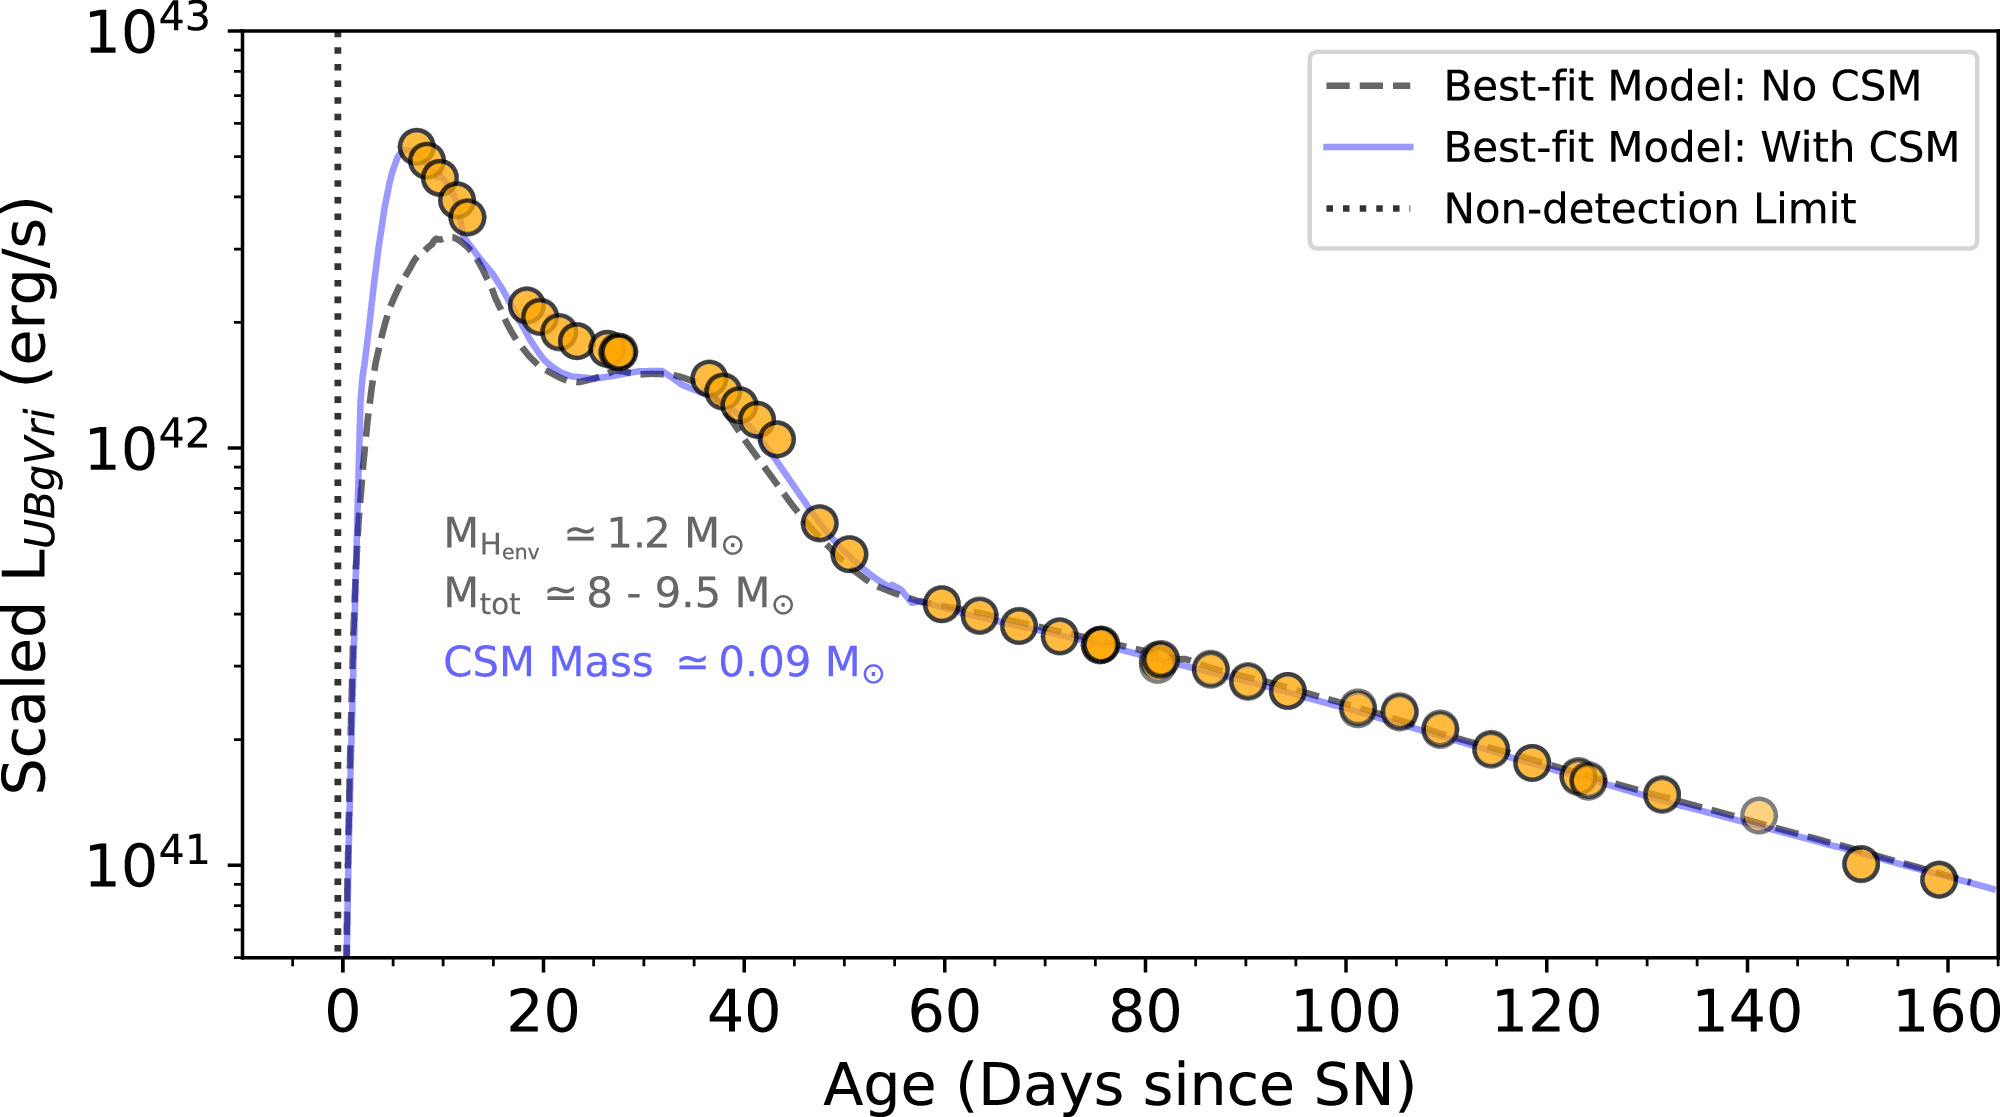
Figure 14. The pseudo-bolometric light curve of SN 2023ufx scaled to MNi = 0.1 M⊙ and overlaid with the “best-fit” (i.e., with the highest likelihood) MESA+STELLA light curves from the model grids set at MNi = 0.1 M⊙ (see Section 6.1) with and without the presence of CSM. The most likely value of the hydrogen envelope is around ∼1.2 M⊙ and the total mass of the progenitor at core-collapse is ∼8–9.5 M⊙. CSM is required to account for the luminosity at early times (≲10 days). The best-fit CSM model has a mass-loss rate of ∼3 × 10⁻³ M⊙ yr−1 for a period of 30 yr before core-collapse. This accounts for a total of 0.09 M⊙ CSM with a radial extent of ∼9.5 × 1015 cm, associated with the rapid early decline observed in SN 2023ufx.
Download figure:
Standard image High-resolution image
Figure 15. Left panel: marginal normalized likelihood distribution of  over the full parameter space of the MESA+STELLA model grid without any CSM (see Section 6.1). The distribution peaks around ∼1.2 M⊙, suggesting partial stripping of the H-envelope in SN 2023ufx. Middle panel: marginal normalized likelihood distribution of Mtot over the full parameter space of the MESA+STELLA model grid without any CSM. The total mass distribution of the progenitor at core-collapse has the highest likelihood between 8 and 9.5 M⊙. Right panel: marginal normalized likelihood distribution of the mass-loss rate over the parameter space of the MESA+STELLA model grid where additional powering was introduced through CSM (see Section 6.1). The distribution peaks around a mass-loss rate of 3 × 10⁻³ M⊙ yr−1 to explain the early decline in SN 2023ufx.
Download figure:
Standard image High-resolution imageThe parameters  and Mtot are our primary interest to estimate the hydrogen envelope and the He-core mass at the time of core-collapse. Based on these “best-fit” values, by definition, the
  for SN 2023ufx is between ∼5.8 and 8.3 M⊙. Using the
  to MZAMS relation in T. Sukhbold et al. (2016), we translate this He-core mass range to MZAMS ∼ 19–25 M⊙. These massive progenitor estimates are generally consistent with the mass estimates (MZAMS ∼ 18–22 M⊙) of other luminous SPSNe (like SNe 2006Y, 2006ai, 2016egz; D. Hiramatsu et al. 2021a). A more massive progenitor than typical SNe II with a small hydrogen envelope at core-collapse suggests that significant stripping could have occurred in the evolution of the progenitor of SN 2023ufx, increasing support for luminous SPSNe having properties that lie between SNe II and SNe IIb.
As our scaling procedure does not scale down the peak and plateau luminosities, the inferred best-fit He-core mass will be not be affected. However, an important caveat to note is that since the plateau length is expected to decrease when we scale the 56Ni down (J. A. Goldberg et al. 2019; D. Hiramatsu et al. 2021a), our estimated hydrogen envelope mass of ∼1.2 M⊙ from comparisons utilizing the scaled LC (where such a change in length was not accounted for) is thus an upper limit. This potentially suggests an even more stripped scenario in reality, further strengthening our scientific conclusions. As the mass at core-collapse (Mtot) is the total of the hydrogen envelope and helium core, the effect on this parameter will be similar. Thus, we do not introduce any unintended biases in our inferred progenitor estimates through our scaling.
In SN 2023ufx, it is not the lack of heating from 56Ni that is causing the shortening of the plateau, as it has among the highest amount of 56Ni synthesized in SNe II (see Section 4.3). Rather, it is likely the small H-envelope (∼1.2 M⊙) that is responsible, though there can be degeneracies due to the influence of explosion energy and progenitor radius. Specifically, for a given model grid in D. Hiramatsu et al. (2021a) with constant nickel mass, a similar luminosity (at 50 days) and plateau length can be achieved through degenerate combinations of progenitor radius, explosion energy, and ejected mass (see Equation (1) in J. A. Goldberg & L. Bildsten 2020).
It has also been noted through theoretical models that r-process enrichment in H-rich supernovae could also truncate the plateau duration length as the H-rich photosphere enters the r-process-enriched layers (A. Patel et al. 2024). In such a scenario, it is expected that the late-time (∼200 days) luminosity would be in excess of that expected from radioactive decay chain, due to excess heat trapped by the high-opacity r-process-enriched core. However, for SN 2023ufx, the luminosity continues to decline faster than radioactive decay chain (Figure 5), suggesting that the shortening of the plateau may not be due to r-process enrichment. Thus, a combination of high 56Ni mass and a short-plateau duration can rule out alternative theories for the observed trends in SN 2023ufx. As noted before, a high 56Ni mass could be overestimated due to luminosity contributions from CSM interaction at late times.
While the plateau and radioactive phase of the observed light curve can be explained with these models, it is clear from the comparisons that the first ∼10 days of the pseudo-bolometric LC is significantly underestimated in the best-fit model (Figure 14). Hydrodynamic modeling of SNe II has suggested that the early phases are dominated by the presence of dense CSM surrounding the progenitor star (e.g., V. Morozova et al. 2018). Thus, we propose CSM interaction as a possible source for the early excess observed in SN 2023ufx. As before, we compare with a light-curve model grid from D. Hiramatsu et al. (2021a), where a wind density profile  is added to a subset of the explosion models resulting in SPSNe (i.e., for models with 0.91 M⊙ ≲
  ≲ 2.12 M⊙). With an H-envelope of ∼1.2 M⊙ in SN 2023ufx, these models are valid for our case. Here,
  is a constant wind mass-loss rate, and νwind is the wind velocity for an arbitrary amount of time, twind (i.e.,
  × twind = MCSM). The model grid includes
  values between 10−5 and 10−1 M⊙ yr−1 and two twind values at 10 and 30 yr for each short-plateau SN model, assuming a typical νwind = 10 km s−1 (e.g., T. Moriya et al. 2011). Note that these mass-loss rates are much higher than observed mass-loss rates of massive stars (N. Smith 2014; E. R. Beasor et al. 2020).
Similar to the comparisons with the non-CSM model grid, we perform χ2 fitting between the observed pseudo-bolometric light curve and the CSM model grid. The best-fit light curve with additional powering from CSM is shown in Figure 14. We find that early excess in the observed pseudo-bolometric light curve can be explained with  ∼ 3 × 10⁻³ M⊙ yr−1 for a period of twind = 30 yr. As the best-fit models show, the additional power from the CSM in these models affects only the early evolution before the plateau phase. So, the estimated
  and Mtot from the best-fit models with and without CSM will be identical. In Figure 15, we show the univariate marginal likelihood distribution of
  . The best-fit
  ∼ 3 ×10⁻³ M⊙ yr−1 suggests enhanced mass loss (a few orders of magnitude higher than the typical RSG steady-state mass loss
  ∼ 10−6 M⊙ yr−1; E. R. Beasor et al. 2020) for a few decades before the SN explosion. This corresponds to a total CSM mass of MCSM ∼ 0.09 M⊙ for a period of 30 yr. A similar close-in dense CSM (in a confined shell of ∼0.1 M⊙) was proposed to be responsible for the early light-curve evolution of SN IIn 1998S for the first ∼10 days (N. N. Chugai 2001). In SN 2023ufx, for the assumed CSM velocity (∼10 km s−1) and the best-fit CSM duration, twind = 30 yr, the radial extent of this CSM is ∼9.5 × 1015 cm. As a sanity check, for a typical SN shock velocity of ∼10,000 km s−1, this distance can be swept in ∼10 days, which is consistent with the observed rapid decline of the light curve for the first ∼10 days (Figures 2 and 14). We note that our scaling of the pseudo-bolometric light curve does not affect the best-fit measurements of CSM, as the peak luminosity is not scaled down, where the CSM is expected to contribute.
Dense CSM around massive stars through mass loss is expected to produce narrow high-ionization emission lines in the early spectra (L. Dessart et al. 2017; N. Smith 2017). As presented in Section 5.1, early spectra of SN 2023ufx do not show such features despite an enhanced mass-loss rate of ∼3 × 10⁻³ M⊙ yr−1 suggested from light curve modeling. One reason why no corresponding flash features were observed could be simply a lack of an early enough spectrum (earliest spectrum in our work is at day 7 and day 3.5 in M. A. Tucker et al. 2024). Another possibility is that the CSM responsible for a rapid decline in the observed light curve is asymmetrically distributed around the progenitor where ejecta CSM interactions still happen but narrow lines are not observed from several viewing angles (see N. Smith 2017).
The progenitor ZAMS mass inferred from hydrodynamic modeling (≃19–25 M⊙) is higher than typical RSG progenitors (ZAMS mass ≃8–17 M⊙) identified to be associated with SNe II through pre-explosion imaging (S. D. Van Dyk et al. 2003; S. J. Smartt 2009, 2015; S. D. Van Dyk 2017). The high progenitor mass inferred for SNe 2006Y, 2006ai, and 2016egz highlighted a possibility that partially stripped massive progenitors end their evolution as RSGs and explode as SPSNe, rather than getting stripped enough to be SESNe or collapse to form black holes (D. Hiramatsu et al. 2021a). The even higher progenitor mass scenario, coupled with the shortest-plateau among IIP, suggests that SN 2023ufx could be consistent with this physical picture. At the same time, much lower progenitor masses were inferred for SPSNe 2020jfo (ZAMS mass ∼12 M⊙; R. S. Teja et al. 2022) and 2018gj (ZAMS mass ≤13 M⊙; R. S. Teja et al. 2023). The clear distinguishing property among these two classes of SPSNe could be their luminosities (See Figure 5), suggesting the possibility of two distinct progenitor channels to form a short-plateau in the observed light curve. Thus, studying a larger sample of SPSNe and constraining their progenitor masses could provide some insights into the proposed RSG problem (S. J. Smartt 2015) where there is an apparent discrepancy between progenitor masses of SNe II and our understanding of RSG evolution. While the models in our comparison assume a single-star evolution, interacting binary progenitor systems could also be a plausible scenario for formation of a short plateau in SNe IIP (J. J. Eldridge et al. 2017, 2018).
In principle, one may argue that massive single stars evolving in low-metallicity environments may not have enough mass loss to significantly strip the hydrogen envelope. However, recent observational and theoretical studies of RSGs have suggested that for extremely massive progenitors, their wind mass-loss rates may be independent of metallicity (e.g., S. R. Goldman et al. 2017; S.-H. Chun et al. 2018; C. P. Gutiérrez et al. 2018; M. Yang et al. 2023; K. Antoniadis et al. 2024). Thus, it is possible that SN 2023ufx and other SPSNe with a subsolar host metallicity could have formed from massive single-star evolution. A massive RSG (ZAMS mass ∼8–17 M⊙) was suggested to be the progenitor of SN IIP 2015bs with the lowest reported metallicity of any SNe II and significant stripping of its hydrogen envelope (J. P. Anderson et al. 2018).
These results suggest that a larger statistical investigation of both RSG and SN II populations at various metallicities and different evolutionary mass-loss models could be necessary to robustly distinguish between the potential formation channels of SPSNe.
6.2. Progenitor Mass: Nebular Spectroscopy
As the SN evolves into the nebular phase, the ejecta become optically thin, revealing the inner structure of the SN. From modeling the observed spectra at nebular phases, the strength of the [O i] λλ6300, 6364 doublet is thought to be a good indicator of the ZAMS mass of the progenitor (e.g., A. Jerkstrand et al. 2014).
Given SN 2023ufx has an intermediately sized hydrogen envelope (between ∼1 and 2 M⊙), neither the standard comparisons with theoretical nebular spectral models for Type IIP with a large hydrogen envelope (A. Jerkstrand et al. 2014) nor Type IIb spectral models with minimal hydrogen envelope (A. Jerkstrand et al. 2015) are in the right regime for constraining the progenitor mass. Therefore, we construct a non-local thermodynamic equilibrium (NLTE) spectral synthesis model following the prescription in S. Barmentloo et al. (2024).
We assume that the supernova may be approximated as a spherically symmetric, neutrino-driven explosion. For this assumption, three Type Ib models with initial helium core masses of  = 4.0, 6.0, and 8.0 M⊙ as used in S. Barmentloo et al. (2024) (themselves taken from S. E. Woosley 2019; T. Ertl et al. 2020) were used as the initial setup. At explosion, these masses have decreased through mass loss to 3.2, 4.4, and 5.6 M⊙. These models are divided into seven different compositional zones in the core and envelope. To these helium cores, hydrogen envelopes of masses 1 and 2 M⊙ were attached, with the same chemical composition as in A. Jerkstrand et al. (2015), based on models for SN 1993J from S. E. Woosley et al. (1994). The choice of envelope masses is based on our independent estimates from light-curve analysis (see Section6.1). Following the velocity profile of Hα (Figure 10), this mass was distributed between 6000 and 11,000 km s−1, following a ρ ∝ V−6 density profile. The core zones are kept at the same velocities (∼4500 km s−1) as in S. Barmentloo et al. (2024), which is required by our spectra to reproduce the broad observed lines from these regions (i.e., [O i] and [Ca ii] doublets). This leaves room for the He/C- and He/N-envelope layers only between ∼4500 and 6000 km s−1, making these zones denser than in S. Barmentloo et al. (2024). Of these, only the He/C layer is partially mixed (18%, 10%, and 10% for
  = 4.0, 6.0, and 8.0 M⊙, respectively) into the core, with the He/N- and H-layers left unmixed. This mixing prescription is adopted based on the work by T. Shigeyama et al. (1994), who found that for hydrogen envelope masses of 1–2 M⊙, no significant in-mixing of the hydrogen layer should occur. Additionally, introducing mixing produces more parabolic line profiles that do not match the observed asymmetric line profiles (Figure 8). A final consequence of this setup is that the required explosion energies are higher than models without the hydrogen envelope. For example, in the 6 M⊙ He-core model, adding hydrogen envelopes of 1 and 2 M⊙ increases the explosion energy of the bare helium star from 1.07 B to 1.1 and 1.7 B, respectively.
We compare the two nebular spectra of SN 2023ufx at days ∼188 and ∼211 with one  = 4.0 M⊙ and two
  = 6.0 M⊙ models (with hydrogen envelope masses between 1 and 2 M⊙) in Figure 16. The data and model are empirically scaled by integrating the total flux between 4000 and 6000 Å. We do not include the models with He-core mass of 8.0 M⊙ as they significantly overshoot the observed [O i] emission feature strengths.
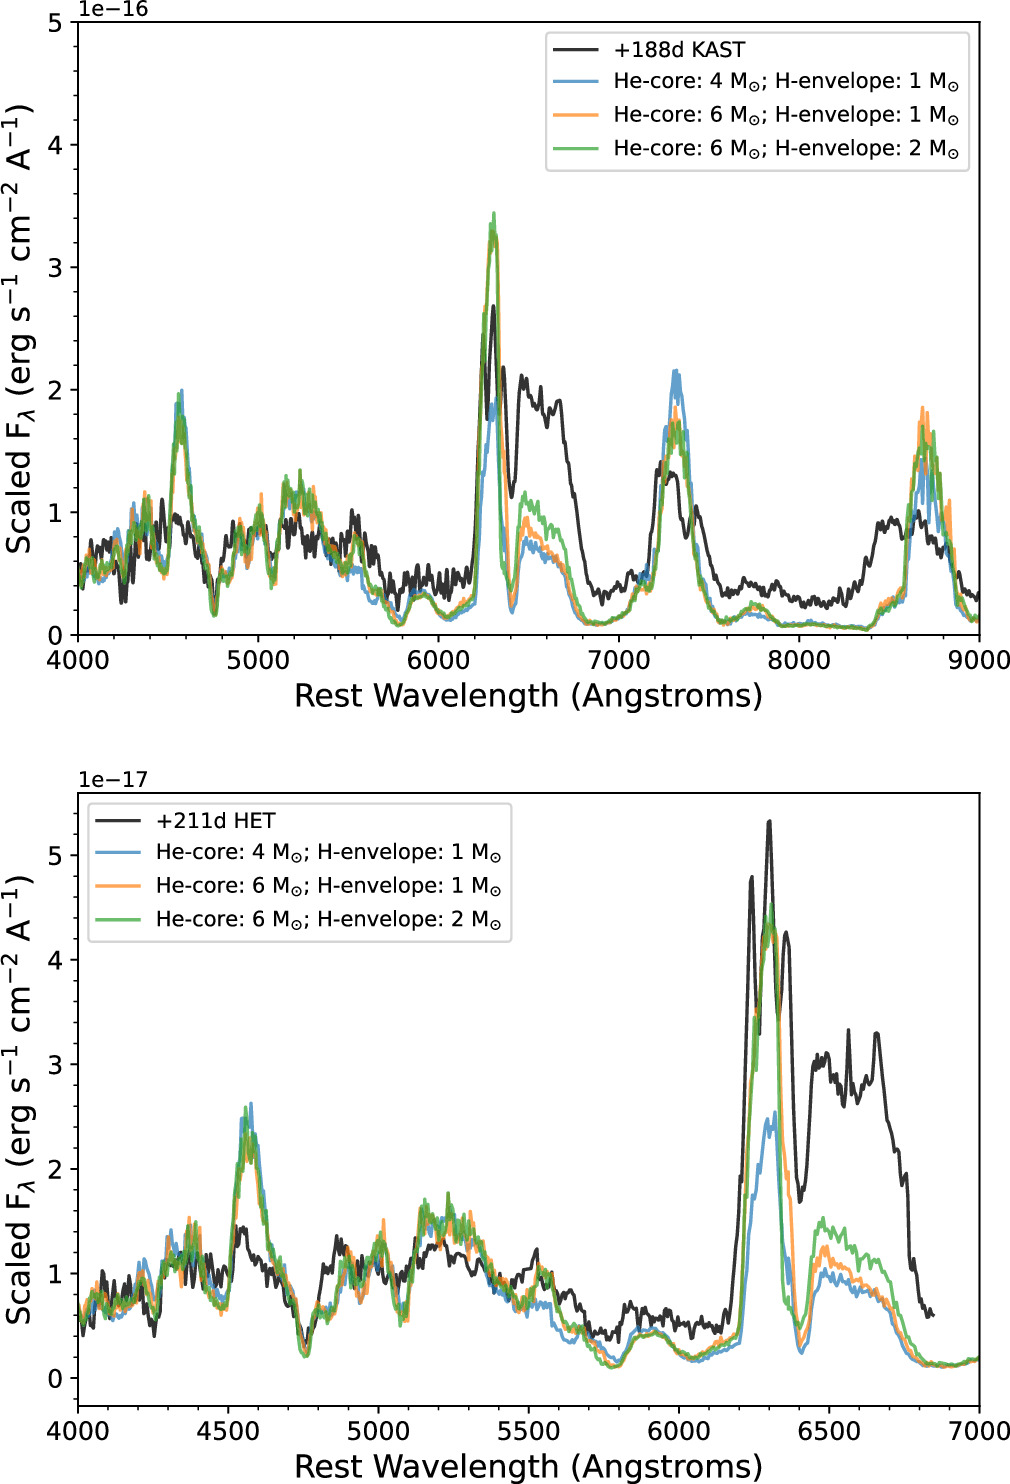
Figure 16. Nebular spectra at days 188 (top) and 211 (bottom) compared with three synthetic Ib models at day 200, assuming a He-core mass of 4 M⊙ with an additional hydrogen envelope mass of 1 M⊙, and 6 M⊙ He-core with additional hydrogen envelope masses of 1 and 2 M⊙, respectively. The observed strength of the [O i] doublet is most similar to the models with an He-core mass of 6 M⊙, though none of the models can account for the observed strength of Hα.
Download figure:
Standard image High-resolution imageInterestingly, even after accounting for 1–2 M⊙ of H, none of the models can reproduce the observed strength of Hα in the nebular phases (Figure 16). As independent light-curve modeling suggests a hydrogen envelope mass of ∼1.2 M⊙, and SN 2023ufx has the shortest observed plateau length among all SNe IIP, increasing the hydrogen envelope mass further in our nebular models is not well motivated. One scenario to explain the additional Hα luminosity could be from CSM interaction. In SN 1993J, the ejecta interaction with CSM powered the boxy Hα line luminosity almost exclusively at early phases, while the light curve still declined, and other lines remained little affected (e.g., J. C. Houck & C. Fransson 1996; T. Matheson et al. 2000a; C. Fransson et al. 2005). In the case of SN 2023ufx, the overall light curve continues to decrease in luminosity at nebular phases, but Hα, [Ca ii], and Ca ii triplet spectral features all develop “boxy” signatures with time, suggesting a possibly declining interaction over time scenario. Also, as we discuss in the next Section, these developments (including the rapid evolution of [O i] doublet) could also be due to an asymmetric distribution of ejecta with H-rich material being ejected the farthest out and/or an asymmetric distribution of CSM. The models also significantly overestimate the strength of Mg i] 4571 Å line profile. This discrepancy between SN 2023ufx data and models around Mg i] 4571 could be due to the assumptions on the specific ionization balance of Mg and also on the adopted line blocking operating in the early nebular phases, especially at blue wavelengths (see A. Jerkstrand et al. 2015).
Despite the unique line profiles of SN 2023ufx and the caveats associated with our models, a high initial He-core mass of at least ∼6 M⊙ is needed to account for the strength of the [O i] doublet by day 211 (Figure 16). One caveat to note though is that there is evidence of potential CSM interaction at late times, so the [O i] luminosity could also be partly powered by it. The model with initial He-core mass of 4 M⊙ underestimates and 8 M⊙ over-estimates the [O i] strength, suggesting the initial He-core mass to be ∼6 M⊙. This is consistent with the lower limits from independent light-curve modeling analysis and suggests the progenitor of SN 2023ufx was massive. Based on massive helium star evolutionary models that connect He-core mass with the ZAMS mass, a ∼6 M⊙ He-core can map to massive progenitor ZAMS masses of ∼19–25 M⊙ (see Figure 1 in S. E. Woosley 2019), which we independently inferred from our light-curve modeling (see Section 6.1). Although, the exact connection between the two can depend on when the H-envelope was lost, which is determined by whether the He core does or does not grow through shell burning.
In CCSNe, generally, the amount of Ca synthesized in the ejecta is insensitive to the ZAMS mass of the progenitor, while mass of O-core depends on it, making the [Ca ii] / [O i] flux ratio especially important as an indicator of the progenitor mass (e.g., C. Fransson & R. A. Chevalier 1989).
We fit the line profiles of [Ca ii] and [O i] with a combination of Gaussians and an underlying continuum. We discuss this procedure in detail in Section 7. From our modeling of the line profiles in the nebular spectrum on day 188, we find the ratio of fluxes [Ca ii] / [O i] = 0.93. A value of [Ca ii] / [O i] = 1.43 was adopted as a rough division between SNe II and SESNe (with lower values being closer to SESN with larger O-core mass; A. Jerkstrand 2017; C. P. Gutiérrez et al. 2020; D. Hiramatsu et al. 2021a). Thus, the low [Ca ii] / [O i] in SN 2023ufx suggests a high O-core mass, supporting a massive progenitor scenario. In fact, any potential contamination to the [Ca ii] line profile will only further decrease the ratio, strengthening our conclusion that the progenitor of SN 2023ufx was more massive than a typical SN II. This is generally in agreement with the progenitor masses of SPSNe being between that of SNe II and SESNe (see Figure 12; D. Hiramatsu et al. 2021a). A similar “transitional” nature between SN II and SESN based on the [Ca ii]/[O i] ratio has been previously noted for SNe 2015bs (J. P. Anderson et al. 2018) and 2017ivv (C. P. Gutiérrez et al. 2020). An important caveat to note is that the [Ca ii]/[O i] ratio could be affected by the explosion energy due to more emission from synthesized Ca than the pre-existing Ca in the H-rich envelope as commonly seen in SESNe (H. Li & R. McCray 1993; K. Maguire et al. 2012; A. Jerkstrand et al. 2015; A. Jerkstrand 2017). Nevertheless, this line ratio provides a qualitative estimate of the massive progenitor of SN 2023ufx, which is consistent with our results from independent light-curve analysis, as presented in Section 6.1.
Finally, our initial assumptions of 1D spherically symmetric explosion in constructing the NLTE models also might not be ideal to explain the unique line profile features in SN 2023ufx. Nevertheless, our independent light-curve modeling clearly suggests that SN 2023ufx exploded with a small hydrogen layer, too small to be properly treated as a typical SN II and too large to be an SN Ib with additional H introduced like in our nebular spectral models. A more thorough construction of synthetic nebular models with careful consideration of hydrogen ejecta distributions and velocities to reproduce the unique line profiles of SN 2023ufx is beyond the scope of the current paper and will be part of future work.
7. Asymmetric Explosion
There has been growing evidence that most CCSNe are inherently asymmetric in their explosion mechanisms (e.g., N. N. Chugai et al. 2005; H. T. Janka et al. 2007; K. Maeda et al. 2008; L. A. Lopez et al. 2009; R. Chornock et al. 2010; A. Wongwathanarat et al. 2013; B. W. Grefenstette et al. 2014, 2017; J. Larsson et al. 2023; D. Milisavljevic et al. 2024; M. Shrestha et al. 2024; A. Singh et al. 2024; B. F. A. van Baal et al. 2024). The distribution of radioactive 44Ti, synthesized in the core-collapse that formed the supernova remnant Cassiopeia A was revealed to be from a highly asymmetric bipolar explosion (B. W. Grefenstette et al. 2014, 2017).
As the SN becomes more nebular and the optical thickness of the ejecta decreases, the line profile diagnostics can give insights into the ejecta geometry causing that emission. From observations of large samples of SESNe, it has been shown that nebular line profile evolution of [O i] λλ6300, 6364 for a large fraction of SNe Ib/c shows asphericity in the ejecta distribution (e.g., K. Maeda et al. 2008; M. Modjaz et al. 2008; S. Taubenberger et al. 2009; D. Milisavljevic et al. 2010; Q. Fang et al. 2024).
Late-time spectra of SN 2023ufx, between days ∼120 and ∼188, show significant changes in O, H, and Ca emission lines (see Section 5.1), with each line suggesting the presence of a blue- and redshifted component. Thus, one plausible explanation for these observations would be a combination of ejecta interaction with an asymmetric CSM (e.g., like in SN 1993J; T. Matheson et al. 2000a, 2000b) and/or an asymmetry in the geometry of the explosion, propelling material preferentially in directions along our line of sight.
To study the developing emission peaks in [O i] λλ6300, 6364 and Hα, we simultaneously fit both the [O i] doublet and Hα profiles at nebular phases. For the [O i] doublet, we adopt the following model assumptions:
- 1.The observed three peaks are fit with the sum of a blue- and redshifted doublet where the FWHM is fixed between the two lines within each doublet (λ6300 and λ6364).
- 2.The distance between the central wavelengths associated with the two lines in the doublet is fixed at 64 Å.
- 3.We assume that the ratio between the λ6300 and λ6364 lines in the doublet will always be between 1:1 and 3:1 for both the blue- and redshifted components, based on predictions and observations for SNe II (e.g., C. Fransson & R. A. Chevalier 1989; J. Spyromilio et al. 1991). This implies that measuring the parameters of the λ6300 line in both the doublets suffices as the parameters of the λ6364 line are then tied.
For Hα, we consider two Gaussian components, with their central wavelengths, FWHMs, and amplitudes as free parameters. Thus, the composite model has 12 free parameters (amplitudes and FWHMs for blue- and redshifted [O i] doublets, wavelength associated with the λ6300 emission line in both [O i] doublets; amplitudes, FWHMs, and central wavelengths associated with the blue- and redshifted Hα profile).
We find that the observed [O i] λλ6300, 6364 with three distinct peaks on day 188 is best-fit with a combination of blue- and redshifted doublets (see Figure 17). Within each doublet, the ratio between the individual emission lines (6300/6364) is best fit at 1.14 ± 0.09, suggesting that at day 188, the O-ejecta is not yet optically thin (e.g., C. Fransson & R. A. Chevalier 1989). The blue- and redshifted λ6300 lines of the [O i] doublet have best-fit FWHM values of 865 ± 65 km s−1 and 784 ± 60 km s−1. The broad Hα profile is best fit with two Gaussians, one each accounting for the blue- and redshifted peaks. They have an FWHM of 3627 ± 204 km s−1 and 3373 ± 140 km s−1, respectively. Similar velocities between blue- and redshifted components within [O i] and Hα line profiles can indicate an axial symmetry in clumps moving toward and away from the observer. Additionally, H emission is possibly coming from a much faster moving ejecta than O, suggesting a spatially separated origin for the two species.
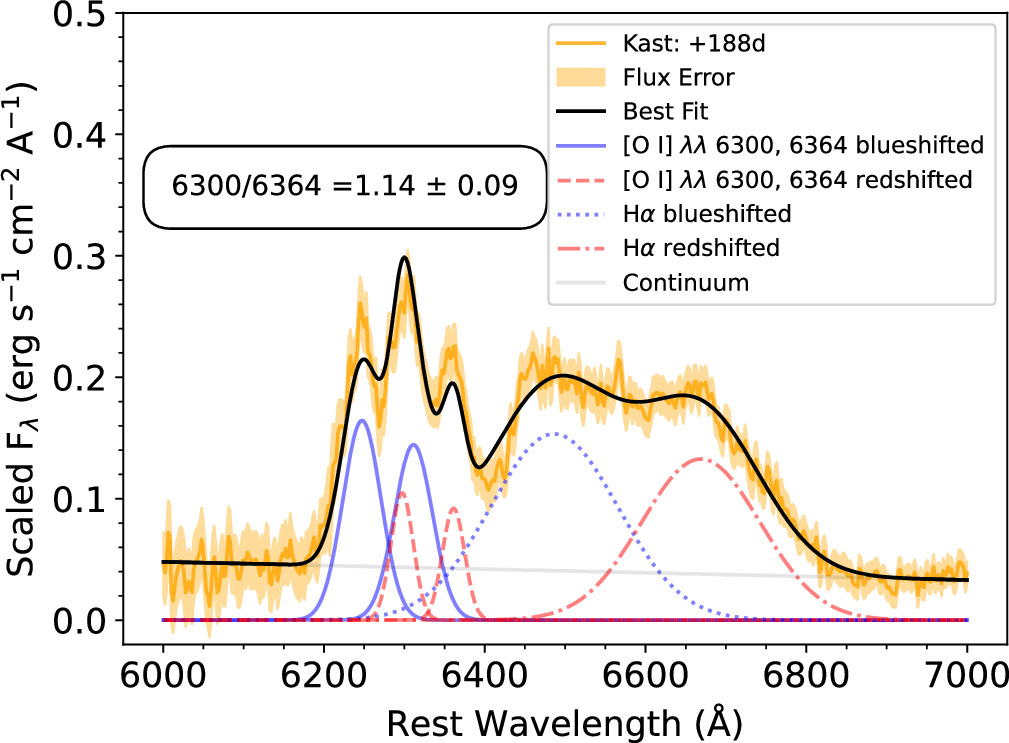
Figure 17. Composite multicomponent fit of [O i] λλ 6300, 6354 and Hα for the nebular spectrum at day 188. The best-fit line ratio between the individual emission lines in the [O i] doublet is 1.14 ± 0.09. The [O i] doublet and Hα both have a blue- and redshifted component that could be indicative of an asymmetric distribution of ejecta in SN 2023ufx.
Download figure:
Standard image High-resolution imageAs [O i] λλ6300,6364 in the nebular phase shows multiple peaks, it is important to check for contamination from other species. To do this, we compare the [O i] doublet with [O i] λ5577, another O emission line that is detected in the optical spectra of SN 2023ufx, following the method described in S. Taubenberger et al. (2009). After continuum subtraction, we rescale [O i] λ5577 line to 1/1.14 of its initial intensity (i.e., the best-fit ratio of 6364/6300 from modeling [O i] doublet), shift this scaled profile by 57 Å (equivalent to the 64 Å offset of the two lines in the [O i] doublet), and add it to the original [O i] λ5577 line profile. We find that such a modified [O i] λ5577 can qualitatively reproduce the observed triple-peak line profile of [O i] λλ 6300, 6364 in the nebular spectrum at day 211 (Figure 18). This clearly suggests that the observed three peaks in the [O i] doublet mostly comprise O and are not due to Hα or other contamination. This supports a physical picture where two blobs of O are preferentially ejected along our line of sight. The recently observed and well-studied SN 2023ixf was also observed to have an asymmetric [O i] profile with signatures of partial stripping of its hydrogen envelope (Q. Fang et al. 2025).
As discussed in Section 6.2, the Hα profiles at nebular phases in SN 2023ufx have a flat-top-like feature (see Figure 8). A flat-topped Hα can be associated with CSM interaction in a ring-like or shell of H around the progenitor, which could be powering the luminosity of Hα (e.g., R. A. Chevalier & C. Fransson 1994). Usually in SNe IIP, these boxy features in Hα associated with strong CSM interaction are observed at significantly later epochs: e.g., after ∼785 days in SN 2004et (R. Kotak et al. 2009; K. Maguire et al. 2010), SN 2008jb (J. L. Prieto et al. 2012), SN 2013ej (J. C. Mauerhan et al. 2017), iPTF14hls (J. E. Andrews & N. Smith 2018; J. Sollerman et al. 2019), and SN 2017eaw (K. E. Weil et al. 2020), while the corresponding phase is only ∼200 days for SN 2023ufx. Also, recent spectro-polarimetric studies of hydrogen-rich SNe II have revealed large-scale asymmetries in their helium cores at core-collapse (e.g., T. Nagao et al. 2019, 2024; M. Shrestha et al. 2024; A. Singh et al. 2024). In the case of SN IIP 2017gmr, an unprecedented and extended aspherical explosion was noted through early polarization observations, suggesting that asymmetries could be present not only in the helium core but also in a substantial part of the hydrogen envelope (T. Nagao et al. 2019). Thus, we cannot completely discriminate between the several origin scenarios and their combinations (asymmetric ejecta versus ring-like CSM versus asymmetric CSM) for explaining the observed Hα emission, based solely only on our two nebular spectra. However, based on velocity stratification between H and O, and similarities in the velocities of blue- and redshifted components within the doublet, O is likely to have been ejected preferentially along our line of sight.
Assuming a similar geometry for the Ca ejecta as O (in the case of a line-of-sight explosion), the observed [Ca ii] λλ7291, 7323 can be fit with the combination of blue- and redshifted doublets (Figure 19), where ratios between the individual lines were fixed at 1:1. We find that the blue- and redshifted λ7291 lines in [Ca ii] doublet have FWHMs of 2772 ± 70 km s−1 and 1660 ± 90 km s−1. A caveat to note for [Ca ii] is that the redshifted peak/shoulder (at a shift of ∼6000 km s−1 with respect to rest wavelength at λ7291; see Figure 10) could be due to the presence of [Ni ii] 7378 Å (A. Jerkstrand et al. 2015). A combination of [Ni ii] 7378 Å and weak [Fe ii] 7388 Å emission was reported for the short-plateau SN 2020jfo (R. S. Teja et al. 2022). This could explain the differences in the blue- and redshifted FWHMs in [Ca ii] doublet. Introducing these lines in our line profile modeling does not improve the model fits statistically, but the lack of similarly high-velocity redshifted emission features in O and H makes it likely that the [Ca ii] line profile has contamination from [Ni ii] 7378 Å.
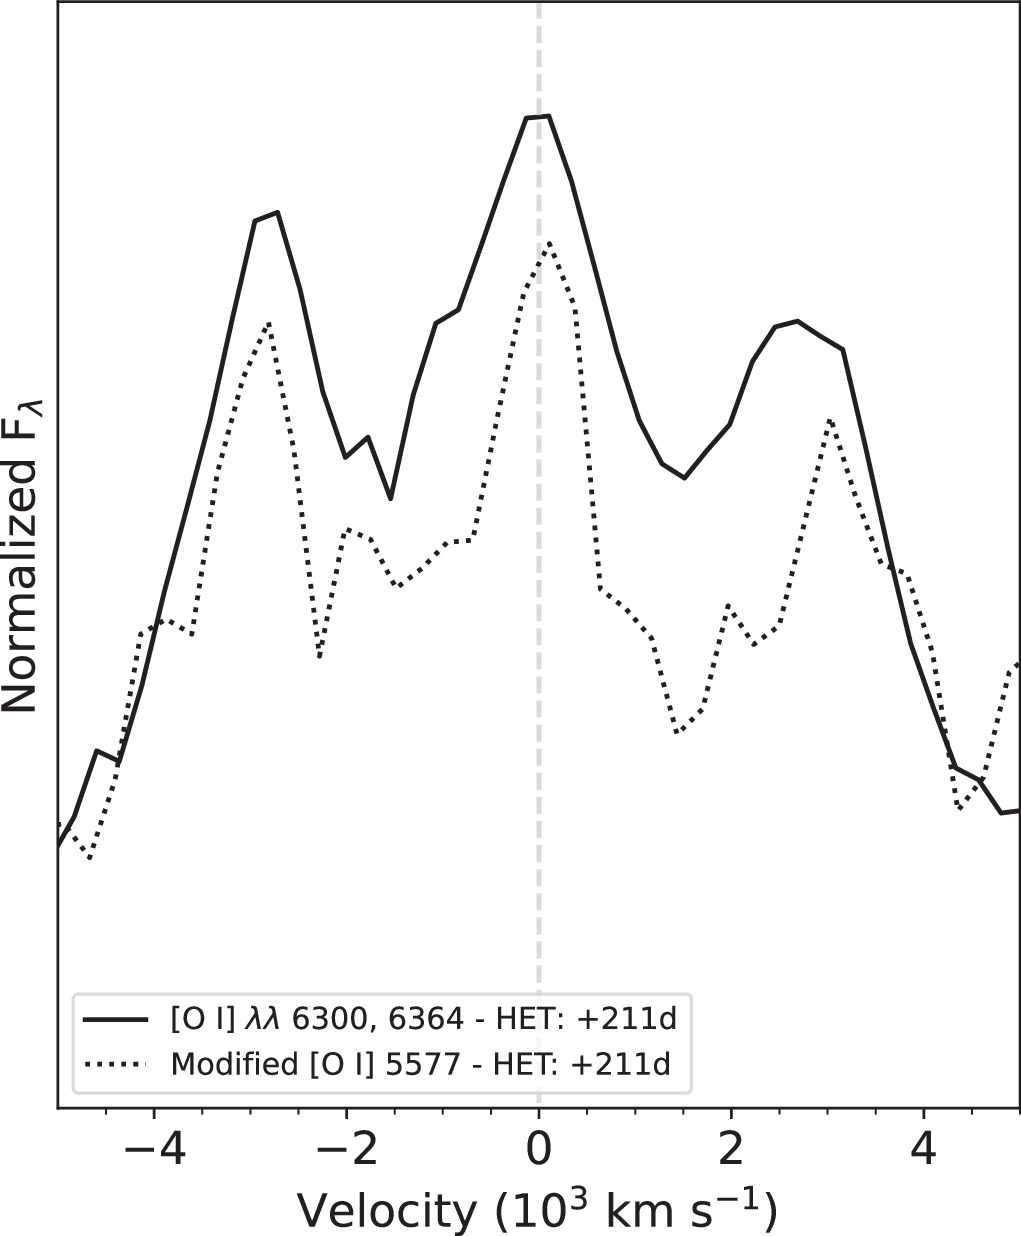
Figure 18. Comparison between [O i] λλ6300,6364 and modified [O i] λ5577. Three peaks in the modified [O i] λ5577 suggests that the observed three peaks in the [O i] λλ6300,6364 profile comprise mostly oxygen, ejected preferentially toward and away from our frame of reference. A vertical line shows the zero velocity at 6300 Å.
Download figure:
Standard image High-resolution image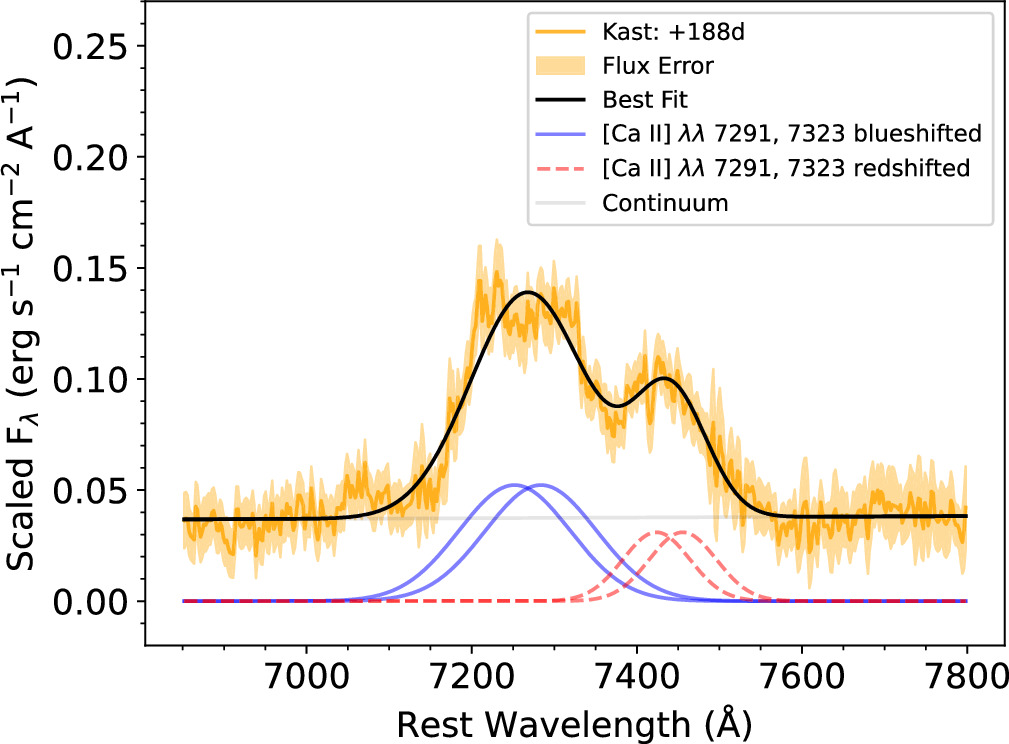
Figure 19. Two-component fit of [Ca ii] λλ 7291, 7323 for the nebular spectrum at day 188. Like O and H, the emission-line profile of Ca is also fit with a blue- and redshifted profile supporting the possibility of asymmetric explosion in SN 2023ufx.
Download figure:
Standard image High-resolution imageOur 1D line diagnostic tests are meant to be qualitative in nature to give an idea of the geometry of the explosion. A more quantitative analysis can be performed through 3D simulations of various explosion models to recreate the observed line profiles like those described in B. F. A. van Baal et al. (2024), which is beyond the scope of this work. However, a consistent trend of blue- and redshifted line profiles in SN 2023ufx at nebular phases suggests an asymmetric distribution of ejecta from the explosion of a massive progenitor, possibly interacting with an asymmetrically distributed CSM.
8. Summary and Conclusions
In this work, we report on our photometric and spectroscopic follow-up campaign of a luminous SN II, SN 2023ufx. We obtained photometry from immediately after the explosion to ∼250 days after it. Our optical spectral coverage extended between days 7 and 211, while we obtained three NIR spectra between days 51 and 85. We summarize our results as follows:
- 1.SN 2023ufx is a luminous (MV = −18.42 ± 0.08 mag) SNe II with the shortest observed plateau duration (tPT ∼ 47 days) among SNe IIP. After a rise time to peak luminosity ≲7 days, a rapid decline is observed in all bands before the start of the plateau phase. This decline rate (s1 = 3.47 ± 0.09 mag per 50 days) is among the fastest across all SNe IIP and explores a new region in the peak luminosity versus early decline phase space.
- 2.By studying the radioactive decay tail of SN 2023ufx, we estimate a total 56Ni mass of ∼0.14 ± 0.02 M⊙. This is higher than 56Ni production in most SNe II. As the radioactive tail of SN 2023ufx declines faster than the typical 56Co decay, we accounted for an incomplete trapping (T0 = 154.93
 days) of γ-rays. Some of the late-time luminosity might come from CSM interaction, in which case the estimated 56Ni could be overestimated.
 - 3.The early optical spectra of SN 2023ufx do not show flash features, suggesting that CSM around the progenitor if present is close by or asymmetrically distributed. Optical spectra of SN 2023ufx at the plateau phase differ from other SPSNe in two major ways: (1) while other SPSNe develop Fe ii absorption features early on in this phase, these features are extremely weak in SN 2023ufx, even by the end of the plateau phase, suggesting a low-metallicity ambient environment; and (2) even on the plateau, the strong and broad Hα evolves showing evidence of multiple components. The low absorption-to-emission ratio of Hα also suggests the presence of a small hydrogen envelope in SN 2023ufx.
- 4.Comparing the H emission features of the NIR Paγ and Paβ with the asymmetric profile of Hα confirms that the broad Hα component is mostly due to hydrogen with little contamination from other elemental emission.
- 5.We compare the pseudo-bolometric light curve of SN 2023ufx with a hydrodynamic MESA+STELLA model grid with varying hydrogen envelope mass as one of the free parameters as described in D. Hiramatsu et al. (2021a). We find that the extremely short plateau phase in SN 2023ufx can be explained with a small hydrogen envelope of ∼ 1.2 M⊙. The best-fit model suggests a total mass at core-collapse to 8–9.5 M⊙ and thus an He-core mass of 6.8–8.3 M⊙, constraining the ZAMS mass of the progenitor of SN 2023ufx to be MZAMS ∼ 19–25 M⊙. We find that the early light curve (≲10 days) cannot be explained with any of the models in the grid without introducing a total CSM mass of ∼0.09 M⊙, with a wind velocity of 10 km s−1, suggesting elevated pre-explosion mass loss in the decades leading up to the SN explosion. A corresponding lack of flash features in the early spectra could be due the densest parts of the CSM being close enough to the progenitor where they get overrun by stellar ejecta soon after explosion and/or an asymmetrical distribution of CSM.
- 6.We compared the two nebular spectra of SN 2023ufx at days ∼188 and ∼211 with an NLTE synthetic spectrum built by adding a hydrogen envelope to the Type Ib models discussed in S. Barmentloo et al. (2024). We find that an He-core mass of at least 6 M⊙ is required in the synthetic spectra to match the nebular [O i] λλ6300, 6364 strength. This is in support of a high-mass progenitor scenario interpreted independently from comparisons between the psuedobolometric light curve and hydrodynamical model grids. Interestingly, none of the synthetic models can reproduce the observed strength of Hα at late times, suggesting that there could be possible ejecta CSM interactions. The flat-topped nature of the Hα profile could indicate the presence of an asymmetric CSM distribution.
- 7.Strong emission lines [O i] λλ6300, 6364, Hα, and [Ca ii] λλ7291, 7323 evolve rapidly, forming multiple peaks by the nebular phase. Generally, all strong emission lines can be explained with a combination of ejecta moving preferentially along our line of sight. Part of the luminosity powering these emission lines could be due to ejecta interactions with an asymmetric distribution of CSM. Comparisons between the spatial distribution of [O i] λλ6300, 6364 and [O i] λ5577 shows that the observed triple peaks in the nebular spectra of SN 2023ufx are primarily composed of O-ejecta. The flux ratio of [Ca ii]/[O i] = 0.93 at late times in SN 2023ufx suggests a large O-core (i.e., a large progenitor mass) and that it may belong to an intermediate class between SNe II and SESNe.


In conclusion, SN 2023ufx is a unique SN IIP with the shortest plateau length duration, which is potentially the result of an asymmetric explosion of a partially stripped massive RSG likely interacting with an asymmetric distribution of CSM around it. The growing sample of SPSNe like SN 2023ufx will be crucial to understand the evolution of massive RSG progenitors of SNe II, by constraining late-stage mass loss in core-collapse SNe, understanding their progenitor channels, and explosion physics.
Acknowledgments
We thank the anonymous referee for providing a careful and constructive consideration of our work.
Research by A.P.R., S.V., Y.D., N.M.R, E.H., and D.M. is supported by NSF grant AST-2008108. Time-domain research by the University of Arizona team and D.J.S. is supported by National Science Foundation (NSF) grants 2108032, 2308181, 2407566, and 2432036 and the Heising-Simons Foundation under grant No. 2020-1864. This work makes use of data from the Las Cumbres Observatory global telescope network, which is supported by NSF grants AST-1911225 and AST-1911151.
This publication was made possible through the support of an LSST-DA Catalyst Fellowship to K.A.B., funded through grant 62192 from the John Templeton Foundation to LSST Discovery Alliance. The opinions expressed in this publication are those of the authors and do not necessarily reflect the views of LSST-DA or the John Templeton Foundation. Supernova research at Rutgers University is supported in part by NSF award 2407567 to S.W.J.
R.K.T. is supported by the NKFIH/OTKA FK-134432 and the NKFIH/OTKA K-142534 grant of the National Research, Development and Innovation (NRDI) Office of Hungary. A.V.F.’s research group at UC Berkeley acknowledges financial assistance from the Christopher R. Redlich Fund, as well as donations from Gary and Cynthia Bengier, Clark and Sharon Winslow, Alan Eustace, William Draper, Timothy and Melissa Draper, Briggs and Kathleen Wood, and Sanford Robertson (W.Z. is a Bengier–Winslow–Eustace Specialist in Astronomy, T.G.B. is a Draper–Wood–Robertson Specialist in Astronomy, Y.Y. was a Bengier–Winslow–Robertson Fellow in Astronomy) and numerous other donors.
Some of the data presented herein were obtained at Keck Observatory, which is a private 501(c)3 non-profit organization operated as a scientific partnership among the California Institute of Technology, the University of California, and the National Aeronautics and Space Administration. The Observatory was made possible by the generous financial support of the W. M. Keck Foundation. The authors wish to recognize and acknowledge the very significant cultural role and reverence that the summit of Maunakea has always had within the indigenous Hawaiian community. We are most fortunate to have the opportunity to conduct observations from this mountain.
The LBT is an international collaboration among institutions in the United States, Italy, and Germany. LBT Corporation Members are: The University of Arizona on behalf of the Arizona Board of Regents; Istituto Nazionale di Astrofisica, Italy; LBT Beteiligungsgesellschaft, Germany, representing the Max-Planck Society, The Leibniz Institute for Astrophysics Potsdam, and Heidelberg University; The Ohio State University, and The Research Corporation, on behalf of The University of Notre Dame, University of Minnesota, and University of Virginia.
A major upgrade of the Kast spectrograph on the Shane 3 m telescope at Lick Observatory, led by Brad Holden, was made possible through generous gifts from the Heising-Simons Foundation, William and Marina Kast, and the University of California Observatories. Research at Lick Observatory is partially supported by a generous gift from Google.
This paper made use of the modsCCDRed data reduction code developed in part with funds provided by NSF grants AST-9987045 and AST-1108693. This research made use of the NASA/IPAC Extragalactic Database (NED) (2019), which is funded by the National Aeronautics and Space Administration and operated by the California Institute of Technology.
Facilities: LCOGT - Las Cumbres Observatory Global Telescope, Keck:I - KECK I Telescope, Shane - Lick Observatory's 3m Shane Telescope, MMT - MMT at Fred Lawrence Whipple Observatory, LBT - Large Binocular Telescope Observatory, HET, Swift, Bok, SOAR, ATLAS, PO:1.2m.
Software: Astropy (Astropy Collaboration et al. 2013, 2018, 2022), Matplotlib (J. D. Hunter 2007), Numpy (C. R. Harris et al. 2020), Scipy (P. Virtanen et al. 2020), IRAF (D. Tody 1986), xtellcorr (W. D. Vacca et al. 2003), lcogtsnpipe (S. Valenti et al. 2016).
Appendix: Spectroscopy Observation Log
We present the optical and NIR spectroscopy log of SN 2023ufx discussed in this work in Table A1.
Table A1. Optical and NIR Spectra of SN 2023ufx
| UTC Date and Time | Modified Julian Date | Phase | Telescope | Instrument | Wavelength Coverage |
|---|---|---|---|---|---|
| (hh:mm) | (Days) | (Days) | (Å) | ||
| 2023-10-13 13:15 | 60230.55 | 7 | FTN | FLOYDS | 3500–10000 |
| 2023-10-13 14:02 | 60230.59 | 7 | Keck I | LRIS | 3148–10086 |
| 2023-10-13 14:52 | 60230.62 | 7 | Keck I | LRIS | 3147–10086 |
| 2023-10-17 14:38 | 60234.61 | 11 | FTN | FLOYDS | 3500–10000 |
| 2023-10-19 10:30 | 60236.44 | 13 | MMT | Binospec | 3826–9197 |
| 2023-10-19 13:59 | 60236.58 | 14 | FTN | FLOYDS | 3500–10000 |
| 2023-10-20 14:09 | 60237.59 | 15 | FTN | FLOYDS | 3500–10000 |
| 2023-10-24 13:02 | 60241.54 | 18 | FTN | FLOYDS | 3500–9999 |
| 2023-10-28 12:45 | 60245.53 | 22 | FTN | FLOYDS | 3500–10000 |
| 2023-11-01 12:59 | 60249.54 | 26 | FTN | FLOYDS | 3500–9999 |
| 2023-11-08 12:04 | 60256.50 | 33 | FTN | FLOYDS | 3500–9999 |
| 2023-11-09 10:21 | 60257.43 | 34 | LBT | MODS | 3500–10000 |
| 2023-11-10 04:45 | 60258.20 | 35 | Shane | Kast | 3636–10734 |
| 2023-11-12 11:48 | 60260.49 | 37 | FTN | FLOYDS | 3500–10000 |
| 2023-11-13 15:28 | 60261.61 | 38 | Keck I | LRIS | 3139–10216 |
| 2023-11-16 11:32 | 60264.48 | 41 | FTN | FLOYDS | 3302–10000 |
| 2023-11-20 12:15 | 60268.51 | 45 | FTN | FLOYDS | 3500–9999 |
| 2023-11-26 10:56 | 60274.46 | 51 | FTN | FLOYDS | 3500–9999 |
| 2023-12-03 10:27 | 60281.43 | 58 | MMT | MMIRS | 9927–15015 |
| 2023-12-04 13:19 | 60282.55 | 59 | FTN | FLOYDS | 3500–10000 |
| 2023-12-12 04:13 | 60290.43 | 67 | Shane | Kast | 3640–8744 |
| 2023-12-12 11:35 | 60290.48 | 67 | Keck I | LRIS | 3139–10064 |
| 2023-12-18 06:32 | 60296.27 | 73 | SOAR | TripleSpec | 9429–17913 |
| 2023-12-18 13:44 | 60296.57 | 73 | FTN | FLOYDS | 3499–10000 |
| 2023-12-26 15:07 | 60304.63 | 81 | FTN | FLOYDS | 3500–9999 |
| 2023-12-30 13:23 | 60308.55 | 85 | Keck II | NIRES | 9408–24693 |
| 2023-12-31 10:06 | 60309.42 | 86 | FTN | FLOYDS | 3500–10000 |
| 2024-01-06 12:40 | 60315.53 | 93 | FTN | FLOYDS | 3500–10000 |
| 2024-01-22 12:03 | 60331.50 | 109 | FTN | FLOYDS | 3500–9999 |
| 2024-01-28 05:04 | 60337.21 | 114 | SOAR | Goodman-RED | 4934–8938 |
| 2024-02-03 10:08 | 60343.42 | 120 | FTN | FLOYDS | 3500–10000 |
| 2024-02-07 10:56 | 60347.46 | 124 | Keck I | LRIS | 3139–10258 |
| 2024-02-09 12:10 | 60349.51 | 127 | FTN | FLOYDS | 3500–10000 |
| 2024-02-13 04:03 | 60353.2 | 130 | Bok | B&C | 4000–7998 |
| 2024-02-19 09:16 | 60359.39 | 136 | FTN | FLOYDS | 3499–10000 |
| 2024-02-27 08:51 | 60367.37 | 144 | FTN | FLOYDS | 3500–9999 |
| 2024-03-17 03:17 | 60386.14 | 163 | Shane | Kast | 3624–10748 |
| 2024-03-18 09:16 | 60387.39 | 164 | FTN | FLOYDS | 3499–9000 |
| 2024-04-11 02:22 | 60411.10 | 188 | Shane | Kast | 3624–10756 |
| 2024-05-04 02:45 | 60434.11 | 211 | HET | LRS2-B | 3640–6945 |
Download table as: ASCIITypeset image
Footnotes
- 22
- 23
The estimated distances will have significant uncertainties due to systematics in the adopted cosmology.
- 24
- 25
- 26
- 27
- 28
- 29
- 30
- 31
- 32
- 33
Data obtained from the UC Berkeley SN Database (SNDB); J. M. Silverman et al. (2012).