Abstract
The Be/X-ray binary 4U 0115+63 was observed by the Large Area X-ray Proportional Counter (LAXPC) instrument on AstroSat on 2015 October 24 during the peak of a giant Type II outburst. Prominent intensity oscillations at ∼1 and ∼2 mHz frequency were detected during the outburst. Nuclear Spectroscopic Telescope Array (NuSTAR) observations made during the same outburst also show millihertz quasi-periodic oscillations (QPOs). Details of the oscillations and their characteristics deduced from LAXPC/AstroSat and NuSTAR observations are reported in this paper. Analysis of the archival Rossi X-ray Timing Explorer/Proportional Counter Array data during 2001–2011 also show the presence of millihertz QPOs during some of the outbursts, and details of these QPOs are also reported. Possible models to explain the origin of the millihertz oscillations are examined. Similar QPOs, albeit at higher frequencies, have been reported from other neutron star and black hole sources, and both may have a common origin. Current models to explain the instability in the inner accretion disk causing the intense oscillations are discussed.
1. Introduction
The high-mass X-ray binary (HMXB) 4U 0115+63, originally discovered by the UHURU satellite (Giacconi et al. 1972; Forman et al. 1978), has been studied extensively and found to be a Be system with an orbital period of 24.3 days (Rappaport et al. 1978). The X-ray source was found to be pulsating with a 3.61 s period by Cominsky et al. (1978) from SAS-3 observations. The pulse has a double-peak profile below 20 keV that changes to a single-peak shape above 20 keV. During most of its orbit the X-ray binary is in its quiescent state with X-ray luminosity (Lx) ≤ 1034 erg s−1 (Campana et al. 2001). When the X-ray source is in an active state, it exhibits two types of outbursts: (i) Type I bursts that occur regularly once every orbital cycle near the periastron passage of the neutron star with Lx ∼1036–1037 erg s−1 (Stella et al. 1986) and (ii) Type II bursts that occur irregularly and have much higher intensity with a peak intensity in the range of ∼0.1–1 Crab (Lx ≥ 1037 erg s−1; Boldin et al. 2013). A detailed study of the outbursts from 4U 0115+63 carried out by Boldin et al. (2013) and Ballhausen et al. (2015) revealed the occurrence of 16 Type II bursts from this source in the 1969–2015 period. There is a hint of a ∼3–5 yr recurrence period of Type II bursts. This has been explained as arising from the loss and reformation of a circumstellar disk around the V = 15.5 mag Be companion star V635 (Negueruela et al. 2001). Distance to the source has been estimated to be 7 kpc (Negueruela & Okazaki 2001). During the Type II outbursts, the source has been found to spin up. A spin-up rate of  = (−7.24 ± 0.03) × 10−6 s d−1 was measured by Li et al. (2012) during the 2008 outburst.
A cyclotron line in the spectrum of 4U 0115+63 was first reported by Wheaton et al. (1979) at about 20 keV. Subsequent studies revealed that this was the first harmonic of a cyclotron resonant scattering feature (CRSF) in absorption at about 11 keV.
Five CRSFs, were first detected at ∼11.2, 22.9, 32.6, 40.8, and 53 keV by Ferrigno et al. (2009) using BeppoSAX data. Using different continuum models, Boldin et al. (2013) confirmed the presence of a fundamental cyclotron line and four higher harmonics at ∼11, 24, 35.6, 48.8, and 60.7 keV from INTEGRAL data during the 2011 outburst of the source. Using 11 keV as the fundamental line energy, the magnetic field of the neutron star in the region, where CRSFs originate, can be inferred to be ∼1012 Gauss.
Besides the regular 3.61 s pulsations, 4U 0115+63 also shows quasi-periodic oscillations (QPOs) and their harmonics in the power density spectra (PDSs) of its light curves. Soong & Swank (1989) detected a broad QPO peak at ∼62 mHz during the 1978 outburst. A low-frequency QPO at ∼2 mHz was detected during the 1999 March outburst (Heindl et al. 1999), while QPOs with a frequency varying in the ∼27–46 mHz range were reported from Rossi X-ray Timing Explorer (RXTE)/Proportional Counter Array (PCA) observations during the 1999, 2004, and 2008 outbursts (Dugair et al. 2013). In the most recent Type II outburst on 2015 October 22, Ballhausen et al. (2015) detected a ∼600 s QPO in the Nuclear Spectroscopic Telescope Array (NuSTAR) and Swift data, which they interpreted as the ∼2 mHz QPO reported earlier by Heindl et al. (1999).
In this paper, we confirm the ∼2 mHz QPO observed by RXTE and NuSTAR, and find a ∼1 mHz intensity oscillation from Large Area X-ray Proportional Counter (LAXPC) observations of 4U 0115+63 on 2015 October 24, during a giant outburst.
After the introduction we present a brief description of the LAXPC instrument, details of observation, and data analysis methodology. Results from the timing analysis of LAXPC data are highlighted. We have also analyzed data from two NuSTAR observations of 2015 October 22 and October 30, during the same outburst, and we present results from this analysis for comparison. We have also analyzed RXTE/PCA observations of 4U 0115+63 during different outbursts between 2001 and 2011, to search low-frequency millihertz QPOs not reported earlier from the source, and these results are also discussed. Finally, we discuss the possible origin of the QPOs and examine the most plausible model.
2. LAXPC Instrument, Observation, and Data Reduction
The LAXPC instrument on AstroSat consists of three identical collimated detectors, having a five anode layer geometry with a 15 cm deep X-ray detection volume providing an effective area of about 4500 cm2 at 5 keV, 6000 cm2 at 10 keV, and about 5600 cm2 at ∼40 keV. LAXPCs are filled with a xenon–methane (90%:10%) mixture at 1520 torr and have a field of view of 09 × 0
9. A description of the AstroSat observatory and its instrument is provided in Agrawal (2006) and Singh et al. (2014). More detailed descriptions of the characteristics of the LAXPC instrument can be found in Yadav et al. (2016), Agrawal et al. (2017), and Roy et al. (2016) and of the calibration details in Antia et al. (2017). High time resolution studies to investigate rapid intensity variations and broadband spectral measurements are principal objectives of this instrument. For this purpose the arrival time of every detected X-ray photon is tagged to an accuracy of 10 μs; its energy determined by a 1024 channel pulse-height analyzer and the anode layer in which it interacted are recorded. After the launch of AstroSat on 2015 September 28, the LAXPC instrument was turned on and became operational on 2015 October 19. On being alerted that 4U 0115+63 was undergoing a major outburst (Ballhausen et al. 2015), the AstroSat was pointed at this pulsar and observations were made with the LAXPC instrument on 2015 October 24 from 09:17:02 UT to 16:08:46 UT, covering four orbits. Background data for LAXPC were acquired during 2015 October 22 15:31:11 to 2015 October 23 01:48:59 UT by pointing at a source-free region. We have used background data from 2015 October 22 for obtaining the background-subtracted light curve of the source. Complete details of the source and background observations are summarized in Table 1.
Table 1. Log of Observations of 4U 0115+63 and Background for LAXPC and NuSTAR
| Observations | Instrument | Time of Observation | MJD |
|---|---|---|---|
| UT | |||
| (yyyy mm dd hr:min:sec) | |||
| 4U 0115+63 | NuSTAR | 2015 Oct 22 12:16:08-2015 Oct 23 04:06:08 | 57317.5–57318.1 |
| LAXPC | 2015 Oct 24 09:17:02-2015 Oct 24 16:08:46 | 57319.3–57319.6 | |
| NuSTAR | 2015 Oct 30 13:46:08-2015 Oct 31 01:16:08 | 57325.6–57326.0 | |
| Background | LAXPC | 2015 Oct 22 22:19:24.5-2015 Oct 23 02:01:42.03 | 57317.9–57318.0 |
Download table as: ASCIITypeset image
Data reduction has been done using the LAXPC data reduction pipeline software AS1LAXPCLevel2DataPipeline version 1.0. Conversion of the Level-1 raw data file to Level-2 data has been performed by “lxplevel2datapipeline.” Data are independently analyzed for each of the three LAXPC units. Each LAXPC detector has seven outputs from five anode layers, two outputs each from anode layers 1 and 2, and one output from each of the anode layers 3, 4, and 5. Level-2 data contain (i) the light curve in broadband counting mode (modeBB) and (ii) event mode data (modeEA) with information about arrival time, pulse height, and layer of origin of each detected X-ray, and (iii) housekeeping data and parameter files are stored in an mkf file. The light curves were extracted from event mode data using the tool “lxplc” for the source and the background. We have used average background counts in different energy bands for deducing background-subtracted source light curves. The energy spectrum, response matrix, and the background spectrum were extracted using laxpc software “LaxpcSoft6 ” with a single routine to extract source spectra, light curves, and background spectra. The data were analyzed using HEASOFT 6.19.7 HEASOFT consists of (mainly) FTOOLS for general data extraction and analysis, XRONOS (Stella & Angelini 1992) for the timing analysis, and XSPEC package (Arnaud 1996) for the spectral analysis. Table 2 lists details of the observations and count rates of 4U 0115+63 included in this analysis.
Table 2. LAXPC Count Rates due to Source (4U 0115+63) with Background, Background and Source (Background Subtracted) in Three Energy Bands
| Observations | LAXPC | Time of Observation | Useful | Energy | Average |
|---|---|---|---|---|---|
| Exposure | Range | Count | |||
| Time | Rate | ||||
| (UT) | (s) | (keV) | (counts s−1) | ||
| Source+ | 10 | 2015 Oct 24 09:17:02-16:08:46 | 16480 | 3–20 | 1060.1 ± 0.25 |
| Background | 20–40 | 80.9 ± 0.07 | |||
| 40–80 | 96.6 ± 0.08 | ||||
| 20 | 2015 Oct 24 09:17:02-16:08:46 | 16479 | 3–20 | 1015.3 ± 0.24 | |
| 20–40 | 76.2 ± 0.07 | ||||
| 40–80 | 76.6 ± 0.07 | ||||
| 30 | 2015 Oct 24 09:17:02-16:08:46 | 16483 | 3–20 | 1034.9 ± 0.25 | |
| 20–40 | 67.0 ± 0.06 | ||||
| 40–80 | 98.0 ± 0.08 | ||||
| Background | 10 | 2015 Oct 22 22:19:24.5-2015 Oct 23 02:01:42.03 | 28712 | 3–20 | 18.9 ± 0.04 |
| 20–40 | 15.5 ± 0.03 | ||||
| 40–80 | 71.1 ± 0.09 | ||||
| 20 | 2015 Oct 22 22:19:24.5-2015 Oct 23 02:01:42.03 | 28712 | 3–20 | 10.2 ± 0.03 | |
| 20–40 | 12.6 ± 0.03 | ||||
| 40–80 | 50.6 ± 0.06 | ||||
| 30 | 2015 Oct 22 22:19:24.5-2015 Oct 23 02:01:42.03 | 28712 | 3–20 | 9.8 ± 0.03 | |
| 20–40 | 13.3 ± 0.03 | ||||
| 40–80 | 60.1 ± 0.07 | ||||
| Source | 10 | 2015 Oct 24 09:17:02-16:08:46 | 16480 | 3–20 | 1041.7 ± 0.26 |
| (Background | 20–40 | 65.5 ± 0.07 | |||
| subtracted) | 40–80 | 25.7 ± 0.08 | |||
| 20 | 2015 Oct 24 09:17:02-16:08:46 | 16479 | 3–20 | 1005.0 ± 0.24 | |
| 20–40 | 63.6 ± 0.07 | ||||
| 40–80 | 26.0 ± 0.07 | ||||
| 30 | 2015 Oct 24 09:17:02-16:08:46 | 16483 | 3–20 | 1025.1 ± 0.25 | |
| 20–40 | 53.7 ± 0.06 | ||||
| 40–80 | 37.8 ± 0.08 |
Download table as: ASCIITypeset image
2.1. NuSTAR and RXTE /PCA Observations and Data Reduction
The NuSTAR data consist of the two focal plane modules A and B (FPMA and FPMB), where each module has a field of view (FoV) of 13′ × 13′ (Harrison et al. 2013). NuSTAR data were obtained from the HEASARC data archive for 2015 October 22 and 30. Raw event lists from observation ID (ObsID: 90102016002 and 90102016004) were reprocessed with nupipeline, which is part of the NuSTAR Data Analysis Software (NuSTARDAS v1.6.0), while employing the most recent calibration database files available at the time (CALDB: 2015 May 26). Cleaned images were generated for each module in the 3–79 keV energy band. Source and background light curves and energy spectra have been generated from the cleaned event lists of each of the two focal plane modules using a 30″ radius circle around 4U 0115+63. Light curves extracted from FPMA and FPMB were merged using the FTOOLS task “fmerge” for timing analysis. The FPMA and FPMB energy spectra are merged using the FTOOLS task “addspec” for spectral analysis. Corresponding arf and rmf files are also merged using the FTOOLS tasks “addarf” and “addrmf.”
We have also analyzed RXTE/PCA observations of 4U 0115+63 during 2001–2011 outbursts to search low-frequency QPO. The PCA consists of five identical Proportional Counter Units (PCUs) sensitive in the 2–60 keV range. The data selection criteria were used to remove the South Atlantic Anomaly passage times and the stretches of the observations for which the Earth elevation was >10° and the pointing offset was >002. Light curves are extracted from standard 1 mode RXTE/PCA data using FTOOLS task “saextrct” from all the PCUs, which were on during the observations. The three PCUs were on during the 2004 observation, while two PCUs were on during the 2008 observations, respectively. Moreover, during another observation made in 2011, only one PCU was found to be on in the first stretch of the data and two PCUs were on during the second. We have used data only from PCU 2 for the spectral analysis as this PCU was consistently on during all of the observations during the different outbursts. The X-ray spectra of RXTE/PCA were extracted using FTOOLS task “saextrct” using standard two mode data with 16 s binning. Bright background model pca_bkgd_cmbrightvle_eMv20020201.mdl8
was used to estimate the background for the spectral analysis.
3. Data Analysis and Results
We have plotted the Swift/BAT hard X-ray transient monitor light curve (Krimm et al. 2013) in Figure 1 starting from MJD 57300.0 for the 2015 observation of 4U 0115+63.9 The LAXPC observations of 2015 October 24 are indicated in Figure 1 by an open circle. The two NuSTAR observations are shown in the same figure by open squares. The LAXPC observed the source two days after the peak intensity of the outburst on 2015 October 22.

Figure 1. Swift/BAT hard X-ray transient monitor light curve in the 15–50 keV energy band during the 2015 observation of 4U 0115+63. LAXPC observation is indicated with an open circle, and NuSTAR observations are shown by open squares.
Download figure:
Standard image High-resolution image3.1. LAXPC and NuSTAR Timing Analysis and Results
The observation log of the source and background is presented in Table 1. X-ray light curves have been extracted from four orbits of data in 3–80 keV for each LAXPC using the task “lxplc.” Counts from all the five layers of each LAXPC have been summed up to construct the light curves of the 4U 0115+63 in 3–80 keV band for each LAXPC and are shown in Figure 2. Prominent intensity oscillations with ∼1000 s periods are clearly visible in all of the light curves. NuSTAR observations on 2015 October 22, one day prior to LAXPC observations, and 2015 October 30, six days after the LAXPC observations, show similar ∼1000 s and ∼600 s oscillations in the 3–79 keV light curves shown in Figure 2.
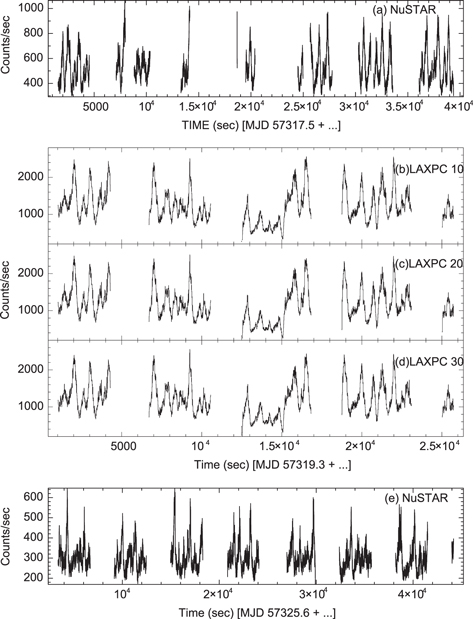
Figure 2. Background-subtracted light curves in the 3–79 keV energy band obtained from the NuSTAR observations: (a) MJD 57317.5 and (e) MJD 57325.6. Background-subtracted 3–80 keV light curves for the three LAXPC units (LAXPC 10, 20, and 30) on MJD 57319.3 are shown in panels (b), (c), and (d), respectively. The gaps in the light curve are due to the passage of the satellite through the South Atlantic Anomaly regions.
Download figure:
Standard image High-resolution imageTo investigate the energy dependence of the intensity variations, light curves in the 3–20, 20–40, and 40–80 keV bands have been extracted for LAXPC 10, 20, and 30. For generating the 3–20 keV light curve, only Layer 1 (outputs 1 and 2) data have been used, as most incident photons (∼90%) of <20 keV energy are absorbed in Layer 1. Similarly, light curves in 20–40 keV have been constructed using summed data from Layers 1 and 2 (two outputs from each) and those in 40–80 keV from all the five layers. The count rates of each of the three LAXPCs in the three energy bands are shown in Table 2. Note that the higher background rate in LAXPC 10 is due to the disabling of one side of the Veto layer due to its malfunction before the launch. It can be observed from Figure 3 that the amplitude of ∼1000 s oscillations is higher in the 3–20 and 20–40 keV bands compared to that in 40–80 keV. Similar energy dependence is observed from LAXPC 20 and LAXPC 30 (Figure 3).

Figure 3. Background-subtracted light curves (a) for 3–20 keV, (b) 20–40 keV, and (c) 40–80 keV, for LAXPC 10, LAXPC 20, and LAXPC 30, respectively.
Download figure:
Standard image High-resolution imageHardness ratios (HRs) defined as count rates in 15–30 keV/3–8 keV were derived to study spectral evolution during the intensity oscillations. These were computed using count rates from only the top layer (outputs 1 and 2) in 3–8 keV and data from the top two layers (outputs 1, 2, 3, and 4) in 15–30 keV. Selection of layers is made to obtain the optimal values of the HR. In Figure 4, background-subtracted count rates in 3–8 and 15–30 keV in 30 s bins are plotted along with HR as a function of time for LAXPC 10, LAXPC 20, and LAXPC 30 to probe spectral changes during the oscillations. The intensity of the source shows no correlation with HR from all the three LAXPCs.

Figure 4. Background-subtracted light curve for LAXPC 10, LAXPC 20, and LAXPC 30 in the 3–8 keV band (a) and the 15–30 keV band (b). Hardness ratio (HR) defined as ratio of counts in 15–30 keV/3–8 keV (c) for LAXPC 10, LAXPC 20, and LAXPC 30.
Download figure:
Standard image High-resolution imagePDSs were generated using 10 s binned light curves in 3–80 keV for each of the three LAXPCs and in 3–79 keV for the NuSTAR observations using the FTOOLS task “powspec” in HEASOFT. The LAXPC light curves were divided into stretches of 1024 bins per interval. PDSs from all of the segments were averaged to produce the final PDSs for the observation. Poissonian noise was subtracted from the PDSs, and they were normalized such that their integral gives the squared rms fractional variability normalized to units of (rms mean−1)2 Hz−1. The PDS is fitted with two components, a power law and multiple Lorentzians to fit the QPO peaks. Figure 5 shows the PDS in which prominent peaks at ∼1 mHz (1000 s) and ∼2 mHz (600 s) are seen in all three LAXPC spectra. We generated PDSs for NuSTAR using 10 s binned light curves using the same procedure as used for generating the LAXPC PDS. NuSTAR observations of 2015 October 22 show a single broad peak at ∼1 mHz with 1024 bins per interval, whereas two clearly resolved peaks at ∼1 and 2 mHz are visible in the PDS with 512 bins per time interval. In the NuSTAR PDS of 2015 October 30, QPO peaks at ∼1 and 2 mHz are detected using 1024 bins as well as 512 bins per interval. We have, therefore, used 512 bins per interval for both of the NuSTAR observations to generate PDSs, as shown in Figure 5. The NuSTAR PDS of 2015 October 30 also shows the presence of 12 and 27 mHz QPOs with a coherence factor and rms (%) of 8 and 3% and 4 and 3%, respectively. A summary of the characteristics of the ∼1 mHz and ∼2 mHz QPOs from LAXPC and NuSTAR are presented in Table 3.

Figure 5. PDSs (in the units of (rms mean−1)2 Hz−1) of 4U 0115+63 obtained for the outburst from NuSTAR in the 3–79 keV energy band ((a), (e)). PDSs in the 3–80 keV energy band of LAXPC 10 (b), 20 (c), and 30 (d). Arrows indicate ∼1 mHz and ∼2 mHz QPOs in the PDSs of NuSTAR and LAXPC detectors.
Download figure:
Standard image High-resolution imageTable 3. Summary of the Characteristics of the ∼1 mHz and ∼2 mHz QPOs Observed from LAXPC and NuSTAR
| Observation | Detector | Exposure | Energy | 1 mHz QPO | 2 mHz QPO | ||||
|---|---|---|---|---|---|---|---|---|---|
| Range | Frequency | rms | Quality | Frequency | rms | Quality | |||
| (MJD) | (s) | (keV) | ( Hz) Hz) |
% | Factor | ( Hz) Hz) |
% | Factor | |
| 57317.5 | NuSTAR | 8584 | 3–79 |

|
15.7 | 5.7 |

|
15.8 | 12.5 |
| 57319.3 | LAXPC 10 | 16480 | 3–80 |

|
13.7 | 8.8 |

|
20.1 | 2.7 |
| 3–15 |

|
9.4 | 9.0 |

|
21.1 | 3.0 | |||
| 15–30 |

|
12.2 | 7.7 |

|
23.2 | 4.3 | |||
| 30–50 |

|
5.2 | 8.9 |

|
9.8 | 4.4 | |||
| 57319.3 | LAXPC 20 | 16479 | 3–80 |

|
14.3 | 9.9 |

|
21.0 | 2.6 |
| 3–15 |

|
9.8 | 8.2 |

|
21.0 | 3.4 | |||
| 15–30 |

|
12.2 | 7.6 |

|
24.1 | 4.1 | |||
| 30–50 |

|
7.3 | 8.6 |

|
14.0 | 6.0 | |||
| 57319.3 | LAXPC 30 | 16483 | 3–80 |

|
13.8 | 10.1 |

|
19.9 | 2.7 |
| 3–15 |

|
9.6 | 9.6 |

|
20.7 | 2.8 | |||
| 15–30 |

|
12.5 | 7.9 |

|
22.9 | 4.9 | |||
| 30–50 |

|
5.8 | 11.5 |

|
9.3 | 5.8 | |||
| 57325.6 | NuSTAR | 14564 | 3–79 |

|
10.9 | 5.0 |

|
13.8 | 2.32 |
Download table as: ASCIITypeset image
To investigate the energy dependence of the QPO characteristics, PDSs were extracted in the 3–15, 15–30, 30–50, and 50–80 keV bands for each of the LAXPC units. This was achieved by extracting data from Layer 1 for 3–15 keV, Layers 1 and 2 for 15–30 keV, and Layers 1–5 for the 30–50 and 50–80 keV energy bands. PDSs in the units of (rms mean−1)2 Hz−1 are generated with 10 s binning and by subtracting Poissonian noise. Prominent QPOs are observed at ∼1 mHz and ∼2 mHz in the energy bands up to 50 keV. Above 50 keV the 1 mHz and 2 mHz QPOs are insignificant. Details of QPO characteristics like frequency, rms amplitude, and quality factor are summarized in Table 3. The coherence factor (ν/δν) lies in the range 7.6–11.1 for the ∼1 mHz QPO and 2.8–6.0 for the ∼2 mHz QPO, respectively. It can be observed from Table 3 that the coherence factor of the ∼1 mHz QPO decreases from 3–15 keV to 15–30 keV and then increases at higher energies. rms amplitude (%) of the ∼1 mHz QPO increases from 3–15 keV to 15–30 keV and then decreases at higher energies. It may be noticed that the coherence factor increases with energy for the ∼2 mHz QPO and rms amplitude (%) of the ∼2 mHz QPO increases until 30 keV and then decreases at higher energy.
3.1.1. ∼1 mHz and ∼2 mHz QPOs from RXTE/PCA Observations
PCA/RXTE Standard 1 mode light curves (10 s binned) in 2–60 keV, generated using the FTOOLS task “lcurve” in HEASOFT for of all of the observations showing ∼mHz QPOs, are presented in Figures 6(a), (b), and (c). It may be noted that during the 2004 observation, three PCUs were on, while in 2008 observations two PCUs were on, and the count rates in the figures reflect this. In the 2011 light curve in Figure 6(c), the jump in the count rate in the middle of the light curve is not due to intensity variation of the source but rather due to the fact that in the first half of the observation only one PCU was operational, while in the later half two PCUs were operational. The observation of the 2004 outburst on MJD 53260.1 is rather short (2159 s), and hence the 5 s binned light curve with 256 bins per interval was used for generating PDSs using the FTOOLS task “powspec” from this observation. Similarly, 5 s binned light curves were used to generate PDSs for the 2008 and 2011 outbursts of the source. To resolve the mHz QPOs clearly and ensure that there are at least two segments of light curves over which the PDSs are averaged, we used 1024 and 512 bins per interval for the 2008 and 2011 observations, respectively. Following procedures similar to that used for the LAXPCs, the PDSs are fitted with two components, a power law and multiple Lorentzians to fit the QPO peaks from the 7 × 10⁻³–0.05 Hz frequency range for the 2004 observation and 3.5 × 10⁻³–0.05 Hz for the 2008 and 2011 observations of the source. The resulting PDSs in Figure 6 show prominent QPO peak in Figures 6(d) and (f) at ∼2 mHz (600 s) and in Figure 6(e) at ∼1 mHz (1000 s) and ∼2 mHz (600 s) as indicated by the rows. In Table 4, we summarize the characteristics of millihertz QPOs detected in our analysis of RXTE/PCA data during outbursts in 2004, 2008, and 2011 along with the 2 mHz QPO reported by Heindl et al. (1999) during the 1999 outburst. In addition to the 2 mHz QPO, three more QPO peaks are detected in Figure 6(d) at 14.9 mHz, 24.9 mHz, and 44.7 mHz in the PDSs of the 2004 outburst. The coherence factors of the three QPOs are 11, 7, and 17, respectively. This result has been already reported by Dugair et al. (2013). They did not find any systematic variation between QPO frequency and flux for the 41 mHz QPO observed during different outbursts and the 2 mHz QPO observed during the same outburst. Similarly, a QPO peak at 8.7 mHz of coherence factor 12 is visible in the PDSs of the 2008 outburst in Figure 6(e), and a peak due to the 46.4 mHz QPO of coherence factor 8 is visible in the PDSs of the 2011 outburst in Figure 6(f).

Figure 6. Top panels: Standard 1 mode light curves (10 s binned) in the 2–60 keV energy band obtained from the RXTE/PCA observations from different outbursts: (a) 2004 September 12 (MJD 53260.1), (b) 2008 April 2 (MJD 54559.0), and (c) 2011 June 27 (MJD 55739.5) showing ∼1 mHz and ∼2 mHz intensity oscillations. The change in the count rate seen in the light curve (c) is due to one PCU being on during the first half of the observation and two PCUs being on for the later part. Bottom panels: PDSs generated using 5 s binned light curves in the 2–60 keV energy band from (d) 2004 September 12 (MJD 53260.1) showing ∼2 mHz intensity oscillation, (e) 2008 April 2 (MJD 54559.0) showing ∼1 mHz and ∼2 mHz intensity oscillations, and (f) 2011 June 27 (MJD 55739.5) showing the ∼2 mHz intensity oscillation (indicated by arrows) of the corresponding light curve.
Download figure:
Standard image High-resolution imageTable 4. Millihertz QPOs Detected in RXTE/PCA Analysis of 4U 0115+63 along with Those Detected by LAXPC and NuSTAR
| Year of | Instrument | Observation Id | MJD | Detected QPOs (mHz) | Orbital | Flux (3–50 keV) |
|---|---|---|---|---|---|---|
| Outburst | Phase | ×10−8 erg cm−2 s−1 | ||||
| 1999a | RXTE (PCA) | 40411-01-09-00 | 51248.3 | 2 | 0.97 |

|
| 2004 | RXTE (PCA) | 90089-01-03-01 | 53260.1 | 1.9
|
0.70 |

|
| (Q-factor = 18.7, rms = 39.2%) | ||||||
| 2008 | RXTE (PCA) | 93032-01-03-03 | 54559.0 | 0.9 ,1.8 ,1.8
|
0.12 |

|
| (Q-factor = 8.2, rms = 14.5%, | ||||||
| Q-factor = 2.8, rms = 8.3%) | ||||||
| 2011 | RXTE (PCA) | 96032-01-02-01 | 55739.5 | 2.9
|
0.66 |

|
| (Q-factor = 16.1, rms = 10.6%) | ||||||
| 2015 | NuSTAR | 90102016002 | 57317.5 | 1.1 , , 
|
0.56 |

|
| 2015 | LAXPC (10) | 9000000064 | 57319.3 | 0.9 , , 
|
0.64 | ⋯ |
| 2015 | LAXPC (20) | 9000000064 | 57319.3 | 0.9 , , 
|
0.64 |

|
| 2015 | LAXPC (30) | 9000000064 | 57319.3 | 0.9 , , 
|
0.64 | ⋯ |
| 2015 | NuSTAR | 90102016004 | 57325.6 | 0.7 , , 
|
0.89 |

|
Note.
aReported in Heindl et al. (1999).Download table as: ASCIITypeset image
3.2. Spectral Analysis and Results
We have performed detailed spectral analysis of only LAXPC 20 data as the spectral response matrix of this detector is well determined. Spectral analysis of LAXPC 20, NuSTAR, and RXTE data in the 3–50 keV energy range was carried out for estimation of the source flux. Detailed spectral analysis of the complex spectrum of 4U 0115+63 will be described in a forthcoming paper. Data from all four LAXPC orbits were merged to derive the source spectrum. The spectra were fitted with a model (“TBabs∗powerlaw∗highecut∗cyclabs∗cyclabs∗cyclabs∗cyclabs” built in XSPEC) that included an interstellar absorption TBabs (Wilms et al. 2000) and combined model of power law (Tsygankov et al. 2007; Boldin et al. 2013) and high-energy cutoff (White et al. 1983):

where K is the normalization factor (photons keV−1 cm−2 s−1 at 1 keV), Γ is the photon index of the power law, E is the photon energy, Ec is the cutoff energy in keV, and Ef is the e-folding energy in keV. We also add cyclotron absorption line models (cyclabs XSPEC model; Mihara et al. 1990) to account for the four known cyclotron lines at ∼11 to 15 keV, 23 keV, 35.6 keV, and 48.8 keV (Coburn et al. 2002; Nakajima et al. 2006; Ferrigno et al. 2009; Boldin et al. 2013; Iyer et al. 2015), defined as

where  is the depth of fundamental or first harmonic,
  is the cyclotron energy, and Wf is the width of the fundamental or first harmonic. The CRSF line energies are independently determined by the fit. This was done to account for anharmonic line ratios that can occur due to the effects of viewing geometry and asymmetric emission patterns (Nishimura 2013).
The value of column density is fixed at NH = 1.3 × 1022 cm−2 (Iyer et al. 2015) for all of the observations. The power law photon index (Γ) =  , highecut cutoff energy Ec =
  keV, and highecut fold energy Ef =
  keV yielded the best fit with
  /dof = 86.68/59 for the LAXPC 20 energy spectrum in 3–50 keV with a 1% systematic error. Flux estimated from this fit for LAXPC 20 is
  × 10−8 erg cm−2 s−1 on 2015 October 24. Using the same model used for LAXPC, with a 1% systematic error, we derived the NuSTAR flux to be
  × 10−8 erg cm−2 s−1 on 2015 October 22 and
  × 10−8 erg cm−2 s−1 on 2015 October 30, before and after the LAXPC observation, respectively. The flux is obtained from the best fit using the “flux” command in XSPEC, and corresponding errors are estimated using the “flux error” command in XSPEC in the 3–50 keV energy range. The flux values are presented in Table 4. This flux is converted to luminosity to study the frequency of QPO dependence on X-ray luminosity presented in the next section. Detailed studies of the cyclotron lines and their characteristics, along with the pulse phase-resolved energy spectra, are in progress and will be reported separately.
4. Discussion
High-frequency QPOs occur in the ∼1 Hz to ∼1 kHz range quite commonly in low-mass X-ray binaries (LMXBs) with a neutron star or a stellar-mass black hole as the X-ray source. Low-frequency QPOs of ∼10 to 100 mHz have been detected mostly in HMXBs, being more common in transient pulsars than in Be binaries. The reported QPO frequencies lie in 20–200 mHz as summarized by James et al. (2010), with the exception of 4U 0115+63 in which Heindl et al. (1999) detected ∼2 mHz QPOs during its 1999 outburst.
Recently, Sidoli et al. (2016) detected a 1.46 mHz QPO in the HMXB IGR J19140+0951 from XMM-Newton observations during a flaring episode when the source flux increased more than 10 times. Larger radii of the accretion disks owing to high magnetic fields in HMXB systems, as compared to the black hole binaries or LMXB systems, will automatically cause any oscillations related to timescales of the accretion disk to have lower frequencies in these systems. As described in the preceding sections, the HMXB 4U 0115+63 shows a large amplitude and slow quasi-periodic X-ray oscillations on timescales of 1000 and 600 s. Although of a similar timescale as expected from HMXB systems, the large amplitude of the oscillations is possibly unique to this HMXB system. Similar kinds of periodic variabilities, albeit of shorter periods, have been observed from a few black hole X-ray binaries like GRS 1915+105 (Paul et al. 1998) and IGR J17091-3624 in their ρ variability class that shows quasi-periodic flares on timescales of 40–120 s (Altamirano et al. 2011). Millihertz oscillations have also been observed in dwarf nova systems (see Mauche 2002), consistent with their larger accretion disk radii, but not with such large amplitudes.
Thus, it would be natural to expect that the source of these oscillations in 4U 0115+63 has something to do with the accretion disk. The orbital phases for the reported QPOs in 4U 0115+63 from LAXPC, NuSTAR, and RXTE observations are presented in Table 4. Orbital phase was calculated using the periastron passage time (Tw) = 53243.038 of the 2004 outburst and an orbital period Porb = 24.3174 days (Raichur & Paul 2010).
Figure 7 shows a plot of the slowest observed QPO and its harmonic in the LAXPC, NuSTAR, and PCA observations against their 3–50 keV luminosity. Since the LAXPC observation was performed close to the peak of the outburst (see Figure 1) with a BAT count rate similar to that during the NuSTAR observation, we assume the QPOs from these three observations to be originating from a similar mechanism. The plot shows that there seems to be a trend in the observed oscillation frequency as a function of the luminosity of the source. Such a trend can then be used to constrain the models used to explain these oscillations.

Figure 7. Oscillation time period vs. 3–50 keV X-ray luminosity, of 4U 0115+63. For each observation, the slowest time period oscillations (∼1 mHz in red) and its harmonic (∼2 mHz in black) have been plotted. The LAXPC observation is marked by an open square, NuSTAR with an open diamond, and RXTE with an open triangle. The dashed–dotted line corresponds to viscous timescales (Equation (5)), and the dashed line corresponds to precession timescales (Equation (7)). See the text for details.
Download figure:
Standard image High-resolution imageThe first possible explanation that can be put forth relates to oscillations tied to the Keplerian frequencies at some fixed radii in the accretion disk. The Keplerian frequency model (KFM; van der Klis et al. 1987) and the beat frequency model (BFM; Alpar & Shaham 1985; Lamb et al. 1985) are popular models in this regard. For 4U 0115+63, with a magnetic field of  as expected from its fundamental cyclotron line energy, the inner disk radius will correspond to its magnetospheric radius (Ghosh & Lamb 1979; Becker et al. 2012) of
where  and
and  correspond to the mass and radius of the neutron star and Lx to the X-ray luminosity. Λ for disk accretion is given as
  , with α being the disk viscosity parameter. The Keplerian frequency
  at this radius would be
  , much greater than the millihertz time periods required for both the Keplerian and beat frequencies. A second possibility, as suggested by Heindl et al. (1999), who reported a 2 mHz oscillation, would involve obscuring/scattering matter at the outer edge of the accretion disk. Millihertz frequencies correspond to Keplerian frequency at radii
  . For this binary system, with a projected orbital distance of the neutron star from its center of mass of
  , it seems unlikely that the outer disk radius would be so small. Thus, it would seem that both KFM and BFM cannot explain the observed millihertz oscillations.
An explanation for the oscillations in GRS 1915+105 has used thermal disk instabilities occurring in the inner accretion disk, when the local mass accretion rate approaches its Eddington limit. The thermal instability results in large amplitude X-ray QPOs in the viscous timescales of a few minutes to hours. A similar explanation involving viscous relaxation timescales caused by the thermal disk instabilities can be used for the ∼1000 s oscillations, as the source was at the peak of the outburst when these oscillations were observed (close to Eddington luminosity). Viscous timescales for the HMXB accreting source (Frank et al. 2002, page 113, Equation (5.69)) are given as
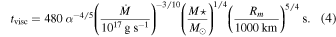
Using  , this gives
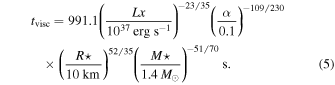
As seen from the dashed–dotted line in Figure 7, this expression follows the trend of oscillation timescales with luminosity.
However, Kimura et al. (2016) observed 100 s to 2.5 hr variability in optical and X-ray wavebands from the transient black hole binary V404 Cygni, similar to the X-ray timescales of GRS 1915+105. The optical variability was observed at a mass accretion rate that was 10 times lower than the Eddington limit. This shows that the reason for the disk instabilities leading to the viscous timescale periodicities need not be related to thermal instabilities at high accretion rates.
Another possibility for causing such millihertz oscillations was suggested by Shirakawa & Lai (2002). They reasoned that a warped or precessing accretion disk caused by misaligned vectors of the disk angular momentum and the magnetic field can lead to such observational signatures. The frequency of warping/precession at the magnetospheric radius as given by Equation (27) in their paper lies in the millihertz range with

This can be re-cast to give an equation similar to (5), giving

As seen in Figure 7, both the models fit the data points well, and hence it is difficult to distinguish between these two models. It is worth noting, though, that the best-fit value of α (0.023) for the precession model is higher than the best-fit value of α (0.016) for the viscous disk instability model. More detailed observations of millihertz QPOs in 4U 0115+63 over a much wider range of luminosity are required to discriminate between the two models and determine the origin of these low-frequency QPOs with more certainty.
5. Conclusion
We have detected ∼1 mHz and 2 mHz oscillations from observations with the LAXPC instrument on board AstroSat during the peak of the 2015 outburst close to the periastron passage of the pulsar. Similar low-frequency QPOs are also detected in the NuSTAR data obtained before and after the LAXPC observations. Heindl et al. (1999) had earlier reported the detection of ∼2 mHz QPO during the same phase of the periastron passage in the 1999 outburst. We have detected similar low-frequency QPOs during the 2004, 2008, and 2011 outbursts from the RXTE/PCA data. This suggests the possibility of this phenomenon being related to the elliptical binary orbit of the Be/X-ray pulsar. Present detection of ∼1 and 2 mHz oscillations from the X-ray pulsar 4U 0115+63 implies that the quasi-periodicity timescale is independent of the accretor and depends on accretion and physical parameters of the binary system that are distinct from other smaller-timescale QPOs observed from this and other binary systems. It is of the utmost importance to model the different physical origins of slow and fast quasi-periodicities in a unified way irrespective of the nature of the accretor.
We thank members of the LAXPC team for their contribution to the development of the LAXPC instrument. We also acknowledge contributions of the AstroSat project team at ISAC. This research has made use of data obtained through the HEASARC Online Service, provided by NASA/GSFC, in support of NASA High Energy Astrophysics Programs. J.R. and P.C.A. acknowledge the fellowship and the funding provided by the National Academy of Sciences, India (NASI). This paper makes use of data from the AstroSat mission of the Indian Space Research Organisation (ISRO), archived at the Indian Space Science Data Centre (ISSDC). Finally we thank the anonymous referee for critical observations and comments that considerably improved the content of the paper.
Footnotes
- 6
- 7
- 8
- 9