Abstract
We present the discovery of the radio afterglow of the most distant ultralong gamma-ray burst (GRB) detected to date, GRB 220627A at redshift z = 3.084. Its prompt gamma-ray light curve shows a double-pulse profile, with the pulses separated by a period of quiescence lasting ∼15 minutes, leading to early speculation it could be a strongly gravitationally lensed GRB. However, our analysis of the Fermi Gamma-ray Burst Monitor spectra taken during the time intervals of both pulses show clear differences in their spectral energy distributions, disfavouring the lensing scenario. We observed the radio afterglow from 7 to 456 days postburst: an initial, steep decay (Fν ∝ t−2) is followed by a shallower decline (Fν ∝ t−1/2) after ∼20 days. There are three scenarios that could explain these radio properties: (i) energy injection from an additional, slower ejecta component catching up to the external shock; (ii) a stratified density profile going as n ∝ r−8/3; or alternatively, (iii) the presence of a slow, wide ejecta component in addition to a fast, narrow ejecta component. We also conducted an independent test of the lensing hypothesis via very long baseline interferometry (VLBI) observations at ∼12 days postburst by searching, for the first time, for multiple images of the candidate lensed GRB afterglow. Our experiment highlighted the growing need for developments in real-time correlation capabilities for time-critical VLBI experiments, particularly as we advance towards the SKA and ngVLA era of radio astronomy.
Original content from this work may be used under the terms of the Creative Commons Attribution 4.0 licence. Any further distribution of this work must maintain attribution to the author(s) and the title of the work, journal citation and DOI.
1. Introduction
Gamma-ray bursts (GRBs) are produced in highly relativistic jets launched after the core collapse of a massive star (S. E. Woosley 1993; J. Hjorth et al. 2003; K. Z. Stanek et al. 2003) or the merger of binary compact objects ( binary neutron star or neutron star-black hole merger; D. Eichler et al. 1989; L.-X. Li & B. Paczyński 1998; B. P. Abbott et al. 2017). A panchromatic synchrotron afterglow (e.g., B. Paczynski & J. E. Rhoads 1993; R. Sari et al. 1998) observable from X-ray down to radio frequencies is produced when the jet decelerates into the circumburst medium, giving rise to both a reverse and forward shock at which relativistic electrons are accelerated. Monitoring the radio afterglow up until late times is crucial for constraining the microphysics and energetics of any given event (for a review, see P. Chandra & D. A. Frail 2012). The radio afterglow may also probe the reverse shock (e.g., R. Sari & T. Piran 1999; T. Laskar et al. 2013, 2019; G. E. Anderson et al. 2014; A. J. van der Horst et al. 2014; J. S. Bright et al. 2023) with greater observational latency (up to few days postburst) compared with shorter wavelengths and allow for structure or proper motion on milliarcsecond scales to be resolved through very long baseline interferometry (VLBI) techniques. However, only a small fraction of GRBs, ∼12%, have radio follow-up (even fewer, ∼6%, with radio detections; see the table of GRBs19 maintained by Jochen Greiner and also P. Chandra & D. A. Frail 2012; G. E. Anderson et al. 2018), and only a handful of GRBs have been observed with VLBI (e.g., GRBs 030329A, 151027A, 170817A, 190829A, 201015A, and 221009A; G. B. Taylor et al. 2004; F. Nappo et al. 2017; K. P. Mooley et al. 2018; G. Ghirlanda et al. 2019; S. Giarratana et al. 2022b, 2024; O. S. Salafia et al. 2022). Now, with this paper, GRB 220627A joins this small set of events with a comprehensive radio campaign lasting more than 400 days including high angular resolution VLBI follow-up.
The most striking feature of GRB 220627A was the presence of two emission episodes, showing similar temporal profiles, separated by ∼15 minutes in the prompt gamma-ray light curve (O. J. Roberts et al. 2022). The initial trigger event on the Fermi/Gamma-ray Burst Monitor (GBM, 8 keV–40 MeV; C. Meegan et al. 2009) occurred at 21:21:00.09 UT on 2022 June 27 (Fermi GBM Team 2022). The detection of this prompt emission was later confirmed by reports of high-energy detections by the Fermi/Large Area Telescope (LAT, operating at a higher energy range than Fermi/GBM, 20 MeV–300 GeV; W. B. Atwood et al. 2009) (N. di Lalla et al. 2022), Swift/Burst Alert Telescope (BAT) via the Gamma-Ray Urgent Archiver for Novel Opportunities (GUANO) program (G. Raman et al. 2022), Konus-Wind (D. Frederiks et al. 2022), and the AstroSat Cadmium-Zinc-Telluride Imager (CZTI) (A. Suresh et al. 2022). A second trigger event on the Fermi/GBM, localized to the same region of the sky, occurred ∼15 minutes later; it was shown that this second burst episode had a similar duration20 (T90 ≈ 127 s) and burst shape to the first episode (T90 ≈ 138 s). This second episode was also detected across the different energy bands of Konus-Wind (20–100 keV and 100–400 keV) and AstroSat (20–200 keV) instruments, providing a further spectral constraint on the possible emission mechanisms. The two immediate competing interpretations proposed were either: (i) a gravitationally lensed GRB event, or (ii) an ultralong GRB event (O. J. Roberts et al. 2022), which are conventionally characterized as those with durations greater than 1000 s.
A gravitationally lensed GRB event is expected to have clear signatures imprinted on the prompt light curve: two or more segments of the light curve should show similar temporal and spectral profiles that are indicative of different arrival times for photons from different lensed images due to the different paths traversed (S. Mao 1992). Given that up to four GRBs may be detected on any given day, out to very high redshifts z ∼ 9 (for a brief review of high-redshift GRBs, see R. Salvaterra 2015), a small fraction of them are expected to be gravitationally lensed: approximately 1 in 1000 GRBs (S. Mao 1992) or ∼0.3 sky−1 yr−1 (M. Oguri 2019). To date, five bursts have been claimed to be gravitationally lensed via the identification of feature similarities in different segments of their prompt light curves: GRBs 950830 (J. Paynter et al. 2021), 081126A (S.-J. Lin et al. 2022), 090717 (Z. Kalantari et al. 2021), 200716C (Y. Wang et al. 2021; X. Yang et al. 2021), and 210812A (P. Veres et al. 2021). However, among them, many of these claims have been disputed on statistical grounds (e.g., O. Mukherjee & R. Nemiroff 2024).
Lensed GRBs allow the physical properties of the intervening lens to be studied (e.g., J. Paynter et al. 2021) and for time-delay cosmography to be performed, yielding new constraints on cosmological parameters, such as the Hubble parameter (S. Refsdal 1964). Recent examples of time-delay cosmography have mainly been through the study of lensed supernovae—e.g., S. Refsdal (P. L. Kelly et al. 2023a, 2023b), SN H0pe (W. Chen et al. 2024; J. D. R. Pierel et al. 2024a; M. Pascale et al. 2025), and SN Encore (J. D. R. Pierel et al. 2024b)—their effectiveness for doing cosmology will improve with better precision in the time-delay measurements and improved techniques for modeling of the lenses. Despite the initial potential for advancing on this front, the lensing interpretation of the GRB 220627A prompt light curve was later shown to be inconsistent with the higher-energy Fermi/LAT data (Y.-Y. Huang et al. 2022). In their analysis of these Fermi/LAT data, Y.-Y. Huang et al. (2022) showed that the high-energy spectrum of the burst in the first episode was inconsistent with that in the second episode: 49 photons above 100 MeV were detected by Fermi/LAT in the first episode compared to none in the second.
With the lensing interpretation disfavored, GRB 220627A was instead classified as an ultralong GRB, the eighth such event to be confirmed in the literature (see, e.g., S. Campana et al. 2006; A. J. Levan et al. 2014, and references therein). It should be noted that GRB 220627A belongs to a less common subset of ultralong GRBs with “interrupted emission” (in contrast to those with “continuous emission”; see F. J. Virgili et al. 2013 for a discussion): its prompt light curve features two pulses of activity separated by a long period of quiescence, rather than the “continuous” activity (without periods of quiescence) seen in more typical ultralong GRB prompt light curves. The ∼15 minutes period of quiescence between the two episodes is rather uncommon; only GRB 080407A has been reported in the literature with a longer period of quiescence (∼1400 s) between two observed emission episodes (F. J. Virgili et al. 2013). It is still unclear whether the ultralong GRB subpopulation represents the tail of the standard long-duration GRB distribution (F. J. Virgili et al. 2013) or a new class of GRBs with fundamentally different properties (M. Boër et al. 2015).
Evidence of properties for this subpopulation differing from standard long GRBs has started to emerge. For example, SN 2011kl, associated with ultralong GRB 111209A, was found to be 3 times more luminous compared to Type Ic supernovae associated with standard long GRBs, while also possessing a very distinct supernova spectrum (J. Greiner et al. 2015). The ultralong GRB 130925A also displayed spectral properties (E. C. Bellm et al. 2014; R. Basak & A. R. Rao 2015) seldom observed in the standard long GRB population: the X-ray spectrum transitioned from a softer spectrum (unusual for afterglows) to a harder spectrum (more typical for afterglows), which suggested the presence of either a thermal hot cocoon component (L. Piro et al. 2014), or a dust echo scattering the prompt emission (P. A. Evans et al. 2014; Y.-N. Zhao & L. Shao 2014); and the radio spectrum exhibited a sharp cutoff (decline) above 10 GHz (A. Horesh et al. 2015), which could not be explained using an electron spectral index consistent with the values inferred from the wider GRB population (1.5 < p < 3.5), where the electron power-law energy distribution is dN/dE ∝ E−p. B. Gendre et al. (2013) found the rate of these ultralong events in the local Universe to be 6 × 10⁻⁵ Gpc−3 yr−1, which was significantly lower than the local GRB rate estimates (e.g.,  Gpc−3 yr−1 in E. J. Howell & D. M. Coward 2013). The study of X-ray afterglows in the local Universe indeed found that the ultralong events had a higher intrinsic absorption (NHx,i > 6 × 1021 cm−2) and softer photon index (Γ > 3) than the normal population; this was interpreted as indications of a turbulent mass-loss history from the progenitor leading to a dusty wind environment or simply the presence of a large stellar progenitor located in a dusty environment (R. Margutti et al. 2015).
More generally, the following four scenarios have been proposed to explain the long central engine activity required for ultralong GRBs: (i) core collapse of low-metallicity blue supergiants with much larger radii than the Wolf–Rayet progenitors of standard long GRBs: they can provide enough mass to power the central engine for thousands of seconds (e.g., B. Gendre et al. 2013; K. Kashiyama et al. 2013; D. Nakauchi et al. 2013; R. Perna et al. 2018); (ii) tidal disruption of white dwarfs by black holes with mass <105 M⊙: they can produce accretion timescales of the bound debris and energetics that are consistent with ultralong GRBs (e.g., J. S. Bloom et al. 2011; D. N. Burrows et al. 2011; B. A. Zauderer et al. 2011; A. J. Levan et al. 2014; M. MacLeod et al. 2014; K. Ioka et al. 2016); (iii) the spindown of a newly formed magnetar remnant following the launch of the GRB jet: the ultralong duration of the GRB can be explained by the extra spindown energy injection (V. V. Usov 1992; J. Greiner et al. 2015); and (iv) standard long GRB progenitor (Wolf–Rayet star) in a low-density circumburst environment (e.g., <10−3 cm−3): the external shock forms further out from the progenitor in a low-density environment, allowing more time for internal shocks to dissipate radiative energy, which leads to both a higher prompt efficiency and a longer duration consistent with ultralong GRBs (P. A. Evans et al. 2014).
An afterglow for GRB 220627A was detected at X-ray (J. D. Gropp et al. 2022), optical (S. de Wet et al. 2022; A. Nicuesa Guelbenzu et al. 2022), and radio (J. Leung et al. 2022; S. Giarratana et al. 2022a) wavelengths. Its localization enabled the identification of narrow metal absorption lines within the afterglow, placing the spectroscopic redshift measurement of the afterglow at z = 3.084 (making it the most distant ultralong GRB detected to date), in addition to lines from an intervening system at z = 2.665 (L. Izzo et al. 2022; S. de Wet et al. 2023).
In this paper, we present the results from our radio observations of GRB 220627A spanning over 400 days postburst, which include VLBI observations intended for testing the lensing hypothesis. While the high-energy spectrum in this case provided sufficient data to disfavor the lensing scenario, VLBI observations offer an independent and direct test of this hypothesis, potentially free from ambiguities from light curve and spectral analysis only. In the case of strong lensing, these observations would enable us to model the lens, which is an important step for using lensed GRB events for time-delay cosmography. In Section 2, we give an overview of our ongoing VLBI program for confirming lensed GRB candidates. In Section 3, we present the radio observations of GRB 220627A used in this work. In Section 4, we reassess the Fermi/GBM data originally used to classify GRB 220627A as a candidate lensed GRB, discuss our physical interpretation of the radio afterglow, and describe the outcomes of our VLBI experiment. We summarize our conclusions in Section 5.
Throughout this paper, we assume a flat ΛCDM cosmology with H0 = 67.7 km s−1 Mpc−1, ΩM = 0.310, and ΩΛ = 0.690 (Planck Collaboration et al. 2020).
2. Imaging Lensed GRB Afterglows with VLBI
GRB 220627A was the first event trigger for our ongoing VLBI program aimed at verifying candidate lensed GRBs. In this section, we describe why we triggered VLBI and the companion compact interferometer campaign for GRB 220627A. In particular, we discuss how we used VLBI to test the gravitational lensing hypothesis of GRB 220627A and the broader scientific implications of confirming a lensed GRB candidate.
2.1. Strongly Lensed Gamma-Ray Bursts
If a GRB is strongly gravitationally lensed, multiple images of the GRB would be produced (e.g., M. Oguri 2019). In the scenario where the observing instrument does not have sufficient angular resolution to resolve the lensed images, the gravitational lens signature may be superimposed onto the prompt light curve (O. M. Blaes & R. L. Webster 1992). Any flux variation from the GRB would appear at different times in the lensed images because the photons travel different path lengths. Therefore, in a spatially unresolved light curve there would be two pulses (for two lensed images), where the temporal profile of the second pulse should be similar to the first pulse, albeit weaker in intensity. The spectral properties of the two pulses in this scenario should also be similar, i.e., the lens signature is consistent across all energy bands.
The time delay between the two pulses can be explained by a combination of both the Shapiro time delay and geometric effects from differing paths traversed by the two rays; it is governed by the relation provided in L. M. Krauss & T. A. Small (1991):
where Mz = M(1 + zL) is the redshifted lens mass (zL is the lens redshift), r is the brightness ratio of the two lensed images, G is the gravitational constant, and c is the speed of light.
In the case of lensed GRB candidates reported to date (including GRB 220627A), the time delays between the putative lensed images are usually seconds to minutes (e.g., P. Veres et al. 2021; Y. Wang et al. 2021; X. Yang et al. 2021). In this case, using Equation (1) and assuming a range of r from 1.5 to 5 and z up to ∼9, we would infer a lens mass of ∼105−7 M⊙. We note that the optical depth of lenses in this mass range is expected to be an order of magnitude lower than those with more typical “galactic” masses (∼1012 M⊙) (N. Loudas et al. 2022), and that none have been conclusively identified to date. However, this suggests that lensed GRBs may provide a promising avenue to conclusively identify the first lens within this mass range (see Section 2.2 below).
Since high-energy satellites have subsecond temporal resolutions, double-pulse prompt light curves have been the basis of various claims (and disputes) of gravitationally lensed GRBs as discussed in Section 1. As an example, we show in Figure 1 the prompt light curve for GRB 220627A (the burst that is the focus of this manuscript) from Fermi/GBM. The presence of two pulses with a flux ratio r ≈ 3 (this was determined by the ratio of the pulse fluences and is typical of a doubly imaged strong lensing system; see also O. J. Roberts et al. 2022), which showed similar temporal profiles across more than one energy band, initially provided compelling evidence supporting the strong gravitational lensing scenario. However, such observations cannot rule out the possibility that the double-pulse profile may be produced by a physical emission mechanism intrinsic to the GRB (rather than by lensing), or even the possibility that the double-pulse profile does not appear in energy bands outside the observable range of the instrument (e.g., as demonstrated by GRB 220627A, the double-pulse profile was clear in the Fermi/GBM data, but was lacking in the Fermi/LAT data; Y.-Y. Huang et al. 2022).
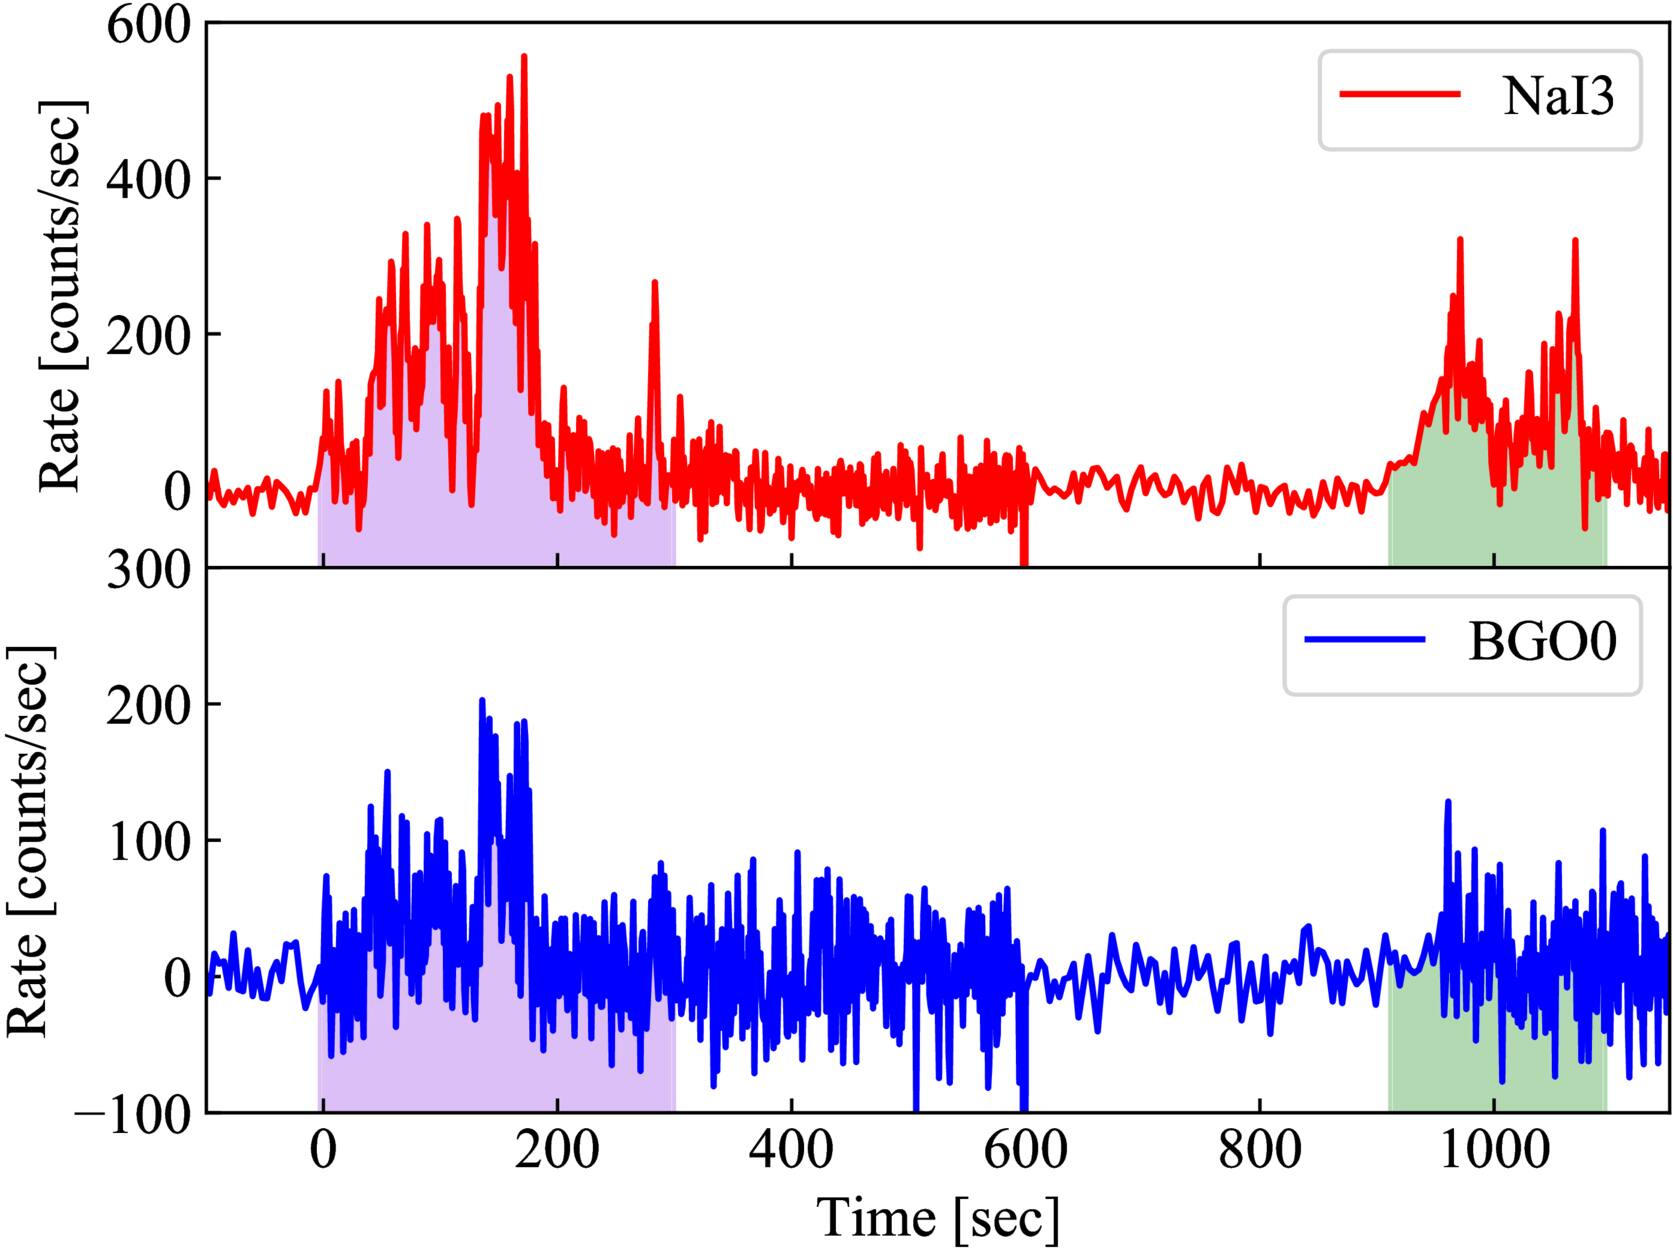
Figure 1. Background-subtracted light curve of GRB 220627A from the Fermi/GBM NaI#3 and BGO#0 detectors showing the count rate obtained integrating the signal in the 10–900 keV and 300–30,000 keV energy range, respectively. The shaded pink and green regions show the time intervals selected for the spectral analysis.
Download figure:
Standard image High-resolution imageThe smoking gun for a gravitationally lensed GRB would be the direct detection of two (or more) consistently evolving lensed images of the afterglow with the same surface brightness. The angular separation of the images is on the order of the Einstein radius:
where DLS, DL, and DS are the distances between the lens and the GRB, the distance to the lens, and the distance to the GRB, respectively. For a typical event, with GRB redshift zS = 1 and lens redshift zL = 0.4, the Einstein radius for a 106 M⊙ point-mass lens (the typical lens mass inferred from previous claims; see above) is  , where D = DLDLS/DS (P. Veres et al. 2021). As a result, these systems are typically referred to as “millilens” systems. Specifically for GRB 220627A, given its redshift and that of the intervening system (which we interpret here as a potential lens), the expected Einstein radius would be θE ≈ 1.8 mas. Considering this typical angular scale expected from lensed GRB systems, direct detection of the two images in the prompt gamma rays or through standard X-ray/optical/radio afterglow observations would be infeasible. VLBI is currently the only way of reaching the necessary angular resolution for confirming a strongly lensed GRB event.
To confirm a strongly lensed GRB event with VLBI observations, the detection of spatially resolved components would be required. Ideally, these detections are made in at least two epochs, with at least one epoch featuring quasi-simultaneous observations at two or more frequencies. These allow for a confirmation of lensing by checking:
- 1.
- 2.for surface brightness preservation between the two lensed images (a necessary signature of gravitational lensing);
- 3.that the two lensed images preserve their brightness ratio as they evolve and, aided by complementary low-resolution radio observations, evolve in accordance with known GRB closure relations (e.g., R. Sari et al. 1998); and
- 4.that the brightness ratio of the afterglow images matches the ratio of the pulse fluences from the GRB prompt light curve (although there are certain scenarios where this may not hold, e.g., if there are significant wavelength-dependent absorption and scattering effects caused by the lens galaxy, or if the prompt emission comes from an emitting region with a large displacement from the radio emitting region—see R. Mittal et al. 2007; C. C. Cheung et al. 2014).
The combination of all these checks makes a confirmation robust against potential ambiguities that arise from using one or two checks, such as the possibility of chance spatial association with nonafterglow related sources (e.g., a background host galaxy nucleus).
2.2. Broader Scientific Implications
The confirmation of a strongly lensed GRB candidate has scientific implications for time-delay cosmography, the physics of the lens, and our understanding of GRBs. A confirmation would provide a new example of gravitational lensing to test Einstein’s general relativity, checking for consistency in both the temporal and spatial data. Like other strong gravitationally lensed explosive transients, lensed GRBs have important applications in time-delay cosmography; the measured time delay can be used alongside a well-constrained Einstein radius to constrain the Hubble parameter H0 (S. Refsdal 1964). This is a direct consequence of the time delay between the lensed GRB images being dependent on the mass distribution of the lens, which can be modeled from the morphology and distribution of detected components in high-resolution VLBI images, as well as geometric effects from different paths in spacetime, which is determined by the Hubble parameter—for a comprehensive review of time-delay cosmography for transients, see M. Oguri (2019).
As GRBs are found at high redshifts up to z ∼ 9 (e.g., R. Salvaterra 2015) and their prompt light curves (and any time delays) can be sampled accurately down to subsecond temporal resolution (e.g., C. Meegan et al. 2009), strongly lensed GRBs can potentially probe for lens mass and distance ranges that cannot be probed by strongly lensed quasars and supernovae (since the temporal resolution of the time delay determines the redshifted lens mass range your probe is sensitive to as shown in Equation (1)). Accompanying previous claims of lensed GRBs were suggestions of using them to study the population statistics and physics of their lenses (e.g., J. Paynter et al. 2021). In fact, a confirmation of a lensed GRB (with an observed time delay on the order of seconds to minutes) could also lead to the first confirmation of a millilens object, which implies the presence of massive compact objects, such as intermediate-mass black holes (IMBHs) and dark matter halos expected in some dark matter models (e.g., P. N. Wilkinson et al. 2001; C. Spingola et al. 2019; C. Casadio et al. 2021).
On the other hand, a conclusive rejection of a lensing explanation for a GRB with a double-pulse profile would put extra constraints on the physics of GRB central engines. For example, current GRB models that can explain multiple pulses in the prompt emission would need to be extended to explain how their emission mechanism in some GRBs can produce repeated pulses with similar temporal and spectral profiles. In the specific case of GRB 220627A, the comparison of the Fermi/GBM and Fermi/LAT data that ultimately disfavored the lensing hypothesis (Y.-Y. Huang et al. 2022) indicated that the GRB belonged to the subpopulation of ultralong GRBs.
Motivated by these broader scientific implications for confirming and characterizing a lensed GRB event, we began our radio campaign to independently test the lensing hypothesis for GRB 220627A through VLBI shortly after the GRB was detected; this campaign is described in the following section.
3. Observations and Data Analysis
Here, we outline our radio observations triggered for GRB 220627A as part of the VLBI program, which aimed to provide an independent test of the lensing hypothesis to verify the conclusions from the analysis of high-energy spectra. The Australia Telescope Compact Array (ATCA), MeerKAT, and the Karl G. Jansky Very Large Array (VLA) observations led to the discovery of the radio afterglow and contributed to the monitoring of its evolution over a span of ∼400 days. This set of observations informed our trigger of the high-resolution Very Long Baseline Array (VLBA) observations.
3.1. ATCA Observations
We observed the field of GRB 220627A with the ATCA, using the coordinates of the reported optical afterglow (S. de Wet et al. 2022) as the phase tracking center. We conducted four epochs of ATCA observations, observing the first epoch on 2022 July 5 for 10 hr (7.5 days postburst), the second epoch on 2022 July 25 for 12.5 hr (27.4 days postburst), the third epoch on 2023 September 22 for 12 hr (452.2 days postburst), and the fourth epoch on 2023 September 29 for 12 hr (459.2 days postburst), all under project C3478 (PI: J. Leung). For the first two epochs, the observations were observed at multiple bands, centered on 5.5, 9, 17, and 19 GHz, each with a bandwidth of 2 GHz, while for the final two epochs, the observations were observed only at 17 and 19 GHz, each with a bandwidth of 2 GHz. The array was in H214 configuration for the first two observations and in H168 configuration for the final two epochs.22 In these configurations, the maximum baselines are 247 and 192 m, respectively. The values do not consider baselines involving antenna CA06 (all of which exceed 4 km) since they were flagged in our data reduction process as discussed below.
We reduced the visibility data using standard Miriad procedures (R. J. Sault et al. 1995). We used PKS B1934−638 to set the flux-density scale and calibrate the bandpass response, and PKS B1313−333 (J1316−3338) to calibrate the complex gains. Prior to imaging, we flagged out all the baselines involving antenna CA06. This was because the large gap in (u, v)-coverage between these longer baselines and the other much shorter baselines in the array created difficulties in the imaging process (due to the highly irregular shape of the resulting dirty beam). We produced images using the multifrequency synthesis CLEAN algorithm (J. A. Högbom 1974; B. G. Clark 1980; R. J. Sault & M. H. Wieringa 1994) and extracted flux densities in the case of a detection by fitting a point-source model in the image plane. For the 2022 July 5 (7.5 days postburst), 2023 September 22 (452.2 days postburst), and 2023 September 29 (459.2 days postburst) observations, we did not use the 19 GHz band as it was either severely affected by poor weather conditions or radio frequency interference. However, both the 17 and 19 GHz frequency bands provided reliable data for the 2022 July 25 (27.4 days postburst) observations so we could image them together, providing a contiguous bandwidth of 4 GHz centered on approximately 18 GHz. In order to obtain a deep late-time image of the field, we also imaged the 2023 September 22 and 29 observations (mean epoch of 455.7 days postburst) at 17 GHz together, providing an effective total integration time of 15 h. The flux densities (and 3σ upper limits for nondetections) are reported in Table 1. The rms noise in all bands was higher in the first observation, compared to the second, due to poor weather conditions.
Table 1. Radio Flux-density Measurements for GRB 220627A
| t | Telescope | ν | Fν |
|---|---|---|---|
| (days) | (GHz) | (μJy) | |
| 7.5 | ATCA | 5.5 | <98 |
| 7.5 | ATCA | 9.0 | <91 |
| 7.5 | ATCA | 16.9 | 373 ± 74 |
| 8.9 | MeerKAT | 1.3 | <28 |
| 11.7 | VLBA | 15.2 | <293 |
| 15.2 | VLA | 10.0 | < 60 |
| 15.2 | VLA | 15.0 | 74 ± 18 |
| 27.4 | ATCA | 5.5 | <63 |
| 27.4 | ATCA | 9.0 | <41 |
| 27.4 | ATCA | 17.7 | 63 ± 19 |
| 35.7 | MeerKAT | 1.3 | <44 |
| 39.0 | VLA | 6.0 | <41 |
| 45.1 | VLA | 15.1 | 44 ± 8 |
| 455.7 | ATCA | 16.9 | <19 |
Note. Columns (1) through (4) show the number of days in the observer frame since the Fermi/GBM trigger (21:21:00.09 UT on 2022 June 27), the observing telescope, the central observing frequency of the radio image, and the flux-density measurements for the observation. We report the 3σ limit for all nondetections , where σ here is simply the rms noise. The only exception is for the VLBA observation, where a more conservative 5σ limit is provided instead. The reported uncertainties include both the statistical and systematic components added together in quadrature. Here, the systematic errors arising from flux-density scale calibration are typically ≲5% for the ATCA, MeerKAT, and VLA, and ≲15% for the VLBA (which is higher because it relies on system temperatures and gain curves for flux-density calibration, rather than an observation of a dedicated flux-density calibrator).
Download table as: ASCIITypeset image
3.2. MeerKAT Observations
We observed the field of GRB 220627A with the MeerKAT telescope on 2022 July 6 (8.9 days postburst) and 2022 August 2 (35.7 days postburst) under project DDT-20220705-SG-01 (PI: S. Giarratana) for 2 h each. These observations were centered on 1.28 GHz (L band) with a bandwidth of 0.78 GHz. We used PKS B1934−638 for bandpass and flux-density scale calibration, and J1311−2216 for phase calibration. The archived raw visibilities were converted to the Measurement Set format with the KAT Data Access Library (katdal23 ) for continuum imaging. We reduced the data using oxkat24 (v0.3; I. Heywood 2020), where: the Common Astronomy Software Applications (CASA; J. P. McMullin et al. 2007; CASA Team et al. 2022) and TricoloUr25 (B. V. Hugo et al. 2022) packages were used for measurement set splitting, cross-calibration, and flagging; CubiCal26 (J. S. Kenyon et al. 2018) was used for self-calibration; and WSClean (A. R. Offringa et al. 2014) was used for continuum imaging. All processes were executed with oxkat L-band default settings. We do not detect any radio emission at the source location in both observations. The 3σ nondetection limits are given in Table 1.
3.3. VLA Observations
We obtained observations for GRB 220627A with the VLA at three separate epochs, with 1 h of observation time per epoch, under project VLA/22B-031 (Legacy ID: AL1245; PI: J. Leung). The first epoch of observations occurred on 2022 July 13 (15.2 days postburst), at the 10 and 15 GHz (X and Ku) frequency bands, with the array in A→D configuration.27 We then obtained a second epoch at the 6 GHz (C band) frequency band on 2022 August 5 (39.0 days postburst) and a third epoch at the 15 GHz (Ku band) frequency band on 2022 August 11 (45.1 days postburst); the array was in D configuration for both the second and third epoch of observations. For each observation, we used 3C 286 to calibrate the bandpass response and flux-density scale; we also used PKS B1313−333 (J1316−3338) to calibrate the complex gains.
Prior to imaging, we obtained the pipeline-calibrated28 visibility data from the data archives (see Data Availability section). We used CASA to verify the quality of the pipeline-calibrated data and also to image the field using the wide-field, multifrequency synthesis CLEAN algorithm. For the 2022 July 13 (15.2 days postburst) observation, due to problems associated with the unbalanced (u, v) coverage of the hybrid array, we were only able to obtain reliable data by using just the antennas that had already moved to the D configuration (i.e., we flagged all antennas located more than 2 km from the center of the array). After further accounting for antennas under maintenance and antennas flagged by the automated pipeline, the imaging process for the 10 and 15 GHz observations on 2022 July 13 (15.2 days postburst) used data from only 12 and 13 antennas, respectively; for the 2022 August 5 (39.0 days postburst) observation (at 6 GHz), the imaging process used data from 21 antennas; and for the 2022 August 11 observation (45.1 days postburst) at 15 GHz, the imaging process used data from 22 antennas. Further self-calibration was not performed for all observations since weak field sources in addition to the presence of poorly modeled extended sources led to limited improvements in the gain solutions. Due to the presence of imaging artifacts caused by the sidelobes of a bright, extended source outside the primary beam, PKS J1325−3236, we phase rotated the 2022 August 5 (6 GHz band) visibility data to J2000 13:25:32.8, −32:30:45 before imaging so we could deconvolve both the target and PKS J1325−3236 in our CLEAN cycles. For each observation, we imaged using the full bandwidth, i.e., 4 GHz for the observations centered on 6 and 10 GHz and 6 GHz for the observations centered on 15 GHz. In the case of a detection, we extracted the flux densities by fitting a point-source model in the image plane and report them in Table 1 (for nondetections, we give the 3σ upper limit).
3.4. VLBA Observations
We obtained high-resolution observations for GRB 220627A with the VLBA on two consecutive days under project VLBA/22B-032 (Legacy ID: BL296; PI: J. Leung). These observations were 6 hr in duration, starting at 22:30 UT on both 2022 July 8 and 9 (corresponding to a mean epoch of 11.7 days postburst). All standard VLBA antennas,29 with the exception of the Kitt Peak station, which was out due to wildfires, were available for both observations. The longest baseline was from Maunakea to Saint Croix, giving a projected baseline of ∼8600 km or ∼430 Mλ. For these observations, the VLBA was configured to use the digital downconverter (DDC) observing system, observing at the central frequency of 15.168 GHz (Ku band), with a total bandwidth of 512 MHz (split into four 128 MHz subbands) in two circular polarizations (right- and left-circular polarizations). Using a 2 bit sampler, the resulting data rate was 4 Gbps. The data were correlated after the observations using DiFX (A. T. Deller et al. 2007) with an integration time of 1 s and a spectral resolution of 1 MHz at Socorro, New Mexico, USA.
We carried out standard reduction procedures on the correlated datasets from both observations simultaneously using AIPS (E. W. Greisen 2003). We applied standard a priori amplitude calibration using the provided system temperature and gain curve tables. The instrumental delays were determined using the fringe finders J0555+3948 and J1642+3948. The latter was also used for solving the bandpass. Since the expected flux density of our target, GRB 220627A, was <0.5 mJy as informed by our earlier ATCA observations, we phase-referenced our experiment using the calibrator J1324−3235, which was observed in 45 s scans as part of 100 s duty cycle. Although this calibrator had a low unresolved flux-density measurement at 8.6 GHz (50 mJy), it was chosen due to its close separation (0 32) from the target position, which was particularly important given the low elevation of the source with respect to the VLBA antenna stations. To attain a better signal-to-noise ratio, we combined all the subbands during our global fringe fitting process on the fringe finders and phase-reference calibrators in order to solve for the residual phases, delays, and rates. The solutions from the phase-reference calibrator were interpolated to both the target and our check source, PKS B1313−333 (J1316−3338), located 1
 75 away from the target. Finally, we used Difmap (M. C. Shepherd 1997) with a natural weighting scheme (after trying several other robust weighting schemes to search for sources in the field of interest) to obtain the final images of both the target and the check source. The resulting image had a beam size of 0.49 mas × 1.51 mas with a position angle of −5
 4.
4.
In our VLBA observations, we were unable to identify any sources that were related to the GRB 220627A event within the optical30 and radio31 positional uncertainties. The final target image achieved an rms sensitivity of 51 μJy beam−1 and no noise peaks exceeded the 5σ level (i.e., ∼250 μJy beam−1). After performing self-calibration iterations on the check source (located further from the phase-reference calibrator than the target), we found that the phase errors were no more than ∼10° for most antennas, suggesting that possible problems with phase transfer were not responsible for the nondetection. The 5σ upper limit is reported in Table 1. We verified this result in an independent calibration of the data (as a blind test) using standard reduction procedures in CASA; we attained a similar rms sensitivity (and upper limit), arriving at the same conclusions.
4. Results and Discussion
4.1. Reanalysis of Fermi/GBM Observations and Classification as an Ultralong GRB
GRB 220627A was originally proposed as a candidate lensed GRB based on similar pulse profiles observed in the Fermi/GBM data (O. J. Roberts et al. 2022). While this interpretation was later disfavored after assessing the spectra inferred for both pulses using data from Fermi/LAT (Y.-Y. Huang et al. 2022), we check to see whether a similar conclusion could have been drawn from the Fermi/GBM data alone.
In particular, we analyze the Fermi/GBM data of both the NaI#3 and BGO#0 detectors. We used the Fermi Science Tools v.2.2.0 to analyze the Fermi/GBM data following the standard procedure32 (e.g., M. E. Ravasio et al. 2019, 2024). We extracted the light curves of NaI#3 in the 10–900 keV energy range and of BG#0 in the 300–30,000 keV energy range. The background-subtracted light curve of these two detectors is shown in the top and bottom panels, respectively, of Figure 1. The prompt emission shows two distinct emission episodes, each lasting a few hundred seconds, separated by a much longer period of quiescence. The two emission episodes have quite different temporal structures, with the first one being more variable and the second one apparently composed of two subpulses.
We extracted the time integrated spectrum of the two emission episodes by selecting two time intervals, [−6, 300] and [910, 1096] s, shown by the shaded regions in Figure 1. Given the large separation of the two time intervals, the background spectrum was estimated by considering four intervals bracketing the two emission episodes: [−450, −200], [400, 500], [700, 850], and [1200, 1300] s. A third-order polynomial was fit to the spectra contained in these time intervals and then interpolated to the time region selected for the spectral analysis.
We performed the spectral analysis with Xspec v.12.14.0 (K. A. Arnaud 1996). We considered the energy range between 10 and 900 keV for the NaI spectrum and excluded the 30–40 keV range due to the contamination by the Iodine K-edge at such energies. The energy range 300 keV–30 MeV was considered for the BGO spectrum. We allowed for a free intercalibration constant factor between the NaI and BGO spectra. We adopted the PG-stat, i.e., Poisson statistic for the source counts and Gaussian statistic for the background counts, in performing the fit.
The spectral model adopted is a smoothly broken power law:
in photons cm−2 s−1 keV−1 units. α and β are the spectral index of the power laws below and above, respectively, the characteristic break energy Ebreak. The model parameter n sets the curvature between the two power laws. We assume n = 2, which resembles the curvature of the typical Band function, which has been fitted to GRB spectra (D. Band et al. 1993, see also M. E. Ravasio et al. 2018).
The normalization constant in Equation (3) is defined as:
where L is the luminosity in units of erg s−1 in the 1 keV−10 MeV rest-frame energy range and dL(z) is the luminosity distance corresponding to the redshift z of the source. Therefore, the luminosity L is one of the four free parameters of the spectral model.
The peak energy of the spectral energy distribution (SED), i.e., the energy where E2 × dN/dE peaks, is:
We report the fit results for the two time intervals in Table 2. The posterior distributions of the fit parameters are shown in Figure 2 and the resulting fits are shown in Figure 3. In addition to the aforementioned differences in temporal structures between the first and second episodes (as shown in Figure 1), the spectra taken at the two time intervals are clearly distinct from each other, e.g., the α slope parameter differs between the two intervals with a significance of >5σ. It is likely that the initial lensing hypothesis proposed in O. J. Roberts et al. (2022) was based off the analysis of the Fermi/GBM data with lower-resolution binning, where the temporal structures between the two episodes are more similar. Therefore, based on the reanalysis of the Fermi/GBM data alone—without requiring the additional information from Fermi/LAT as in Y.-Y. Huang et al. (2022)—we can reject the lensed GRB hypothesis and verify the ultralong GRB classification.
Table 2. Spectral Parameters of the Fit of the Prompt Emission Spectrum of the Two Emission Episodes
| Interval | log(L) | Epeak | α | β | factor | PG-stat(dof) |
|---|---|---|---|---|---|---|
| (s) | (erg s−1) | (keV) | ||||
| [−6, 300] |

|

|

|

|

| 704(219) |
| [910, 1096] |

|

|

|

|

| 337(219) |
Note. Errors represent the 95% confidence interval for each parameter value; 'dof' is degrees of freedom.
Download table as: ASCIITypeset image
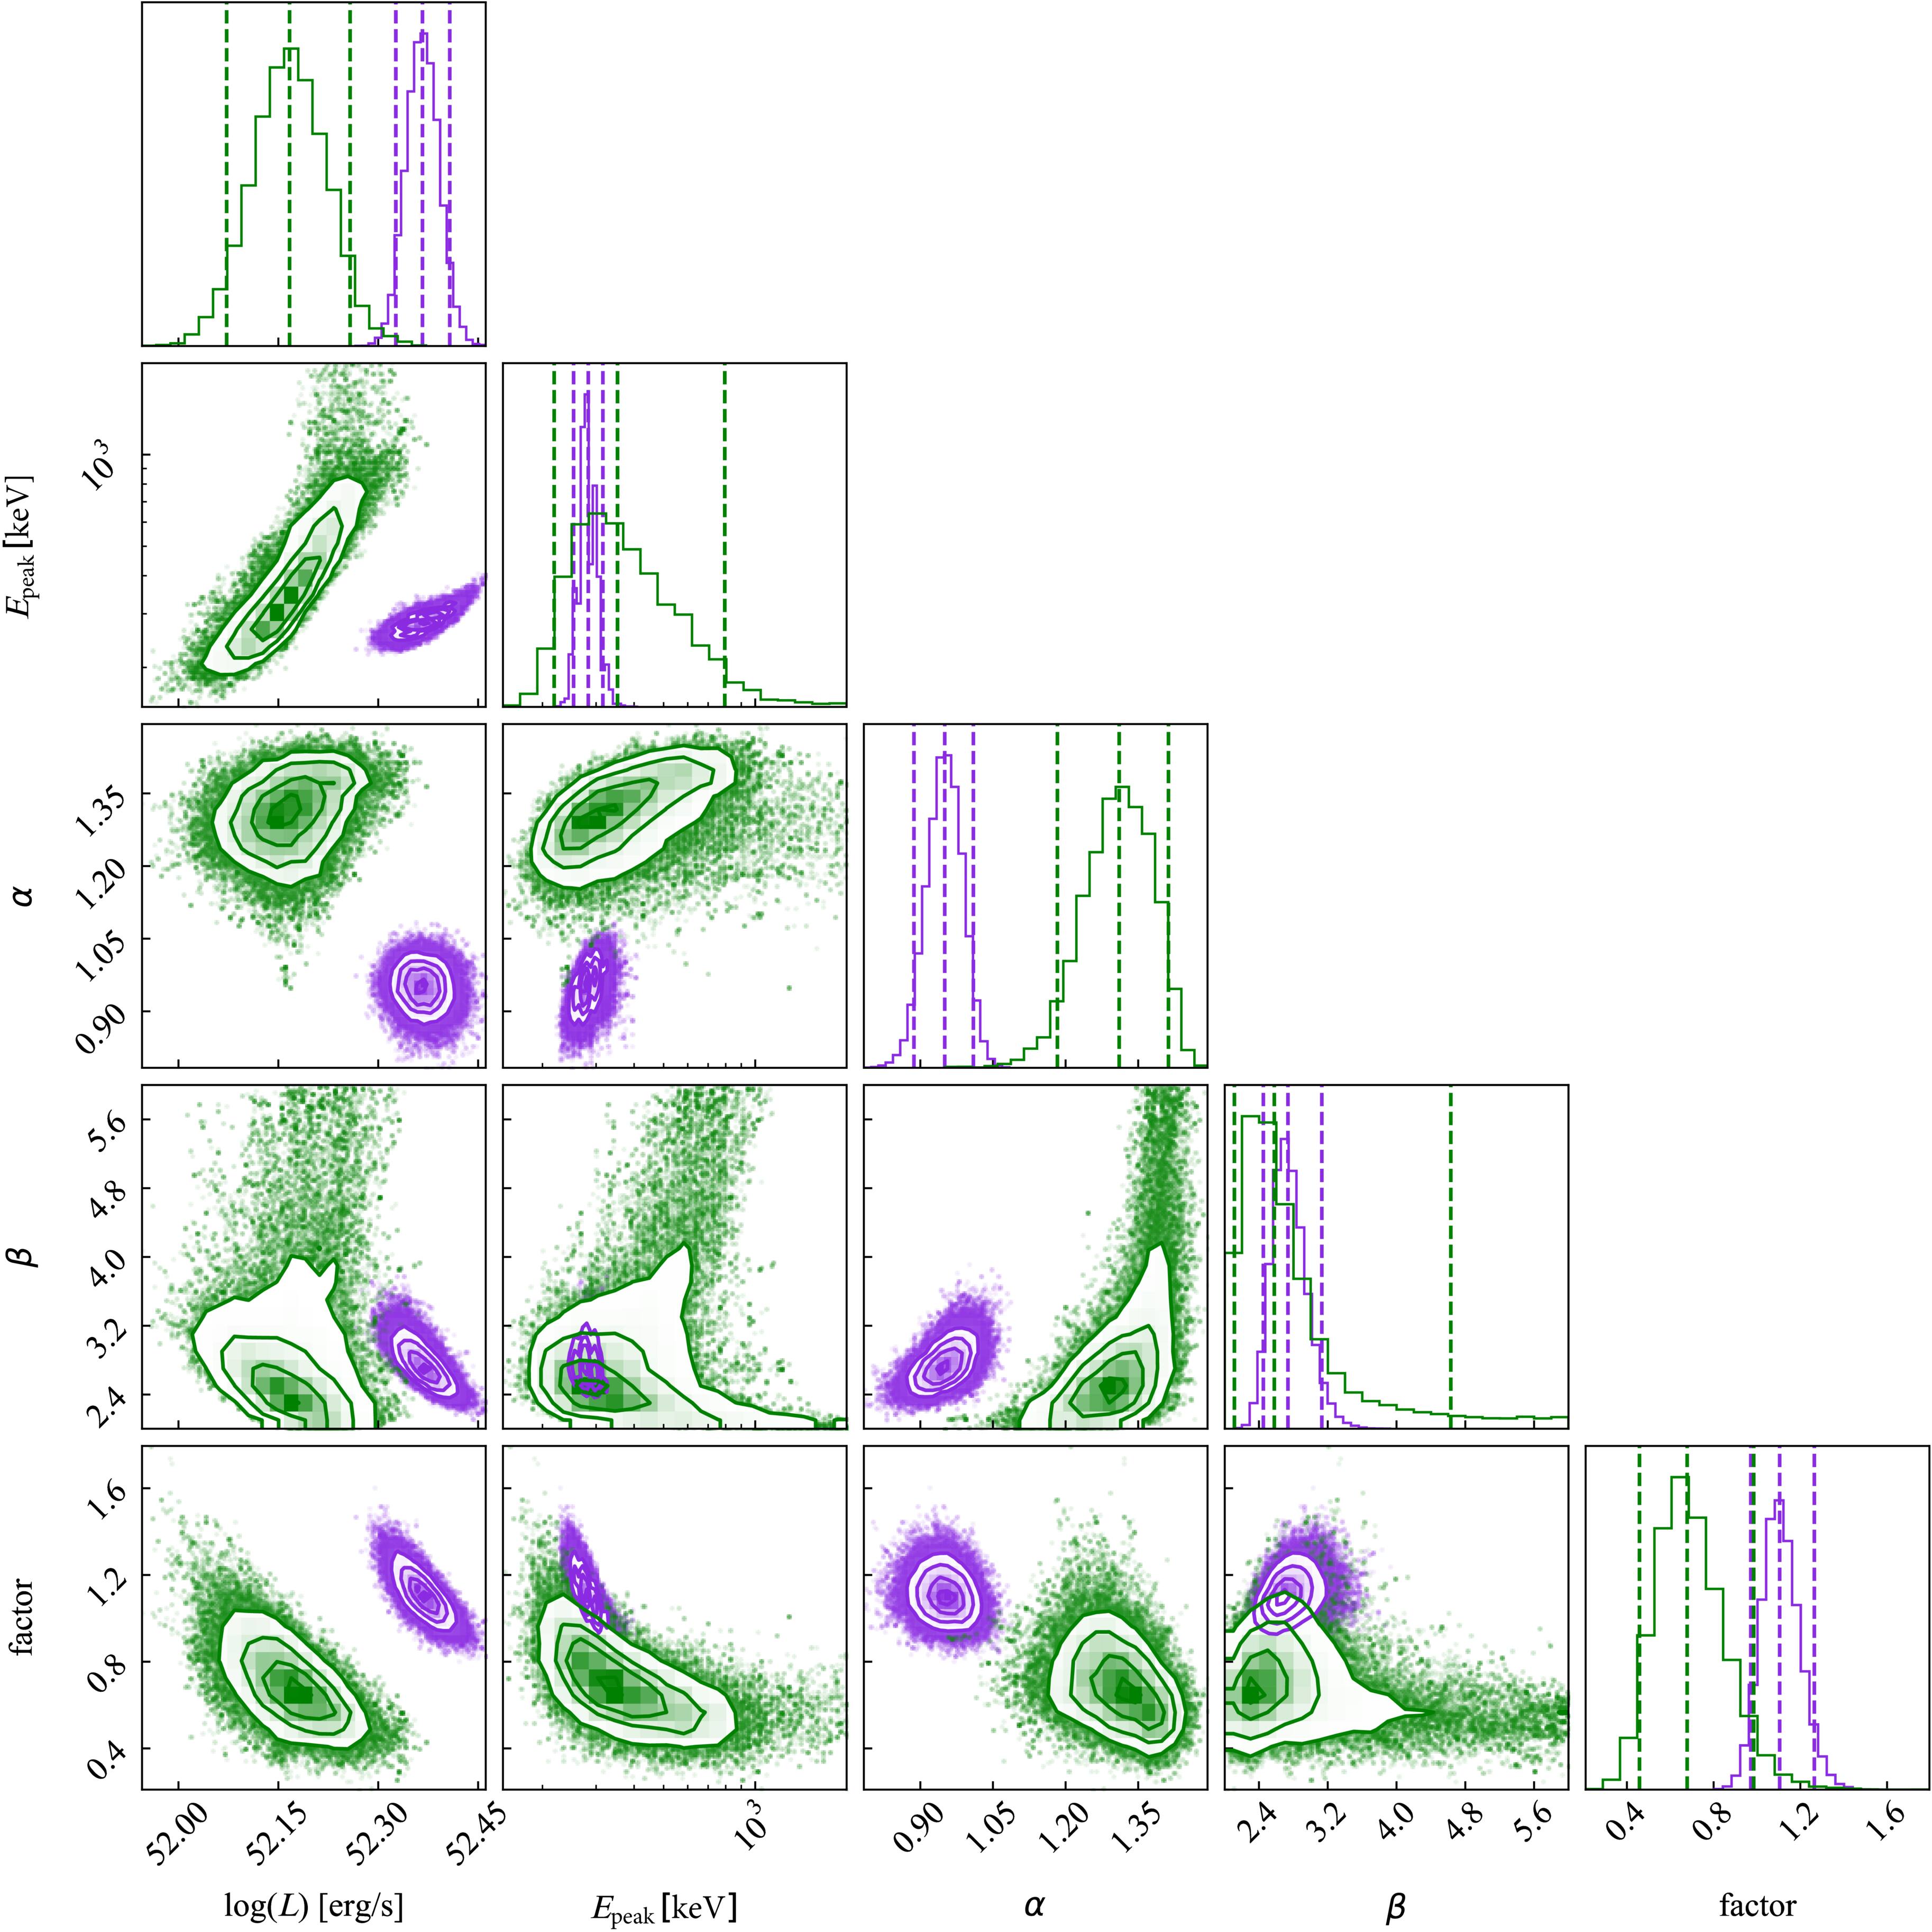
Figure 2. Posterior distributions of the parameters of the spectral fit to the two time intervals (violet and green for intervals 1 and 2, respectively; see Table 2). The median and 95% confidence intervals are marked by the dashed vertical lines in the histograms.
Download figure:
Standard image High-resolution image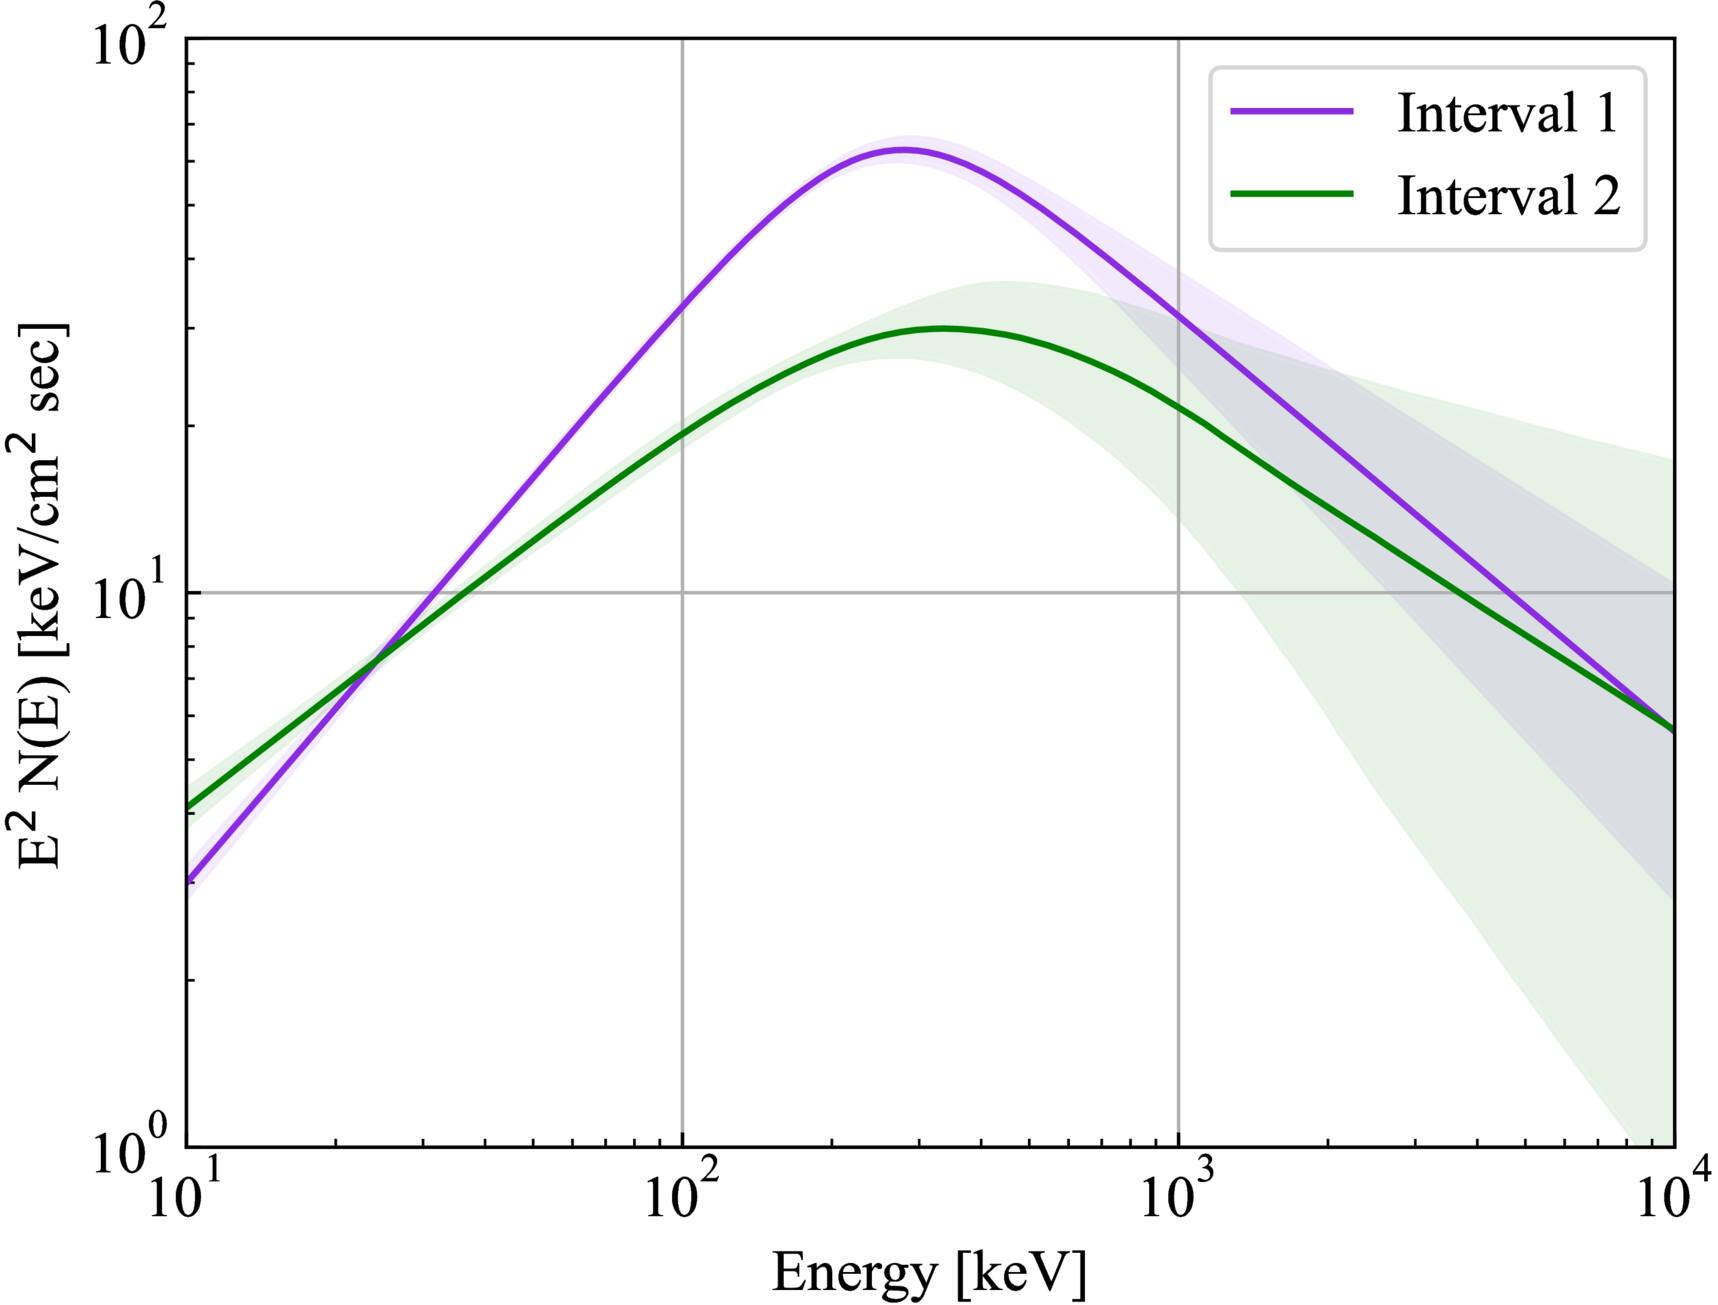
Figure 3. Spectra energy distribution of the prompt emission spectrum. The two time intervals analyzed are shown. The shaded regions represent the 68% confidence interval on the best-fit model (solid lines).
Download figure:
Standard image High-resolution image4.2. Phenomenology and Interpretation of the Radio Afterglow
In addition to informing our VLBI observations, our broadband radio light curves provide a detailed view of the afterglow of GRB 220627A between ∼4 and 450 days postburst. Here we assess implications of these observations on the properties of the afterglow and the progenitors of ultralong GRBs.
4.2.1. Basic Properties of the Radio Afterglow
Radio frequency light curves and spectra of the GRB 220627A afterglow at 7.5, 15, and 27 days postburst are shown in Figure 4. Our ATCA observations 7.5 post-trigger (light blue spectrum in the right panel of Figure 4) indicate a positive spectral slope α > 1.5 between 9 and 17 GHz, where Fν ∝ να and we quote a 3σ lower limit. Assuming synchrotron emission, this is a strong indication of self-absorption at these frequencies and at this epoch, with the self-absorption frequency νa > 17 GHz. At later times, our observations still indicate a rising spectrum, but the available limits can also accommodate a shallower slope of Fν ∝ ν1/3 (Figure 4, right). Due to a lack of detections, we cannot constrain the temporal evolution at ν < 15 GHz. The 15–17 GHz light curves, on the other hand, reveal an unexpected flattening in the decay of the radio flux density at t ≳ 15 days (Figure 4, left): while the evolution between 7.5 and 15 days is consistent with a steep Fν ∝ t−2 decay, the subsequent detections indicate a shallower Fν ∝ t−1/2.
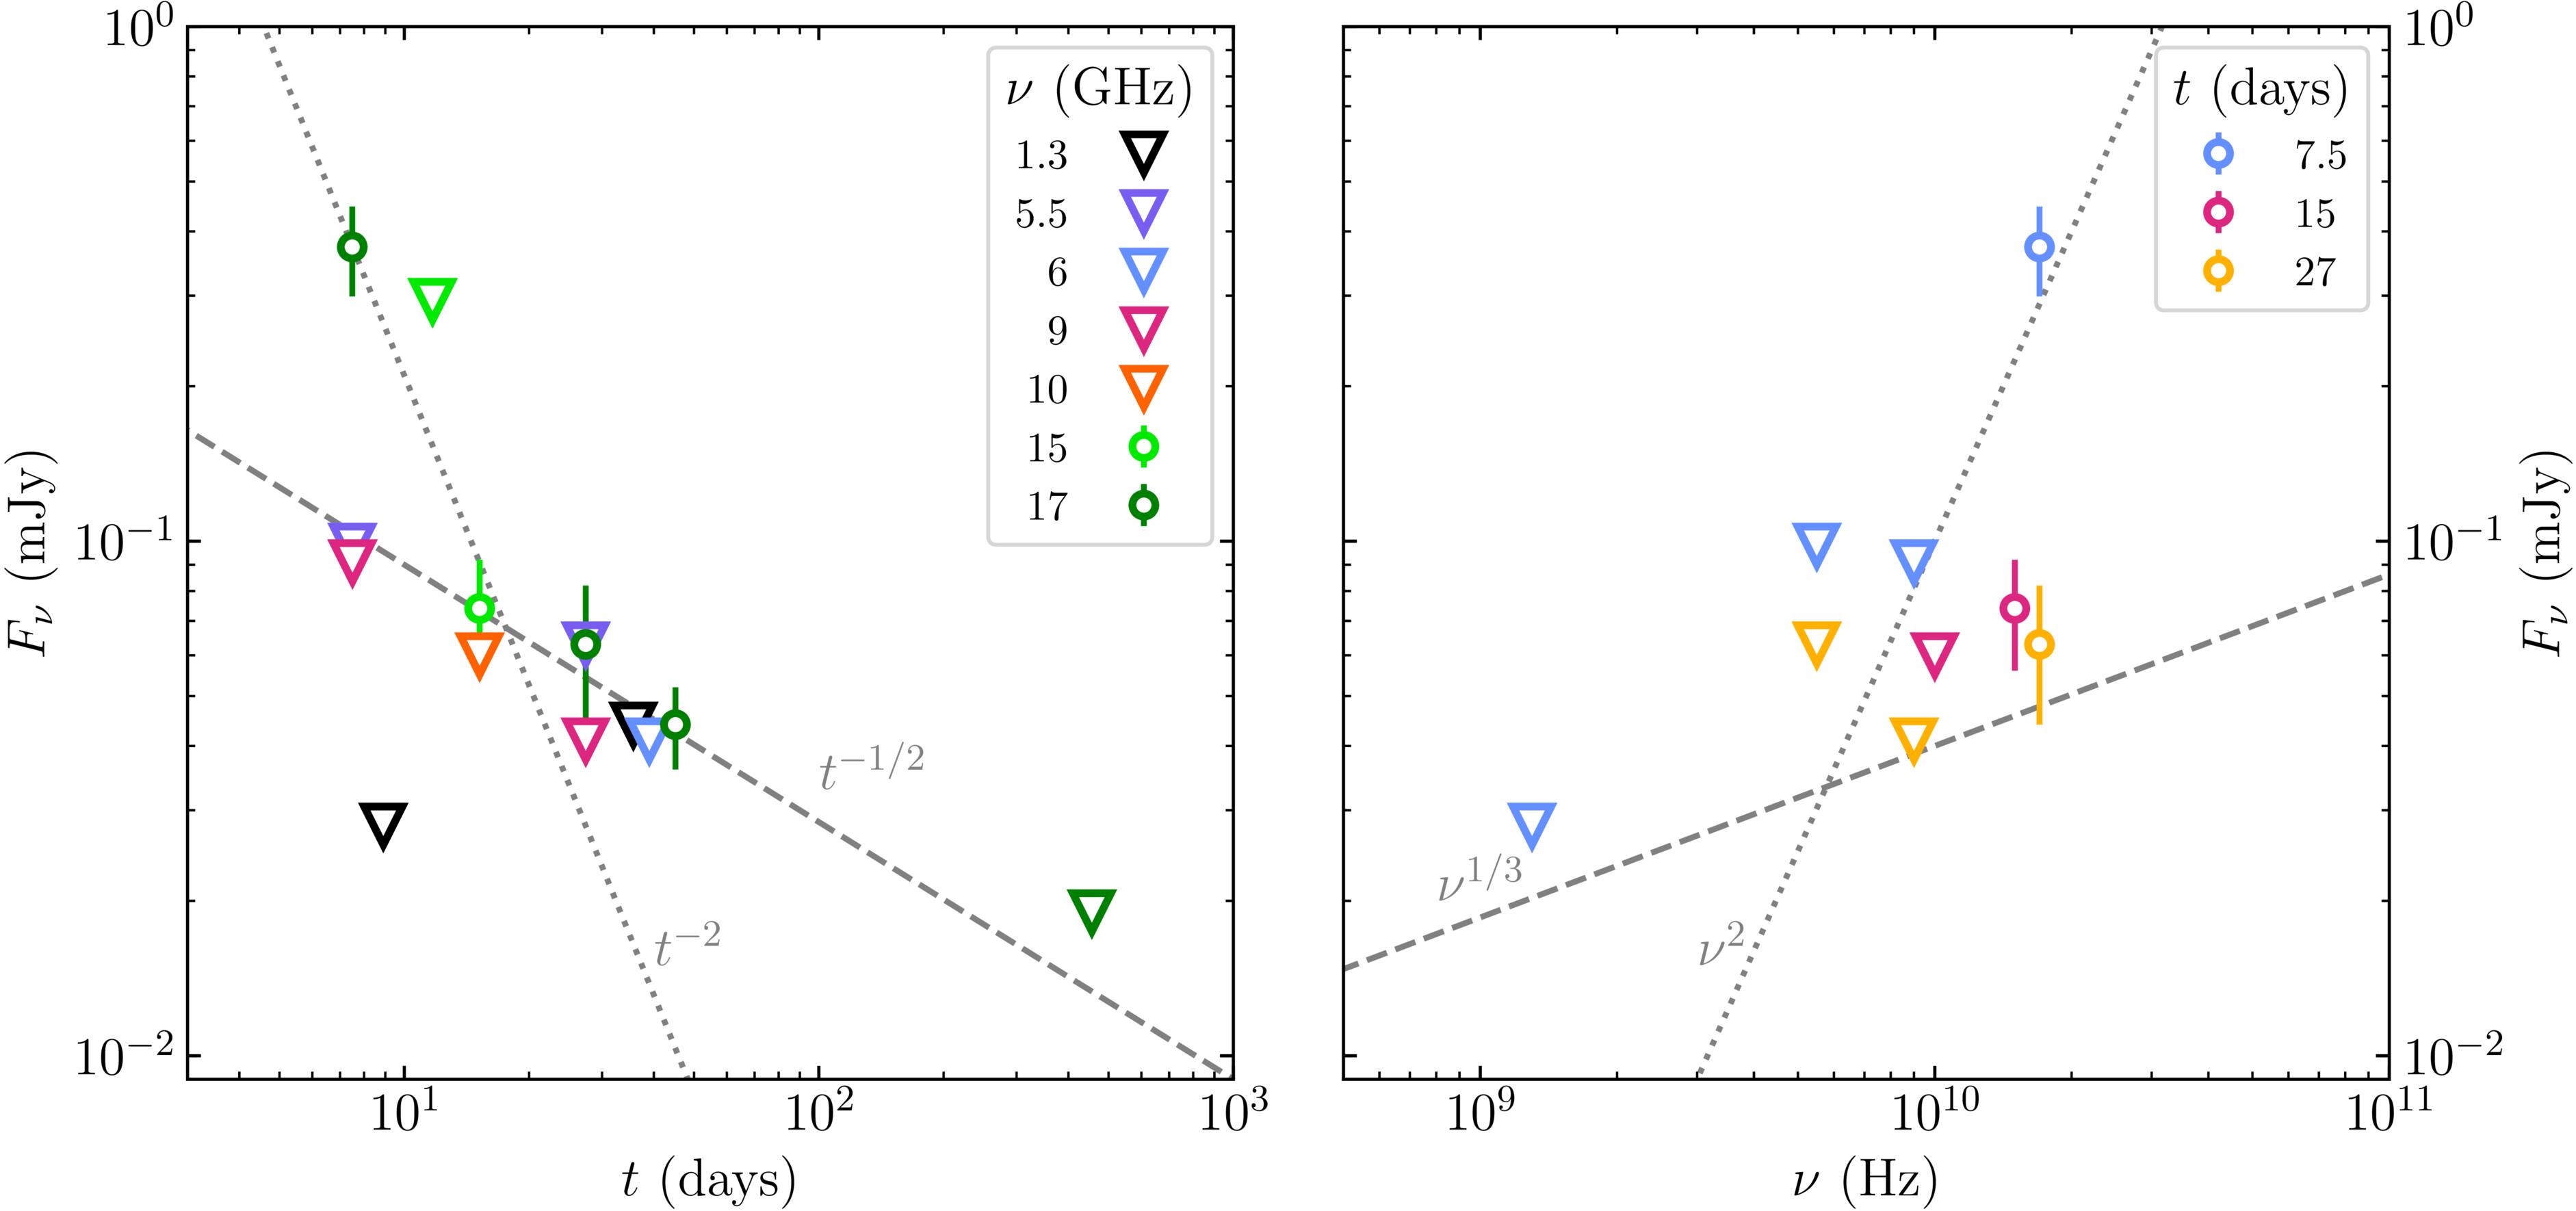
Figure 4. Left: radio light curves for GRB 220627A. Radio detections are represented with circular markers. The 3σ upper limits, represented using downward-pointing triangular markers, are used for all nondetections, with the exception of the VLBA observation (t = 11.7 days, ν = 15.2 GHz), where a 5σ upper limit is used instead. The gray dotted and dashed lines show a t−2 and a t−1/2 slope, respectively, for reference. Right: radio spectra for GRB 220627A. The plot shows different spectral snapshots centered around three different times as indicated in the legend. Markers carry the same meaning as those in the light-curves plot. The gray dotted and dashed lines show a ν2 and a ν1/3 slope, respectively, for reference.
Download figure:
Standard image High-resolution image4.2.2. Comparison to the Afterglow Model of S. de Wet et al. (2023)
Previously, S. de Wet et al. (2023, DW23 hereafter) presented a best-fit model for the afterglow of GRB 220627A. Specifically, they used the ScaleFit software package (G. Ryan et al. 2015) to model a set of X-ray, optical, and radio afterglow data (their radio data points are a preliminary subset of what we present in this paper). Overall, their modeling favored a homogeneous circumburst medium and converged to the following afterglow model parameters: slope of the electron energy distribution  , the isotropic-equivalent kinetic energy of the outflow
  erg, circumburst medium density
  cm−3, the microphysical shock parameters relating to the fractional internal energy in accelerated electrons and magnetic fields

 and
and  ×10−3, jet half-opening angle
  , and host galaxy extinction AV,host = 0.09 ± 0.03 mag.
In Figure 5, we plot the radio data from Table 1, optical data from DW23, and the X-ray data from the Swift Burst Analyzer33 (P. A. Evans et al. 2010). Also shown are model light curves and spectra obtained with BOXFIT34 v. 2.0 (H. van Eerten et al. 2012), with the same parameters as the best-fit model of DW23.
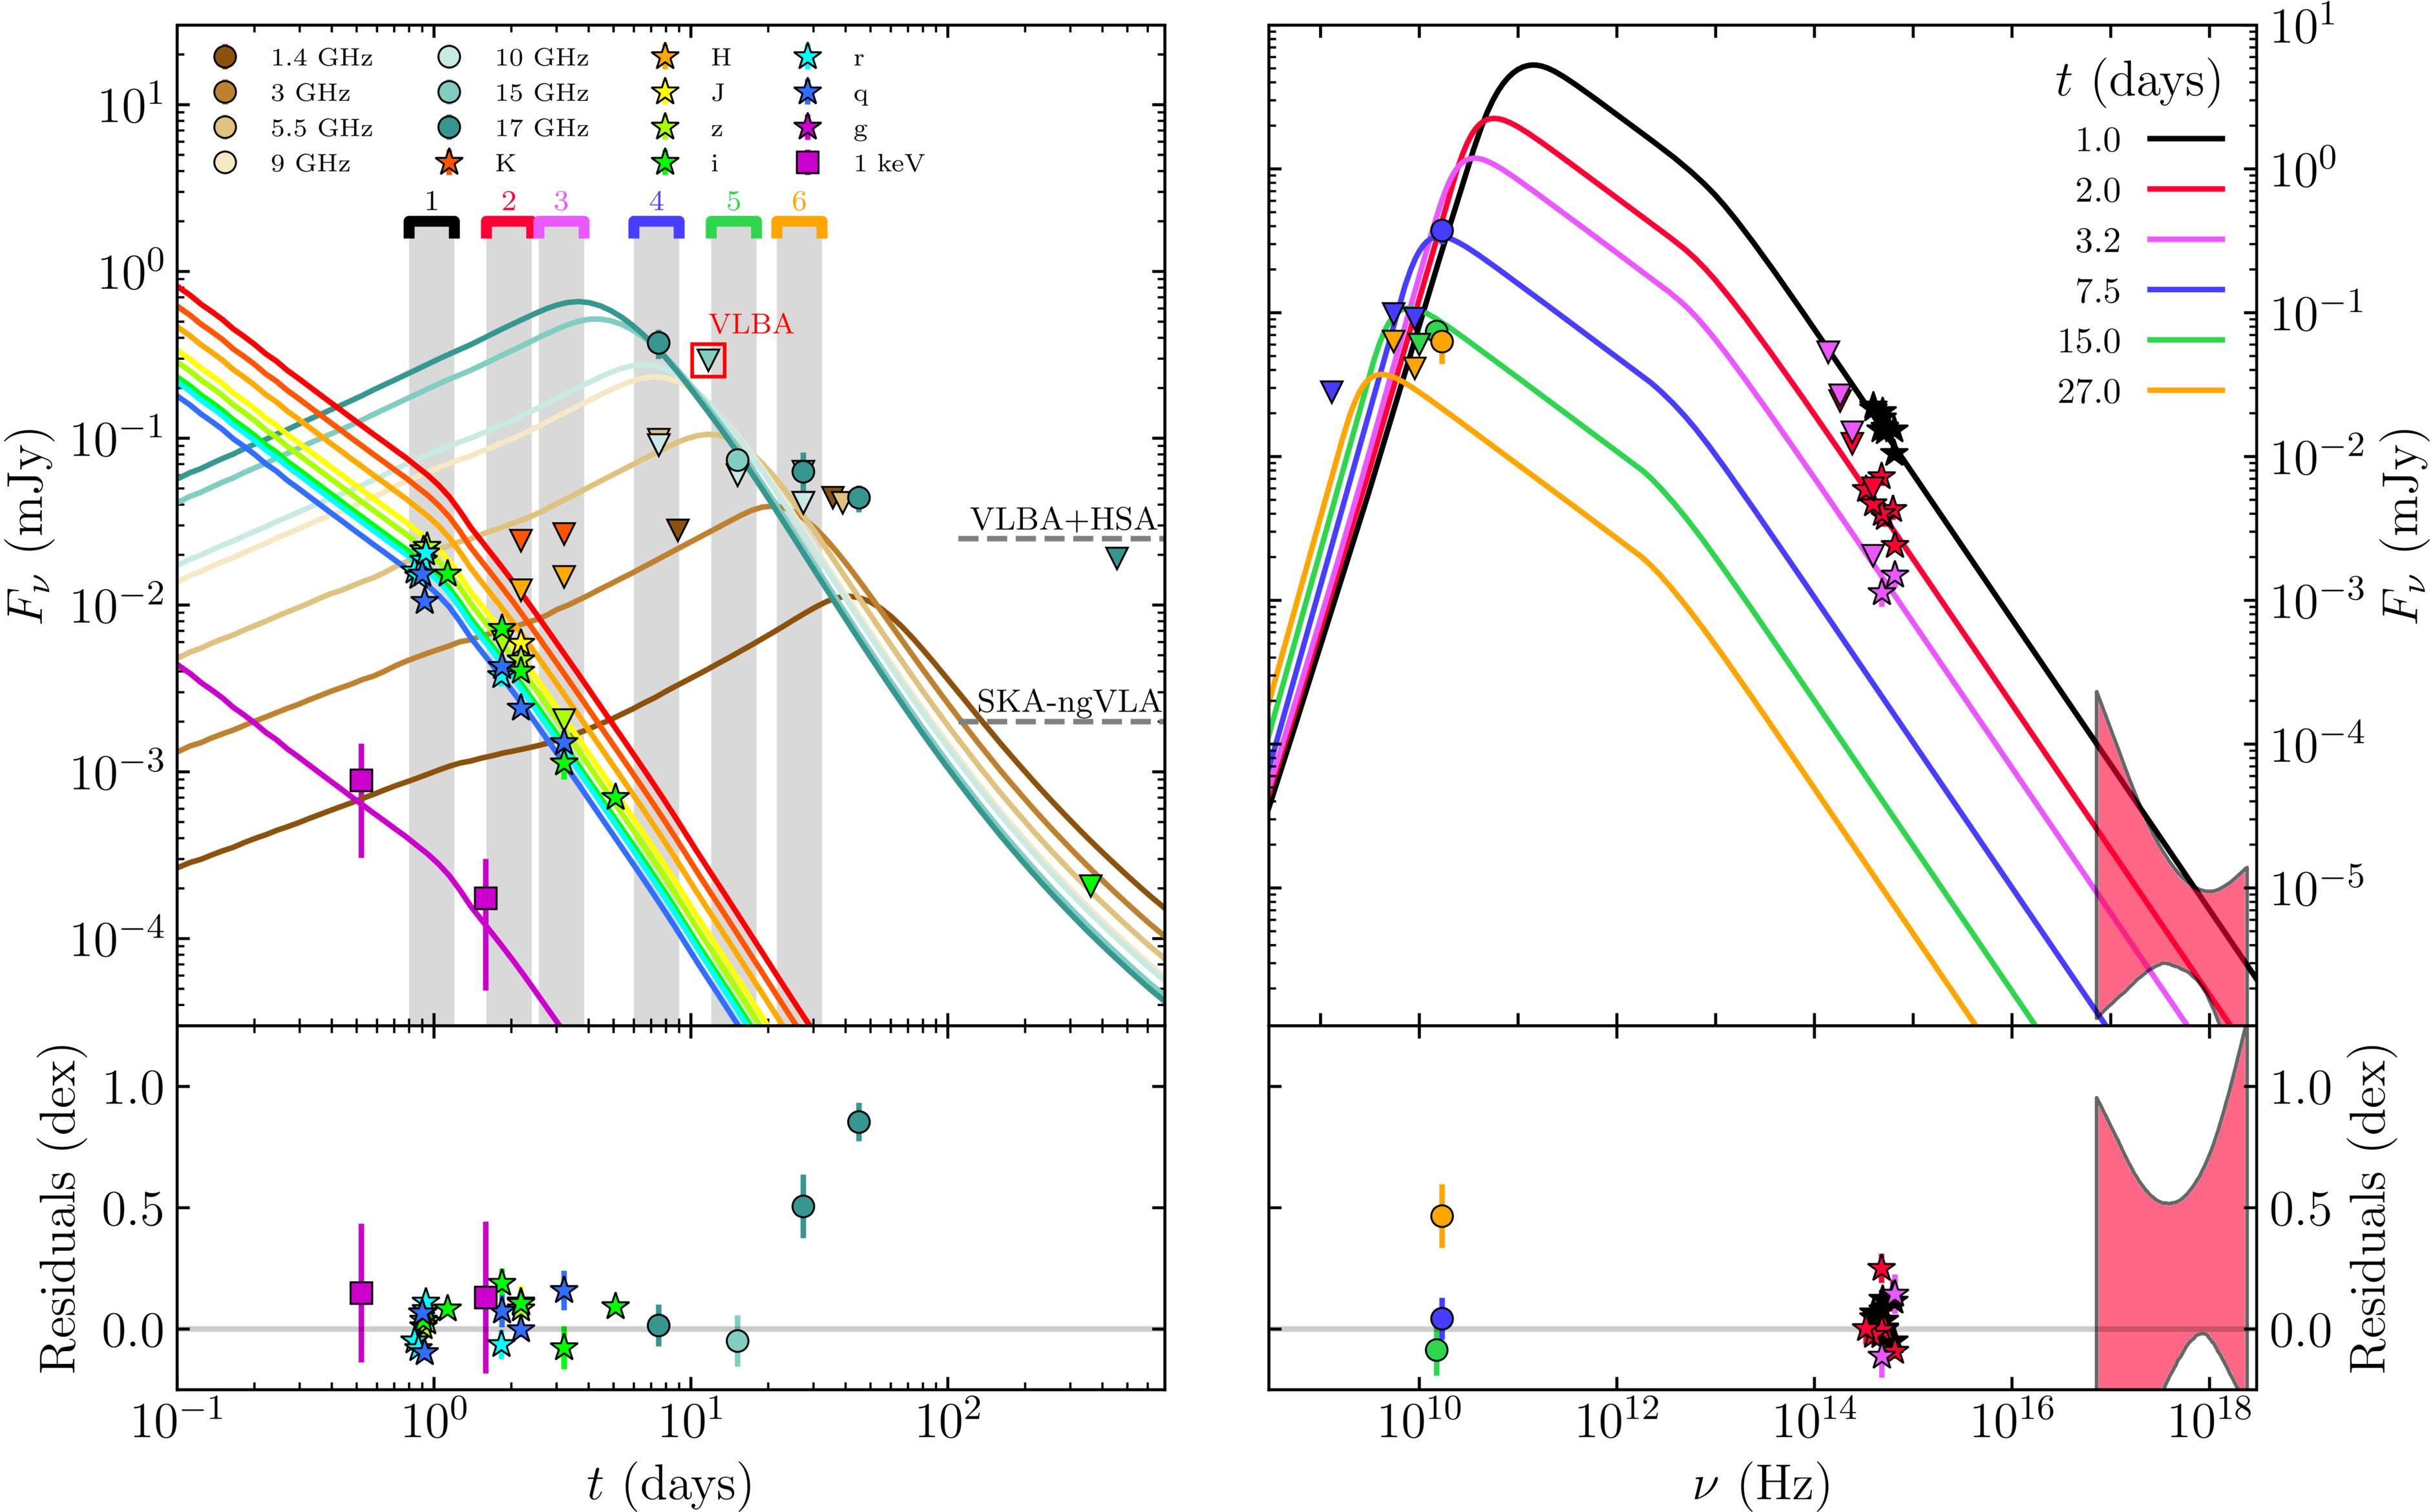
Figure 5. Left: multiwavelength light curves for GRB 220627A and forward shock synchrotron model from DW23. The radio data points are represented with circular markers, the near-infrared and optical data points with star markers, and the X-ray data points with square markers. The 3σ upper limits, represented using downward-pointing triangular markers, are used for all nondetections, with the exception of the VLBA observation (highlighted with a red square), where a 5σ upper limit is used instead. The dashed lines represent the 5σ sensitivity thresholds expected for the VLBA+HSA and SKA-VLBI/ngVLA-LBA arrays (in 10 and 1 hr of integration, respectively). Right: multiwavelength SED snapshots for GRB 220627A, from radio frequencies through to X-ray energies. The plot shows different spectral snapshots of the afterglow centered around six different times as indicated in the legend. The temporal window for data points included in each SED snapshot is indicated by the shaded vertical bands in the light-curve plot. Markers in the SED snapshots plot carry the same meaning as those in the light-curves plot. The residual plots on the bottom, showing the difference between the data and the model for all detections in logarithmic space, highlight the discrepancy between the shallow radio evolution after 15 days postburst and the synchrotron model from DW23.
Download figure:
Standard image High-resolution imageOur 7.5 days radio spectrum (epoch 4 in Figure 5) is in tension with the predictions from the DW23 model, which overpredicts the flux density at 10 GHz by at least a factor of ∼2 at this time. Moreover, the temporal evolution revealed by our 15–17 GHz observations does not match that predicted by the model: the relatively early jet break in the DW23 model causes the radio light curve to drop steeply as Fν ∝ t−p (where p = 2.0 in their model) after ∼5–7 days (corresponding to the time in their model after which both the injection frequency, νm, and the self-absorption frequency, νa, cross the observing band). While this is consistent with the observed decay between 7.5 and 15 days, the subsequent flatter evolution remains unexplained. We note that we found a similar disagreement also with the alternative model presented in Appendix A of DW23, which assumes a wind-like external medium.
Given that the flux density at 17 GHz is seen to vary, with a decay at least as steep as Fν ∝ t−1/2 from 27 to 445 days (see Figure 4, left), and given the positive spectral slope implied by our upper limits at lower frequency, we can exclude that the excess emission with respect to the DW23 model is due to star formation in the host galaxy.
In addition, at least two of our upper limits below 17 GHz (at 7.5 and 15 days) are inconsistent with the DW23 model. However, given the good match between the model and higher-frequency observations at these epochs, a possible explanation of such an inconsistency could be traced back to the simplified description of the electron population in the afterglow model: the energy distribution of electrons in GRB afterglow models (e.g., R. Sari et al. 1998; A. Panaitescu & P. Kumar 2000; H. van Eerten et al. 2012) is described as a nonthermal power law, but physically we expect a lower-energy thermal population to be present in these relativistic outflows (e.g., D. Giannios & A. Spitkovsky 2009; L. Sironi et al. 2013; D. C. Warren et al. 2017; H.-X. Gao et al. 2024; L. Rhodes et al. 2025). Even in the case in which the latter electrons constitute a nondominant fraction over the total, with a negligible contribution to the radiated power, they could still affect the low-energy spectrum by increasing the self-absorption optical depth (D. Eichler & E. Waxman 2005; S. M. Ressler & T. Laskar 2017; D. C. Warren et al. 2018, 2022; B. Margalit & E. Quataert 2021, 2024). For that reason, we do not consider these inconsistencies as severe.
4.2.3. Explaining the Shallow Radio Decay
We discuss below three scenarios that can explain the shallow decay observed in radio at t > 15 days. For each scenario, we describe the modeling choices and the implications on our understanding of the source.
Energy injection from an additional, slower ejecta component. The decay of the radio light curve could become shallower due to the energy injection occurring when a slower ejecta component catches up to the external shock (A. Panaitescu et al. 1998; R. Sari & P. Mészáros 2000). First, we can estimate the Lorentz factor of such ejecta for the collision to happen at an observed time tcoll ∼ 15 days, assuming a similar ejection time as the main ejecta that caused the peak of the afterglow emission. Assuming the dynamics of the blast wave to be described, before the collision, by the R. D. Blandford & C. F. McKee (1976) self-similar solution in a homogeneous external medium, at an observer time t the part of the blast wave closest to the observer is located (R. Sari et al. 1998) at a radius  from the central engine, where mp here is the proton mass. The radius of the slower ejecta component is instead
  . Equating these two radii and setting t = tcoll, we obtain the required ejecta Lorentz factor:
In words, ejecta as fast as Γsl−ej ∼ 10 catch up with the blast wave at as late as t ∼ 15 days. We describe the energy injection as an increase in the isotropic-equivalent blast wave energy with observer time35
at t > tcoll, parameterized as  . This modifies the blast wave Lorentz factor evolution such that the shock downstream Lorentz factor scales as Γ(t) ∝ t(4δ−3)/8 and the blast wave radius as r ∝ t(δ+1)/4. In the post-jet-break phase, neglecting sideways expansion of the shock and focusing on the νa, νm < ν < νc spectral regime, the flux density is proportional to Fν ∝ Γ2(p+1)r3, which leads to a light-curve scaling Fν ∝ t((7+4p)δ−3p)/4. With p ∼ 2, a scaling Fν ∝ t−1/2 can be reproduced by setting δ ∼ 4/15 ≈ 0.27. This scaling is expected (A. Panaitescu et al. 1998; R. Sari & P. Mészáros 2000; B. Zhang et al. 2006) if the slow ejecta features a velocity profile such that its mass above a Lorentz factor Γ is M( > Γ) ∝ Γ−s with s = (7δ + 3)/(3–δ) ∼ 73/41 ≈ 1.8. Since the observer time increases fourfold during the shallow decay phase, the energy increase due to injection is just ∼44/15 ≈ 145%.
These calculations show that a relatively slow shell ejected shortly after the main ejecta and containing about half as much energy could produce the observed flattening in the radio light curve. The presence of a tail of slower ejecta carrying a substantial energy is a common expectation from the unsteady central engines behind leading GRB jet prompt emission scenarios, such as the internal shocks scenario (M. J. Rees & P. Meszaros 1994) and the internal-collision-induced magnetic reconnection and turbulence (ICMART; B. Zhang & H. Yan 2011) scenario. Unfortunately, model predictions are not yet sufficiently detailed as to answer the question whether the requirements found here are easily satisfied in a typical central engine.
Changing external density profile. The flattening in the radio light-curve decay could stem from a steepening in the external density profile, which could signal, for example, the fact that the blast wave is emerging from the molecular cloud where the progenitor has formed. Assuming the external density to scale as n ∝ r−k, the Lorentz factor in the shock downstream then evolves (R. D. Blandford & C. F. McKee 1976) as Γ ∝ r−(3−k)/2. In terms of observer-frame time, we then have r ∝ t1/(4−k) and Γ ∝ t−(3−k)/2(4+k). In the post-jet-break phase the flux density evolves as Fν ∝ Γ2(p+1)r3−k (the 3 − k exponent here reflects the slower increase in the number of shocked electrons with radius when k > 0), so that Fν ∝ t−(3−k)p/(4−k). This shows that the t−1/2 decay can be reproduced, assuming p ∼ 2, if the external density decreases with a slope k = (6p − 4)/(2p − 1) ∼ 8/3.
An additional, wider ejecta component. As an alternative scenario, we consider the possibility of a wider and slower component in the ejecta, on top of the fast and narrow component whose afterglow emission is described by the DW23 model. These ejecta decelerate at a larger radius with respect to the narrow jet, enhancing the observed radio flux density. We model the dynamics and emission of such an additional component following A. Panaitescu & P. Kumar (2000), including the ejecta coasting phase, the transrelativistic deceleration of the blast wave, the effect of synchrotron self-absorption on the emission (but still neglecting thermal electrons), and photon propagation effects. In Figure 6, we show the model light curve obtained by adding the flux densities predicted by such a model to those of the DW23 model, keeping the microphysical parameters fixed to values similar36
to DW23, that is, e = 0.076,
B = 4.6 × 10⁻³, and p = 2.02. The wide jet component is assigned an isotropic-equivalent energy Eiso,w = 3 × 1053 erg, an initial bulk Lorentz factor Γ0,w = 3, and a half-opening angle θj,w = 15°. Its collimation-corrected energy is therefore
 erg. For comparison, the narrow DW23 jet has Eiso = 9 × 1053 erg and θj = 4.5° (and a formally infinite initial bulk Lorentz factor), hence a collimation-corrected energy of
  erg. The addition of the wide component therefore increases the energy budget by about a factor of 4. The inclusion of this wider component leads to a clear improvement in the modeling of the late flattening in the radio light curves, as shown in the comparisons of the residuals in Figures 5 and 6.
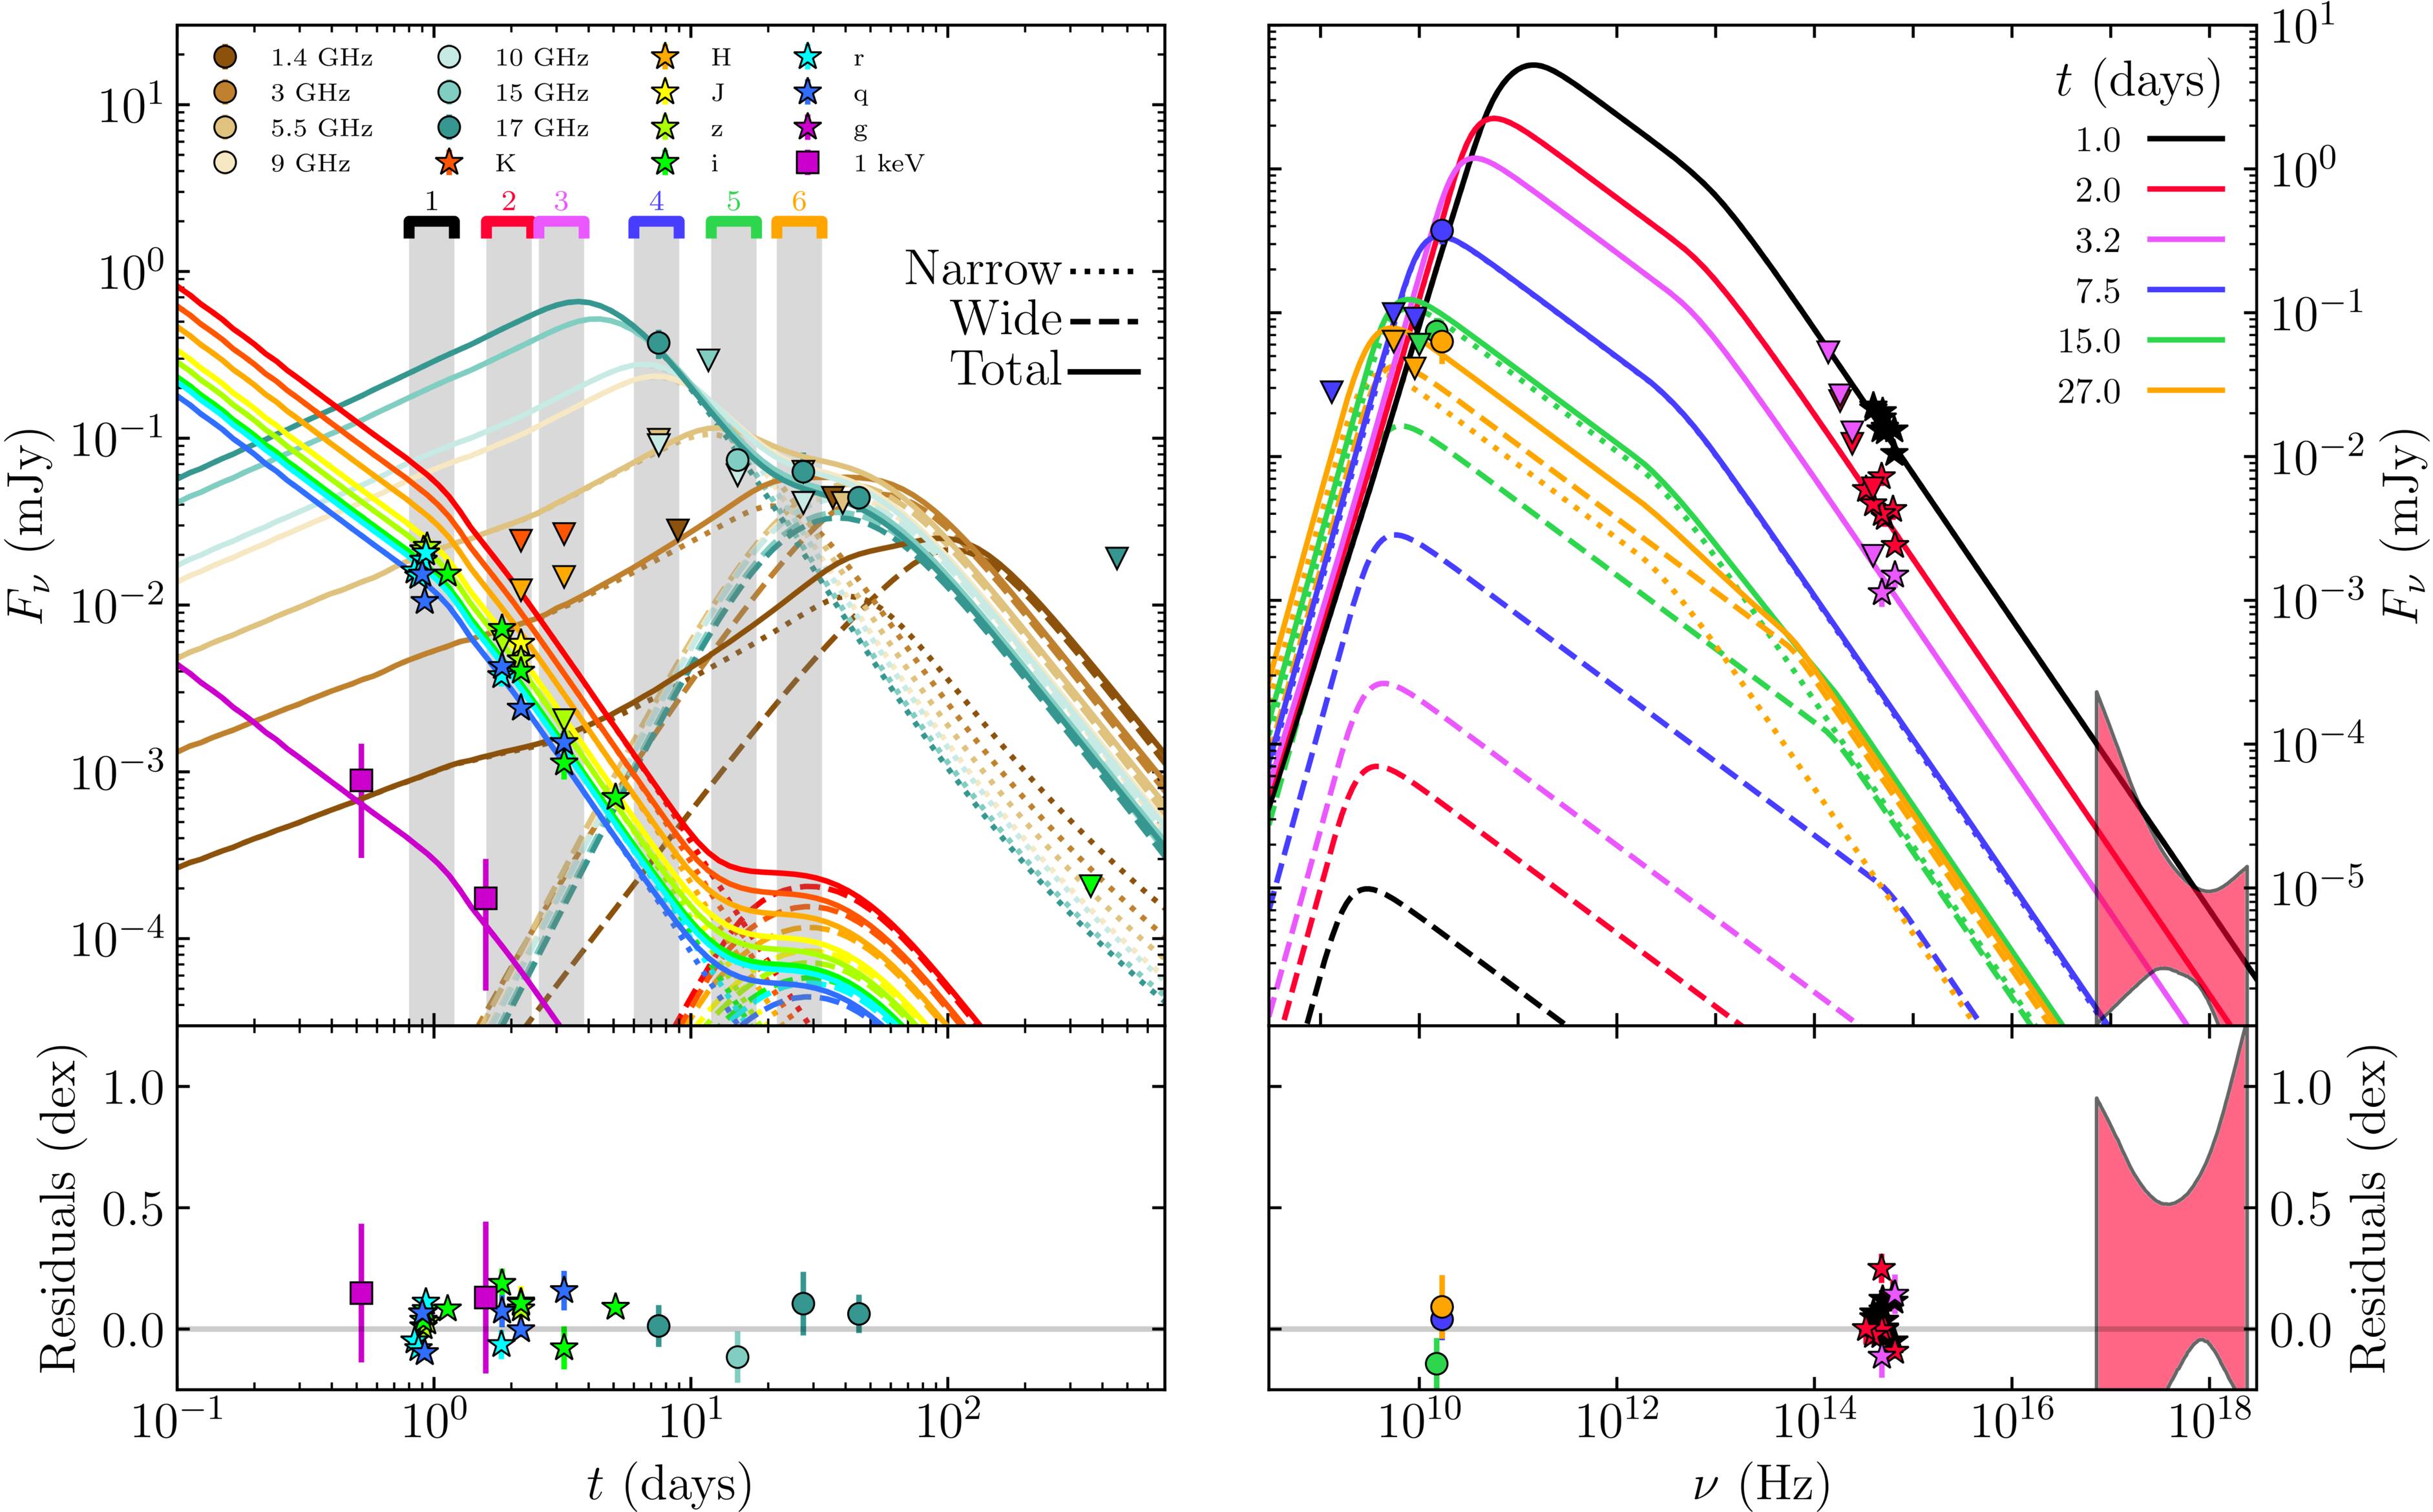
Figure 6. Model with additional wider jet component better explains the shallow radio evolution observed in the afterglow after 15 days postburst. The fast, narrow jet model of DW23 features an isotropic-equivalent energy Eiso = 9 × 1053 erg and a half-opening angle θj = 4.5°. The additional wide jet component has Eiso,w = 3 × 1053 erg, θj,w = 15°, and an initial bulk Lorentz factor Γ0,w = 3. The shock microphysical parameters are the same for the two components, namely e = 0.076,
B = 4.6 × 10⁻³, and p = 2.02.
Download figure:
Standard image High-resolution imageThe presence of a slow, wide ejecta component that carries a similar (or even somewhat larger) collimation-corrected energy as the inner, narrow jet is expected in the case where the jet spends a large fraction of its total energy in breaking out of the progenitor star (C. D. Matzner 2003; O. Bromberg et al. 2011; R. Harrison et al. 2018; O. Gottlieb et al. 2021). In such a scenario, the energy is channeled to a hot cocoon that shrouds the jet during the propagation. After the jet breakout, the cocoon blows out producing a slow, wide ejecta component (O. S. Salafia & G. Ghirlanda 2022), which could explain the scenario behind our proposed modeling. For the cocoon to contain a large fraction of the total energy, the jet head must have propagated at a Newtonian velocity for most of its journey through the progenitor envelope (C. D. Matzner 2003; O. Bromberg et al. 2011; O. Gottlieb et al. 2021; O. S. Salafia & G. Ghirlanda 2022). In such a regime, the time for the jet head to break out can be estimated based on the numerically calibrated model of R. Harrison et al. (2018, their Equation (16)), which gives a breakout time (relative to the birth time of the jet):

where Etot,52 is the total energy in the ejecta (narrow plus wide) in units of 1052 erg, T3 is the total jet duration in units of 1000 s,  is the half-opening angle of the jet at its base (i.e., at launch, before propagating through the stellar envelope) in units of 10°, R11 is the stellar radius in units of 1011 cm, and M10 is the stellar mass in units of 10 M⊙.
In this regime, the energy in the cocoon (and hence in the wide ejecta) is approximately Ew ∼ Etottbkt/T. The total jet duration T can be estimated as the sum of the breakout time plus the GRB duration, T ∼ tbkt + T90/(1 + z). Using Etot = E + Ew, these relations yield:
and
Here we used Ew and E from the proposed modeling and T90 ∼ 1100 s from DW23, and we kept the initial half-opening angle at 10° (the jet is then expected to be collimated during propagation; see, e.g., O. Bromberg et al. 2011, O. S. Salafia & G. Ghirlanda 2022). If indeed the wide component in our proposed modeling originates from a cocoon, the long jet duration and large stellar radius obtained from these arguments are then consistent with expectations for the blue supergiant progenitor scenario proposed for ultralong GRBs (e.g., B. Gendre et al. 2013; K. Ioka et al. 2016; R. Perna et al. 2018). In particular, we note that typical Wolf–Rayet stars have radii of only ∼1 R⊙ compared to tens to a few hundreds of solar radii for blue supergiants. This is similar to the conclusion reached by L. Piro et al. (2014) in their study of ultralong GRB 130925A (with gamma-ray activity lasting for at least ∼7 ks); they found evidence for the presence of a hot cocoon that supported the blue supergiant progenitor scenario. More recently, by conducting simulations of evolutionary pathways for different possible progenitor scenarios, the findings in A. K. Ror et al. (2024) similarly support blue supergiant stars as a plausible progenitor for ultralong GRBs, including GRB 221009A, which was the focus of their work.
4.3. Testing the GRB 220627A Lensing Scenario with VLBI: Proof of Concept and Future Prospects
The aim of our VLBA experiment was to provide a test of the lensing scenario for GRB 220627A that was independent of the conclusions drawn from the analysis of the high-energy spectra (see Section 4.1; see also Y.-Y. Huang et al. 2022). From the light-curve evolution shown in Figure 6 (left), we estimate the unresolved flux density at the time and frequency of our VLBA observation (15 GHz, 11.7 days postburst) to be ∼150 μJy. This suggests that in the ultralong GRB (nonlensing) scenario, we should expect a compact radio source at ∼150 μJy, and in the lensing scenario two compact sources at even dimmer flux-density levels of ∼40 and ∼110 μJy (as determined by their gamma-ray fluence brightness ratio r ≈ 3).
Our VLBA observations yielded a nondetection down to a 5σ limit of ∼0.3 mJy beam.−1. Within the uncertainty region of lower-resolution optical and radio detections (see Section 3.4), there were a few noise peaks exceeding the 3σ level, but none above the 5σ level. This means we were unable to claim a detection or a nondetection of an afterglow source (or any source) at the ∼0.3 mJy level; the lensing and ultralong GRB scenarios could not be distinguished, so our VLBI experiment yielded a nonconclusive result.
This experiment was the first time VLBI was used to search for the multiple images of a candidate strongly gravitationally lensed GRB afterglow. The only lensed GRB candidate that had VLBI follow-up prior to this event was GRB 200716C (S. Giarratana et al. 2023). For that event, as the afterglow had faded by the time of the observation, the European VLBI Network (EVN) and e-Merlin were used to search the candidate host galaxy for a possible IMBH that could act as the lens, rather than directly for the multiple images of the afterglow. Their nondetection (5σ upper limit of <50 μJy beam−1) also yielded an inconclusive result, unable to confirm the presence of a possible IMBH lens in the candidate host galaxy. These results highlight the difficulty of such an experiment and the need for improvements in future programs. Below, we evaluate the outcomes of our VLBI campaign for GRB 220627A and discuss the possible improvements that can be implemented in the areas of angular resolution, sensitivity, and trigger timing (including real-time correlation capabilities).
4.3.1. Angular Resolution: Probing Different Lens Configurations
Our resulting VLBA image had a synthesized beam size of 0.49 mas × 1.51 mas. In Figure 7, we show the expected Einstein radius for GRB 220627A in the lensing scenario as a function of the lens redshift, calculated using Equations (1) and (2), compared to our major-axis beam size. With the major-axis beam size being smaller than the expected Einstein radius out to z ≈ 2.8 (n.b., zGRB = 3.084), our VLBA observations had sufficient angular resolution to resolve the lensed images for much of the lens redshift parameter space. As an intervening absorber was identified at z = 2.665 via the presence of S iv, S ii, C iv, Fe ii, and Al ii lines in the optical spectrum (L. Izzo et al. 2022; S. de Wet et al. 2023), we considered this system the likely location of the lens during our radio campaign. At this redshift, the Einstein radius would be θE ≈ 1.8 mas, so the two distinct lensed images of the afterglow (in the lensing scenario) would have been resolved by our VLBA observations. However, in the extreme scenarios, where the lens redshift is greater than zL ≈ 2.8, the lensed images may be unresolved. In this scenario—if detected—the lensed event could potentially still be confirmed by modeling a multicomponent source, but this may be at the expense of accuracy in both the astrometry and source structure, which are critical for modeling of the lens (and by extension, time-delay cosmography).
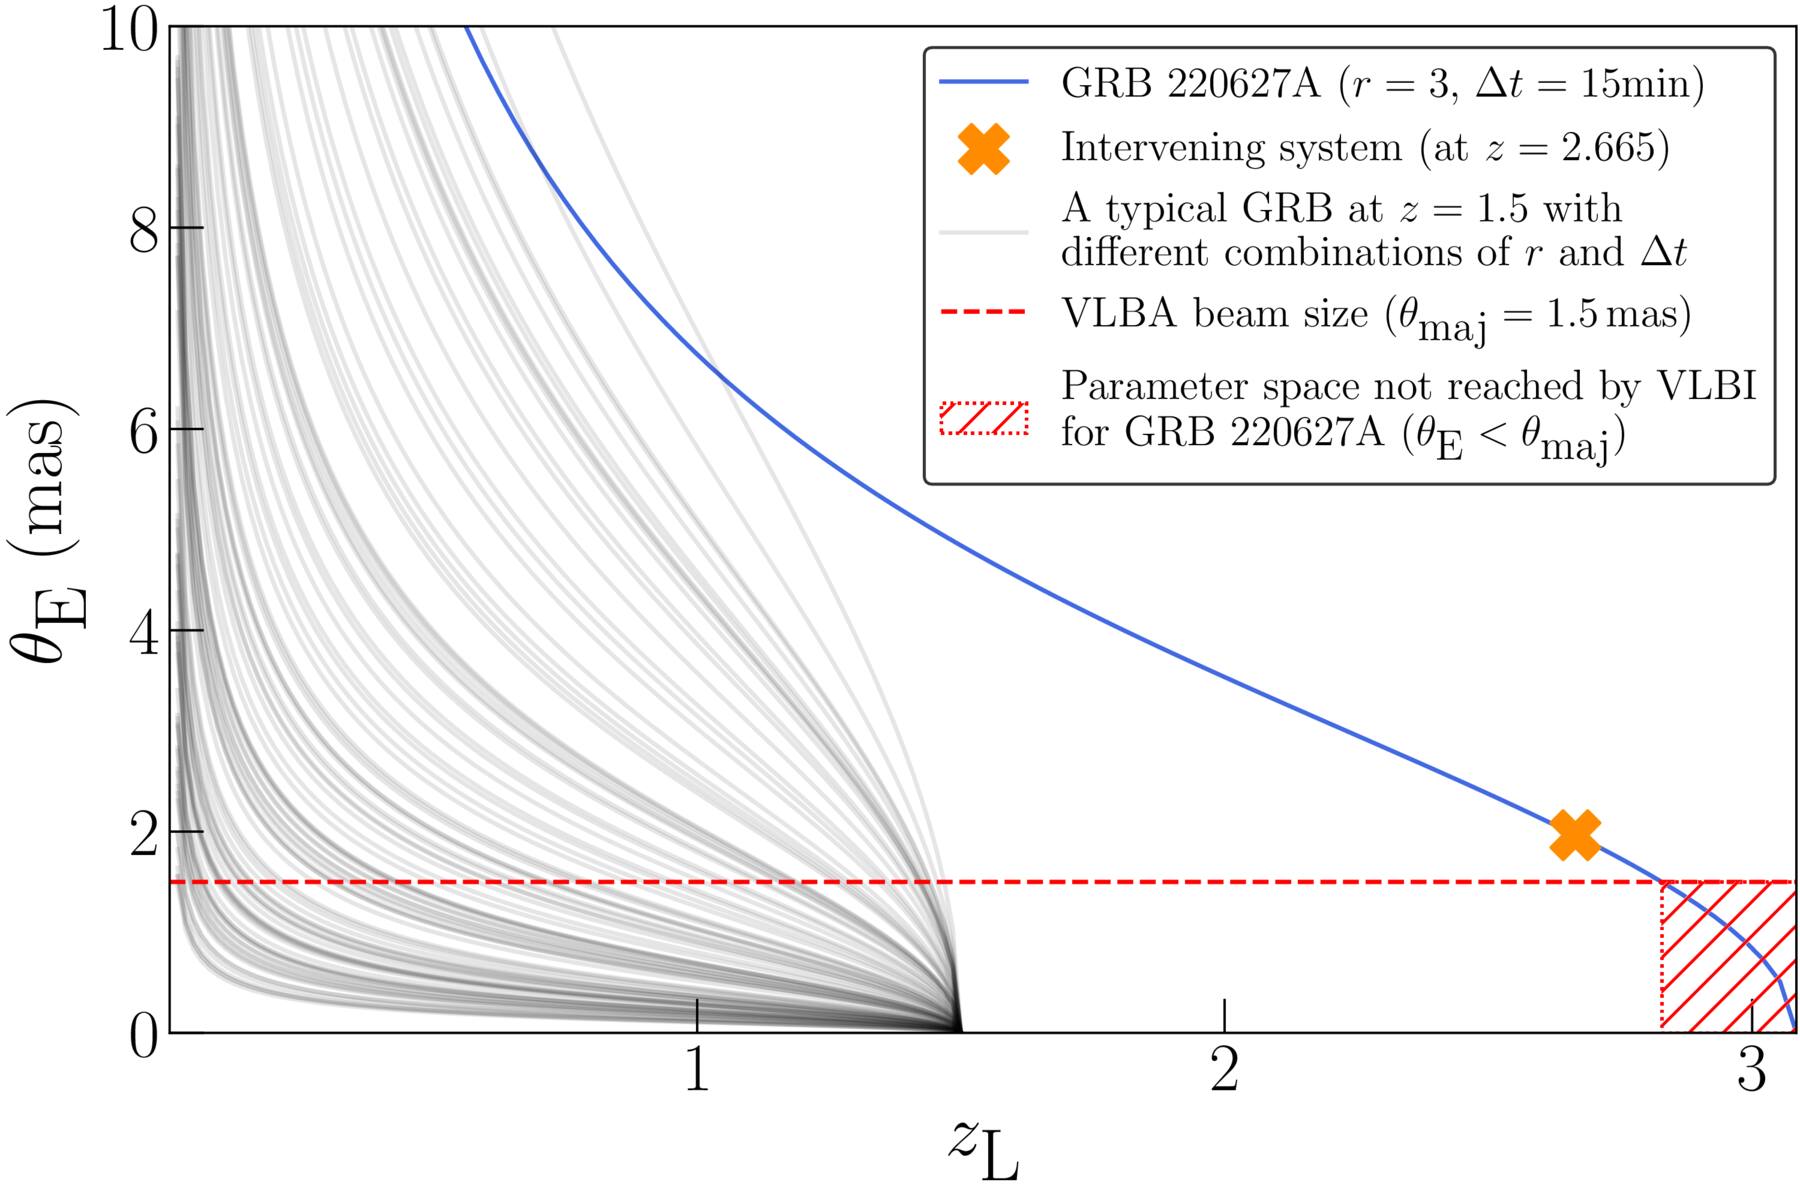
Figure 7. The Einstein radius θE as a function of the lens redshift zL for GRB 220627A is represented by the blue solid line. The expected Einstein radius for a lens located at the redshift z = 2.665, which was the redshift of the intervening system identified in the optical spectrum (L. Izzo et al. 2022; S. de Wet et al. 2023), is plotted with an orange starred marker. These are compared against our VLBA major-axis beam size θmaj represented here by the red dashed line. The part of the parameter space that cannot be probed by the angular limit of our observation is shown by the red hatched region. The Einstein radius as a function of lens redshift for a typical GRB at redshift z = 1.5, given different, random (but possible) combinations of brightness ratios r and time delays Δt are also shown using gray solid lines.
Download figure:
Standard image High-resolution imageIn Figure 7 we also plot 100 possible Einstein radii functions (i.e., as Einstein radius as a function of lens redshift) for a typical GRB at redshift z = 1.5 (the redshift where star formation and long GRB production is expected to be dominant). Each different Einstein radius function is produced by assuming different, random combinations of brightness ratio (selected from 1.1 < r < 5.0) and time delay (selected from 0.6 s < Δt < 1000 s) for the z = 1.5 GRB; the range chosen for these two variables reflects the observed range of values in previous claims of lensed GRB candidates. It is clear from this plot that the specific angular resolution required to test the lensing hypothesis for future candidates will be quite different depending on the lens configuration; nonetheless, for a large portion of such configurations, the milliarcsecond scales probed by VLBI will be very useful for testing the lensing hypothesis.
Future improvements to the program should include the optionality to add longer baselines to the array, thereby improving the resolution; for example, adding EVN telescopes like Effelsberg to the VLBA to improve east–west (u, v) coverage, or similarly, adding the East Asia VLBI Array to the Long Baseline Array (LBA) in Australia to improve north–south (u, v) coverage.
4.3.2. Sensitivity: Improvements with Current and Future Arrays
The more critical aspect for the GRB 220627A VLBI experiment is the sensitivity, as this was the limiting factor that led to the nonconclusive outcome. Two factors in particular need to be considered: the instrumentation and the brightness ratio in the scenario where the lensed images can be resolved. As shown in Section 4.2 (and in Figure 6, right), the radio spectrum below ∼15 GHz was self-absorbed. This meant that the LBA could not be triggered, despite its advantageous geographic position—GRB 220627A is located at a declination of −32°, while most LBA stations are located between a latitude of −30° and −40°—because its optimal observing frequency is centered at 8.4 GHz, above which their receivers are significantly less sensitive. The VLBA was well equipped to observe at 15 GHz, but for our scenario the observations were hindered by shorter integration times (with the source above the horizon for ∼6 hr per day; see ∼14 hr day−1 for the LBA) and higher levels of tropospheric opacity (<30° elevation through the entire observation for most antennas due to the low declination). The resulting image reached an rms sensitivity of 51 μJy beam−1 (after combining two consecutive days of observations). This sensitivity, as previously discussed, was insufficient to distinguish between the lensing and ultralong GRB scenarios (as it does not reach the sensitivity level required to make a detection of the unresolved afterglow). With a lensing brightness ratio r ≈ 3, the sensitivity requirements in the lensing scenario for detecting both lensed images would be at least 4 times more severe than those required for only detecting the unresolved (and magnified) afterglow. With a more typical r ≈ 2 from previous claims of GRB lensing candidates, the sensitivity requirements in the lensing scenario would then only be approximately 3 times more severe compared to the nonlensing scenario.
Our program to confirm and study the properties of lensed GRB afterglows with VLBI serves as a pathfinder project for the Square Kilometre Array (SKA)/ngVLA era of radio astronomy. While the program today is quite sensitivity limited, VLBI with the SKA is expected to reach rms sensitivities of ∼3 μJy beam−1 in 1 hr of integration for SKA1 and ∼0.05 μJy beam−1 for SKA2 (e.g., Z. Paragi et al. 2015). Similarly, VLBI with the ngVLA Large Baseline Array (ngVLA-LBA) is expected to reach rms sensitivities of ∼0.4 μJy beam−1 in 1 hr of integration (R. J. Selina et al. 2018). With this level of sensitivity, the SKA/ngVLA era VLBI arrays should be able to make strong detections of the lensed images for the majority of GRBs regardless of their redshift, even if their afterglows are self-absorbed at the observing frequency (see Figure 2 in J. K. Leung et al. 2021). However, since the SKA and ngVLA telescopes will not be operating until later this decade at the earliest, our pathfinder program needs other ways to improve instrumental sensitivity in the future triggers to successfully achieve its science goals. The main method for achieving this would be to ensure the trigger proposals have the option to add high-sensitivity telescopes to the array when the sensitivity requires it. For example, for GRB 220627A, if the observations had included the High Sensitivity Array (HSA), consisting of the Green Bank Telescope and the phased Very Large Array, our observations would have achieved an rms sensitivity37 of ∼5 μJy beam−1. This rms sensitivity would enable ∼8σ and ∼24σ detections of the two resolved lensed images in the lensing scenario, or a ∼32σ detection of an unresolved afterglow in the nonlensing, i.e., the ultralong GRB afterglow, scenario (see Figure 5, left); this would have provided sufficient sensitivity for testing the lensing hypothesis.
4.3.3. Trigger Timing: The Need for Sensitive Real-time Capabilities
Triggering the telescope in a timely manner to catch the flux-density peak is important for maximizing the signal-to-noise ratio of any detection. If a GRB is able to be observed in a timely manner near the radio peak, the typical 10–30 μJy rms sensitivity that the VLBA/LBA is able to achieve in a 10 hr observation without high-sensitivity telescopes in the array is sufficient for detecting the lensing signature for ∼75% of all expected events with a radio-loud counterpart (i.e., those with integrated flux density that reaches down to ∼200 μJy; P. Chandra & D. A. Frail 2012).
In the case of GRB 220627A, we planned to trigger the LBA a day after the ATCA observation if there was a detection at 9 GHz, as the burst was optimally located in the southern sky. However, the afterglow was not detected at 9 GHz as the spectrum was self-absorbed and was instead detected at higher frequencies, which could be observed by the VLBA but not the LBA. Triggering the VLBA required more time, and this led to a four-day delay between the ATCA observation and the high-resolution observation (as opposed to the one-day delay expected from triggering the LBA). The delay corresponded to a ∼200 μJy reduction in flux density, or a 53% reduction in signal-to-noise ratio. This reduction in flux density was also steeper than what we expected due to incomplete multiwavelength information at the beginning of the campaign, leading to a nondetection in our VLBA observations.
Our GRB 220627A campaign therefore emphasizes the requirement for future VLBI programs to have a quick trigger turnaround time as well as the option to include high-sensitivity telescopes in the array, where possible (and needed). As the EVN and LBA are not full-time dedicated VLBI instruments like the VLBA, continuing to ensure sufficient operational flexibility (e.g., operating a subset of the array for VLBI on short notice) is important for these quick trigger turnarounds. We recognize both these observatories are making a strong effort on this front. Additionally, our campaign points to the increasing need for more sensitive e-VLBI (real-time correlation) capabilities, which would have allowed us to adjust our VLBI observing strategy in a subsequent observation occurring even sooner while the afterglow was still detectable by our instruments. Currently, the VLBA38 is limited to a 128 Mbps data recording rate for an e-VLBI setup, which does not provide sufficient sensitivity for extragalactic transient science, while the EVN39 (LBA40 ) is capable of recording at 2 Gbps (512 Mbps) for an e-VLBI setup but is instead limited by the range of frequencies it can observe at. Development of sensitive, responsive (in trigger turnaround and real-time correlation), and flexible (in frequency coverage) VLBI capabilities are therefore needed improvements for transient science, especially in the upcoming SKA/ngVLA era of radio astronomy.
With event rates estimated to be as low as one every three years (M. Oguri 2019), it is critical to ensure these improvements—to angular resolution, sensitivity, and trigger timing (including real-time correlation capabilities)—are made to maximize the science output of a gravitationally lensed GRB event. For example, one successful VLBI campaign for such an event would lead to the first confirmation of a lensed GRB event (also the first millilens), provide a model for the lens, and also provide an estimate for the Hubble parameter, H0. Assuming a typical event with the lensed images observed with an astrometric uncertainty of ∼100 μas, H0 could be obtained to a 10% precision (e.g., Equation (17) in S. Birrer & T. Treu 2019); 20 to 30 such events (inclusive of other non-GRB explosive transients and variables) would enable a similar precision, and with different systematics, to other cosmology experiments (e.g., L. Verde et al. 2019).
5. Conclusions
We conducted a radio campaign to study the afterglow of GRB 220627A, the most distant ultralong GRB discovered to date, at z = 3.084. The prompt gamma-ray light curve of GRB 220627A shows a double-pulse profile, with the pulses separated by a period of quiescence lasting approximately 15 minutes, leading to initial speculation that GRB 220627A may be a gravitationally lensed GRB. Our comparison of the Fermi/GBM spectra at time intervals corresponding to these pulses showed that their spectral properties differed by >5σ from each other; thus, we ruled out the lensing hypothesis and verified the ultralong GRB classification (see also Y.-Y. Huang et al. 2022).
Our radio campaign led to the ATCA discovery of the radio afterglow at 7 days postburst. We continued to monitor it at multiple frequencies until 456 days postburst using the ATCA, MeerKAT, VLBA, and VLA telescopes. We found that there are three scenarios that could explain the observed radio properties, in particular the shallow radio decay (Fν ∝ t−1/2) following the much steeper decay (Fν ∝ t−2): (i) energy injection from an additional, slower ejecta component (with Lorentz factor Γsl−ej ∼ 10) catching up to the external shock; (ii) a stratified density profile going as n ∝ r−8/3; or alternatively, (iii) the presence of a slow, wide ejecta component (with collimation-corrected energy Ew ≈ 1052 erg and a half-opening angle θj,w = 15°) in addition to a fast, narrow ejecta component (with collimation-corrected energy E ≈ 3 × 1051 erg and a half-opening angle θj = 4 5). If we assume the wide component in scenario (iii) to originate from a cocoon, the cocoon properties would point toward a progenitor with a large radius (
 ), which would be consistent with expectations for the blue supergiant progenitor scenario proposed for ultralong GRBs.
While the lensing interpretation for this GRB was already ruled out after a detailed analysis of its high-energy spectra, we carried out VLBI observations as part of our radio campaign in an attempt to provide an independent verification of this conclusion in a way that was free from possible ambiguities from studying the light curves and/or spectra only. The results from our VLBI experiment yielded a nondetection (i.e., an inconclusive result), partly due to insufficient sensitivity and partly due to a fainter-than-expected afterglow brightness. The rms sensitivity of the experiment only reached 51 μJy beam−1 at 15 GHz partly due to the source’s low elevation during the VLBA observations, while the decay of the radio flux density from ∼350 μJy, at 7 days postburst, to ∼150 μJy, at 11 days postburst, was steeper than anticipated (decaying as Fν ∝ t−2).
Nonetheless, our experiment was the first time VLBI was used to search for the multiple images of a candidate strongly gravitationally lensed GRB afterglow. We have clearly demonstrated the need for improvements in several areas for similar VLBI experiments in the future, including but not limited to trigger latency, array flexibility, and real-time correlation capabilities. Implementing these improvements will ensure a successful VLBI confirmation of a lensed GRB event in the future, leading to possibly the first confirmation of a millilens and enabling an alternative method for estimating the Hubble parameter, H0, with systematics that are different to other cosmology experiments.
Acknowledgments
We thank Paz Beniamini and also the anonymous referee for useful comments that improved the quality of this manuscript. We also thank Aaron Lawson and Tim Galvin for their useful advice on troubleshooting data problems with the VLA and ATCA observations, respectively. J.K.L., M.R.D. and A.H. acknowledge support from the University of Toronto and Hebrew University of Jerusalem through the University of Toronto—Hebrew University of Jerusalem Research and Training Alliance program. M.R.D. acknowledges support from the NSERC through grant RGPIN-2019-06186, the Canada Research Chairs Program, and the Dunlap Institute at the University of Toronto. The Dunlap Institute is funded through an endowment established by the David Dunlap family and the University of Toronto. G.G. and O.S.S. acknowledge the European Union-Next Generation EU, PRIN 2022 RFF M4C21.1 (202298J7KT - PEACE). C.S. acknowledges financial support by the Istituto Nazionale di Astrofisica (INAF) Project 1.05.24.07.04 and by the Italian Ministry of University and Research (grant FIS2023-01611, CUP C53C25000300001). T.A. acknowledges support from the Shanghai Oriental Talent Project, Xinjiang Tianchi Talent Program, and FAST special funding (NSFC 12041301). A.H. is grateful for the support by the United States–Israel Binational Science Foundation (BSF grant 2020203) and by the Sir Zelman Cowen Universities Fund. This research was supported by the Israel Science Foundation (ISF grant No. 1679/23). Parts of this research were conducted by the Australian Research Council Centre of Excellence for Gravitational Wave Discovery (OzGrav), through project No. CE230100016. M.P.T. acknowledges financial support from the Severo Ochoa grant CEX2021-001131-S and from the Spanish grant PID2023-147883NB-C21, funded by MCIU/AEI/10.13039/501100011033, as well as support through ERDF/EU.
The Australia Telescope Compact Array is part of the Australia Telescope National Facility (https://ror.org/05qajvd42), which is funded by the Australian Government for operation as a National Facility managed by CSIRO. We acknowledge the Gomeroi people as the Traditional Owners of the Observatory site. The MeerKAT telescope is operated by the South African Radio Astronomy Observatory, which is a facility of the National Research Foundation, an agency of the Department of Science and Innovation. The National Radio Astronomy Observatory is a facility of the National Science Foundation operated under cooperative agreement by Associated Universities, Inc. This work made use of the Swinburne University of Technology software correlator, developed as part of the Australian Major National Research Facilities Program and operated under licence. This work made use of data supplied by the UK Swift Science Data Centre at the University of Leicester.
Data Availability
The ATCA data can be accessed through the Australia Telescope Online Archive41 under the project code C3478. The MeerKAT data can be accessed through the MeerKAT data archive42 under project code DDT-20220705-SG-01. The VLA and VLBA data can be accessed through the NRAO Archive Interface43 under project codes VLA/22B-031 and VLBA/22B-032, respectively. Reasonable requests for other auxiliary datasets can be accommodated for via email to the corresponding author.
Facilities: ATCA - Australia Telescope Compact Array, Fermi/GBM - , MeerKAT - , Swift/XRT - , VLA - Very Large Array, VLBA - Very Long Baseline Array.
Footnotes
- 19
- 20
T90 is a quantity that represents the time interval covering 90% of the total background-subtracted counts detected by the instrument.
- 21
In this case, we note that the time delays observed in many putative lensed GRBs—seconds to minutes—are much shorter than the timescale on which the typical radio afterglow spectrum undergoes significant change (∼days).
- 22
- 23
- 24
- 25
- 26
- 27
This observation occurred during a reconfiguration, where the VLA antennas were transitioning from the A configuration (with a maximum baseline of 36 km) to the D configuration (with a maximum baseline of 1 km). For more information on VLA configurations, see: https://public.nrao.edu/vla-configurations/.
- 28
All VLA data are calibrated by an automated CASA pipeline (B. R. Kent et al. 2020). For more information, see: https://science.nrao.edu/facilities/vla/data-processing/pipeline.
- 29
The standard array of antennas consists of 10 stations; see: https://science.nrao.edu/facilities/vlba/docs/manuals/oss/sites.
- 30
Optical position: α = 13:25:28.49, δ = −32:25:33.31, uncertainty of 0
 1 for each coordinate (S. de Wet et al. 2022).
 - 31
Radio position: α = 13:25:28.57, δ = −32:25:33.31, uncertainty of 0
1 on α and 02 on δ (from our highest signal-to-noise ratio VLA detection). - 32
- 33
- 34
The use of BOXFIT should ensure that the predictions closely match those from ScaleFit (i.e., the code employed by DW23), as the latter is based on the former.
- 35
The reason why it makes sense to parameterize the blast wave energy as a function of the observer-frame time is because the arrival time of a photon emitted at a lab-frame time tlab and at a typical latitude θ = 1/Γ, t = tlab − βr/c, is almost identical to the “retarded” time tr = tlab − βejr/c that represents the ejection time of relativistic ejecta traveling at βej that catch up with the blast wave at a radius r.
- 36
In DW23, the best-fit value of the slope of the relativistic electron energy distribution is p = 2.0. Since the model assumes that the electron energy distribution power law extends to infinity, this parameter choice is formally unphysical. Nevertheless, we find that by setting p = 2.02 we can reproduce the same results as DW23.
- 37
The HSA usually also includes Effelsberg, but this station does not operate at our Ku observing band. The estimated rms sensitivity reached by including the HSA was calculated here using the online tool maintained by Benito Marcote: https://planobs.jive.eu/.
- 38
- 39
- 40
- 41
- 42
- 43


