Abstract
Utilizing high-resolution data from the Magnetospheric Multiscale mission, we present new observations of lower-hybrid drift waves (LHDWs) in terrestrial magnetotail reconnection with guide field levels of ∼70% and asymmetric plasma density (Nhigh/Nlow ∼ 2.5). The LHDWs, driven by lower-hybrid drift instability, were observed in correlation with magnetic field and density gradients at separatrices on both sides of the reconnection current sheet. The properties of the LHDWs at both sides of the separatrices are different: (1) At high-density side separatrices, the LHDWs with wavelength kρe ∼ 0.41 propagated away from the X-line mainly in the L–M plane; (2) at the low-density side separatrices, the LHDWs with wavelengths kρe ∼ 0.76 and kρe ∼ 0.35 propagated mainly along the outflow direction and current sheet normal. It is also found that the perpendicular magnetic field fluctuations were comparable to the parallel component. Wave potential of the LHDWs was 20% ∼ 35% of the electron temperature. The LHDWs contributed to electron demagnetization and energy dissipation. Our study can promote understanding of properties of LHDWs during magnetic reconnection.
Original content from this work may be used under the terms of the Creative Commons Attribution 4.0 licence. Any further distribution of this work must maintain attribution to the author(s) and the title of the work, journal citation and DOI.
1. Introduction
Magnetic reconnection, responsible for many explosive energy release processes in laboratory and astrophysical plasmas (Chen & Shibata 2000; Ji et al. 2004; Angelopoulos et al. 2008; Fu et al. 2013; Cao et al. 2013; Wang et al. 2021), efficiently converts magnetic energy into plasma energy as magnetic field lines break and reconnect (Birn et al. 2001; Yamada et al. 2010; Fu et al. 2019a, 2019b; Fujimoto & Cao 2021). In the terrestrial magnetosphere, it is often observed in the magnetotail (e.g., Fu et al. 2017; Chen et al. 2020; Wang et al. 2022), at the magnetopause (e.g., Fuselier et al. 2017; Cao et al. 2017; Graham et al. 2017; Webster et al. 2018; Dong et al. 2021), in the magnetosheath (e.g., Phan et al. 2018; Stawarz et al. 2019), and in the transition region of bow shocks (Chen et al. 2019b; Wang et al. 2019; Gingell et al. 2020). At the magnetopause, reconnection is generally asymmetric and not antiparallel (Peng et al. 2017; Webster et al. 2018), where plasma density, plasma temperature, and magnetic field magnitude are different on the two sides of the reconnection current sheet, and the guide field exists. In the magnetotail, reconnection is generally symmetric and antiparallel (Eastwood et al. 2010a). Meanwhile, an increasing number of reconnection events with the guide field were also detected in the magnetotail (Chen et al. 2021; Tang et al. 2022; Wang et al. 2022).
Such asymmetries and the guide field can modify the reconnection processes (Eastwood et al. 2013). Under the asymmetric conditions, the stagnation point and the X-line are not collocated, and the stagnation point is displaced to the low-density side of the X-line (Cassak & Shay 2007). Besides, it is compressed that the two quadrants of the Hall quadrupolar magnetic field adjacent to the low-density side of the reconnection current sheet (Wang et al. 2017), and the Hall quadrupolar structure may become a bipolar structure (Pritchett 2008). The Hall magnetic field would be also distorted in the presence of the guide field, owing to the deflection of an electron outflow jet by the J × B force (Eastwood et al. 2010b; Zhou et al. 2014). The presence of the guide field can alter the location where energy conversion between electromagnetic field and plasma occurs as well (Genestreti et al. 2017; Cassak et al. 2017; Xu et al. 2020), leading to a shift of location with the strongest energy conversion to low-density side of the X-line. The energy conversion occurs closer to the electron stagnation with the increase of the guide field. The guide field can also reduce the reconnection rate, the electron nongyrotropic effects, and the thickness of the electron diffusion region (EDR; Yamada et al. 2010). In addition, both asymmetries and the guide field have influence on the distributions and properties of plasma waves that play crucial roles in reconnection (Graham et al. 2016, 2017; Le et al. 2018; Wilder et al. 2019; Yoo et al. 2020), such as whistler waves and lower-hybrid drift waves (LHDWs).
The LHDWs, developing at a frequency near the lower-hybrid frequency, were often observed in the current sheet (Norgren et al. 2012; Liu et al. 2018a; Graham et al. 2019; Cozzani et al. 2021; Wang et al. 2022). It contributes to the strong electric field (Graham et al. 2016), anomalous diffusion, and resistivity (Bale et al. 2002; Vaivads et al. 2004; Graham et al. 2017; Tang et al. 2020), and electron heating (Chen et al. 2020; Wang et al. 2022), and potentially affects the EDR structure (Cozzani et al. 2021). The LHDWs are driven by the lower-hybrid drift instability (LHDI) whose free energy is provided by inhomogeneities in plasma density and magnetic field (Norgren et al. 2012). Besides, the LHDWs can be also induced by the modified two-stream instability (Graham et al. 2017, 2019). The short-wavelength mode with k⊥ ρe ∼ 1 often develops at the current sheet boundary, while the long-wavelength mode with k⊥(ρi ρe)0.5 ∼ 1 develops in the current sheet center (Norgren et al. 2012; Yoo et al. 2020; Wang et al. 2022).
In the asymmetric magnetopause reconnection, the LHDWs prefer to occur on the magnetospheric side (low-density side) of the reconnection current sheet (Le et al. 2018; Zhou et al. 2018; Graham et al. 2019; Wilder et al. 2019). However, the LHDWs were also observed in the magnetosheath side (high-density side) of the reconnection sheet, due to the plasma density gradient, caused by the enhancement of the out-of-plane magnetic field in a reconnection exhaust by the guide field (Tang et al. 2020). The presence of the guide field can also reduce the electron beta in such a way that the short-wavelength mode may develop in the current sheet center (Chen et al. 2020). In magnetotail reconnection without the guide field, electromagnetic and electrostatic LHDWs were observed in the current center and separatrices (Zhou et al. 2009), respectively. Recently, some new properties of LHDWs were also reported in magnetotail reconnection with a weak or intermediate guide field (weaker than 30% of the reconnecting component; Yu et al. 2019; Chen et al. 2020; Cozzani et al. 2021; Wang et al. 2022). Owing to the presence of the guide field, the LHDWs can propagate mainly along the outflow direction (Chen et al. 2020). Besides, the wavevector has a significant component normal to the current sheet in some events (Wang et al. 2022). The magnetic field perpendicular fluctuations are comparable or even greater than the parallel fluctuations (Wang et al. 2022). However, there is still a lack of study on LHDWs in magnetotail reconnection with a moderate guide field (greater than 50% of the reconnecting component), so that it is unclear whether LHDWs exhibit similar properties under such conditions.
Fortunately, we find a magnetotail reconnection with a moderate guide field (∼70% of the reconnection component) and asymmetric plasma density (Nhigh/Nlow ∼ 2.5) by utilizing high-resolution data from the Magnetospheric Multiscale (MMS) mission (Burch et al. 2016). In the event, LHDWs were observed in separatrices on both sides of the reconnection current sheet.
2. Observations
Data used in this study are from the following instruments on board MMS: the magnetic field data recorded by the Fluxgate Magnetometer (FGM; Russell et al. 2016) and the Search-Coil Magnetometer (SCM; Le Contel et al., 2016), the electric field data collected by the Axial Double Probe (ADP; Ergun et al. 2016) and the Electric Double Probe (EDP; Lindqvist et al. 2016), and the plasma data measured by the Fast Plasma Investigation (FPI; Pollock et al. 2016).
The event of interest was observed on 2018 August 15, 11:50:00 UT to 12:05:00 UT, when the spacecraft were located at [−19.25 12.53 1.63] RE (the Earth's radius) in Geocentric Solar Magnetospheric (GSM) coordinates with separations of ∼40 km. Figure 1 presents an overview of the event. Data used in Figures 1(a)–(b) were recorded by MMS1 in fast mode, while data used in Figures 1(c)–(h) were recorded by MMS1 in burst mode (Burch et al. 2016). As illustrated in Figure 1(a), MMS first stayed in the northern hemisphere (Bx > 0), then crossed the terrestrial plasma sheet several times (Bx reversals), and finally returned to the northern hemisphere. During the interval marked by gray vertical lines (11:59:50–12:00:09 UT) in Figures 1(a)–(b), i.e., the first crossing of the plasma sheet, it was detected that reversals of both the magnetic field Bz component (from 15 to −25 nT; Figure 1(a)) and ion velocity Vix component took place (from 500 to −800 km s−1; Figure 1(b)), which suggests a possible encounter of an ongoing magnetic reconnection (Ergun et al. 2018; Huang et al. 2018; Chen et al. 2020).
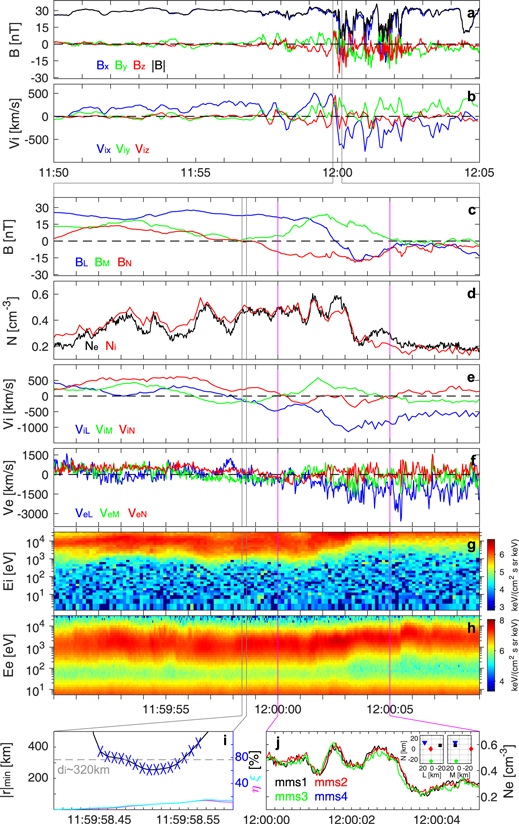
Figure 1. Overview of magnetotail asymmetric magnetic reconnection with the guide field. MMS1 observations of (a) magnetic field and (b) ion bulk velocity in Geocentric Solar Magnetospheric (GSM) coordinates. These data are recorded in fast mode. MMS1 observations of (c) magnetic field, (d) electron and ion number densities, (e) ion bulk velocity, (f) electron bulk velocity, (g) differential energy flux of ions, and (h) differential energy flux of electrons during 11:59:50–12:00:09 UT marked by gray vertical lines in panels ((a)–(b)). These data are shown in LMN coordinates and recorded in burst mode. (i) FOTE results near the flow reversal, i.e., 11:59:58.40–11:59:58.60 UT marked by gray vertical lines in panels ((c)–(f)); η ≡ ∣ ·
B
∣/∣
·
B
∣/∣ ×
B
∣ and
×
B
∣ and  are used to quantify the quality of the FOTE results. The magenta vertical lines (12:00:00-12:00:05 UT) in panels ((c)–(h)) denote the crossing of the reconnection current sheet. (j) Electron number density measured by MMS1, MMS2, and MMS3 during the crossing of the reconnection current sheet marked between magenta vertical lines; MMS configuration in L–N and M–N plane are in top right of the panel.
Download figure:
Standard image High-resolution imageTo describe the current sheet, we performed the minimum variance analysis on the magnetic field during 12:00:00.50–12:00:03.00 UT to obtain the local boundary normal (LMN) coordinates. With respect to the GSM coordinates, L = [0.90–0.38 0.20], M = [0.43 0.83–0.35], and N = [−0.03 0.41 0.91]. As shown in Figure 1(c), magnetic field BN reversed from positive to negative, which is in concert with positive-to-negative reversals of the electron and ion outflows, ViL and VeL (Figures 1(e) and (f)). Meanwhile, an X-line was detected near the correlated reversals (11:59:58.40–11:59:58.60 UT) by using the FOTE method (Fu et al. 2015, 2016, 2019a; Wang et al. 2019; Fu et al. 2020b). In this 0.2 s interval, the shortest null-MMS distance is less than 1 di ∼ 320 km (di = c/ωpi ≈ 228Ni −0.5 is the local ion inertial length, Ni ∼ 0.5 cm−3) and both η and ξ are less than 40% (Figure 1(g)), indicating the reliability of the FOTE results (Fu et al. 2015). These features, the correlated reversals of BN and VL, and an X-line, confirm the encounter of an ongoing magnetic reconnection.
At the reversal of magnetic field BL, the magnetic field BM is ∼19 nT (∼0.7BL; Figure 1(c)), suggesting the existence of a moderate guide field (Eastwood et al. 2013; Genestreti et al. 2017; Peng et al. 2017; Chen et al. 2019) in the magnetic reconnection event. During the crossing of the reconnection current sheet, plasma number density decreased sharply from ∼0.6 to ∼0.2 cm−3 in the southern hemisphere (BL < 0) (Figure 1(d)). As shown in Figure 1(j), the density gradient is first observed by MMS3, followed by MMS1 and MMS2 almost simultaneously. It indicates the number density gradient was mainly along the N direction, since MMS3 was separated from MMS1 and MMS2 mainly along the N direction (top right plot in Figure 1(j)). Therefore, there is number density asymmetry with a value of ∼2.5 on the two sides of the reconnecting current sheet (Figure 1(d)). As shown in Figure 1(h), most of the electron population is below 10 keV, well covered by the measurements range of the FPI (Pollock et al. 2016). It indicates the accurate measurements of electron number density. The ratio of number density is comparable to that in some magnetopause asymmetric reconnection events (Peng et al. 2017; Wang et al. 2017). Such density asymmetry was also observed in magnetotail guide field reconnection (Wang et al. 2012). In the tailward (−L direction) outflow region, low-energy particle flux decreased while high-energy particle flux increased at ∼12:00:03.50 and ∼12:00:05.50 (Figures 1(g)–(h)), suggesting occurrence of particle acceleration (Fu et al. 2013; Liu et al. 2018b; Fu et al. 2019b, 2020a). We are going to study the particle acceleration in our future work.
Then, we investigate the reconnection current sheet in tailward outflow marked between two magenta lines (12:00:00–12:00:05 UT) in Figures 1(c)–(h). During the complete crossing of the reconnection current sheet from the northern hemisphere to the southern hemisphere, the magnetic field BL component reversed from ∼20 nT to ∼−17 nT (Figure 2(a)); the plasma β (the ration of ion thermal pressure to magnetic pressure) first increased and then decreased (Figure 2(b)), and the plasma number density generally decreased from ∼0.5 to ∼0.2 cm−3 (Figure 1(d)). Plasma number density varied between ∼0.4 and ∼0.6 cm−3 in the northern hemisphere (BL > 0), while plasma number density first decreased sharply from ∼0.6 to ∼0.2 cm−3 and then increased to ∼0.33 cm−3 in the southern hemisphere (BL < 0). We compared the measured electric field by MMS (red curves in Figures 2(c)–(e)) with electron convection terms (black curves in Figures 2(c)–(e)) in the reconnection current sheet. It shows that the electron convection term can balance the measured electric field except in the region with strong electric field fluctuations, i.e., at both edges of the reconnection current sheet (12:00:02.000–12:00:02:424 UT and 12:00:03.000–12:00:04.200 UT). Therefore, the strong electric field fluctuations would result in a nonzero electric field in the electron frame ( E ′ = E + V e × B ), indicating violation of the ideal electron frozen-in condition.
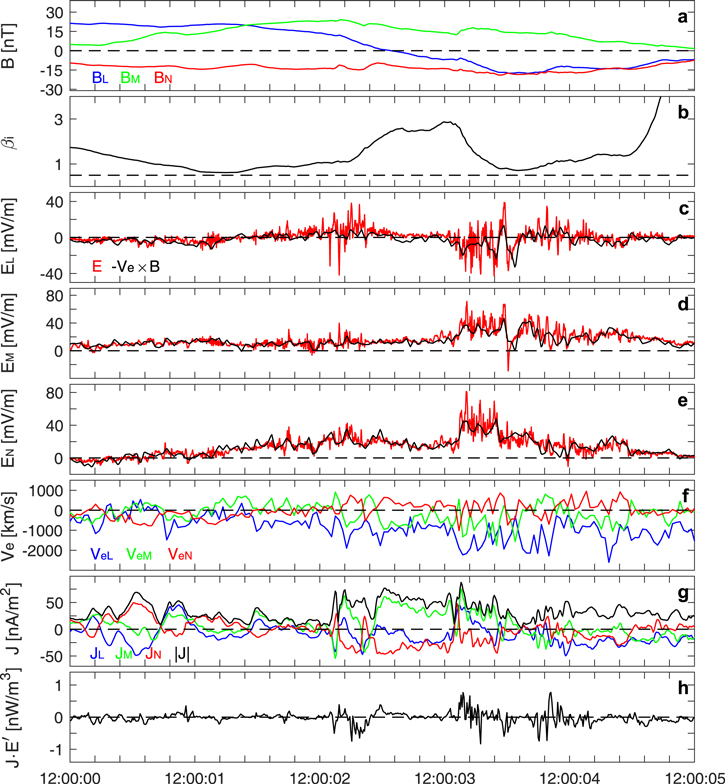
Figure 2. The crossing of reconnection current sheet detected by MMS1. (a) Magnetic field, (b) plasma β, (c)–(e) electric field (red) and electron convection term (black), (f) electron velocity, (g) current density calculated by the Curlometer method, and (h) energy dissipation ( J ·E′ = J ·( E + V e × B )). These data are shown in LMN coordinates and recorded in burst mode.
Download figure:
Standard image High-resolution imageEnhancements of the electron velocity VeL component (blue curve in Figure 2(f)) were also observed at both edges of the reconnection current sheet, roughly coincident with regions that electric field fluctuations were observed in. It indicates wave-driven flows through the E × B drift. Nevertheless, the electron demagnetization (Figures 2(c)–(e)) suggests that electron flow velocity would exhibit deviations from E × B drift velocity in correlation with largest amplitude electric field fluctuations. Three components of electron velocity varied roughly anticorrelated with three components of current density, respectively, indicating electron-driven current. Here, the current density is calculated by the Curlometer method (Dunlop et al. 2002). The reconnection current sheet was quite structured with dramatic variation of current density (Figure 2(g)), e.g., the magnitude of current density exhibits deep valleys at ∼12:00:02.424 UT and ∼12:00:03.078 UT. During the interval between 12:00:02.000 UT and 12:00:03.600 UT, the current density JM and JN components were primarily positive and negative, respectively, except near these deep valleys. These features indicate that the reconnection current sheet has broken into three current sheets, showing sandwich shape. Current sheets on both sides hosted strong electric field fluctuations, while there were no obvious electric field fluctuations in middle current sheet. The current density and nonzero E ′ would result in strong electron dissipation ( J ·( E + V e × B )) in current sheets on both sides (Figure 2(h)); J ·( E + V e × B ) was primarily negative with a value up to −0.5 nW m−3 in the northern side current sheet (high-density side), while J ·( E + V e × B ) with values ranging from 0.7 to −0.5 nW m−3 was detected in the southern side current sheet (low-density side). The positive J ·( E + V e × B ) indicates energy dissipation in which electromagnetic field energy is converted to plasma energy, while the negative J ·( E + V e × B ) suggests that plasma energy is converted to electromagnetic field energy. These features, including enhanced electric field fluctuations, energy dissipation, variations of plasma number density, and the electron velocity VeL component, indicate an encounter of separatrices on both sides of the reconnection current sheet.
Then, we investigate the properties of strong electric fluctuations in these two separatrices. The electron velocity VeL was ∼2 times of the ion velocity ViL (Figures 1(e) and (f)), and the electron velocity VeM was roughly antiparallel to the ion velocity ViM (Figures 1(e) and (f)). These lead to an ion-electron relative drift, which in combination with the magnetic field and density gradients (Figures 3(a) and (c)) is conducive to the LHDI (Davidson & Gladd 1975; Norgren et al. 2012; Liu et al. 2018a; Graham et al. 2019; Chen et al. 2020). As illustrated in Figure 3(b), these electric field fluctuations were mainly perpendicular to the magnetic field. The spectral powers in the perpendicular electric field (Figure 3(e)) were enhanced by more than two orders of magnitude between 3 and 60 Hz (around the lower-hybrid frequency,  Hz), while there are quite weak wave emissions in the parallel electric fields in the frequency range (Figure 3(f)). Besides, enhancements of spectral powers in the magnetic field (Figure 3(g)) were simultaneously observed in the frequency range. In the low-density side separatrices (LSR), it can be found that there is an obvious gap at ∼12:00:03.600 UT in the spectral powers of the perpendicular electric field (Figure 3(e)). Thus, the low-density side separatrices are divided into two regions (marked by gray vertical lines), one with sharp decrease in number density (LSR1) and the other with increase in number density (LSR2).
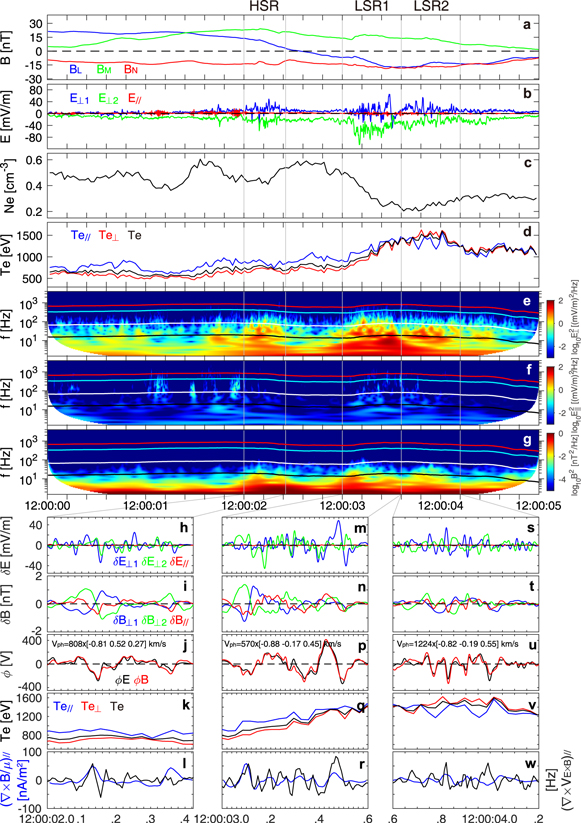
Figure 3. Observations of lower-hybrid drift waves (LHDWs) by MMS1. (a) Magnetic field in LMN coordinates, (b) electric field in field-aligned coordinates, (c) electron number density, and (d) electron temperature. (e)–(g) The power spectrogram of (e) perpendicular electric field, (f) parallel electric field, and (g) magnetic field. The color lines in (e)–(g) denote fce (electron gyrofrequency, red), 0.5 fce (cyan), 0.1 fce (white), and flh (lower-hybrid frequency, black), respectively. (h)–(l) bandpass, (h) electric field, and (i) magnetic field around LH frequency (3–60 Hz) in field-aligned coordinates, (j) estimated wave potential ΦE
(black) and ΦB
(red), (k) electron temperature, (l)  (black), and (∇ × B)∣∣ (blue). Panels (m)–(r) and (s)–(w) have the same format with panels (h)–(l). The gray lines in panels (a)–(g) denote the boundaries of separatrices.
Download figure:
Standard image High-resolution imageWe applied a bandpass filter to the waveform data of the electric field (provided by EDP and ADP) and magnetic field (provided by SCM) in the frequency range between 3 and 60 Hz during encounters of these two separatrices. It is found that the perpendicular electric field fluctuations are much greater than the parallel component (Figures 3(h), (m), and (s)). Furthermore, ∣δ E⊥∣/δ B∣∣ is much greater than the Alfvén speed and magnetosonic speed, suggesting that these waves are not purely electromagnetic. Based on the minimum variance analysis of the waveform data of the electric field, we find that propagation directions of these waves in the high-density side separatrices (HSR), LSR1, and LSR2 are [−0.88 0.46 0.10], [−0.90–0.43 0.11], and [−0.81-0.25 0.53], respectively, which are perpendicular to the magnetic field. These features are consistent with lower-hybrid drift wave properties (Chen et al. 2019a; Graham et al. 2019). It can be also found that the perpendicular magnetic field fluctuations were comparable to the parallel component (Figures 3(i), (n), and (t)), which is similar with properties of LHDWs revealed near EDRs during magnetotail reconnection with the guide field less than 30% of the reconnection component (Wang et al. 2022).
We then obtained wave propagation velocity Vph in these two separatrices based on the relation ΦE = ΦB (ΦE =∫δ E • V Ph dt, ΦB = B • δ B /en μ0 obtained from Ampere's law ∇ × δ B = μ0 en∇ΦB × B /∣B∣2; Norgren et al. 2012; Zhou et al. 2018). In HSR, the wave propagation velocity is 808 × (−0.81, 0.52, 0.20) km s−1 in the LMN coordinates (Figure 4(j)), which is mainly in the L–M plane roughly perpendicular to the ambient magnetic field. It shows that the LHDWs propagated away from the X-line along the outflow direction (−L). The wavelength is relatively short with k ρe ∼ 0.41. The estimated wave potential of LHDWs is ∼250 V (Figure 3(j)), corresponding to ∼30% of electron temperature (eΦ/kB Te ∼ 30%). The wave propagation velocities in LSR1 and LSR2 are 570 × (−0.88, −0.17, 0.45) km s−1 and 1224 × (−0.82, −0.19, 0.55) km s−1 (Figures 4(p) and (u)), respectively, which are mainly in the L–N roughly perpendicular to the ambient magnetic field. It shows that the LHDWs propagated along the outflow direction (−L), and simultaneously toward to the current sheet center (+N). The property is similar with observations in some magnetotail reconnection events with the guide field less than 30% of the reconnection component (Wang et al. 2022). The corresponding wavenumber k ρe in these two regions is ∼0.76 and ∼0.35, respectively. The estimated wave potential of LHDWs in these two regions is ∼35% (∼400 V; Figure 3(p)) and ∼20% (∼280 V; Figure 3(u)) of electron temperature, respectively.
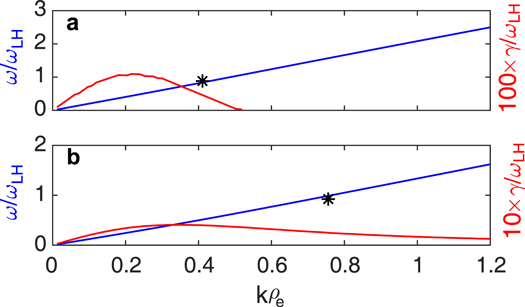
Figure 4. The predicted dispersion relation (blue) and growth rate (red) at (a) the high-density side separatrices (HSR) and (b) the low-density side separatrices with sharp decrease in density (LSR1). The asterisk denotes the observed dispersion relation.
Download figure:
Standard image High-resolution imageThe electron temperature is expected to be modulated by LHDWs. Enhancements of electron temperature were observed in coincidence with the LHDWs in LSR (Figures 3(d) and (e)). However, there is no clear correlation between Te (Figures 3(k), (q), and (v)) and the wave potential (Figures 3(j), (p), and (u)) in these regions, which is possibly because LHDWs have developed into the later stage (Wang et al. 2021, 2022). The LHDWs would produce electron vortices in the background flow frame, together with twisting of magnetic lines (see Figure 5 in Wang et al. 2021). In HSR and LSR1,  are generally correlated with (∇ × B)∣∣, and such correlation in LSR1 is clearer (Figures 3(l) and (r)). In LSR2, there is no pure correlation or anticorrelation between
  and (∇ × B)∣∣ (Figure 3(w)), such as correlation at ∼12:00:03.82 UT and anticorrelation at ∼12:00:04.00 UT. Wang et al. (2022) predicted that
  and (∇ × B)∣∣ are correlated when θkB < 90° and anticorrelated when θkB > 90°, where θkB is the angle between the wavevector and magnetic field. However, θkB are not purely less or greater than 90° in these three regions, which is inconsistent with predictions. It may be attributed to the mixture between the inflow and outflow electrons at separatrices, or that the vortices have developed into later stage (Wang et al. 2021, 2022). Here,
  and (∇ × B)∣∣ at the barycenter are obtained by using four MMS spacecraft measurements, where the parallel direction is along the four-spacecraft average of <1 Hz magnetic field, and the bandpass filtered
B
and
V
E
×
B
are used.
and (∇ × B)∣∣ at the barycenter are obtained by using four MMS spacecraft measurements, where the parallel direction is along the four-spacecraft average of <1 Hz magnetic field, and the bandpass filtered
B
and
V
E
×
B
are used.
The dispersion relation and growth rate of the LHDI in the HSR and LSR with sharp decrease in number density were obtained by solving the local electrostatic dispersion equation (Davidson & Gladd 1975; Graham et al. 2017). In the HSR, parameters used in the equation are from MMS1 observations: ion temperature Ti ∼ 5928 eV, electron temperature Te ∼737 eV, electron number density ne ∼ 0.46 cm−3, magnetic field magnitude B ∼ 28 nT, magnetic field gradient along N ∼ 0.07 nT km−1, and density gradient along N ∼ 0.00076 cm−3 km−1. Here, the magnetic field and density gradients along N are obtained by  and
and  , respectively, where VN ∼ 590 km s−1 is calculated by Timing analysis. The growth rate is positive (γ ∼ 0.0053ωlh) at the observed kρe ∼ 0.41 with frequency ω ∼ 0.83ωlh (Figure 4(a)). In LSR1, parameters used in the equation are from MMS1 observations: Ti ∼ 6600 eV, Te ∼ 1136 eV, ne ∼ 0.32 cm−3, B ∼ 27 nT, magnetic field gradient along N ∼ 0.0237 nT km−1, and density gradient along N ∼ −0.00093 cm−3/km. The growth rate is positive (γ ∼ 0.025ωlh) at the observed kρe ∼ 0.76 with frequency ω ∼ ωlh (Figure 4(b)). These are roughly consistent with the properties of the LHDWs observed in these separatrices. It confirms that the observed magnetic field and density gradients were sufficient to drive the LHDWs observed by MMS.
3. Summary
In this study, we have presented new observations of LHDWs at both sides of separatrices in magnetotail asymmetric reconnection with the moderate guide field (∼70% BL), by utilizing high-resolution data from the Magnetospheric Multiscale (MMS) mission. There is number density asymmetry with a value of ∼2.5 on the two sides of the reconnecting current sheet. At the high-density side separatrices, the LHDWs with wavelength kρe ∼ 0.41 propagated away from the X-line mainly in the L–M plane. At the low-density side separatrices, the LHDWs with wavelengths kρe ∼ 0.76 and kρe ∼ 0.35 propagated mainly along the outflow direction and the current sheet normal. On both sides of the separatrices, the perpendicular magnetic field fluctuations can be comparable to the parallel component. The wave potential of these LHDWs is 20% ∼ 35% of the electron temperature, indicating that the LHDWs can effectively scatter the electrons. The electron demagnetization was observed in correlation with largest amplitude electric field fluctuations, contributing to strong energy dissipation with values between −0.5 and 0.7 nW m−3. These LHDWs were observed coincident with magnetic field and density gradients, which provide free energy for the LHDI. Our study can promote understanding of properties of LHDWs during magnetic reconnection.
We thank the MMS Science Data Center (https://lasp.colorado.edu/mms/sdc/public/about/browse-wrapper/) for providing the data for this study. This work was supported by NSFC grants 41821003 and 42104163.