Abstract
The spatial extension of a γ-ray source is an essential ingredient to determine its spectral properties, as well as its potential multiwavelength counterpart. The capability to spatially resolve γ-ray sources is greatly improved by the newly delivered Fermi-Large Area Telescope (LAT) Pass 8 event-level analysis, which provides a greater acceptance and an improved point-spread function, two crucial factors for the detection of extended sources. Here, we present a complete search for extended sources located within 7° from the Galactic plane, using 6 yr of Fermi-LAT data above 10 GeV. We find 46 extended sources and provide their morphological and spectral characteristics. This constitutes the first catalog of hard Fermi-LAT extended sources, named the Fermi Galactic Extended Source Catalog, which allows a thorough study of the properties of the Galactic plane in the sub-TeV domain.
1. Introduction
Several surveys of the Galaxy have been undertaken at TeV γ-ray energies (e.g., Aharonian et al. 2006a) by the current Instrument Atmospheric Cherenkov Telescopes (IACTs) revealing different classes of astrophysical sources such as supernova remnants (SNRs), pulsar wind nebulae (PWNe), and molecular clouds (MCs; see Hewitt & Lemoine-Goumard 2015, for a review on SNRs and PWNe). Many are observed as spatially extended with respect to the angular resolution of the instruments. These sources produce γ-ray photons through inverse Compton (IC) scattering off highly relativistic leptons, through bremsstrahlung radiation, or by hadrons interacting with interstellar matter. In many sources, this population of high-energy particles emits GeV γ-rays detectable by the Large Area Telescope (LAT), the primary instrument on the Fermi Gamma-Ray Space Telescope (Atwood et al. 2009). Indeed, since its launch in 2008, the Fermi-LAT has detected a growing number of spatially extended sources across the sky thanks to its wide field of view (∼2.4 sr) and (primarily) sky-survey operation mode. The Second Fermi-LAT Point Source Catalog (2FGL; Nolan et al. 2012) contained 12 extended sources. The number of extended sources increased to 22 in the First Fermi-LAT Hard Source Catalog, covering nearly 3 yr of data in the range 10–500 GeV (1FHL; Ackermann et al. 2013a); then to 25 in the Third Fermi-LAT Point Source Catalog, with 48 months of data in the range 100 MeV–300 GeV (3FGL; Acero et al. 2015); and to 31 in the Second Fermi-LAT Hard Source Catalog, with 80 months of data above 50 GeV (2FHL; Ackermann et al. 2016). The addition of data and, in the case of the hard source catalogs, the focus on higher energies where photons are better localized and backgrounds are reduced have amplified the excellent capability of the Fermi-LAT to spatially resolve GeV γ-ray sources.
Accurately estimating the spatial morphology of a γ-ray source is important for several reasons. Finding a coherent source extension across different energy bands can help to associate a Fermi-LAT source with a potential counterpart. Such multiwavelength studies can also help to determine the emission mechanisms producing these high-energy photons. Due to the energy dependence of the Fermi-LAT point-spread function (PSF), the spatial and spectral characterization of a source cannot be decoupled. An incorrect spatial model will bias the spectral model of the source and vice versa, and it can also skew the spectra of point sources in the vicinity of the extended source.
The 2FHL Catalog analyzed data from 50 GeV to 2 TeV and served to bridge the energy gap between ground-based γ-ray telescopes and the Fermi-LAT. Of the 31 spatially extended sources found in 2FHL, 5 were detected as extended for the first time. The 2FHL showed that several of the extended sources previously identified by the Fermi-LAT using lower-energy data sets displayed a potential change in their best-fit extension and centroid (i.e., the centroids and/or extensions of the 2FHL sources were not compatible within the errors to the corresponding 3FGL source).
In this paper we use 6 yr of Pass 8 data to produce a catalog of extended sources detected by the Fermi-LAT at energies between 10 GeV and 2 TeV at low Galactic latitude (±7° of the Galactic plane). Lowering the energy threshold with respect to 2FHL to 10 GeV maintains a PSF width  and a reduced level of confusion from Galactic diffuse emission while increasing the number of γ-rays available for analysis. The lower energy threshold increases the number of detectable sources compared to 2FHL and permits a more robust measurement of morphology than (1) lower-energy Fermi-LAT data selections in regions where diffuse systematics are large and (2) higher-energy Fermi-LAT data selections for sources with fewer detected photons. This paper is the first catalog of extended sources produced with the Fermi-LAT data, named the Fermi Galactic Extended Source (FGES) catalog, allowing a thorough study of the properties of the Galactic plane in the sub-TeV domain. The paper is organized as follows: Section 2 describes the Fermi-LAT and the observations used, Section 3 presents our systematic methods for analyzing spatially extended Fermi-LAT sources in the plane, Section 4 discusses the main results, and a summary is provided in Section 5.
2. Fermi-LAT Description and Observations
2.1. Fermi-LAT
The Fermi-LAT is a γ-ray telescope that detects photons by conversion into electron–positron pairs in the energy range from 20 MeV to higher than 500 GeV, as described in Atwood et al. (2009). The LAT is composed of three primary detector subsystems: a high-resolution converter/tracker (for direction measurement of the incident γ-rays), a CsI(Tl) crystal calorimeter (for energy measurement), and an anticoincidence detector to identify the background of charged particles. Since the launch of the spacecraft in 2008 June, the LAT event-level analysis has been periodically upgraded to take advantage of the increasing knowledge of how the Fermi-LAT functions, as well as the environment in which it operates. Following the Pass 7 data set, released in 2011 August, Pass 8 is the latest version of the Fermi-LAT data. Its development is the result of a long-term effort aimed at a comprehensive revision of the entire event-level analysis and comes closer to realizing the full scientific potential of the Fermi-LAT (Atwood et al. 2013). Compared to previous iterations of the Fermi-LAT event-level analysis, Pass 8 provides a greater acceptance and an improved PSF58
(with a 68% containment radius smaller than 02 above 10 GeV that is nearly constant with increasing energy), which are two crucial factors for the detection of extended sources.
2.2. Data Selection
We used 6 yr (from 2008 August 4 to 2014 August 4) of Pass 8 SOURCE photons with reconstructed energy in the 10 GeV–2 TeV range. Photons detected at zenith angles larger than 105° were excised to limit the contamination from γ-rays generated by cosmic-ray (CR) interactions in the upper layers of the atmosphere. Moreover, data were filtered, removing time periods when the instrument was not in sky-survey mode. Fermi Science Tools v10r01p01 and instrument response functions (IRFs) P8R2_SOURCE_V6 were used for this analysis. In addition, the analysis was restricted to regions within 7° from the Galactic plane. Figure 1 shows a count map of the Galactic plane observed by the Fermi-LAT above 10 GeV highlighting large structures with a Gaussian smoothing radius of 05. The bright remnants IC 443 (l = 189
06) and γ Cygni (l = 78
15) stand out clearly, but a large number of other sources are also apparent. Several are coincident with higher-energy sources detected by ground-based γ-ray experiments, such as the Kookaburra complex (l = 313
38), and will be discussed in Section 4. The large number of sources visible in the map highlights the excellent sensitivity and angular resolution of the Fermi-LAT at high energies afforded by the new Pass 8 data.
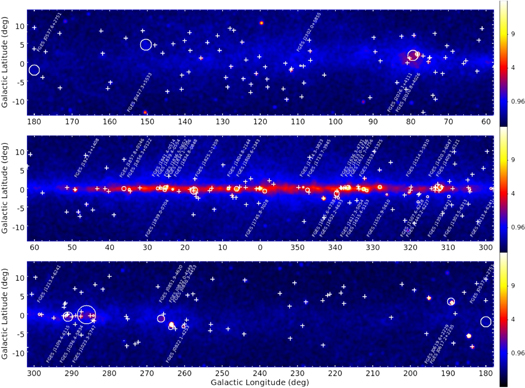
Figure 1. Smoothed count map in the 10 GeV–2 TeV band represented in Galactic coordinates and Cartesian projection. The image has been smoothed with a Gaussian kernel with a size of 05. The color scale is square root, and the units are counts per (0
1)2. White circles indicate the position and extension of the 46 extended sources described in this work. White plus signs mark the location of point sources.
Download figure:
Standard image High-resolution image3. Detection of New Extended Sources
3.1. Input Source Model Construction
The analysis of the full data set was divided into smaller regions of the sky, each of which must be represented by a spectral and spatial model. For each region, we start with a sky model that includes all pointlike and extended Fermi-LAT sources listed in the 3FGL catalog, the Galactic diffuse and isotropic emission, and pulsars from the Second Fermi LAT Pulsar Catalog (Abdo et al. 2013), as well as from 3FGL. The energy range used in this work prevents a reasonable fit of a pulsar spectral component modeled by a power law with an exponential cutoff. The bulk of the pulsar emission and the cutoff energy of the pulsar, typically a few GeV, lie below 10 GeV. Therefore, we decided to fit only the normalization and index for pulsars while keeping the cutoff energy as a fixed parameter. The Galactic diffuse emission was modeled by the standard Fermi-LAT diffuse emission ring-hybrid model gll_iem_v06.fits (Acero et al. 2016a), and the residual background and extragalactic radiation were described by a single isotropic component with the spectral shape in the tabulated model iso_P8R2_SOURCE_V6_v06.txt. The models are available from the Fermi Science Support Center (FSSC).59 In the following, we fit the normalizations of the Galactic diffuse and isotropic components.
3.2. Analysis Method
Two different software packages for maximum likelihood fitting were used to analyze Fermi-LAT data: pointlike and gtlike. These tools fit Fermi-LAT data with a parameterized model of the sky, including models for the instrumental, extragalactic, and Galactic components of the background. The tool pointlike is a software package (Kerr 2010) validated by Lande et al. (2012) that we used to fit the positions of pointlike sources in the region of interest (ROI) and fit the spatial parameters of spatially extended sources presented in Section 3.3. The tool gtlike is the standard maximum likelihood method distributed in the Fermi Science Tools by the FSSC. We apply it in binned mode, combining the four P8R2_SOURCE_V6 PSF event types in a joint likelihood function.
In the following analysis, we used pointlike to evaluate the best-fit position and extension, as well as preliminary spectral values, for each new source added in our model. Using those morphologies, we subsequently employed gtlike to obtain the best-fit spectral parameters (initializing spectra at the  -determined values) and statistical significances (see Section 3.4). Both methods agree with each other for all derived quantities, but all spectral parameters and significances quoted in the text were obtained using gtlike.
Since the pointlike and gtlike analyses use circular and square ROI geometries, respectively, we included photons within a radius of 10° when using pointlike to characterize the whole ROI and within a  square region centered on the extended source of interest when using gtlike to perform the spectral analysis. Both analyses use an energy binning of 8 bins per decade and the MINUIT60
optimizer for likelihood fitting.
square region centered on the extended source of interest when using gtlike to perform the spectral analysis. Both analyses use an energy binning of 8 bins per decade and the MINUIT60
optimizer for likelihood fitting.
3.3. Localization and Extension
We developed an analysis pipeline, similar to that used in the 2FHL catalog. We describe here this pipeline and present an alternate analysis implemented as a cross-check in the Appendix. Our pipeline was launched over 216 ROIs of radius 10°, centered on b = 0° and ±5° with overlapping neighboring ROIs separated by 50 in Galactic longitude (Figure 2). To homogenize the analysis, extended sources were all fit assuming a uniform disk shape. The pipeline included extended sources from the 3FGL catalog, which were initialized at their best-fit disk extension. If the source was previously modeled with a Gaussian shape in the 3FGL catalog, we initialized the disk radius at
 as suggested by Lande et al. (2012). If the source was previously modeled with a multiwavelength template, we used the average between the semimajor and semiminor axes, reported in the 3FGL catalog, to initialize the disk radius. In each region the procedure to find all point and extended sources proceeded as follows using
  .
.
- 1.Using the initial sky model defined above, the first step of our pipeline aims to find the best spectral parameters for all free sources in the region using
 . All sources within 5° of the center were set free. The significance of each source was evaluated using the test statistic , where and are the likelihoods of the background (null hypothesis) and the hypothesis being tested (source plus background). The formal statistical significance of this test can be obtained from Wilks’s theorem (Wilks 1938). In the null hypothesis, TS follows a distribution with n degrees of freedom, where n is the number of additional parameters in the model. At each step in the procedure, sources with TS < 16 were removed from the model.
 - 2.Due to the 6 yr of integration time for our analysis compared to the 4 yr for the 3FGL catalog, we expected to find new statistically significant sources (TS > 16). To detect these new sources, we generated a TS map for a point source with a power-law spectral index of 2.0 including all significant 3FGL sources in the background model. The TS map covered length with 0
1 pixels. We added a source at the location of every peak with TS above 16 that was separated by more than 0
, where (Lande et al. 2012), i.e., twice the logarithm of the likelihood ratio of an extended to a point source. The choice of a threshold set to 16 corresponds to a formal significance.61
If this threshold was met, then the disk-modeled source was kept in the ROI. We stopped adding sources when the source TS was less than 16. - 3.Again, due to the different integration time and energy range, we might see variations in morphology for already-detected extended sources. The spatial and spectral parameters of all 3FGL sources are therefore refit once these new point sources and extended sources are added in the source model of each region.
- 4.As a last step, to address the ambiguity of detecting a source as spatially extended as opposed to a combination of point sources, we utilized the algorithm detailed in Lande et al. (2012) to simultaneously fit the spectra and positions of two nearby point sources. To help with convergence, it begins by dividing the extended source into two spatially coincident pointlike sources and then fitting the sum and difference of the positions of the two sources without any limitations on the fit parameters. We only considered a source to be extended if (improvement when adding a second point source defined as ). If an extended source did not meet this criterion, it was then replaced by two point sources located at the best positions found by the above algorithm. It should be noted that cannot be quantitatively compared to using a simple likelihood ratio test to evaluate which model is preferred because the models are not nested. As an alternative, we can consider the Akaike information criterion test (AIC; Akaike 1974). The AIC is defined as , where k is the number of parameters in the model. In this formulation, the best hypothesis is considered to be the one that minimizes the AIC. The two pointlike sources hypothesis has three more parameters than the single extended source hypothesis (two more spatial parameters and two more spectral parameters compared to one extension parameter), so the comparison is formally equivalent to . This means that our criterion is more restrictive than the AIC test. It was extensively tested in Lande et al. (2012) using simulations showing that is a powerful test to avoid cases of simple confusion of two pointlike sources. But it could always be the case that an extended source is actually the superposition of multiple pointlike or extended sources that could be resolved with deeper observations of the region.
- 5.When the sky model was complete, all new sources were tested for spectral curvature using a lognormal model (referred to as LogParabola or LogP with a curvature noted β). We assessed the significance of the spectral curvature for a given source by. Since the power law is a special case of LogParabola (with β = 0) and β = 0 is inside the allowed interval, we expect that is distributed as with one degree of freedom. We switched to LogParabola and refit the ROI if , corresponding to 4σ significance for the curvature. Only one extended source shows such curvature.
- 6.To complete the construction of the source model of the region, we take the output of the previous steps for the four surrounding ROIs plus the ROI of interest as defined in color in the left panel of Figure 2 using a 10° radius centered on a Galactic latitude of b = 0°. Sources appearing in multiple ROIs are defined using the parameters obtained in the closest ROI center. We refit the spatial parameters of any previously added extended sources within 5° of the center (starting from the highest TS value), as well as the spectra of sources in this region, while all other sources in the ROI were fixed. This allows a direct comparison of the two pipelines since the size, location, and free radius of the regions are then identical.

















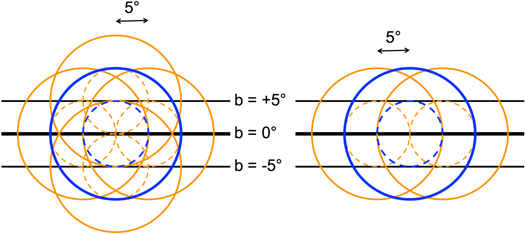
Figure 2. Schematic representations of the arrangement of the analysis regions for the two pipelines used for localization and extension. Left: description of the main pipeline, defined in Section 3.3; each ROI (solid blue circle) of radius 10° is centered on  and ±5° and separated from its neighboring ROIs (orange circles) by 5° in Galactic longitude; all sources within 5° of the center (dashed circle with the same color) were set free for the primary pipeline. Right: details of the secondary pipeline described in the Appendix: each ROI (marked by a solid blue circle) of radius 10° is centered on
  and separated from its neighbors (orange circles) by 5° in Galactic longitude.
Download figure:
Standard image High-resolution imageThis analysis detected 51 sources with  > 16, TS > 25, and
  >
>  . Spectral and spatial parameters for the detected extended sources are compatible in both the analysis described above and the secondary pipeline described in the Appendix, in most cases. Only two detected sources were rejected: one undetected by the main pipeline, and another one undetected by the secondary pipeline. They are discussed in the Appendix. The morphological results derived by
  for the 46 sources that also pass the same TS criteria as
  (see below) are presented in Table 1. It should be noted that the final list of point sources detected by our two pipelines agrees perfectly with that reported by the 3FHL catalog in the latitude range
  (Fermi LAT Collaboration 2017) using 27 spatial templates derived in this analysis (either when the extended source is newly detected here or when the model provides a better representation of the source). The point sources not detected by our pipeline (less than 10%) are all low-TS sources (close to our threshold of 25) and can be explained by the reduced data set and binned analysis used here.
Table 1. Best-fitting Morphological Parameters of the Extended Sources Detected above 10 GeV
| FGES Name | TS |

|

|
R.A. | Decl. | Extension σ |
|---|---|---|---|---|---|---|
| (deg) | (deg) | (deg) | ||||
| J0427.2+5533 | 192 | 160 | 21 | 66.822 ± 0.043 | 55.552 ± 0.053 | 1.52 ± 0.03 ± 0.08 |
| J0537.6+2751 | 35 | 17 | 9 | 84.407 ± 0.057 | 27.859 ± 0.056 | 1.39 ± 0.02 ± 0.09 |
| J0617.2+2235 | 831 | 572 | 177 | 94.309 ± 0.008 | 22.584 ± 0.008 | 0.34 ± 0.01 ± 0.01 |
| J0619.6+2229 | 68 | 49 | 21 | 94.653 ± 0.040 | 22.484 ± 0.028 | 0.96 ± 0.03 ± 0.05 |
| J0822.1−4253 | 374 | 198 | 193 | 125.545 ± 0.016 | −42.888 ± 0.019 | 0.44 ± 0.01 ± 0.01 |
| J0830.3−4453 | 80 | 23 | 7 | 127.588 ± 0.041 | −44.885 ± 0.025 | 0.22 ± 0.03 ± 0.02 |
| J0832.0−4549 | 69 | 41 | 0 | 128.008 ± 0.044 | −45.813 ± 0.046 | 0.61 ± 0.04 ± 0.05 (6/8) |
| J0851.9−4620 | 808 | 728 | 394 | 132.987 ± 0.021 | −46.342 ± 0.016 | 0.98 ± 0.01 ± 0.01 |
| J1023.3−5747 | 144 | 41 | 20 | 155.828 ± 0.021 | −57.794 ± 0.024 | 0.28 ± 0.02 ± 0.06 |
| J1036.3−5834† | 281 | 265 | 18 | 159.094 ± 0.049 | −58.563 ± 0.042 | 2.47 ± 0.06 ± 0.06 |
| J1109.4−6115† | 141 | 134 | 24 | 167.362 ± 0.046 | −61.259 ± 0.042 | 1.27 ± 0.03 ± 0.08 |
| J1213.3−6240 | 105 | 66 | 34 | 183.346 ± 0.014 | −62.688 ± 0.032 | 0.33 ± 0.03 ± 0.05 |
| J1303.5−6313 | 93 | 30 | 15 | 195.876 ± 0.021 | −63.224 ± 0.023 | 0.33 ± 0.02 ± 0.01 |
| J1355.1−6420 | 84 | 41 | 11 | 208.802 ± 0.026 | −64.345 ± 0.023 | 0.41 ± 0.02 ± 0.01 |
| J1409.1−6121† | 237 | 152 | 23 | 212.285 ± 0.020 | −61.355 ± 0.022 | 0.73 ± 0.02 ± 0.06 |
| J1420.3−6047 | 77 | 32 | 26 | 215.082 ± 0.013 | −60.782 ± 0.011 | 0.12 ± 0.01 ± 0.01 |
| J1443.2−6227 | 122 | 85 | 18 | 220.797 ± 0.025 | −62.460 ± 0.024 | 0.37 ± 0.02 ± 0.01 |
| J1507.6−6228 | 104 | 34 | 17 | 226.984 ± 0.031 | −62.467 ± 0.024 | 0.36 ± 0.02 ± 0.03 |
| J1514.3−5910 | 517 | 233 | 135 | 228.572 ± 0.014 | −59.163 ± 0.012 | 0.24 ± 0.01 ± 0.01 |
| J1552.9−5610 | 435 | 142 | 39 | 238.219 ± 0.014 | −56.166 ± 0.015 | 0.25 ± 0.01 ± 0.01 |
| J1553.8−5325† | 192 | 154 | 17 | 238.456 ± 0.024 | −53.424 ± 0.026 | 0.52 ± 0.02 ± 0.09 |
| J1615.4−5153 | 302 | 242 | 79 | 243.849 ± 0.021 | −51.881 ± 0.024 | 0.41 ± 0.02 ± 0.06 |
| J1617.3−5054 | 294 | 214 | 37 | 244.328 ± 0.021 | −50.909 ± 0.019 | 0.48 ± 0.02 ± 0.01 |
| J1631.7−4756 | 31 | 16 | 9 | 247.925 ± 0.023 | −47.944 ± 0.022 | 0.26 ± 0.02 ± 0.08 |
| J1633.0−4746 | 181 | 146 | 17 | 248.259 ± 0.018 | −47.771 ± 0.025 | 0.61 ± 0.02 ± 0.12 |
| J1636.3−4731 | 71 | 17 | 8 | 249.080 ± 0.020 | −47.522 ± 0.022 | 0.14 ± 0.02 ± 0.02 |
| J1652.2−4633† | 255 | 212 | 68 | 253.055 ± 0.025 | −46.556 ± 0.022 | 0.72 ± 0.02 ± 0.04 |
| J1655.6−4738† | 46 | 27 | 2 | 253.886 ± 0.030 | −47.638 ± 0.031 | 0.33 ± 0.03 ± 0.13 |
| J1713.7−3945 | 321 | 255 | 48 | 258.433 ± 0.018 | −39.760 ± 0.019 | 0.55 ± 0.02 ± 0.01 |
| J1714.3−3823 | 139 | 46 | 44 | 258.569 ± 0.021 | −38.391 ± 0.017 | 0.26 ± 0.02 ± 0.01 |
| J1745.8−3028† | 96 | 78 | 26 | 266.453 ± 0.031 | −30.475 ± 0.028 | 0.53 ± 0.02 ± 0.26 (4/8) |
| J1800.6−2343 | 723 | 588 | 140 | 270.144 ± 0.022 | −23.716 ± 0.018 | 0.64 ± 0.01 ± 0.03 |
| J1804.8−2144 | 463 | 351 | 96 | 271.197 ± 0.017 | −21.732 ± 0.017 | 0.38 ± 0.02 ± 0.01 |
| J1825.2−1359 | 240 | 235 | 30 | 276.296 ± 0.035 | −13.992 ± 0.033 | 1.05 ± 0.02 ± 0.25 |
| J1834.8−0848 | 133 | 76 | 24 | 278.694 ± 0.020 | −8.798 ± 0.022 | 0.29 ± 0.02 ± 0.01 |
| J1834.1−0706 | 110 | 59 | 29 | 278.529 ± 0.018 | −7.109 ± 0.018 | 0.21 ± 0.02 ± 0.01 |
| J1836.5−0652 | 251 | 207 | 50 | 279.143 ± 0.032 | −6.866 ± 0.034 | 0.54 ± 0.05 ± 0.06 |
| J1839.0−0704 | 117 | 99 | 45 | 279.745 ± 0.027 | −7.067 ± 0.032 | 0.52 ± 0.02 ± 0.02 |
| J1839.4−0554 | 115 | 104 | 20 | 279.856 ± 0.024 | −5.908 ± 0.025 | 0.41 ± 0.02 ± 0.05 |
| J1841.4−0514 | 157 | 126 | 15 | 280.347 ± 0.027 | −5.235 ± 0.025 | 0.47 ± 0.02 ± 0.01 |
| J1856.3+0122 | 232 | 127 | 68 | 284.066 ± 0.023 | 1.369 ± 0.021 | 0.38 ± 0.02 ± 0.03 |
| J1857.8+0246 | 86 | 65 | 12 | 284.449 ± 0.027 | 2.774 ± 0.042 | 0.61 ± 0.03 ± 0.06 |
| J1923.3+1408 | 349 | 222 | 67 | 290.825 ± 0.012 | 14.139 ± 0.014 | 0.29 ± 0.01 ± 0.01 |
| J2020.8+4026 | 338 | 263 | 51 | 305.204 ± 0.020 | 40.443 ± 0.018 | 0.58 ± 0.01 ± 0.02 |
| J2026.1+4111 | 134 | 125 | 36 | 306.534 ± 0.041 | 41.190 ± 0.036 | 1.37 ± 0.02 ± 0.26 (6/8) |
| J2302.0+5855 | 54 | 26 | 16 | 345.494 ± 0.026 | 58.920 ± 0.023 | 0.25 ± 0.02 ± 0.01 |
Note. Results of the maximum likelihood spatial fits for LAT-detected extended sources. Column (2) lists the TS of the source assuming that it is spatially extended with a disk spatial model whose position and extension are provided in columns (5), (6) (in equatorial coordinates in J2000 epoch), and (7). Column (3) provides the  value, which is twice the logarithm of the likelihood ratio of an extended to a point source, as defined in Section 3.3. The first error on the disk extension σ is statistical, and the second is systematic. The systematic errors of three sources were computed using only a fraction of the eight alternate IEMs since the likelihood maximization had convergence problems for the other IEMs. The number of alternate diffuse models used is given in parentheses in column (7). Sources flagged with † are confused or contaminated by the diffuse background in complex regions.
Download table as: ASCIITypeset image
3.4. Spectra
The Fermi-LAT spectra of the detected extended sources were derived by  assuming the best uniform disk extension found by
  in Section 3.3. The
  analysis was used to fit the spectral parameters of each source, but also its associated TS,
  ,
,  , and
, and  . Since
  makes fewer approximations in calculating the likelihood, spectral parameters found with
  are slightly more accurate, and this cross-check is extremely useful. Only three sources were rejected at this step because they did not meet the threshold in terms of TS,
  , or
, or  :
:
- 1.The Crab Nebula, which is detected with a of 30 for an extension of 0 and 0 with . This discrepancy can be explained by the complexity of fitting the nebula simultaneously to its associated pulsar. In this case, the extension found by is not preferred by over a simple point source.
- 2.HESS J1640−465, which is detected with a of 18 for an extension of 0 and only 10 with ; Lemoine-Goumard et al. (2014) reported a Gaussian size for this source of 0 value of only 6), equivalent to a disk size of 0 and may explain the low TS value obtained in our analysis since we fixed the extension value obtained with .
- 3.An unidentified source detected at (l, b) = (292 calculated is greater than .


All TS values for the remaining 46 sources are presented in Table 1, while their spectral parameters are listed in Table 2. In addition to performing a spectral fit over the entire energy range, we computed a spectral energy distribution (SED) by fitting the flux of the source independently in four energy bins spaced uniformly in log space from 10 GeV to 2 TeV. During this fit, we fixed the spectral index of the source at 2, as well as the model of background sources to the best fit obtained in the whole energy range except the Galactic diffuse background and the prefactor of sources closer than 5°. We defined a detection in an energy bin when TS  and otherwise computed a 95% confidence level flux upper limit. The upper limit is obtained by looking for 2Δln(likelihood) = 4 when increasing the flux from the maximum likelihood value if the TS value of the source is larger than 1. Whenever TS < 1, we switched to the Bayesian method proposed by Helene (1983).
Table 2. Best-fit Spectral Parameters for the Extended Sources Detected above 10 GeV
| FGES Name |

|
Spectral | Flux | Spectral |
|---|---|---|---|---|
| Form | (× 10−10 cm−2 s−1) | Index | ||
| J0427.2+5533 | 1 | PL | 6.67 ± 0.64 ± 0.20 | 1.91 ± 0.09 ± 0.02 |
| J0537.6+2751 | 2 | PL | 3.15 ± 0.62 ± 0.60 | 2.10 ± 0.17 ± 0.05 |
| J0617.2+2235 | 1 | PL | 23.43 ± 1.18 ± 0.20 | 2.55 ± 0.08 ± 0.03 |
| J0619.6+2229 | 3 | PL | 4.30 ± 0.69 ± 0.09 | 2.08 ± 0.15 ± 0.08 |
| J0822.1−4253 | 1 | PL | 6.59 ± 0.57 ± 0.09 | 2.40 ± 0.12 ± 0.02 |
| J0830.3−4453 | 1 | PL | 1.89 ± 0.34 ± 0.09 | 2.80 ± 0.30 ± 0.08 |
| J0832.0−4549 | 1 | PL | 2.72 ± 0.48 ± 0.12 | 1.80 ± 0.14 ± 0.13 |
| J0851.9−4620 | 8 | PL | 17.23 ± 1.14 ± 1.10 | 1.83 ± 0.03 ± 0.07 |
| J1023.3−5747 | 1 | PL | 4.23 ± 0.50 ± 0.32 | 2.26 ± 0.15 ± 0.02 |
| J1036.3−5834† | 11 | PL | 29.11 ± 1.88 ± 1.77 | 2.08 ± 0.06 ± 0.07 |
| J1109.4−6115† | 2 | PL | 10.58 ± 1.02 ± 0.63 | 2.14 ± 0.09 ± 0.04 |
| J1213.3−6240 | 1 | PL | 3.37 ± 0.45 ± 0.07 | 2.53 ± 0.20 ± 0.02 |
| J1303.5−6313 | 5 | PL | 3.52 ± 0.50 ± 0.51 | 1.81 ± 0.11 ± 0.04 |
| J1355.1−6420 | 4 | PL | 1.78 ± 0.32 ± 0.20 | 1.44 ± 0.12 ± 0.29 |
| J1409.1−6121† | 2 | PL | 16.45 ± 1.24 ± 1.02 | 2.38 ± 0.10 ± 0.02 |
| J1420.3−6047 | 3 | PL | 3.19 ± 0.43 ± 0.68 | 1.92 ± 0.12 ± 0.03 |
| J1443.2−6227 | 2 | PL | 2.46 ± 0.30 ± 0.09 | 1.75 ± 0.08 ± 0.10 |
| J1507.6−6228 | 1 | PL | 2.28 ± 0.28 ± 0.36 | 1.98 ± 0.09 ± 0.17 |
| J1514.3−5910 | 3 | PL | 7.69 ± 0.50 ± 0.17 | 1.97 ± 0.05 ± 0.06 |
| J1552.9−5610 | 2 | PL | 5.95 ± 0.51 ± 0.03 | 2.44 ± 0.12 ± 0.04 |
| J1553.8−5325† | 4 | PL | 11.75 ± 1.01 ± 0.24 | 2.45 ± 0.12 ± 0.01 |
| J1615.4−5153 | 5 | PL | 9.88 ± 0.79 ± 1.26 | 2.02 ± 0.08 ± 0.03 |
| J1617.3−5054 | 2 | PL | 14.70 ± 1.06 ± 0.32 | 2.08 ± 0.07 ± 0.01 |
| J1631.7−4756 | 2 | PL | 4.19 ± 0.84 ± 0.37 | 1.74 ± 0.12 ± 0.12 |
| J1633.0−4746 | 2 | PL | 18.51 ± 0.14 ± 0.37 | 2.25 ± 0.01 ± 0.10 |
| J1636.3−4731 | 1 | PL | 4.30 ± 0.17 ± 1.44 | 2.73 ± 0.04 ± 0.05 |
| J1652.2−4633† | 1 | PL | 11.95 ± 0.97 ± 1.74 | 2.07 ± 0.08 ± 0.03 |
| J1655.6−4738† | 6 | PL | 2.11 ± 0.41 ± 0.11 | 2.31 ± 0.22 ± 0.16 |
| J1713.7−3945 | 10 | PL | 11.69 ± 0.91 ± 0.86 | 1.85 ± 0.07 ± 0.02 |
| J1714.3−3823 | 2 | PL | 6.08 ± 0.68 ± 0.70 | 2.41 ± 0.15 ± 0.08 |
| J1745.8−3028† | 2 | PL | 7.53 ± 0.92 ± 0.71 | 2.09 ± 0.13 ± 0.03 |
| J1800.6−2343 | 2 | PL | 27.47 ± 1.08 ± 0.71 | 2.42 ± 0.04 ± 0.03 |
| J1804.8−2144 | 7 | PL | 15.55 ± 0.62 ± 0.60 | 1.99 ± 0.04 ± 0.05 |
| J1825.2−1359 | 21 | LogP | 19.59 ± 0.14 ± 0.22 | 1.30 ± 0.10 ± 0.40 |
| J1834.8−0848 | 4 | PL | 7.43 ± 0.79 ± 0.12 | 2.04 ± 0.09 ± 0.03 |
| J1834.1−0706 | 1 | PL | 5.37 ± 0.66 ± 0.78 | 2.28 ± 0.14 ± 0.04 |
| J1836.5−0652 | 9 | PL | 17.98 ± 1.31 ± 1.72 | 2.10 ± 0.07 ± 0.03 |
| J1839.0−0704 | 11 | PL | 9.02 ± 0.99 ± 0.39 | 1.90 ± 0.08 ± 0.07 |
| J1839.4−0554 | 1 | PL | 8.39 ± 0.94 ± 0.81 | 1.98 ± 0.09 ± 0.04 |
| J1841.4−0514 | 4 | PL | 9.48 ± 0.91 ± 0.92 | 2.03 ± 0.09 ± 0.06 |
| J1856.3+0122 | 1 | PL | 10.44 ± 0.92 ± 1.33 | 3.17 ± 0.20 ± 0.14 |
| J1857.8+0246 | 2 | PL | 7.83 ± 1.01 ± 1.39 | 2.02 ± 0.11 ± 0.26 |
| J1923.3+1408 | 1 | PL | 12.52 ± 0.97 ± 0.97 | 2.46 ± 0.11 ± 0.17 |
| J2020.8+4026 | 1 | PL | 13.22 ± 0.81 ± 0.29 | 2.15 ± 0.07 ± 0.02 |
| J2026.1+4111 | 7 | PL | 15.80 ± 1.32 ± 5.73 | 2.38 ± 0.10 ± 0.10 |
| J2302.0+5855 | 1 | PL | 1.26 ± 0.25 ± 0.04 | 2.03 ± 0.20 ± 0.04 |
Note. Results of the maximum likelihood spectral fits for LAT-detected extended sources. These results are obtained assuming the best disk parameters reported in Table 1. Columns (2), (4), and (5) report  , the integrated flux, and the photon index of the source fit in the energy range from 10 GeV to 2 TeV. The first error on the integrated flux and photon index is statistical, and the second is systematic. Column (3) lists the spectral form used (PL = power law, LogP = LogParabola). J1825.2−1359 is the only source modeled with a LogP, and its associated beta value is 0.27 ± 0.05 ± 0.07. Sources flagged with † are confused or contaminated by the diffuse background in complex regions.
Download table as: ASCIITypeset image
3.5. Systematic Errors
Three main systematic uncertainties can affect the extension fit and the spectra of the detected extended sources: uncertainties in our model of the Galactic diffuse emission, uncertainties on the shape of the extended source, and uncertainties in our knowledge of the Fermi-LAT IRFs. This last contribution was estimated using custom IRFs chosen to maximize and minimize effective area and PSF within their systematic uncertainty bands.62 Then, to explore the systematic effects on our sources’ fitted properties caused by interstellar emission modeling, we have followed the prescription developed in Acero et al. (2016b). Each extended source was refit using eight alternate interstellar emission models (IEMs), and for each fitted parameter P (namely, the disk extension, the integrated flux above 10 GeV, and the spectral index), we obtained a set of eight values Pi that we compared to the value obtained with the standard model PSTD following Equation (5) in Acero et al. (2016b). The corresponding systematic error for each source and for these three parameters is reported in Tables 1 and 2. We encountered convergence issues when fitting the extension of three sources with a fraction of the eight alternate diffuse models: the source at the Galactic center FGES J1745.8−3028, the Cygnus cocoon FGES J2026.1+4111, and FGES J0832.0−4549 in the region of Vela-X. The number of alternate diffuse models used is written in parentheses in column (7) of Table 1 for these three cases. Finally, as noted above, the imperfect knowledge of the true γ-ray morphology introduces a last source of error. To provide a feeling of the influence of the assumed source shape, we refitted all sources using a 2D Gaussian model. This spatial model does not offer a good representation for shell-type SNRs such as RX J1713.7−3946 but is well adapted to PWN-type sources for which the γ-ray signal is expected to be visible up to large distances. Table 3 gives the morphological and spectral parameters of this Gaussian fit. Please note that all errors are statistical only since this table is only provided as a cross-check. It is clear from this table that the majority of the extended sources are very stable with respect to the assumed shape except confused sources and/or very large sources.
Table 3. Best-fitting Morphological and Spectral Parameters for the Systematic Study Using a Gaussian Fit
| FGES Name | R.A. | Decl. | σ | Flux | Spectral Index |
|---|---|---|---|---|---|
| (deg) | (deg) | (deg) | (× 10−10 cm−2 s−1) | ||
| J0427.2+5533 | 66.95 ± 0.11 | 55.35 ± 0.10 | 0.92 ± 0.03 | 8.16 ± 0.76 | 1.93 ± 0.08 |
| J0537.6+2751 | 84.41 ± 0.18 | 27.76 ± 0.15 | 0.71 ± 0.09 | 2.74 ± 0.53 | 2.03 ± 0.09 |
| J0617.2+2235 | 94.31 ± 0.01 | 22.57 ± 0.01 | 0.18 ± 0.01 | 24.05 ± 1.26 | 2.56 ± 0.08 |
| J0619.6+2229 | 94.56 ± 0.07 | 22.53 ± 0.07 | 0.54 ± 0.05 | 4.45 ± 0.85 | 2.01 ± 0.15 |
| J0822.1−4253 | 125.65 ± 0.03 | −42.88 ± 0.02 | 0.24 ± 0.02 | 6.97 ± 0.58 | 2.38 ± 0.06 |
| J0830.3−4453 | 127.65 ± 0.04 | −44.88 ± 0.04 | 0.17 ± 0.03 | 2.14 ± 0.54 | 2.85 ± 0.06 |
| J0832.0−4549 | 127.97 ± 0.07 | −45.81 ± 0.07 | 0.48 ± 0.04 | 4.12 ± 0.57 | 1.90 ± 0.05 |
| J0851.9−4620 | 132.86 ± 0.05 | −46.34 ± 0.05 | 0.72 ± 0.03 | 20.29 ± 1.51 | 1.85 ± 0.02 |
| J1023.3−5747 | 155.84 ± 0.02 | −57.75 ± 0.02 | 0.16 ± 0.02 | 4.86 ± 0.53 | 2.23 ± 0.10 |
| J1036.3−5834† | 158.94 ± 0.06 | −58.77 ± 0.06 | 1.57 ± 0.06 | 36.27 ± 2.57 | 2.10 ± 0.04 |
| J1109.4−6115† | 166.90 ± 0.08 | −61.20 ± 0.07 | 0.88 ± 0.05 | 14.46 ± 1.17 | 2.17 ± 0.04 |
| J1213.3−6240 | 183.28 ± 0.03 | −62.69 ± 0.03 | 0.18 ± 0.02 | 3.83 ± 0.50 | 2.60 ± 0.16 |
| J1303.5−6313 | 195.84 ± 0.03 | −63.20 ± 0.03 | 0.19 ± 0.02 | 4.02 ± 0.55 | 1.81 ± 0.10 |
| J1355.1−6420 | 208.75 ± 0.03 | −64.44 ± 0.03 | 0.22 ± 0.03 | 1.80 ± 0.24 | 1.44 ± 0.03 |
| J1409.1−6121† | 212.37 ± 0.030 | −61.31 ± 0.03 | 0.51 ± 0.02 | 20.63 ± 1.52 | 2.36 ± 0.09 |
| J1420.3−6047 | 215.07 ± 0.02 | −60.77 ± 0.02 | 0.11 ± 0.02 | 4.54 ± 0.26 | 1.99 ± 0.08 |
| J1443.2−6227 | 220.80 ± 0.03 | −62.41 ± 0.03 | 0.19 ± 0.02 | 2.46 ± 0.21 | 1.72 ± 0.04 |
| J1507.6−6228 | 226.92 ± 0.04 | −62.44 ± 0.04 | 0.25 ± 0.04 | 2.41 ± 0.27 | 2.03 ± 0.03 |
| J1514.3−5910 | 228.55 ± 0.01 | −59.17 ± 0.01 | 0.13 ± 0.01 | 7.68 ± 0.51 | 1.97 ± 0.02 |
| J1552.9−5610 | 238.18 ± 0.02 | −56.18 ± 0.02 | 0.14 ± 0.01 | 6.01 ± 0.51 | 2.43 ± 0.11 |
| J1553.8−5325† | 238.50 ± 0.03 | −53.44 ± 0.03 | 0.35 ± 0.02 | 15.43 ± 1.22 | 2.41 ± 0.10 |
| J1615.4−5153 | 243.77 ± 0.03 | −51.86 ± 0.03 | 0.34 ± 0.03 | 12.72 ± 0.98 | 2.00 ± 0.07 |
| J1617.3−5054 | 244.27 ± 0.03 | −50.93 ± 0.02 | 0.30 ± 0.01 | 17.22 ± 1.22 | 2.12 ± 0.07 |
| J1631.7−4756 | 247.96 ± 0.03 | −47.98 ± 0.03 | 0.14 ± 0.03 | 5.61 ± 0.34 | 1.82 ± 0.12 |
| J1633.0−4746 | 248.40 ± 0.03 | −47.71 ± 0.03 | 0.44 ± 0.03 | 22.13 ± 1.77 | 2.28 ± 0.03 |
| J1636.3−4731 | 250.16 ± 0.04 | −46.57 ± 0.04 | 0.05 ± 0.01 | 5.22 ± 0.45 | 2.02 ± 0.02 |
| J1652.2−4633† | 253.09 ± 0.01 | −46.50 ± 0.01 | 0.48 ± 0.03 | 15.32 ± 1.02 | 2.08 ± 0.02 |
| J1655.6−4738† | 253.93 ± 0.06 | −47.65 ± 0.06 | 0.29 ± 0.06 | 2.48 ± 0.45 | 2.31 ± 0.07 |
| J1713.7−3945 | 258.39 ± 0.03 | −39.82 ± 0.03 | 0.41 ± 0.01 | 14.11 ± 1.14 | 1.91 ± 0.06 |
| J1714.3−3823 | 258.57 ± 0.02 | −38.42 ± 0.02 | 0.14 ± 0.02 | 6.46 ± 0.71 | 2.42 ± 0.11 |
| J1745.8−3028† | 266.52 ± 0.04 | −30.43 ± 0.04 | 0.26 ± 0.02 | 7.29 ± 0.87 | 2.09 ± 0.06 |
| J1800.6−2343 | 270.17 ± 0.02 | −23.73 ± 0.02 | 0.37 ± 0.02 | 30.55 ± 1.17 | 2.41 ± 0.04 |
| J1804.8−2144 | 271.20 ± 0.02 | −21.74 ± 0.02 | 0.24 ± 0.02 | 17.76 ± 0.96 | 2.01 ± 0.02 |
| J1825.2−1359 | 276.33 ± 0.05 | −13.97 ± 0.05 | 0.79 ± 0.04 | 29.45 ± 1.99 | 1.54 ± 0.08 |
| J1834.8−0848 | 278.67 ± 0.02 | −8.78 ± 0.03 | 0.15 ± 0.02 | 8.15 ± 0.84 | 2.04 ± 0.06 |
| J1834.1−0706 | 278.53 ± 0.02 | −7.11 ± 0.02 | 0.15 ± 0.02 | 5.10 ± 0.77 | 2.39 ± 0.11 |
| J1836.5−0652 | 279.10 ± 0.03 | −6.87 ± 0.03 | 0.38 ± 0.02 | 23.30 ± 1.73 | 2.12 ± 0.05 |
| J1839.0−0704 | 279.75 ± 0.04 | −7.04 ± 0.04 | 0.37 ± 0.03 | 9.13 ± 1.18 | 1.94 ± 0.06 |
| J1839.4−0554 | 279.90 ± 0.03 | −5.90 ± 0.03 | 0.25 ± 0.02 | 9.02 ± 1.05 | 2.03 ± 0.06 |
| J1841.4−0514 | 280.31 ± 0.04 | −5.22 ± 0.03 | 0.31 ± 0.03 | 10.90 ± 1.09 | 2.04 ± 0.07 |
| J1856.3+0122 | 283.99 ± 0.02 | 1.42 ± 0.02 | 0.21 ± 0.02 | 11.17 ± 0.98 | 3.17 ± 0.20 |
| J1857.8+0246 | 284.40 ± 0.04 | 2.80 ± 0.04 | 0.32 ± 0.03 | 8.25 ± 0.98 | 2.02 ± 0.07 |
| J1923.3+1408 | 290.81 ± 0.01 | 14.14 ± 0.01 | 0.17 ± 0.01 | 13.17 ± 1.05 | 2.54 ± 0.12 |
| J2020.8+4026 | 305.21 ± 0.02 | 40.46 ± 0.02 | 0.35 ± 0.01 | 16.34 ± 1.03 | 2.21 ± 0.03 |
| J2026.1+4111 | 307.16 ± 0.07 | 41.45 ± 0.07 | 1.29 ± 0.06 | 35.95 ± 2.59 | 2.40 ± 0.03 |
| J2302.0+5855 | 345.53 ± 0.03 | 58.89 ± 0.03 | 0.14 ± 0.02 | 1.32 ± 0.27 | 2.05 ± 0.17 |
Note. Results of the maximum likelihood spatial and spectral fits for LAT-detected extended sources using a Gaussian spatial model. The position and extension of the Gaussian are provided in columns (2), (3) (in equatorial coordinates in J2000 epoch), and (4). The error quoted is only statistical. The sigma value for a disk is expected to be a factor of 1.85 larger than the sigma for a 2D Gaussian fit to the same source (Lande et al. 2012). J1825.2−1359 is the only source modeled with a LogP, and its associated beta value is 0.23 ± 0.05. Sources flagged with  are confused or contaminated by the diffuse background in complex regions.
Download table as: ASCIITypeset image
4. Discussion
We detected 46 statistically significant spatially extended Fermi-LAT γ-ray sources, as well as 162 pointlike sources in the  latitude range, as can be seen in Figure 1. The results of the spatial and spectral analyses for the extended sources are shown in Tables 1 and 2. Among these extended sources, 16 are new, 13 are in agreement with previous publications, and 17 have a different morphology (we defined the criterion for significant difference with respect to previously published values as
  , σ being the uncertainty on the parameter of interest). In the latitude interval covered by our search, only four Galactic sources already detected as significantly extended in previous works are not detected in this work: HB21, HB3, HB9, and W3. These four sources are also not detected in the 3FHL catalog (Fermi LAT Collaboration 2017) using their associated morphological templates.
4.1. Agreement with Previous Publications
The 13 sources in agreement with previous publications are as follows.
- 1.FGES J0617.2+2235 (associated with the SNR IC 443),
- 2.FGES J0851.9−4620 (associated with the SNR Vela Junior),
- 3.FGES J0822.1−4253 (associated with Puppis A),
- 4.FGES J1303.5−6313 (associated with HESS J1303−631),
- 5.FGES J1355.1−6420 (associated with the PWN HESS J1356−645),63
- 6.FGES J1443.2−6227 (associated with the SNR RCW 86),
- 7.FGES J1514.3−5910 (associated with MSH 15−52),
- 8.FGES J1552.9−5610 (associated with MSH 15−56),
- 9.FGES J1615.4−5153 (associated with HESS J1614−518),
- 10.FGES J1713.7−3945 (associated with the SNR RX J1713.7−3946),
- 11.FGES J1834.8−0848 (associated with W41),
- 12.FGES J1834.1−0706 (associated with the SNR G24.7+0.6),
- 13.FGES J2020.8+4026 (associated with γ Cygni).
Figures 3–6 (top) provide the background-subtracted TS maps (i.e., TS maps with all components other than the source included in the model) and SEDs for eight that are detected at TeV energies, showing an excellent agreement with the results obtained by the H.E.S.S. experiment. The complete shells of RX J1713.7−3946 and Vela Junior appear in the background-subtracted TS maps, while RCW 86 presents a brighter emission on the northern part of the remnant where fast shocks and a low-density medium have been measured by Vink et al. (2006), Helder et al. (2009), and Yamaguchi et al. (2008). The GeV extension of the PWN HESS J1303−631 seems to be in slight disagreement with the previously published value; however, it is consistent within the large uncertainties of  derived at that time with only 45 months of data. The region including FGES J1834.1−0706 (close to the H.E.S.S. source HESS J1837−069) is described in Section 4.2.4, while the region of the SNR IC 443 and its surroundings is discussed in Section 4.3.
- 1.The SNR γ Cygni (FGES J2020.8+4026): γ Cygni (SNR G78.2+2.1) is a nearby (∼1.7 kpc) middle-aged SNR already detected by Fermi-LAT in different energy bands (Ackermann et al. 2016; Acero et al. 2016b). Our analysis is in perfect agreement with previous publications of the SNR. It still shows a much higher flux in comparison to the TeV signal detected by VERITAS from VER J2019+407 above 300 GeV, as can be seen in Figure 6 (bottom left). The TeV signal is more compact (Figure 5, middle and right) and coincides with the brightest part of the northern radio shell, opposite to molecular material locations (Aliu et al. 2013). VER J2019+407's nature and relationship to the emission detected by Fermi-LAT thus remain unclear and extremely puzzling since VERITAS should in principle see emission from the majority of the SNR according to the new spectrum derived in this analysis for a uniform disk encompassing the whole shell, as already stated by Weinstein (2015). Interestingly, a recent publication by Fraija & Araya (2016) shows that the Fermi-LAT spectrum on VER J2019+407 alone is harder than the rest of the shell, with indices 1.8 below a break energy of 71 GeV and 2.5 above the break. A detailed spectrally resolved morphological analysis of the Fermi-LAT emission is required to better constrain the model parameters and the nature of the radiation.
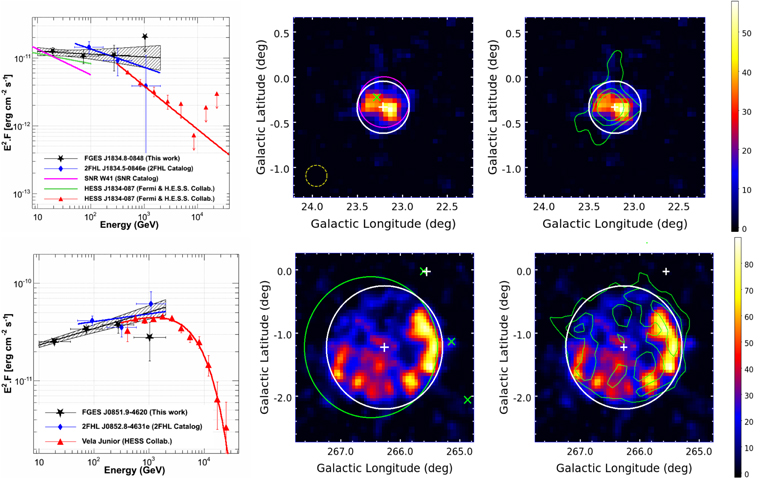
Figure 3. Spectral (left) and spatial (middle and right) properties of the extended sources associated with W41 (top) and the SNR Vela Junior (bottom). Left: SEDs with data points from this analysis (black stars and dashed butterfly), from the SNR catalog (purple line; Acero et al. 2016b), from the 2FHL catalog (blue diamonds and line), from a previous Fermi-LAT publication (green line; H.E.S.S. Collaboration et al. 2015), and from IACT data (red triangles and line; H.E.S.S. Collaboration et al. 2015; Aharonian et al. 2007c, for W41 and Vela Junior, respectively). Middle: background-subtracted TS map with the Galactic diffuse and isotropic emission and surrounding point sources included in the model to highlight the location of emission coming from the extended source. White circles and central plus signs indicate the disk extension and centroid as fit in this work, respectively. Green and purple markings present the position of pointlike and extended sources published in the 3FGL and 2FHL catalogs, respectively. The yellow dashed circle in the bottom left corner of the top middle panel illustrates the PSF size of the instrument for the analysis carried out in this article. Right: same TS map, but with IACT contours (green, from the above-quoted references) overlaid.
Download figure:
Standard image High-resolution image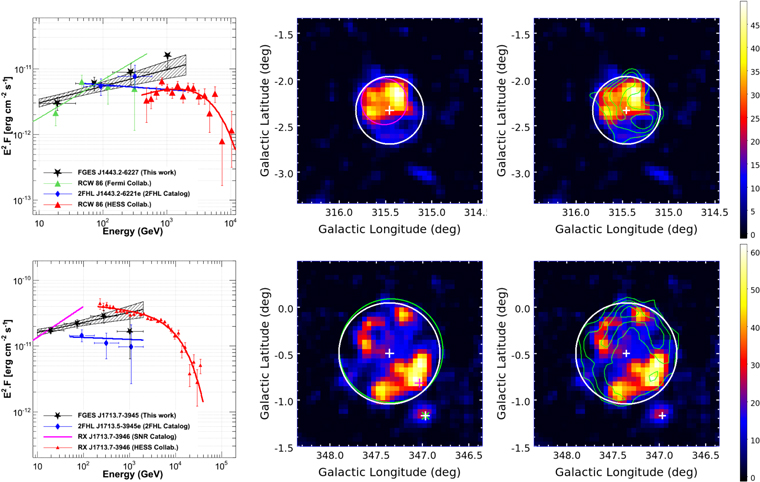
Figure 4. Extended sources associated with the SNR RCW 86 (top) and RX J1713.7−3946 (bottom) following conventions of Figure 3 and identical references for the 2FHL and SNR catalogs. Left: SEDs of the extended sources with data points from this analysis (black stars and dashed butterfly), from the SNR catalog (purple line), from the 2FHL catalog (blue diamonds and line), from a previous Fermi-LAT publication (green triangles and line; Ajello et al. 2016), and from IACT data (red triangles and line; Aharonian et al. 2009, 2007b, for RCW 86 and RX J1713.7−3946, respectively). Middle and right: background-subtracted TS maps using the same conventions as in Figure 3 and above-quoted references for the IACT contours shown in green. White circles and central plus signs indicate the disk extension and centroid as fit in this work, respectively. In the top middle panel, the gray circle corresponds to the extension found in Ajello et al. (2016).
Download figure:
Standard image High-resolution image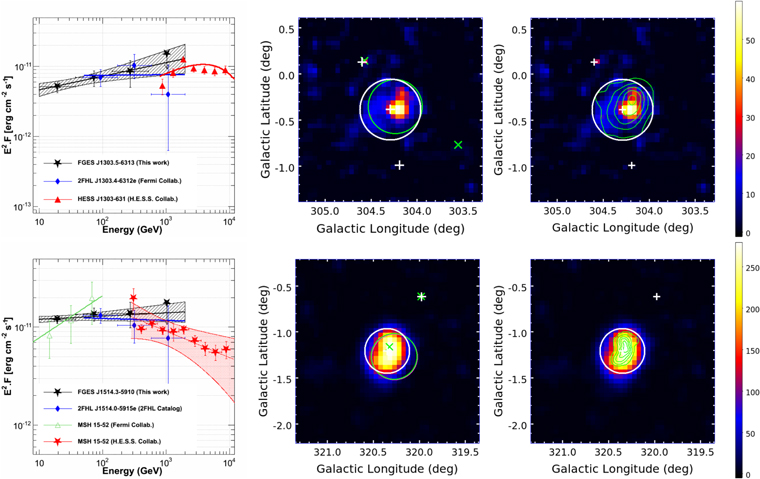
Figure 5. Extended sources associated with the PWNe HESS J1303−631 (top) and MSH 15−52 (bottom) following conventions of Figure 3. Left: SEDs of the extended sources with data points from this analysis (black stars and dashed butterfly), from the 2FHL catalog (blue diamonds), and from IACT data (red line; H.E.S.S. Collaboration et al. 2012; Aharonian et al. 2005, for HESS J1303−631 and MSH 15−52, respectively). Middle and right: background-subtracted TS maps using the same conventions as in Figure 3 and above-quoted references for the IACT contours shown in green. White circles and central plus signs indicate the disk extension and centroid as fit in this work, respectively.
Download figure:
Standard image High-resolution image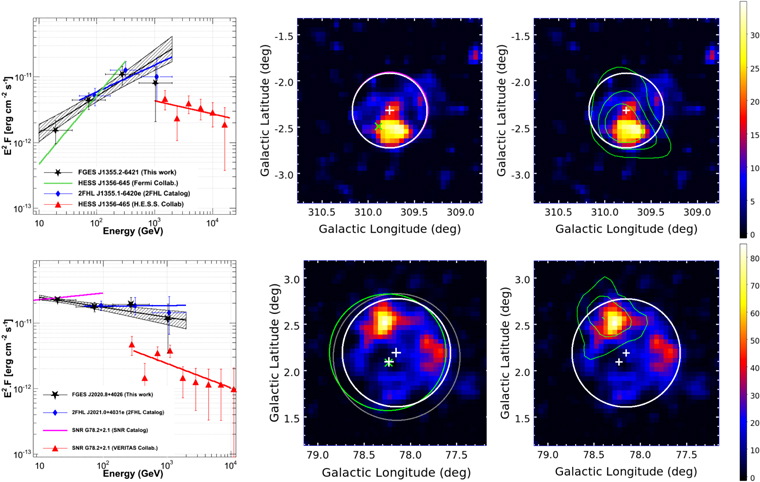
Figure 6. Extended sources associated with the PWN HESS J1356−645 (top) and the SNR γ Cygni (bottom) following conventions of Figure 3. Left: SEDs with data points from this analysis (black stars and dashed butterfly), from the 2FHL catalog (blue diamonds and line), from a previous Fermi-LAT publication (in green; Acero et al. 2013), and from IACT data (red triangles and line; H.E.S.S. Collaboration et al. 2011a; Aliu et al. 2013, for HESS J1356−645 and γ Cygni, respectively). Middle and right: background-subtracted TS maps using the same conventions as in Figure 3 and above-quoted references for the IACT contours shown in green and SNR catalog disk size in gray (bottom). White circles and central plus signs indicate the disk extension and centroid as fit in this work, respectively.
Download figure:
Standard image High-resolution image4.2. Differences with Previous Publications
Differences between this work and previous publications can be explained in four ways: use of a different morphological template to model the extended source, use of a different energy threshold, improvements in analysis methods and/or increased statistics, and ambiguities from source confusion and contamination.
4.2.1. Effect of the Morphological Template
Previous publications on Fermi-LAT sources used various spatial templates other than a uniform disk: Gaussian, elliptical disk, elliptical Gaussian, or templates derived from multiwavelength data. For this reason, it is not a surprise that the results presented in this work differ for such sources.
- 1.HESS J1841−055 (FGES J1839.4−0554 and FGES J1841.4−0514): The highly extended TeV source HESS J1841−055, discovered during the H.E.S.S. Galactic Plane Survey (Aharonian et al. 2008), was previously analyzed assuming the published morphology, an elliptical Gaussian with extensions of 0
- 2.The region of Vela-X (FGES J0830.3−4453 and FGES J0832.0−4549): The detection of the Vela-X PWN was reported by Fermi-LAT in the first year of the mission and then re-investigated using 4 yr of data, showing that it is best described by an elliptical distribution (Gaussian or disk; Grondin et al. 2013). This analysis also reported the detection of a significant energy break at ∼2 GeV in the Fermi-LAT spectrum, as well as a marginal spectral difference between the northern and the southern sides of the elliptical Gaussian. In our new analysis two sources are detected in coincidence with Vela-X (FGES J0830.3−4453 and FGES J0832.0−4549), as can be seen in Figure 8 (right). FGES J0832.0−4549, which is close to the cocoon as seen by H.E.S.S., has a harder spectrum consistent with the TeV points, while FGES J0830.3−4453 has a softer spectrum, in agreement with the spectrum derived for the whole elliptical Gaussian in the former Fermi-LAT study.
- 3.W44 (FGES J1856.3+0122): Several analyses of the middle-aged remnant W44 were performed in the GeV energy range by Fermi-LAT and AGILE. First, using 1 yr of Fermi-LAT data, Abdo et al. (2010a) showed that the γ-ray source is best fit by an elliptical ring in perfect coincidence with the shell, implying that the emission is produced by particles accelerated there. Then, Uchiyama et al. (2012) announced the detection of significant emission, from the surrounding MC complex, produced by CRs that have escaped from W44. Finally, Giuliani et al. (2011) and Ackermann et al. (2013b) detected the characteristic pion-decay feature in the γ-ray spectra of W44, providing the first direct evidence that CR protons are accelerated in this shell. The use of a uniform disk in our analysis is therefore a clear simplification with respect to previous work. However, the spectrum derived is in good agreement with previous measurements showing that the bulk of the γ-ray emission is well taken into account.
- 4.W51C (FGES J1923.3+1408): W51C is another middle-aged remnant known to be interacting with an MC. The γ-ray emission is spatially extended and best fit with an elliptical disk in agreement with the radio and X-ray extent of SNR W51C (Abdo et al. 2009). Recently, Jogler & Funk (2016) re-investigated the spectrum of the source down to 60 MeV and revealed a clear break at 290 MeV associated with the energy threshold of production. This result makes W51C the third unambiguously identified CR accelerating SNR. Although the uniform disk does not perfectly reproduce the γ-ray morphology from this SNR, the spectrum is in good agreement with the previously published values.
- 5.Cygnus cocoon (FGES J2026.1+4111): Using 2 yr of Fermi-LAT data, Ackermann et al. (2011a) found a large excess of hard emission extending far beyond the sizes of Cyg OB2 and γ Cygni, and following the regions bounded by photon-dominated regions as in a cocoon. The γ-ray emission peaks toward massive-star clusters and toward the southernmost MC and is well fit by a Gaussian of 2
- 6.The SNR S147 (FGES J0537.6+2751): This SNR, located toward the Galactic anticenter, is one of the most evolved SNRs in our Galaxy. No X-ray emission has been reported to date from this region, nor any TeV emission. Using 31 months of Fermi-LAT data, Katsuta et al. (2012) reported the detection of a spatially extended γ-ray source coinciding with the SNR, with an apparent spatial correlation with prominent Hα filaments of S147. Again, a simple disk might not be ideal to reproduce perfectly the morphology of this source, or the difference could be due to energy dependence as for W30 (see below).

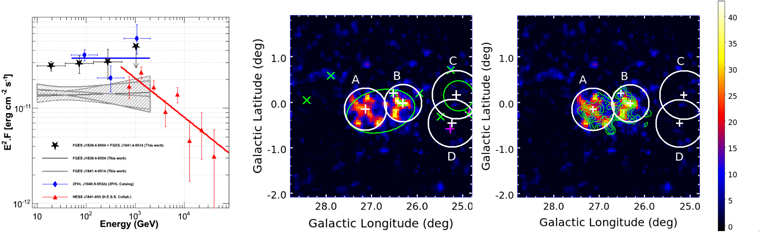
Figure 7. Left: SEDs of the unidentified source HESS J1841−055 with data points from this analysis (black and gray dashed butterflies for FGES J1839.4−0554 and FGES J1841.4−0514, respectively), from the 2FHL catalog (blue diamonds and line), and from IACT data (red line; Aharonian et al. 2008). The black stars represent the sum of the emission of the two coincident extended sources obtained from this analysis. Middle and right: background-subtracted TS maps of HESS J1841−055 using the same conventions as in Figure 3 and above-quoted references for the IACT contours shown in green. White circles and central plus signs indicate the disk extension and centroid as fit in this work, respectively. The letters A, B, C, and D indicate the FGES sources FGES J1841.4−0514, FGES J1839.4−0554, FGES J1836.5−0652, and FGES J1839.0−0704, respectively.
Download figure:
Standard image High-resolution image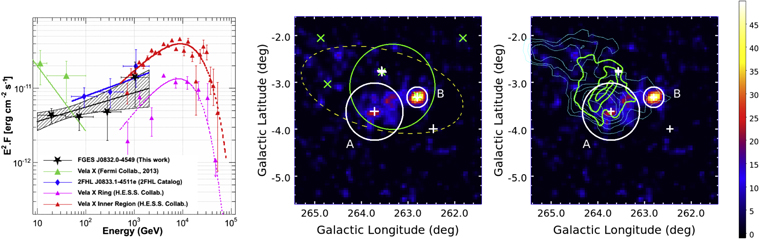
Figure 8. Left: SEDs of the pulsar wind nebula Vela-X with data points from this analysis (black stars and dashed butterfly), from the 2FHL catalog (blue diamonds and line), from a previous Fermi-LAT publication (green triangles and line; Grondin et al. 2013), and from IACT data (dotted red and dashed pink lines for the inner and outer emissions, respectively; Abramowski et al. 2012). Middle and right: background-subtracted TS maps of Vela-X using the same conventions as in Figure 3 and above-quoted references for the TeV contours shown in green. Middle: the extent of Vela-X (fit as an elliptical Gaussian) presented in the previous publication is shown with a yellow dashed ellipse. Right: the contours of the radio and IACT emission are shown in cyan (Grondin et al. 2013) and green, respectively. White circles and plus signs indicate the disk extension and centroid fit in this work, respectively, for Vela-X (FGES J0832.0−4549 labeled as A), as well as for the nearby source FGES J0830.3−4453 (labeled as B).
Download figure:
Standard image High-resolution image4.2.2. Energy Dependence
- 1.The star-forming region W30 (FGES J1804.8−2144): The case of the middle-aged SNR G8.7−0.1 located within the star-forming region W30 very well highlights the effect of energy dependence. Using 23 months of Fermi-LAT data, Ajello et al. (2012) detected an extended source with most of its emission in positional coincidence with the SNR G8.7−0.1 and a lesser part located outside the western boundary of G8.7−0.1. The best fit of the source morphology above 2 GeV was obtained for a disk of radius 0
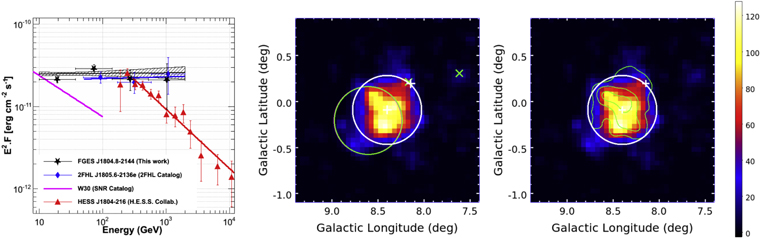
Figure 9. Left: SEDs of the star-forming region W30 by combining data from this analysis (black stars and dashed butterfly), from the 2FHL catalog (blue diamonds and line), from the SNR catalog (purple line), and from IACT (red triangles and line; Aharonian et al. 2006a). Middle and right: background-subtracted TS maps of W30 using the same conventions as in Figure 3 and above-quoted references for the IACT contours shown in green. The white circle indicates the disk extension fit in this work.
Download figure:
Standard image High-resolution image4.2.3. Improved Analyses and Increased Statistics
- 1.SNR G150.3+4.5 (FGES J0427.2+5533): The search for extended sources performed for the 2FHL catalog allowed the detection of an extended source coincident with the northern side of the faint radio SNR G150.3+4.5 (Gao & Han 2014). Our new analysis confirms the detection of this extended source, and thanks to the increased statistics, the Fermi-LAT source now perfectly matches the size and location of the radio SNR, as can be seen in Figure 10. The hard spectrum of this SNR derived here from 10 GeV up to 2 TeV, with, is more similar to that of young shell-type remnants, while its large size and faintness would suggest an old age. A deeper analysis, especially using Fermi-LAT data down to 100 MeV and IACT data above 2 TeV, would help to constrain the characteristics of this SNR.

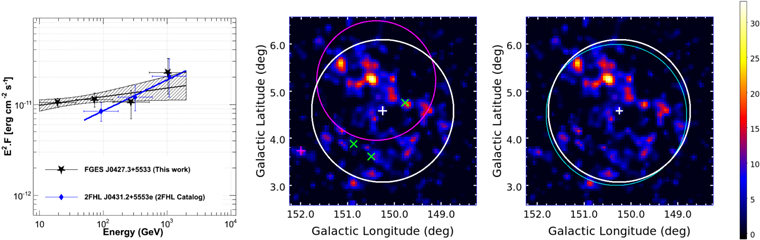
Figure 10. Left: SEDs of the SNR G150.3+4.5 with data points from this analysis (black stars and dashed butterfly) and from the 2FHL catalog (blue diamonds and line). Middle and right: background-subtracted TS maps of SNR G150.3+4.5 using the same conventions as in Figure 3. The white circle and central plus sign indicate the disk extension and centroid as fit in this work, respectively. Right: the radio extent of the SNR is shown in cyan (Gao & Han 2014).
Download figure:
Standard image High-resolution image4.2.4. Source Confusion
Two different cases of source confusion can occur: either our extended source of interest is very close to a point source, or it is near another extended source. In such cases, the morphological fit is complex. Despite the iterative nature of our pipelines, they sometimes fail in being able to fit two nearby sources at the same time, particularly if one source is much fainter than the other.
- 1.The middle-aged SNR W28 (FGES J1800.6−2343): In the case of W28, significant γ-ray emission spatially coincident with the SNR W28 and the three nearby TeV sources HESS J1800−240A, B, and C plus another point source were detected in Hanabata et al. (2014) using 4 yr of Fermi-LAT data. The best fit of the emission coincident with W28 was obtained with a disk of 0
- 2.The region of HESS J1616−508 (FGES J1617.3−5054): This TeV source was detected during the H.E.S.S. Galactic Plane Survey (Aharonian et al. 2006a). It lies in a complex region with two SNRs RCW 103 (G332.4−0.4) and Kes 32 (G332.4+0.1) and three pulsars (PSR J1614−5048, PSR J1616−5109, and PSR J1617−5055) and is close to the SNR candidate HESS J1614−518 (Gottschall et al. 2016) also detected in this analysis (FGES J1615.4−5153 in Section 4.1). Only PSR J1617−5055 is energetic enough to power the TeV emission of HESS J1616−508, and Aharonian et al. (2006a) speculated that it could be a PWN powered by this young pulsar. It was detected for the first time as an extended source at GeV energies by Lande et al. (2012). The disk size obtained at this time was, which is smaller than our value of reported in Table 1, as can be seen in Figure 12 (middle). This discrepancy seems to be due to the contamination by the 3FGL source J1620.0−5101, which was removed from our sky model by our automatic pipeline but kept as a distinct source in the previous analysis. Despite this inconsistency concerning the spatial model, the agreement with the TeV spectrum is excellent.
- 3.The region of the PWN HESS J1837−069 (FGES J1836.5−0652, FGES J1839.0−0704): Within 2°, this confused region contains five point sources in the 3FGL catalog in addition to the extended source associated with HESS J1837−069 represented by a disk of 0
- 4.The region of HESS J1632−478 (FGES J1631.7−4756): The region covering the TeV PWN HESS J1632−478 and unidentified source HESS J1634−472 is extremely complex since they are embedded in a region of the Galactic plane with bright background emission. They were both detected at GeV energies by Acero et al. (2013): the source coincident with HESS J1634−472 was pointlike, whereas the source coincident with HESS J1632−478 was modeled with a Gaussian distribution with a size almost twice as large as the TeV size, showing that this source might suffer from contamination. In our new analysis, an extended source (FGES J1631.7−4756) is detected with a relatively good match to the position and size of the TeV source HESS J1632−478 and a good spectral connection with the H.E.S.S. PWN. However, no source is found coincident with HESS J1634−472. This might be due to the fact that we introduced a very large source (FGES J1633.0−4746) to take into account the bright diffuse emission in the Galactic plane, a point source on the western edge of HESS J1634−472, and another slightly extended source (FGES J1636.3−4731) in its southern edge, as can be seen in Figure 14. This last extended source is coincident with SNR G337.0−0.1, which forms the CTB 33 complex together with several H ii regions. Significant Fermi-LAT emission was also found by Acero et al. (2016b) but kept as an unidentified source owing to the very large radius (0
5). Here we obtained a disk radius of 0
- 5.The CTB 37 A/B complex (FGES J1714.3-3823): Two SNRs form the CTB 37 complex, the SNR CTB 37A (G348.5+0.1, associated with the TeV γ-ray source HESS J1714−385) and the shell-type SNR CTB 37B (G348.7+0.3, associated with HESS J1713−381). CTB 37A is a bright source at GeV energies and was detected by Castro & Slane (2010) as a point source. A subsequent analysis revealed evidence for extension of 0 of 44 is extremely close to but lower than the value of , which clearly shows that a confusion exists in this region in our analysis. In this respect, the disk radius of 0
- 6.The PWN HESS J1825−137 (FGES J1825.2−1359): This PWN is powered by the energetic radio pulsar PSR J1826−1334 and presents a compact core in X-rays with a hard photon index () of size 30″embedded in a larger diffuse structure of extension extending to the south of the pulsar with a softer photon index of (Gaensler et al. 2003). The TeV γ-ray emission detected by H.E.S.S. has a much larger extent (∼0. Here, we obtained a larger disk radius of , which suffers large systematics owing to its location in a confused region with three bright Fermi-LAT sources enclosed in the disk, as can be seen in Figure 15 (middle and right). Despite this difference of spatial model (uniform disk in this analysis with respect to a Gaussian at TeV energies), the agreement with the H.E.S.S. result is reasonable, as can be seen in Figure 15 (left).





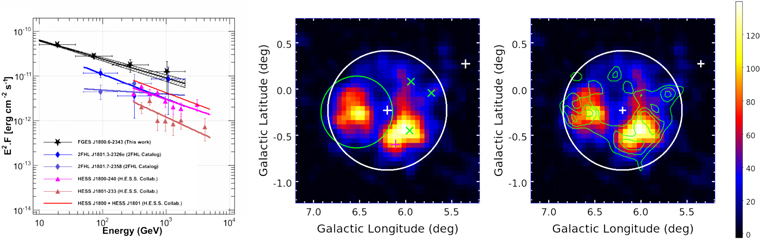
Figure 11. Left: SEDs of the SNR W28 with data points from this analysis (black stars and dashed butterfly), from the 2FHL catalog (blue and purple diamonds and lines for 2FHL J1801.3−2326e and 2FHL J1801.7−2358, respectively), and from IACT data (orange and pink triangles and lines for HESS J1800−240 and HESS J1801−233, respectively, the sum being represented in red; Aharonian et al. 2008). Middle and right: background-subtracted TS maps of SNR W28 using the same conventions as in Figure 3 and above-quoted references for the IACT contours shown in green. The white circle and central plus sign indicate the disk extension and centroid as fit in this work, respectively.
Download figure:
Standard image High-resolution image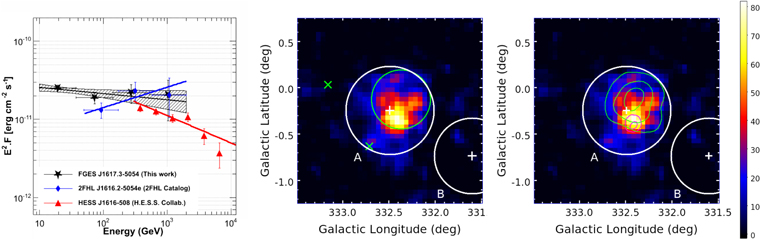
Figure 12. Left: SEDs of the TeV source HESS J1616−508 with data points from this analysis (black stars and dashed butterfly), from the 2FHL catalog (blue diamonds and line), and from IACT data (red line and stars; Aharonian et al. 2006a). Middle and right: background-subtracted TS maps of HESS J1616−508 using the same conventions as in Figure 3 and above-quoted references for the IACT contours shown in green. A white circle indicates the extent of the fit disk of FGES J1617.3−5054 (A) and FGES J1615.4−5153 (B). Right: X-rays contours (from the ROSAT All-Sky Survey) of SNR RCW 103 are overlaid in magenta.
Download figure:
Standard image High-resolution image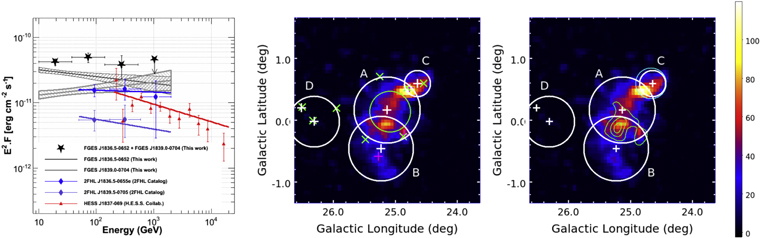
Figure 13. Left: SEDs of the pulsar wind nebula HESS J1837−069 with data points from this analysis (black and gray dashed butterflies for FGES J1836.5−0652 and FGES J1839.0−0704, respectively), from the 2FHL catalog (blue and purple diamonds and lines for 2FHL J1836.5−0655e and 2FHL J1839.5−0705, respectively), and from IACT data (red line; Aharonian et al. 2006a). Middle and right: background-subtracted TS maps of HESS J1837−069 using the same conventions as in Figure 3 and above-quoted references for the IACT contours shown in green. White circles and plus signs indicate the disk extensions and centroids, respectively, fit in this work for FGES J1836.5−0652 (A) and FGES J1839.0−0704 (B), as well as nearby extended sources FGES J1834.1−0706 (C) and FGES J1839.4−0554 (D).
Download figure:
Standard image High-resolution image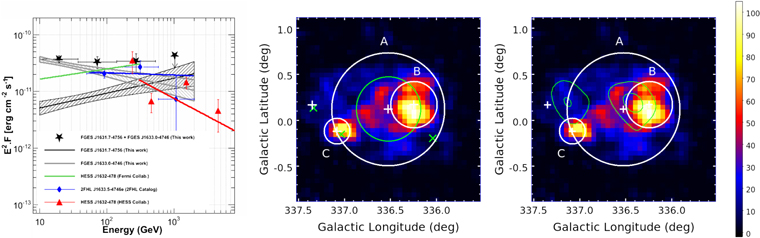
Figure 14. Left: SEDs of the pulsar wind nebula HESS J1632−478 with data points from this analysis (black and gray dashed butterflies for FGES J1631.7−4756 and FGES J1633.0−4746, respectively), from the 2FHL catalog (blue diamonds and line), from a previous Fermi-LAT publication (green line; Acero et al. 2013), and from IACT data (red triangles and line; Aharonian et al. 2006a). Middle and right: background-subtracted TS maps of HESS J1632−478 and HESS J1634−472 using the same conventions as in Figure 3 and above-quoted references for the IACT contours shown in green. White circles and plus signs indicate the disk extensions and centroids, respectively, fit in this work for FGES J1633.0−4746 (A) and FGES J1631.7−4756 (B), as well as the nearby extended source FGES J1636.3−4731 (C).
Download figure:
Standard image High-resolution image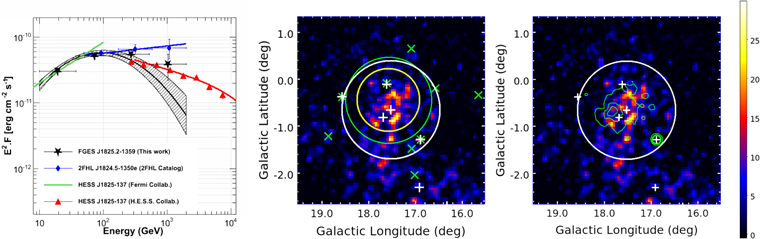
Figure 15. Left: SEDs of the pulsar wind nebula HESS J1825−137 by combining data from this analysis (black stars and dashed butterfly), the 2FHL catalog (blue diamonds and line), a previous Fermi-LAT publication (green line; Grondin et al. 2011), and IACT data (red triangles and line; Aharonian et al. 2006b). Middle and right: background-subtracted TS maps of HESS J1825−137 using the same conventions as in Figure 3 and above-quoted references for the IACT contours shown in green. The white circle and cross indicate the disk extension and centroid as fit in this work, respectively, for FGES J1825.2−1359. Middle: the extent of the disk obtained in the former Fermi-LAT publication is marked with a yellow circle.
Download figure:
Standard image High-resolution image4.3. New Extended Sources
Among the 16 new sources detected with significant extension in this analysis, eight coincide with clear counterparts and are discussed further below, except FGES J1636.3-4731, coincident with SNR G337.0−0.1 and already described above in Section 4.2.4. The others seem to be confused or contaminated by the diffuse background in complex regions: FGES J1745.8−3028 in the Galactic center region (see Hui et al. 2016, for a detailed analysis of this complex region), FGES J1036.3J1036.3−5834 in the region of Westerlund 2, FGES J1109.4−6115 in the region of MSH 11−62, FGES J1409.1−6121, FGES J1553.8−5325, FGES J1633.0-4746, FGES J1652.2−4633, and FGES J1655.6−4738. These confused sources can be distinguished from the others by their large disk extension and/or large systematic uncertainties.
- 1.The PWN HESS J1857+026 (FGES J1857.8+0246): HESS J1857+026 is a TeV γ-ray source detected by H.E.S.S. during the Galactic Plane Survey (Aharonian et al. 2008). The extended (∼0 much larger than the MAGIC one. However, looking at the TS maps in Figure 16, one clearly sees two hot spots in the southeast and southwest (coincident with HESS J1858+020) parts of the source, which could explain the larger size reported in this analysis since they may not be related to the PWN. This does not prevent consistency between the spectra derived at GeV and TeV energies as can be seen in Figure 16 (left), partly thanks to the low TeV flux of HESS J1858+020. However, it could explain the flat GeV spectrum derived in this analysis in comparison to the previously published one that used the H.E.S.S. morphology as a template (Rousseau et al. 2012).
- 2.The region of Westerlund 2 (FGES J1023.3-5747 and FGES J1036.3-5834): In 2007, H.E.S.S. reported the detection of γ-rays from an extended source of Gaussian width 0, in excellent agreement with the TeV one. The origin of the signal from HESS J1023−575 remains unsolved despite the new morphological and spectral results reported in this paper and illustrated in Figure 17. The γ-ray emission could originate from a PWN associated with PSR J1022−5746 or mechanisms related to acceleration of CRs in the open cluster Westerlund 2. However, the region is confused at GeV energies (with an extremely large source FGES J1036.3−5834 covering 2
- 3.The SNR G298.6−0.0 and G298.5−0.3 (FGES J1213.3−6240): The SNRs G298.6−0.0 and G298.5−0.3 are both detected at 408 and 843 MHz with flat radio photon index of ∼1.3 (Kesteven & Caswell 1987). The possible interaction with a high-density medium from the direction of these two SNRs was reported by Reach et al. (2006), making these sources excellent targets for GeV observations. Indeed, the GeV detection of a point source coincident with the shell of G298.6−0.0 and G298.5−0.3 was reported by Acero et al. (2015, 2016b). Recently, X-ray observations by Suzaku revealed a center-filled structure inside the radio shell (Bamba et al. 2016). This classifies G298.6−0.0 as a new mixed-morphology SNR such as IC 443 (Troja et al. 2008). In this work, we report a significant extension at a position coincident with SNR G298.6−0.0 and with a size including G298.5−0.3, as can be seen in Figure 18. The soft γ-ray spectrum is consistent with the fact that these sources have a spectral break around a few GeV (Acero et al. 2015, 2016b), which is similar to most SNRs interacting with MCs. The higher flux reported in this analysis can be explained by the fact that we are adding the flux of both SNRs. This makes the extension measure reported here questionable.
- 4.The Kookaburra complex (FGES J1420.3-6047): The complex of compact and extended radio/X-ray sources, called Kookaburra (Roberts et al. 1999), spans over one square degree along the Galactic plane. It contains two young and energetic pulsars PSR J1420−6048 and PSR J1418−6058 powering the PWNe called “K3” and the “Rabbit,” respectively. The H.E.S.S. Galactic Plane Survey revealed two sources in this region: HESS J1420−607 centered north of PSR J1420−6048 (near K3), and HESS J1418−609 coincident with the Rabbit nebula (Aharonian et al. 2006c). In a previous analysis of the region above 10 GeV using Fermi-LAT data (Acero et al. 2013), HESS J1420−607 and HESS J1418−609 were detected as two point sources with different spectral shapes: a hard spectrum for the first one (suggesting a PWN origin), and a soft spectrum with an energy cutoff at a few GeV for the second one, suggestive of pulsar emission and thus likely due to contamination from PSR J1418−6058. It was then detected as a very extended source64 of 0
- 5.CTB 109 (FGES J2302.0+5855): CTB 109 (G109.1−1.0) is a Galactic SNR with a hemispherical shell morphology in X-rays and in the radio band. Using 37 months of Fermi-LAT data, Castro et al. (2012) detected a γ-ray source coincident with the position of the remnant with no sign of significant extension. Thanks to the excellent angular resolution offered by the new Pass 8 data, the extension of the Fermi-LAT source is now significant and in perfect agreement with the size of the remnant, ruling out an association with the giant MC located to the west of the SNR because it is too far from the centroid of the γ-ray emission. The spectrum derived in this new analysis, presented in Figure 20 (left), is consistent with the former one and can be reasonably fit in both leptonic and hadronic models. It should be noted that the spectrum and morphology derived here are in perfect agreement with those published recently by Li et al. (2017).
- 6.HESS J1507−622 (FGES J1507.6-6228): Most γ-ray sources in the inner Galaxy H.E.S.S. survey tend to cluster within 1° in latitude around the Galactic plane. HESS J1507−622 instead is unique, since it is located at a latitude of ∼3) is still unidentified. HESS J1507−622 was detected in the Fermi-LAT energy range as a point source (Domainko & Ohm 2012) with a rather flat spectrum from the GeV to the TeV regime. Our new analysis confirms the former spectrum and shows for the first time a significant extension in the GeV regime, in agreement with the TeV size (see Figure 21). These results challenge an extragalactic origin due to the large energetics needed to power the source and the very extended nature of the emission in such a scenario. For a Galactic origin, the compactness of the source suggests a distance to the object of several kiloparsecs, and its location far off plane may indicate a parent stellar population as old as 1 Gyr. This does not rule out a PWN origin for the source but implies a very low magnetic field of to be able to explain the absence of an X-ray counterpart.
- 7.The region of IC 443 (FGES J0617.2+2235 and FGES J0619.6+2229): The middle-aged SNR IC 443 has been extensively studied at all wavelengths and established as a strong γ-ray source extended in the TeV band (Albert et al. 2007) and in the GeV domain (Tavani et al. 2010; Abdo et al. 2010b). The γ-ray data were interpreted by Torres et al. (2010) in the framework of CR interactions with a giant MC lying in front of the remnant. Then, using Fermi-LAT data down to 60 MeV, Ackermann et al. (2013b) detected a spectral break at low energy, characteristic of pion-decay emission, proving that protons are indeed being accelerated in this remnant. More recently, Humensky (2015) showed that the TeV emission as seen by VERITAS is strongly correlated with the GeV morphology of the Fermi-LAT and extends over the entire surface of the remnant. Here our analysis finds a best disk radius of 0




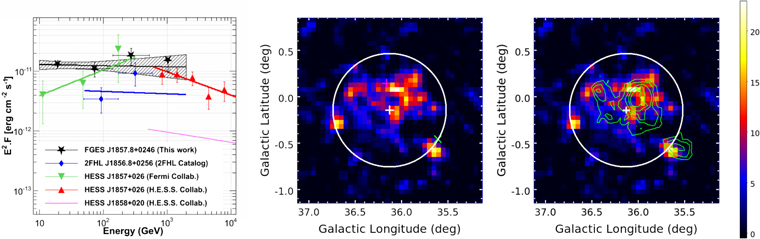
Figure 16. Left: SEDs of the pulsar wind nebula HESS J1857+026 with data points from this analysis (black line and stars, and dashed butterfly), from the 2FHL catalog (blue diamonds and line), from a previous Fermi-LAT publication (green triangles and line; Rousseau et al. 2012), and from IACT data (red triangles and line for HESS JJ1857+026 and pink line for HESS J1858+020; Aharonian et al. 2008). Middle and right: background-subtracted TS maps of HESS J1857+026 and HESS J1858+020 using the same conventions as in Figure 3 and above-quoted references for the IACT contours shown in green. A white circle and cross indicate the disk extension and centroid as fit in this work, respectively.
Download figure:
Standard image High-resolution image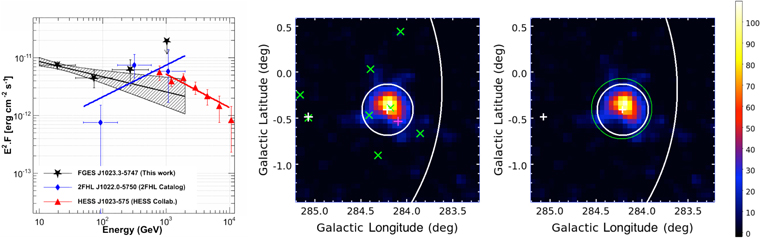
Figure 17. Left: SEDs of HESS J1023−575 with data points from this analysis (black line and stars, and dashed butterfly), from the 2FHL catalog (blue diamonds and line), and from IACT data (red triangles and line; H.E.S.S. Collaboration et al. 2011b). Middle and right: background-subtracted TS maps of HESS J1023−575 using the same conventions as in Figure 3 and above-quoted references for the IACT contours shown in green. A white circle and cross indicate the disk extension and centroid as fit in this work, respectively.
Download figure:
Standard image High-resolution image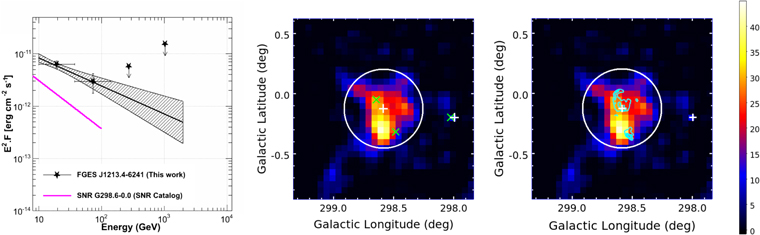
Figure 18. Left: SEDs of the SNR G298.6−0.0 with data points from this analysis (black line and stars, and dashed butterfly) and from the SNR catalog (magenta line). Middle and right: background-subtracted TS maps of SNR G298.6−0.0 using the same conventions as in Figure 3. The radio contours of G298.6−0.0 and G298.5−0.3 (Sydney University Molonglo Sky Survey at 843 MHz; Bock et al. 1999) are overlaid in cyan. A white circle and cross indicate the disk extension and centroid as fit in this work, respectively.
Download figure:
Standard image High-resolution image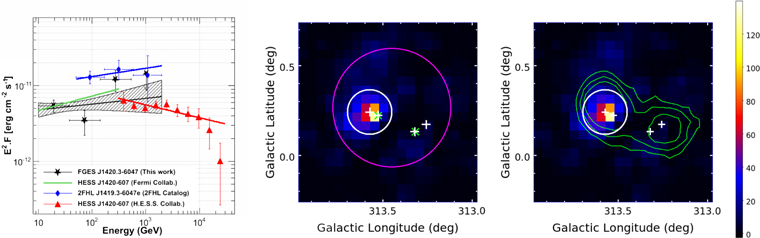
Figure 19. Left: SEDs of the pulsar wind nebula Kookaburra with data points from this analysis (black stars and dashed butterfly), from a previous Fermi-LAT publication (Acero et al. 2013), from the 2FHL catalog (blue diamonds and line), and from IACT data (red triangles and line; Aharonian et al. 2006c). Middle and right: background-subtracted TS maps of Kookaburra using the same conventions as in Figure 3 and above-quoted references for the IACT contours shown in green. A white circle and plus sign indicate the disk extension and centroid as fit in this work, respectively. An additional white plus signs mark the positions of point sources described in the text.
Download figure:
Standard image High-resolution image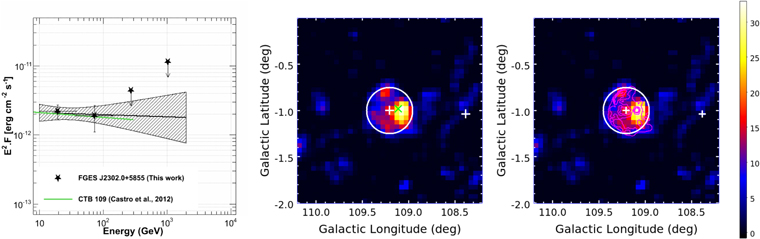
Figure 20. SEDs of the SNR CTB 109 constructed using data from this analysis (black stars and dashed butterfly) and from a previous publication using Fermi-LAT data (green line; Castro et al. 2012). Right: background-subtracted TS maps of CTB 109 using the same conventions as in Figure 3. A white circle and cross indicate the disk extension and centroid as fit in this work, respectively. Right: X-ray contours from ROSAT PSPC (ROSAT Mission Description and Data Products Guide, available through the ROSAT Guest Observer Facility, NASA GSFC) are overlaid in magenta.
Download figure:
Standard image High-resolution image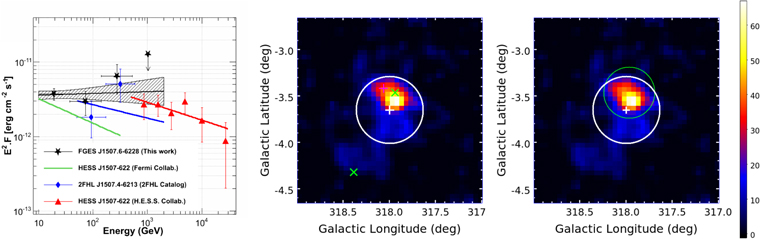
Figure 21. Left: SEDs of the TeV source HESS J1507−622 with data points from this analysis (black stars and dashed butterfly), from the 2FHL catalog (blue diamonds and line), from a previous Fermi-LAT publication (green line; Acero et al. 2013), and from IACT data (red triangles and line; H.E.S.S. Collaboration et al. 2011c). Middle and right: background-subtracted TS maps of HESS J1507−622 using the same conventions as in Figure 3 and above-quoted references for the TeV extent shown in green. A white circle and cross indicate the disk extension and centroid as fit in this work, respectively.
Download figure:
Standard image High-resolution image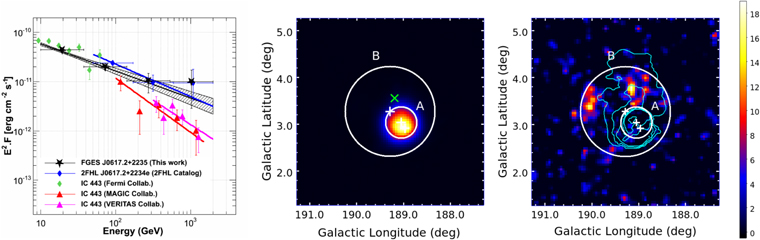
Figure 22. Left: SEDs of the SNR IC 443 (FGES J0617.2+2235) with data points from this analysis (black stars and dashed butterfly), from the 2FHL catalog (blue diamonds and line), from a previous Fermi-LAT publication (green diamonds; Ackermann et al. 2013b), and from IACT data (red and pink triangles are taken from Albert et al. 2007 and Acciari et al. 2009, respectively). Middle and right: background-subtracted TS maps of IC 443 using the same conventions as in Figure 3. The 3FGL and 2FHL sources for the SNR IC 443 are exactly coincident with our FES source J0617.2+2235. White circles and plus signs indicate the disk extensions and centroids fit in this work, respectively, for FGES J0617.2+2235 (A) and FGES J0619.6+2229 (B). Right: the bright emission from FGES J0617.2+2235 is included in the model to highlight the emission coming from the largest source, FGES J0619.6+2229. Cyan contours represent the radio emission at 1420 MHz (Leahy 2004).
Download figure:
Standard image High-resolution image5. Summary
Using the new Pass 8 Fermi-LAT data above 10 GeV, we have detected 46 significantly extended sources in the Galactic plane and provided their morphological and spectral characteristics. Only four Galactic sources already detected as significantly extended in previous works were not detected in this work; none of them show any significant emission above 10 GeV in the 3FHL catalog either. These extended sources have >10 GeV fluxes ranging from ∼ to ∼
to ∼ cm−2 s−1 with a median flux of
  cm−2 s−1. On average, they display hard spectra with a median spectral index of 2.1, 70% of all sources having a spectrum harder than 2.2 and even harder than 2.0 for 40% (see Figure 23, right), implying a high-energy SED peak in the TeV band. The measured disk extensions show a large dispersion with values ranging from 0
12 to 2
5, with a median value of 0
5 as can be seen from Figure 23 (left).
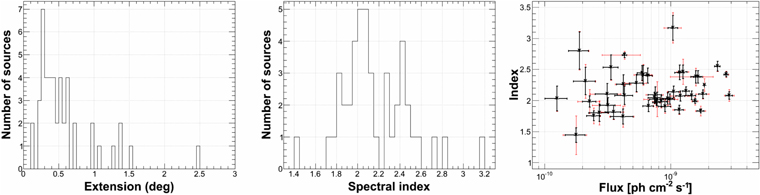
Figure 23. Distribution of the disk extension (left), spectral index (middle), and spectral index vs.flux (right) of the 46 extended sources detected in this analysis. FGES J1825.2−1359 is not included in the middle and right panels since it is the only source modeled using a LogParabola. In the right panel, statistical errors are indicated in black, while the quadrature sum of systematic and statistical errors is reported in red.
Download figure:
Standard image High-resolution imageAmong the 46 extended sources, 16 are new, 13 agree with previous publications, and 17 have a different morphology. This perfectly highlights that, thanks to the improved performance offered by the Pass 8 data and the increased exposure, we detect more sources and better characterize the morphology of already-known sources. This is particularly evident for the case of the large SNR G150.3+4.5, whose γ-ray morphology now perfectly matches the radio size and location. This source is not an isolated case since SNRs are the dominant class of extended sources detected in this search. All extended sources identified with PWNe are also detected at TeV energies. This may be due to a higher-energy SED peak for these sources in comparison to SNRs. It is important to note that seven SNRs and one star-forming region are undetected at TeV energies, highlighting the excellent sensitivity of the Fermi-LAT in the >10 GeV band thanks to its uniform exposure over the whole Galactic plane and its low background in comparison to Cherenkov telescopes. The current and future observations of the Fermi-LAT are thus crucial to probe the  sky and especially the Galactic plane, providing excellent targets for current and future Cherenkov telescopes such as CTA.
The Fermi LAT Collaboration acknowledges generous ongoing support from a number of agencies and institutes that have supported both the development and the operation of the LAT, as well as scientific data analysis. These include the National Aeronautics and Space Administration and the Department of Energy in the United States; the Commissariat à l’Energie Atomique and the Centre National de la Recherche Scientifique/Institut National de Physique Nucléaire et de Physique des Particules in France; the Agenzia Spaziale Italiana and the Istituto Nazionale di Fisica Nucleare in Italy; the Ministry of Education, Culture, Sports, Science and Technology (MEXT), High Energy Accelerator Research Organization (KEK), and Japan Aerospace Exploration Agency (JAXA) in Japan; and the K. A. Wallenberg Foundation, the Swedish Research Council, and the Swedish National Space Board in Sweden.
Additional support for science analysis during the operations phase is gratefully acknowledged from the Istituto Nazionale di Astrofisica in Italy and the Centre National d’Études Spatiales in France. This work performed in part under DOE Contract DE-AC02-76SF00515.
Software: Fermi Science Tools (v10r01p01),  (Kerr 2010).
Appendix: Systematic Cross-check with a Secondary Pipeline
This paper used two analysis pipelines similar to those employed in Ackermann et al. (2016). The primary one is presented in Section 3.3. Both methods implemented  , but each made slightly different choices about how to construct the region model and update the spectral and spatial parameters of surrounding sources as new sources were added or removed in each field. The pipelines reached a highly compatible representation of sources along the Galactic plane that accounted for the presence of extended sources. The only two sources with significant disagreement were rejected from the list presented and are discussed below. The use of two independent analysis pipelines provided detailed cross-checks of a large-scale, multistep analysis and determined how algorithm choices impacted the final source model for an ROI. The two pipelines followed a similar procedure with the following exceptions.
- 1.The secondary pipeline considered a single row of 72 partially overlapping ROIs of radius 10°, centered on b = 0°, whereas the primary pipeline included two additional overlapping rows centered on b = ±5° (see right diagram of Figure 2), creating 216 total ROIs.
- 2.Only 3FGL sources that were identified (as defined in Acero et al. 2015) with a multiwavelength counterpart were retained in the initial region models used in the secondary pipeline, i.e., unassociated sources were not included. Extended sources identified as an SNR or PWN, as well as the Cygnus cocoon, were also excluded from the initial region models. The primary pipeline instead included all sources listed in the 3FGL catalog in the initial models and modified the spatial templates for extended sources to be a compatibly sized uniform disk if the 3FGL template was not a uniform disk.
- 3.The secondary pipeline included an initial fit of all spectral parameters within the full 10° radius region. All following iterations left spectral parameters for sources within 5° of the newly added source free with all others fixed, the same as the primary pipeline. The primary pipeline could forgo that initial step because it began with a more complete model, as described above, and as the final step in constructing the source model adjusted the parameters for sources appearing in multiple ROIs by using the fit from the one with the closest center. Many sources within the 10° radius b = 0° ROIs but lying beyond 5° of the center lie within 5° of an ROI centered on b = ±5° (see Figure 2).
- 4.After a new point or extended source was added to the model, the spatial parameters of any previously added extended sources were refit iteratively, starting with the highest TS extended source, before creating a new TS map and continuing the iteration. The primary pipeline instead refit sources during the iteration only if a source TS fell below threshold and was removed from the model.
- 5.To finalize the source model, any sources with were removed from the ROI iteratively, starting with the lowest TS source, and all sources within 5° of the removed source were refit on each iteration. The primary pipeline removed sources with at each step.


The fact that the two pipelines agree well on all sources presented here is very reassuring. However, it is clear that the secondary pipeline uses many more iterations, and therefore more computing resources, for each region because of excluding a number of 3FGL sources from the initial model that in many cases return in later iterations. The extended sources are refit each time additional sources are added to the model, creating an additional computational burden that influenced the choice to select 72 regions instead of 216 as is done in the primary pipeline. Consequentially, the primary pipeline covers the Galactic plane a little more thoroughly (see Figure 2), making it the preferred analysis for this work.
There were two sources rejected from the list presented here as a result of the disagreement between the two pipelines. Both were located at the edge of search regions along the Galactic plane. One, coincident with the Cygnus loop (l = 73.98, b = −8.56) with a disk radius of 16 and a
 value of 21, was detected by the primary pipeline but was not detected by the secondary pipeline. This can be explained by the large offset of this source with respect to the Galactic plane causing it to not be included in the search performed by the secondary pipeline. The second rejected source was only detected by the secondary pipeline with a disk radius of 0
06, whereas the primary pipeline found a point source at the same position (l = 276.12, b = −7.04), coincident with the Fermi-LAT source 3FGL J0904.8−5734 (associated with PKS 0903-57). It seems very likely that the extension estimates for these two sources are incorrect and affected by their location at the edge of the ROI for each pipeline. This explains why they were rejected from the final list.
Footnotes
- 58
- 59
- 60
For more information about MINUIT see http://lcgapp.cern.ch/project/cls/work-packages/mathlibs/minuit/doc/doc.html.
- 61
Using 20,000 statistically independent simulations, Lande et al. (2012) showed that the cumulative density of
follows a distribution with one degree of freedom. - 62
See https://fermi.gsfc.nasa.gov/ssc/data/analysis/LAT_caveats.html. The uncertainty in the IRFs does not affect the spectra by more than 5% and can be safely neglected in this study.
- 63
A typo was recently discovered in the disk extension value reported in Table 5 of Ackermann et al. (2016) and in its associated fits file. An erratum is being prepared quoting a value of 0
- 64
A typo was recently discovered in the disk extension value reported in Table 5 of Ackermann et al. (2016) and in its associated fits file. An erratum is being prepared quoting a value of 0

