Abstract
We present infrared K′-band (2.1 μm) and L′-band (3.8 μm) high-spatial-resolution (<03) imaging observations of 17 nearby (z < 0.17) ultraluminous infrared galaxies (ULIRGs) assisted with the adaptive optics of the Subaru Telescope. We search for compact red K′ − L′ color emission as the indicator of luminous active galactic nuclei (AGNs) due to AGN-heated hot dust emission. Two luminous dual AGN candidates are revealed. Combining these results with those of our previous study, we can state that the detected fraction of luminous dual AGNs in nearby ULIRGs is much less than unity (<20%), even when infrared wavelengths >2 μm are used that should be sensitive to buried AGNs due to small dust extinction effects. For ULIRGs with resolved multiple nuclear K′-band emission, we estimate the activation of supermassive black holes (SMBHs) in individual galaxy nuclei in the form of AGN luminosity normalized by SMBH mass inferred from the stellar luminosity of the host galaxy. We confirm a trend that more massive SMBHs in K′-band brighter primary galaxy nuclei are generally more active, with higher SMBH-mass-normalized AGN luminosity, than less massive SMBHs in K′-band fainter secondary galaxy nuclei, as predicted by numerical simulations of gas-rich major galaxy mergers. In two sources, the presence of even infrared-elusive extremely deeply buried AGNs is indicated by comparisons with available (sub)millimeter data. Non-synchronous SMBH activation (i.e., less activation of less massive SMBHs) and the possible presence of such infrared-elusive AGNs may be responsible for the small fraction of infrared-detected luminous dual AGNs in nearby merging ULIRGs.
1. Introduction
Current standard galaxy formation scenarios postulate that small gas-rich galaxies collide, merge, and then evolve into more massive galaxies (White & Rees 1978). If a supermassive black hole (SMBH) is ubiquitously present at the center of each merging galaxy (Magorrian et al. 1998; Kormendy & Ho 2013), then many galaxy mergers are expected to contain multiple SMBHs. In gas-rich galaxy mergers, a sufficient amount of gas can accrete onto the existing SMBHs, and such SMBHs can become active galactic nuclei (AGNs) by emitting strong radiation from their surrounding accretion disks (Hopkins et al. 2006). If more than one SMBH becomes a luminous AGN in gas-rich galaxy mergers, many dual AGNs will exist in the universe. Dual AGNs with kiloparsec-scale physical separation in the local universe (z ≲ 0.2) can be resolved spatially with subarcsecond-resolution observations. Attempts to find such dual AGNs have recently been conducted using various methods.
One of the standard ways to search for dual AGNs is to look for AGNs with double-peaked narrow emission lines in large optical spectroscopic databases (e.g., Sloan Digital Sky Survey) (York et al. 2000), because dual AGNs with kiloparsec-scale separation and two independent narrow line-emitting regions (NLRs) are one scenario that can explain the observed double-peaked optical narrow emission lines (e.g., Wang 2009; Liu et al. 2010; Smith et al. 2010; Ge et al. 2012; Pilyugin et al. 2012; Barrows et al. 2013). However, given that other factors, such as outflows, rotating disks, and the complex kinematics of NLRs, can also account for the observed double-peaked optical narrow emission line properties, high-spatial-resolution follow-up observations at other wavelengths (e.g., infrared, radio, and X-ray) are needed to confirm or disprove the dual AGN scenario (e.g., Fu et al. 2011, 2012; Rosario et al. 2011; Shen et al. 2011; Tingay & Wayth 2011; Comerford et al. 2012; Liu et al. 2013, 2018; McGurk et al. 2015; Muller-Sanchez et al. 2015; Rubinur et al. 2019). The results from these follow-up studies show that the majority of double-peaked optical narrow emission line AGNs can be better explained by scenarios other than dual AGNs. In particular, Rubinur et al. (2019) argued that mergers are better indicators of dual AGNs than double-peaked optical narrow emission line AGNs. Numerical simulations predict that strong dual AGN activity occurs during the late phases of gas-rich galaxy mergers at small nuclear separations (Hopkins et al. 2006; van Wassenhove et al. 2012; Capelo et al. 2017; Blecha et al. 2018). Under these conditions, a large fraction of AGNs can be buried deeply in nuclear gas and dust in virtually all lines of sight without well-developed classic NLRs; thus, they tend to be optically elusive (Maiolino et al. 2003; Imanishi et al. 2006). Optical searches for dual AGNs have this limitation and so observations at wavelengths with stronger gas/dust penetrating power are required to properly detect luminous, but buried, dual AGNs.
An AGN usually emits much stronger X-ray emission than a star-forming region with the same bolometric luminosity (Shang et al. 2011). Hard X-ray observations at >2 keV can be particularly powerful for investigating optically elusive luminous buried AGNs, due to reduced extinction effects compared to optical and soft X-ray observations at <2 keV. In fact, luminous dual AGNs were found through hard X-ray observations of several infrared-luminous gas/dust-rich major galaxy mergers3 with no obvious optical AGN signatures (e.g., Komossa et al. 2003; Ballo et al. 2004; Bianchi et al. 2008; Piconcelli et al. 2010; Fabbiano et al. 2011; Koss et al. 2011, 2012, 2016), providing strong evidence that some fraction of such galaxy mergers actually contain optically elusive luminous dual AGNs. However, in many infrared-luminous gas/dust-rich galaxy mergers, X-ray emission from putative luminous buried AGNs is not clearly detected or is only marginally detected when it is difficult to securely estimate intrinsic AGN luminosity from model fitting of spectra with limited X-ray photon number (e.g., Teng et al. 2009; Iwasawa et al. 2011; Liu et al. 2013; Ricci et al. 2017). A large number of dual AGNs in gas/dust-rich galaxy mergers could be missed, even with hard X-ray observations.
Infrared observations at >2 μm can be another effective tool for investigating optically elusive, luminous dual buried AGNs in gas/dust-rich galaxy mergers, thanks to much smaller dust extinction effects than those of optical observations (Nishiyama et al. 2008, 2009). More importantly, AGN activity can be differentiated from star-forming activity on the basis of infrared observations. Because the radiative energy generation efficiency of an AGN (mass-accreting SMBH; 6%–42% of Mc2) (Bardeen 1970; Thorne 1974) is much higher than that of star formation (nuclear fusion inside stars; ∼0.7% of Mc2), large luminosity in an AGN can come from a compact area and the surface brightness of the emission can be very high. An AGN can create a larger amount of hot (>100 K) dust than star-forming activity, and so the infrared spectral shape and color can be largely different between these two kinds of activity, in particular in the near- to mid-infrared (2–8 μm) range (e.g., Alonso-Herrero et al. 2006; Risaliti et al. 2006, 2010; Imanishi et al. 2008, 2010b; Jarrett et al. 2011; Lee et al. 2012; Mateos et al. 2012; Stern et al. 2012). In fact, infrared observations have revealed optically elusive, but luminous buried AGNs in many late-stage infrared-luminous gas/dust-rich galaxy mergers, by distinguishing from star formation, based on infrared colors at 3–5 μm (Satyapal et al. 2014). In such mergers, it is often the case that infrared observations have successfully provided the signatures of luminous buried AGNs that are elusive, even in the hard X-ray regime (e.g., Alonso-Herrero et al. 2006; Armus et al. 2007; Imanishi et al. 2007, 2008; Teng et al. 2009, 2015; Veilleux et al. 2009; Nardini et al. 2010; Nardini & Risaliti 2011). This is possibly due to the presence of a large column density of dust-free, X-ray-absorbing gas around luminous AGNs inside the dust sublimation radius, which can make X-ray absorption substantially greater than that expected from dust extinction in the infrared and Galactic extinction curve (e.g., Alonso-Herrero et al. 1997; Granato et al. 1997; Georgantopoulos et al. 2011; Burtscher et al. 2015; Ichikawa et al. 2019).
Using the 3.4 and 4.6 μm infrared colors of the Wide-field Infrared Survey Explorer (WISE), Satyapal et al. (2017) have attempted to detect luminous dual AGNs in infrared-luminous gas/dust-rich galaxy mergers. However, given the limited spatial resolution of WISE (∼6″) (Wright et al. 2010), these WISE data only indicate that luminous buried AGNs are present in at least one galaxy nucleus, and infrared colors of galaxy nuclei with a small separation cannot be constrained individually. Follow-up ground-based near-infrared spectroscopy at <2.5 μm and/or hard X-ray observations at >2 keV with higher spatial resolution are needed to confirm luminous dual AGNs (Satyapal et al. 2017; Pfeifle et al. 2019). For near-infrared spectroscopic confirmation of AGNs, deeply buried AGNs without well-developed NLRs can still be missed because high excitation coronal emission lines are used. It is highly desirable to conduct high-spatial-resolution infrared observations to identify directly AGN-like infrared colors in individual merging galaxy nuclei separately, to obtain a better census of luminous buried AGNs in infrared-luminous gas/dust-rich galaxy mergers.
Imanishi & Saito (2014) conducted ground-based adaptive optics (AO)-assisted, high-spatial-resolution (<03) infrared K′-band (2.1 μm) and L′-band (3.8 μm) observations of nearby infrared-luminous gas/dust-rich galaxy mergers at z < 0.22 using the Subaru 8.2 m telescope, because much higher spatial resolution is achievable, particularly in the L′ band (3.8 μm), than with any infrared satellite so far launched. Imanishi & Saito (2014) have argued that AGNs, including deeply buried ones, and star-forming regions are distinguishable from the infrared K′ − L′ colors, because an AGN should show much redder K′ − L′ color (Ivanov et al. 2000; Alonso-Herrero et al. 2003; Videla et al. 2013). For stellar emission in a normal star-forming region, the infrared L′-band flux is usually much smaller than the K′-band flux; however, L′-band emission is strong in a luminous AGN because of AGN-heated hot (>100 K) dust emission (Figure 1). This excess L′-band emission by AGN-heated hot dust is so strong that the ratio of infrared L′-band to bolometric luminosity in a pure luminous AGN is nearly two orders of magnitude higher than in pure star formation (Risaliti et al. 2010). An AGN with a modest bolometric contribution (e.g., ∼20%) is detectable from a significantly redder K′ − L′ color than star formation (Imanishi & Saito 2014). Most importantly, this red K′ − L′ color method should be sensitive to an optically elusive luminous buried AGN without well-developed NLRs, because we probe the excess L′-band emission coming from AGN-heated hot dust at the inner part of the obscuring material.4
Unlike rest-frame optical wavelengths, there are no extremely strong emission and absorption features at infrared 2–5 μm (the rest frame). The modestly strong 3.3 μm emission feature from polycyclic aromatic hydrocarbons (PAHs) is usually seen in star formation (Figure 1, left) (rest equivalent width ≲0.15 μm; Imanishi et al. 2008, 2010b). The 3.4 μm absorption feature due to carbonaceous dust is detected in some fraction of obscured AGNs with ∼50% dip in the strongest case (e.g., Imanishi & Dudley 2000; Risaliti et al. 2003; Imanishi et al. 2006, 2008). However, the effects of these features on the observed L′-band flux are limited (<0.2 mag). Thus, as long as we observe nearby (z ≲ 0.2) galaxies, it is very unlikely that K′ − L′ color can change drastically over a particular redshift range due to emission or absorption features. This method was applied to 29 nearby infrared-luminous gas/dust-rich galaxy mergers and successfully detected four dual AGN candidates (Imanishi & Saito 2014). However, because of the limited sample size, our observational constraints on the ubiquity of luminous dual AGNs in gas/dust-rich galaxy mergers still have room for improvement. In this paper, we extend our successful approach to a larger number of objects to better understand optically elusive deeply buried luminous AGNs in infrared-luminous gas/dust-rich galaxy mergers.
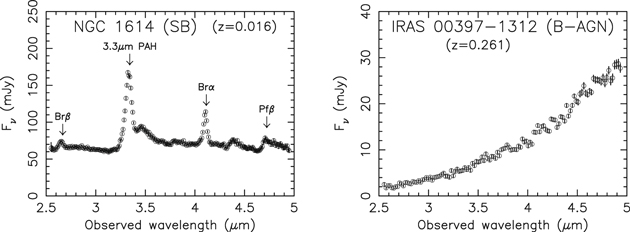
Figure 1. Examples of infrared 2.5–5 μm spectra of the starburst-dominated infrared-luminous galaxy NGC 1614 (z = 0.016) (left) and the buried-AGN-dominated infrared-luminous galaxy IRAS 00397−1312 (z = 0.261) (right), taken with the AKARI IRC instrument (Imanishi et al. 2010b). The abscissa is the observed wavelength in μm, and the ordinate is flux (Fν) in mJy. A luminous buried AGN shows a much more steeply rising continuum from 2.5 to 5 μm, and thereby much redder K′(2.1 μm) − L′(3.8 μm) color, than a starburst-dominated galaxy. “SB” (left) and “B-AGN” (right) mean a starburst and a buried AGN, respectively. In the left panel, the 3.3 μm PAH emission feature at rest wavelength λrest = 3.29 μm, and hydrogen recombination lines (Brβ at λrest = 2.63 μm, Brα at λrest = 4.05 μm, and Pfβ at λrest = 4.65 μm) are indicated.
Download figure:
Standard image High-resolution imageThroughout this paper, quoted magnitudes are based on the Vega system, and we adopt H0 = 71 km s−1 Mpc−1, ΩM = 0.27, and ΩΛ = 0.73. The luminosity distance (in Mpc) and the relationship between the physical and apparent scales (in kpc arcsec−1) with these cosmological parameters are obtained using the calculator provided by Wright (2006).
2. Targets
In the nearby universe at z ≲ 0.2, ultraluminous infrared galaxies (ULIRGs) with infrared luminosity LIR ≳ 1012 L⊙ are mostly gas/dust-rich galaxy mergers (e.g., Sanders et al. 1988; Clements et al. 1996; Murphy et al. 1996; Duc et al. 1997). Imanishi & Saito (2014) selectively observed 23 well-studied nearby ULIRGs in the IRAS 1 Jy sample (Kim & Sanders 1998), which are relatively bright in the observed infrared K′ and L′ bands, and six additional interesting galaxies with slightly lower infrared luminosity at LIR < 1012 L⊙. As a next step, we extend our observations to less studied ULIRGs in the IRAS 1 Jy sample at larger distance and with fainter flux in the same observed bands. Even using the world’s largest ground-based 8–10 m telescopes, it is very difficult to significantly detect L′-band emission fainter than L′ = 14 mag in Vega because of large atmospheric background noise from Earth. We thus exclude ULIRGs whose WISE 3.4 μm magnitudes are fainter than 14 mag in Vega (Wright et al. 2010). This criterion poses some bias against ULIRGs without luminous buried AGNs, because >3 μm emission is much brighter for luminous AGNs than for star-forming regions when normalized at the bolometric luminosity. Thus, our sample is not statistically unbiased in any sense. Table 1 summarizes our observed ULIRG sample (17 sources). In addition to ULIRGs with no obvious optical AGN signatures (i.e., LINER, H ii region, and unclassified types in Table 1), those with optically identified AGNs (Seyfert 1 and 2 types) are included. Verifying red K′ − L′ colors in the primary galaxy nuclei of these optically identified AGNs will further strengthen our proposed K′ − L′ color method as a tool for detecting luminous AGNs, including optically elusive buried ones. For both optically AGN-type and non-AGN-type ULIRGs, our primary scientific goal is to investigate whether luminous dual AGNs are common using our proposed potentially powerful infrared approach. In particular, achieved high spatial resolution with <03 assisted by the AO of ground-based 8–10 m telescopes will allow the discovery of small-separation luminous dual AGNs that may not be resolvable, even with X-ray data of the highest spatial resolution (∼0
5) provided by the Chandra satellite.
Table 1. Basic Properties of the Observed Ultraluminous Infrared Galaxies
| Object | Redshift | dL | Scale | f12 | f25 | f60 | f100 | log(LIR/L⊙) | log(LFIR/L⊙) | Optical |
|---|---|---|---|---|---|---|---|---|---|---|
| (Mpc) | (kpc arcsec–1) | (Jy) | (Jy) | (Jy) | (Jy) | Class | ||||
| (1) | (2) | (3) | (4) | (5) | (6) | (7) | (8) | (9) | (10) | (11) |
| IRAS 00456−2904 | 0.110 | 504 | 2.0 | <0.08 | 0.14 | 2.60 | 3.38 | 12.2 | 12.2 | H ii |
| IRAS 04103−2838 | 0.118 | 543 | 2.1 | 0.08 | 0.54 | 1.82 | 1.71 | 12.2 | 12.0 | LINER |
| IRAS 08559+1053 | 0.148 | 695 | 2.6 | <0.10 | 0.19 | 1.12 | 1.95 | 12.2 | 12.1 | Sy2 |
| IRAS 09039+0503 | 0.125 | 578 | 2.2 | 0.07 | 0.12 | 1.48 | 2.06 | 12.1 | 12.0 | LINER |
| IRAS 09116+0334 | 0.146 | 685 | 2.5 | <0.09 | <0.14 | 1.09 | 1.82 | 12.2 | 12.1 | LINER |
| IRAS 10035+2740 | 0.165 | 784 | 2.8 | <0.14 | <0.17 | 1.14 | 1.63 | 12.3 | 12.2 | unclass |
| IRAS 10190+1322 | 0.077 | 345 | 1.4 | <0.07 | 0.38 | 3.33 | 5.57 | 12.0 | 12.0 | H ii |
| IRAS 11506+1331 | 0.127 | 588 | 2.2 | <0.10 | 0.19 | 2.58 | 3.32 | 12.4 | 12.3 | H ii |
| IRAS 12072−0444 | 0.129 | 598 | 2.3 | <0.12 | 0.54 | 2.46 | 2.47 | 12.4 | 12.3 | Sy2 |
| IRAS 12112+0305 | 0.073 | 326 | 1.4 | 0.12 | 0.51 | 8.50 | 9.98 | 12.3 | 12.3 | LINER |
| IRAS 13539+2920 | 0.108 | 494 | 2.0 | <0.09 | 0.12 | 1.83 | 2.73 | 12.1 | 12.0 | H ii |
| IRAS 14202+2615 | 0.159 | 752 | 2.7 | 0.18 | 0.15 | 1.49 | 1.99 | 12.5 | 12.3 | H ii |
| IRAS 14394+5332 | 0.105 | 479 | 1.9 | 0.03 | 0.35 | 1.95 | 2.39 | 12.1 | 12.0 | Sy2 |
| IRAS 15206+3342 | 0.125 | 578 | 2.2 | 0.08 | 0.35 | 1.77 | 1.89 | 12.3 | 12.1 | H ii |
| IRAS 20414−1651 | 0.086 | 387 | 1.6 | <0.65 | 0.35 | 4.36 | 5.25 | 12.3 | 12.1 | H ii |
| IRAS 21219−1757 | 0.112 | 514 | 2.0 | 0.21 | 0.45 | 1.07 | 1.18 | 12.1 | 11.8 | Sy1 |
| IRAS 22491−1808 | 0.076 | 340 | 1.4 | 0.05 | 0.55 | 5.44 | 4.45 | 12.2 | 12.1 | H ii |
Note. Columns: (1) Object name. (2) Redshift by Kim et al. (2002). (3) Luminosity distance (in Mpc). (4) Physical scale (in kpc arcsec−1). (5)–(8) f12, f25, f60, and f100 are IRAS fluxes at 12 μm, 25 μm, 60 μm, and 100 μm (in Jy), respectively, taken from Kim & Sanders (1998). (9) Decimal logarithm of infrared (8−1000 μm) luminosity in units of solar luminosity (L⊙), calculated with LIR = 2.1 × 1039 × dL(Mpc)2 × (13.48 × f12 + 5.16 × f25 + 2.58 × f60 + f100) (erg s−1) (Sanders & Mirabel 1996). (10) Decimal logarithm of far-infrared (40−500 μm) luminosity in units of solar luminosity (L⊙), calculated with LFIR = 2.1 × 1039 × dL(Mpc)2 × (2.58 × f60 + f100) (erg s−1) (Sanders & Mirabel 1996). (11) Optical spectroscopic classification by Veilleux et al. (1999). “LINER,” “H ii,” “unclass,” “Sy2,” “Sy1” mean LINER, H ii region, unclassified, Seyfert 2, and Seyfert 1, respectively. Seyfert 1 and 2 are usually regarded as optically identified AGNs.
Download table as: ASCIITypeset image
3. Observations and Data Analyses
We used the K′-band (2.1 ± 0.2 μm) and L′-band (3.8 ± 0.4 μm) filters of the infrared camera and spectrograph (IRCS) (Kobayashi et al. 2000) of the Subaru 8.2 m telescope atop Maunakea, Hawaii (Iye et al. 2004), to conduct our infrared observations. The 188-element AO system, which employs laser-guide stars (LGS) or natural-guide stars (NGS) (Hayano et al. 2008, 2010), was used to achieve higher spatial resolution (<03) than natural seeing (0
4–1
0 in the K′ and L′ bands). We chose the LGS-AO mode whenever possible; however, NGS-AO was used for observations in 2015 September and 2018 May (Table 2) because of technical issues with LGS-AO. For LGS-AO, a star or compact object brighter than 18–19 mag in the optical R band (0.6 μm) within ∼90″ of the target was needed as a guide star for tip–tilt correction. The AO correction itself was made with a laser spot created by the LGS-AO system with an optical R-band magnitude of ∼11–14.5 mag, depending on the target elevation, Earth’s atmospheric conditions, and LGS-AO system performance. The magnitude of the laser spot was generally fainter than those of our previous observations before 2013 (Imanishi & Saito 2014) because of degraded LGS-AO performance. For NGS-AO, a star or compact source brighter than R = 16.5 mag within ∼30″ of the target was necessary as a guide star for reasonable AO correction. Table 2 summarizes the details of our observations, including standard stars for photometric calibration and guide stars for tip–tilt or AO correction.
Table 2. Observation Log
| Object | Band | Date | Exposure | Standard Star | LGS-AO or NGS-AO Guide Star | |||
|---|---|---|---|---|---|---|---|---|
| (UT) | (minutes) | Name | (mag) | Name | R-band | Separation | ||
| USNO | (mag) | (arcsec) | ||||||
| (1) | (2) | (3) | (4) | (5) | (6) | (7) | (8) | (9) |
| IRAS 00456−2904 | K′ | 2015 Aug 21 | 18 | FS 1 | 12.98 | Nucleus | 15 | 0 |
| L′ | 2015 Aug 21 | 25.2 | G158-27 | 6.99 | Nucleus | 15 | 0 | |
| IRAS 04103−2838 | K′ | 2015 Feb 1 | 9 | FS 112 | 10.86 | USNO 0614-0044366 | 15 | 35 |
| L′ | 2015 Feb 1 | 9 | HD 22686 | 7.20 | USNO 0614-0044366 | 15 | 35 | |
| IRAS 08559+1053 | K′ | 2015 Feb 1 | 9 | FS 126 | 11.64 | USNO 1006-0166801 | 18 | 45 |
| L′ | 2015 Feb 1 | 9 | HD 77281 | 7.04 | USNO 1006-0166801 | 18 | 45 | |
| IRAS 09039+0503 | K′ | 2019 Apr 20 | 13.5 | FS 126 | 11.64 | USNO 0948-0171026 | 15 | 43 |
| L′ | 2019 Apr 21 | 22.5 | HD 77281 | 7.04 | USNO 0948-0171026 | 15 | 43 | |
| IRAS 09116+0334 | K′ | 2015 Feb 1 | 9 | FS 126 | 11.64 | USNO 0933-0204204 | 14 | 30 |
| L′ | 2015 Feb 1 | 18 | HD 77281 | 7.04 | USNO 0933-0204204 | 14 | 30 | |
| IRAS 10035+2740 | K′ | 2019 Apr 20 | 13.5 | FS 126 | 11.64 | USNO 1174-0222148 | 18 | 32 |
| L′ | 2019 Apr 20 | 13.5 | HD 105601 | 6.67 | USNO 1174-0222148 | 18 | 32 | |
| IRAS 10190+1322 | K′ | 2015 Feb 1 | 9 | FS 126 | 11.64 | USNO 1031-0209138 | 17 | 19 |
| L′ | 2015 Feb 1 | 18 | HD 77281 | 7.04 | USNO 1031-0209138 | 17 | 19 | |
| IRAS 11506+1331 | K′ | 2019 Apr 21 | 9 | FS 129 | 10.64 | USNO 1032-0218808 | 15 | 36 |
| L′ | 2019 Apr 21 | 13.5 | HD 106965 | 7.31 | USNO 1032-0218808 | 15 | 36 | |
| IRAS 12072−0444 | K′ | 2019 Apr 21 | 9 | FS 129 | 10.64 | USNO 0849-0231140 | 18 | 38 |
| L′ | 2019 Apr 21 | 13.5 | HD 77281 | 7.04 | USNO 0849-0231140 | 18 | 38 | |
| K′ | 2018 May 20 | 4.5 | FS 19 | 13.79 | Nucleusa | 15 | 0 | |
| L′ | 2018 May 20 | 13.5 | GL 347A | 7.37 | Nucleusa | 15 | 0 | |
| IRAS 12112+0305 | K′ | 2015 Feb 1 | 9 | FS 132 | 11.84 | USNO 0927-0276322 | 13 | 65 |
| L′ | 2015 Feb 1 | 18 | HD 106965 | 7.31 | USNO 0927-0276322 | 13 | 65 | |
| IRAS 13539+2920 | K′ | 2016 Apr 17 | 13.5 | p138-c | 11.10 | USNO 1190-0215111 | 16 | 29 |
| L′ | 2016 Apr 17 | 11.3 | HD 105601 | 6.67 | USNO 1190-0215111 | 16 | 29 | |
| IRAS 14202+2615 | K′ | 2016 Apr 17 | 4.5 | p138-c | 11.10 | Nucleus | 15 | 0 |
| L′ | 2016 Apr 17 | 11.3 | HD 105601 | 6.67 | Nucleus | 15 | 0 | |
| IRAS 14394+5332 | K′ | 2019 Apr 20 | 9 | FS 131 | 11.32 | USNO 1433-0256687 | 15 | 66 |
| L′ | 2019 Apr 20 | 11.3 | HD 105601 | 6.67 | USNO 1433-0256687 | 15 | 66 | |
| IRAS 15206+3342 | K′ | 2016 Apr 17 | 9 | p138-c | 11.10 | USNO 1235-0241068 | 16 | 40 |
| L′ | 2016 Apr 17 | 15 | HD 105601 | 6.67 | USNO 1235-0241068 | 16 | 40 | |
| IRAS 20414−1651 | K′ | 2015 Sep 19 | 27 | FS 153 | 10.89 | USNO 0733-0845610a | 13 | 30 |
| L′ | 2015 Sep 19 | 37.8 | G158-27 | 6.99 | USNO 0733-0845610a | 13 | 30 | |
| IRAS 21219−1757 | K′ | 2015 Sep 19 | 9 | FS 34 | 13.00 | Nucleusa | 14 | 0 |
| L′ | 2015 Sep 19 | 12.6 | GL 811.1 | 6.69 | Nucleusa | 14 | 0 | |
| IRAS 22491−1808 | K′ | 2015 Aug 21 | 18 | S667-D | 11.54 | USNO 0721-1176564 | 15 | 58 |
| L′ | 2015 Aug 21 | 18.8 | G158-27 | 6.99 | USNO 0721-1176564 | 15 | 58 | |
Notes. Columns: (1) Object name. (2) Observed band: K′ (2.1 μm) or L′ (3.8 μm). (3) Observation date (in UT). (4) Net on-source exposure time (in minutes). (5) Standard star’s name. (6) Standard star’s magnitude in the K′ or L′ band. (7) Guide star’s name (USNO number) used for LGS-AO tip–tilt correction or NGS-AO correction. (8) Guide star’s optical R-band magnitude. (9) Separation between the target object and guide star (in arcsec).
aNGS-AO guide star.Download table as: ASCIITypeset image
During the observations of the ULIRGs in Table 2, the sky was clear. For our K′-band observations, the 52 mas (52.77 mas pixel−1) imaging mode was employed. The field of view was 5404 × 54
04 for the full-array mode (1024 × 1024 pixels2). For our L′-band observations, we used the 20 mas (20.57 mas pixel−1) imaging mode to avoid saturation by large background emission from Earth’s atmosphere. The field of view was 21
06 × 21
06 in the full-array mode. Even with the 20 mas mode, a subarray mode (768 × 768 pixels2 or 896 × 896 pixels2) was necessary to avoid saturation for some ULIRGs, depending on conditions (e.g., Earth’s atmospheric temperature and/or precipitable water vapor above the observation site). Because object signals are more difficult to recognize in short-exposure images in the L′-band than in the K′ band, due to large background noise from Earth, we first took a K′-band image using the 20 mas mode, moved the ULIRG’s nuclear emission to the center of the array, and then inserted the L′-band filter.
For the K′-band observations of ULIRGs, the exposure times were 1–30 s, and 2–60 coadds were applied. For the L′-band observations, the exposure times were 0.07–0.12 s, and there were 250–400 coadds. The individual exposure times were determined to set signal levels at the object positions well below the linearity level of the IRCS imaging array (≲4000 ADU). We used nine-point dithering patterns for ULIRGs in both the K′ and L′ bands to correct for the effects of bad pixels by placing object signals at nine positions on the array. This nine-point dithering sequence was repeated multiple times for faint ULIRGs when necessary. For L′-band fainter ULIRGs, we generally integrated for a longer time. In every observation run, photometric K′- and L′-band standard stars (Table 2) were observed for flux calibration.
We adopted standard data analysis procedures using IRAF.5 First, we created median-combined sky frames from the nine-point dithered data set to make a sky flat image after masking the positions of bright objects and bad pixels. Second, we subtracted sky emission from individual frames and divided the resulting images by the sky flat frames for flat-fielding. Third, we shifted the sky-subtracted, flat-fielded images to place the peak position of the target on the same pixel in the array using the emission of compact bright sources within the field of view whenever available. However, no appropriate compact emission required for an accurate estimate of this shift was found in the L′-band data of some fraction of ULIRGs, for which offset values were calculated from the input values of the dithering amplitude and pixel scale of the instrument. We then average-combined the shifted frames and obtained final images. For ULIRGs without bright compact objects within the field of view, the final image size of compact emission could have been affected by possible mechanical pointing errors of the Subaru Telescope at each dithering position, in addition to Earth’s atmospheric seeing, and thus could have been slightly worse than for ULIRGs with bright compact objects within the field of view.
For standard star photometry, we adopt an aperture of 25 radius to recover almost all emission flux. For ULIRGs, however, the aperture size for flux measurements has to be carefully considered. Our science goal is to search for compact, red K′ − L′ (= large K′ − L′ value) emission originating from AGNs in galaxy nuclei by minimizing contamination from spatially extended (more than a few kiloparsecs) star formation emission in the host galaxy. The smallest possible aperture size is preferred, as long as the bulk of the compact nuclear emission is recovered. However, this is not a trivial task for ground-based AO data, because, in addition to a spatially compact (<0
3) AO-corrected core component, a seeing-sized spatially extended AO halo component is also present. If we set the aperture to a seeing size, almost all compact nuclear emission can be recovered, but at the same time, significant contamination from spatially extended (more than a few kiloparsecs) star formation emission in the host galaxy will be included, in particular in the K′ band, which can make the observed K′ − L′ color bluer than the intrinsic color of the compact nuclear emission. This systematic uncertainty arising from the choice of aperture size has to be considered more carefully than statistical photometric uncertainty, which is usually much smaller in the K′ band and is also small in the L′ band (except for ULIRGs that are very faint in the L′ band).
We investigated the growth curve of signals as a function of aperture size using AO-corrected data of standard stars and confirmed that ≳75% of point source emission was recovered with 05 radius aperture measurements, as in the case of Imanishi & Saito (2014). For standard stars, which are very bright in the optical, their AO correction is generally good. However, it is not obvious whether similarly good AO correction is achieved for ULIRGs, because AO guide stars are generally fainter than bright standard stars in the optical and there is some separation between AO guide stars and target ULIRGs. We created the growth curve of signals using bright, compact objects (compact ULIRGs themselves and/or compact sources other than the target ULIRGs whenever available) inside the field of view of ULIRG data taken from 2015 to 2019; these are shown in Appendix A. We confirmed that ≳75% of the compact emission was usually recovered with a 0
5 radius aperture. We thus make photometry of the ULIRG’s compact nuclear emission with a 0
5 radius aperture, where possible photometric uncertainty is estimated to be ≲0.3 mag (i.e., the difference between ≳75% and 100% recovery). For L′-band undetected faint ULIRG nuclei, we assume that their radial emission profile is similar to that of L′-band detected bright ULIRG nuclei within the same field of view or in a different image taken on the same night (for ULIRGs with no L′-band detection in any nuclei). This assumption is reasonable because ULIRG’s nuclear L′-band emission is usually dominated by a compact component, with minimum contamination from spatially extended star formation emission (Figure 2). Because the same guide stars were used for the K′- and L′-band observations of each ULIRG, the possible photometric uncertainty of the K′ − L′ colors of the ULIRG’s compact nuclear emission is expected to be smaller than the uncertainty in the individual K′- and L′-band photometry of the emission, say <0.2 mag (i.e., the difference in signal recovery from compact emission within the 0
5 radius aperture between K′ and L′).
Download figure:
Standard image High-resolution image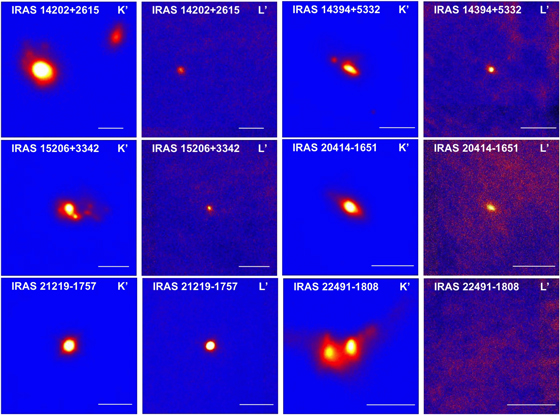
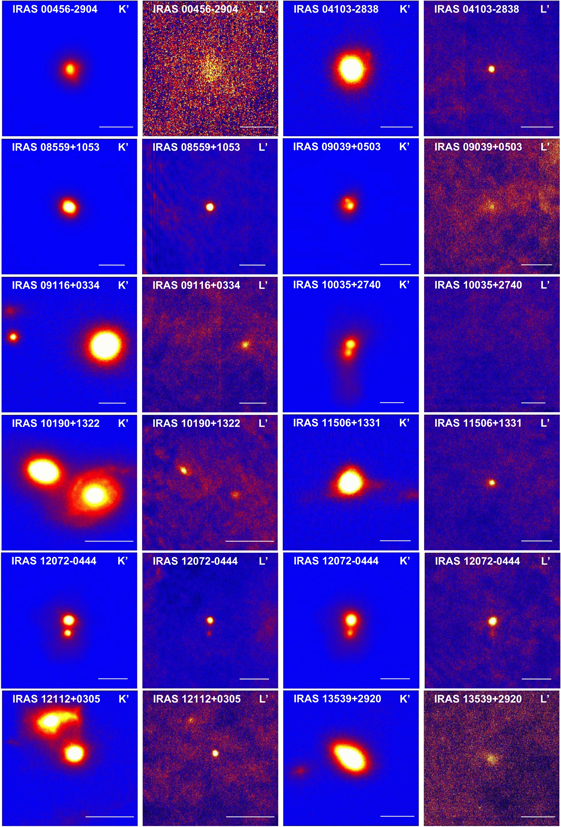
Figure 2. Infrared K′-band (2.1 μm) and L′-band (3.8 μm) AO images of observed ULIRGs. North is up, and east is to the left. The field of view (FOV) is 10″ × 10″. The length of the white horizontal bar at the lower right side of each image corresponds to 5 kpc at the distance of each ULIRG. For IRAS 12072−0444 (fifth row), the left and right two panels are data taken in 2019 April (LGS-AO) and 2018 May (NGS-AO), respectively. The maximum and minimum signal display scale of each image is adjusted to make interesting features clearly visible. For IRAS 14394+5332, we observed the E and EE nuclei in Kim et al. (2002). For IRAS 00456−2904, the fainter NE nucleus ∼113 away from the brighter SW nucleus is outside the field of view and is not displayed. This fainter NE nucleus was detected by Kim et al. (2002) in a seeing-limited infrared image at ∼2.2 μm and is not newly resolved into multiple emission components in our AO-assisted higher-spatial-resolution K′-band image. IRAS 04103−2838, IRAS 08559+1053, IRAS 11506+1331, IRAS 20414−1651, and IRAS 21219−1757 are classified as single-nucleus ULIRGs in our K′-band images. For L′-band undetected ULIRGs, we have no way to accurately identify the nuclear peak position using actual signals. The nuclear position may be slightly displaced from the center of each image, but we see no significant emission even in the surrounding area.
Download figure:
Standard image High-resolution imageThe laser spot magnitudes during ULIRG observation (Table 1) were fainter than those in 2011–2013; thus, the AO correction may have been slightly worse than in our previous study (Imanishi & Saito 2014). We may have lost a larger fraction of the ULIRG’s compact nuclear emission than in Imanishi & Saito (2014) with 05 radius aperture photometry. We thus use a slighter larger 0
75 radius aperture as well. If compact red K′ − L′ emission is detected in both the 0
5 and 0
75 radius aperture photometry, we will be able to argue strongly about the presence of an L′-band continuum-emitting, luminous AGN. Remaining possible uncertainties of K′ − L′ color in our AO data measurements of ULIRG nuclei are explained in Appendix B.
In summary, the derived K′ − L′ color of the compact nuclear emission of a ULIRG is expected to have systematic uncertainty of up to 0.2 mag or so. This level of uncertainty will not significantly affect our discussion of the presence of a luminous AGN, because the difference in K′ − L′ color between pure star formation (K′ − L′ < 1 mag) (Hunt et al. 2002) and a pure luminous AGN (K′ − L′ ∼ 2 mag) (Ivanov et al. 2000; Alonso-Herrero et al. 2003; Videla et al. 2013) is much larger than ∼0.2 mag.
4. Results
Figure 2 displays infrared K′-band (2.1 μm) and L′-band (3.8 μm) images of observed ULIRGs. Although all ULIRGs are clearly detected in the K′ band, the detection rate in the L′ band is lower because of the lower sensitivity due to the larger background noise from Earth in ground-based observations.
In the K′ band, multiple emission components are evident in a large fraction (12 out of 17) of observed sources, which suggests the presence of multiple merging galaxy nuclei and supports the widely accepted merger origin scenario of nearby ULIRGs (Sanders et al. 1988; Taniguchi & Shioya 1998). In particular, for IRAS 09039+0503, IRAS 10035+2740, IRAS 12072−0444, and IRAS 15206+3342, although multiple nuclear emission with small separation was not identified in previously taken seeing-limited imaging data (Kim et al. 2002), our AO-assisted high-spatial-resolution imaging data clearly resolve multiple nuclear emission (Figure 2). For IRAS 09039+0503, ALMA high-spatial-resolution (<02) continuum emission data at ∼1.2 mm also reveal two nuclear components with ∼0
5 separation along the southwest (SW) to northeast (NE) direction, with the SW nucleus significantly brighter than the NE one, in a similar way to our infrared K′-band data (Imanishi et al. 2019).
In the L′ band, multiple nuclear emission is clearly seen only in IRAS 10190+1322, IRAS 12072−0444, and IRAS 12112+0305 (Figure 2). Table 3 summarizes nuclear K′- and L′-band magnitudes and K′ − L′ color in 05 and 0
75 radius aperture measurements.
Table 3. Nuclear Photometry and Estimated AGN Contribution
| 0 |
0 |
fAGN | LAGN | |||||
|---|---|---|---|---|---|---|---|---|
| Object | K′ | L′ | K′ − L′ | K′ | L′ | K′ − L′ | (%) | (1044 erg s−1) |
| (1) | (2) | (3) | (4) | (5) | (6) | (7) | (8) | (9) |
| IRAS 00456−2904 SW | 14.6 | 14.0 | 0.7 | 14.1 | 13.5 | 0.6 | 22 | 0.03 |
| IRAS 00456−2904 NE | 18.1 | >14.4 | <3.7 | 17.6 | >13.9 | <3.6 | <100 | <0.2 |
| IRAS 04103−2838 | 14.1 | 12.5 | 1.6 | 13.8 | 12.3 | 1.5 | 85 | 0.6 |
| IRAS 08559+1053 | 13.1 | 11.3 | 1.9 | 12.9 | 11.1 | 1.8 | 97 | 3 |
| IRAS 09039+0503a | 15.1 | 13.2 | 1.8 | 14.6 | 12.7 | 1.9 | 93 | 0.4 |
| IRAS 09116+0334 W | 14.1 | 13.3 | 0.7 | 13.7 | 13.0 | 0.7 | 22 | 0.1 |
| IRAS 09116+0334 SE | 17.0 | >14.4 | <2.7 | 16.7 | >14.0 | <2.7 | <100 | <0.2 |
| IRAS 09116+0334 NE | 17.9 | >14.4 | <3.5 | 17.3 | >14.0 | <3.3 | <100 | <0.2 |
| IRAS 10035+2740 N | 15.8 | >14.9 | <0.8 | 15.5 (0 |
>14.9 (0 |
<0.6 (0 |
<33 | <0.05 |
| IRAS 10035+2740 S | 15.9 | >14.9 | <0.9 | 15.6 (0 |
>14.9 (0 |
<0.7 (0 |
<42 | <0.07 |
| IRAS 10190+1322 E | 14.1 | 13.2 | 0.8 | 13.6 | 12.9 | 0.7 | 32 | 0.05 |
| IRAS 10190+1322 W | 14.6 | 14.2 | 0.4 | 14.2 | 14.3 | −0.1 | 0 | 0 |
| IRAS 11506+1331 | 14.3 | 13.0 | 1.3 | 14.0 | 12.7 | 1.3 | 70 | 0.4 |
| IRAS 12072−0444 N (2019 Apr) | 14.4 | 12.3 | 2.1 | 14.3 (0 |
12.3 (0 |
2.0 (0 |
100 | 1 |
| IRAS 12072−0444 S (2019 Apr) | 15.3 | 13.9 | 1.4 | ⋯b | ⋯b | ⋯b | 75 | 0.2 |
| IRAS 12072−0444 N (2018 May) | 14.7 | 12.3 | 2.5 | 14.5 (0 |
12.1 (0 |
2.4 (0 |
100 | 1 |
| IRAS 12072−0444 S (2018 May) | 15.6 | 14.0 | 1.5 | ⋯b | ⋯b | ⋯b | 80 | 0.2 |
| IRAS 12112+0305 SW | 14.6 | 13.5 | 1.1 | 14.4 | 13.3 | 1.0 | 57 | 0.06 |
| IRAS 12112+0305 NE | 15.4 | 14.3 | 1.1 | 14.9 | 13.9 | 1.0 | 57 | 0.03 |
| IRAS 13539+2920 NW | 15.1 | 13.4 | 1.6 | 14.5 | 13.0 | 1.6 | 85 | 0.2 |
| IRAS 13539+2920 SE | 18.0 | >13.9 | <4.1 | 17.4 | >13.5 | <4.0 | <100 | <0.2 |
| IRAS 14202+2615 SE | 14.6 | 12.6 | 2.0 | 14.2 | 12.4 | 1.8 | 100 | 1 |
| IRAS 14202+2615 NW | 16.6 | >13.8 | <2.9 | 16.1 | >13.6 | <2.5 | <100 | <0.5 |
| IRAS 14394+5332 SWc | 14.3 | 12.8 | 1.5 | 13.9 | 12.7 | 1.3 | 80 | 0.3 |
| IRAS 14394+5332 NEc | 15.8 | >15.3 | <0.5 | 15.6 (0 |
>15.2 (0 |
<0.4 (0 |
0 | 0 |
| IRAS 15206+3342 NE | 14.7 | 12.8 | 2.0 | 14.5 (0 |
12.6 (0 |
1.9 (0 |
100 | 0.6 |
| IRAS 15206+3342 SW | 15.4 | >14.5 | <0.9 | 15.1 (0 |
>14.4 (0 |
<0.7 (0 |
<42 | <0.06 |
| IRAS 20414−1651 | 14.4 | 13.8 | 0.6 | 14.1 | 13.5 | 0.6 | 12 | 0.01 |
| IRAS 21219−1757 | 11.7 | 9.8 | 2.0 | 11.6 | 9.7 | 1.9 | 100 | 8 |
| IRAS 22491−1808 E | 15.8 | >14.5 | <1.3 | 15.1 | >14.1 | <1.1 | <70 | <0.04 |
| IRAS 22491−1808 W | 15.6 | >14.5 | <1.0 | 15.1 | >14.1 | <1.0 | <50 | <0.03 |
Notes. Columns: (1) Object name. For IRAS 12072−0444, data from both 2019 April and 2018 May are presented. (2)–(4) K′-band (2.1 μm) magnitude, L′-band (3.8 μm) magnitude, and K′ − L′ color in mag, respectively, measured with a 05 radius aperture. (5)–(7) K′-band magnitude, L′-band magnitude, and K′ − L′ color in mag, respectively, measured with a 0
75 radius aperture. For a few ULIRGs with small nuclear separation, a 0
6 radius aperture is used instead to minimize contamination from another galaxy nucleus. These sources are denoted as “(0
6)” in columns (5)–(7). Uncertainty is up to ∼0.3 mag for the K′- and L′-band photometry of compact nuclear emission and up to ∼0.2 mag for its K′ − L′ color. (8) AGN fraction in the L′ band (in %), derived from the K′ − L′ color measurements with the 0
5 radius aperture. See Section 5.1. (9) AGN luminosity in units of 1044 erg s−1 estimated from the νFν value of AGN origin at L′ after the removal of the contribution from stellar emission, based on the 0
5 radius aperture photometry. The possible uncertainty is <0.2 mag (<20%) in the sense that the AGN luminosity may be underestimated. We assume an AGN surrounded by dust in all directions, where the surrounding dust has a strong temperature gradient (inner dust has higher temperature) and luminosity is transferred from hotter inside close to the innermost dust sublimation radius (emitting ∼3 μm infrared light) to cooler outside (emitting a longer infrared wavelength) (Imanishi et al. 2007, 2010a, 2010b; Imanishi 2009).
Download table as: ASCIITypeset image
5. Discussion
5.1. Luminous AGNs in Individual ULIRG Nuclei
We proceed with our discussion of the AGN contribution to the observed compact nuclear L′-band flux, following that presented in Imanishi & Saito (2014). Although the intrinsic K′ − L′ colors are slightly different among individual star formation and AGNs, we adopt K′ − L′ = 0.5 mag for pure star formation (Hunt et al. 2002) and K′ − L′ = 2.0 mag for a pure luminous AGN (Ivanov et al. 2000; Alonso-Herrero et al. 2003; Videla et al. 2013). The observed nuclear K′ − L′ color is expected to increase (become redder) with increasing AGN contribution. As discussed in Imanishi & Saito (2014), a red K′ − L′ color is primarily caused by emission from hot dust heated by a luminous AGN rather than dust reddening of star formation, whose possible effect is estimated to be limited (<0.3 mag for AV = 10 mag dust extinction of star formation). We calculate the contribution of star formation (K′ − L′ = 0.5 mag) and an AGN (K′ − L′ = 2.0 mag) to the observed compact nuclear L′-band emission, to reproduce the observed K′ − L′ colors measured with the 05 aperture. For example, when the observed K′ − L′ color is ≲0.5, 0.8, 1.0, 1.5, ≳2.0 mag, the AGN contribution to the observed compact nuclear L′-band flux is estimated to be 0%, 32%, 50%, 80%, 100%, respectively (Imanishi & Saito 2014). The estimated AGN contribution in individual ULIRG nuclei is summarized in Table 3 (column 8). We classify ULIRG nuclei with K′ − L′ > 1.0 mag as those containing luminous AGNs, because >50% AGN contribution is indicated.
In Table 3, for a large fraction of ULIRGs, the observed K′ − L′ colors are >1.0 mag in the K′-band brightest primary nuclei, which suggests the presence of luminous AGNs there. In particular, red K′ − L′ colors with >1.0 mag are confirmed at the primary nuclei of all four ULIRGs with optically identified AGNs (i.e., optical Seyferts in Table 1; IRAS 08559+1053, IRAS 12072−0444, IRAS 14394+5332, and IRAS 21219−1757), which supports the validity of our method. For ULIRGs whose 2–5 μm emission is dominated by single nuclei, WISE W1 (3.4 μm) and W2 (4.6 μm) photometry with larger beam sizes (∼6″) can also be used to identify luminous AGNs in the primary galaxy nuclei based on W1 − W2 > 0.8 mag (Stern et al. 2012). Table 4 summarizes the WISE W1 − W2 colors of observed ULIRGs. For all ULIRGs with WISE-classified luminous AGNs, our higher-spatial-resolution AO imaging data support the presence of luminous AGNs from red K′ − L′ colors (>1.0 mag), which reinforces the argument that our K′ − L′ color-based AGN selection is effective and highly complete. For two ULIRGs (IRAS 09039+0503 and IRAS 13539+2920), luminous AGN signatures are not clearly seen in WISE data but are found in our AO data (Table 4), possibly because our higher-spatial-resolution AO data are more sensitive to luminous AGNs, by probing only compact nuclear regions with reduced contamination from spatially extended star formation emission in the host galaxies.
Table 4. WISE Data and Infrared AGN Selection
| Object | W1 (3.4 μm) | W2 (4.6 μm) | W1 − W2 | K′ − L′ |
|---|---|---|---|---|
| (mag) | (mag) | (mag) | (mag) | |
| (1) | (2) | (3) | (4) | (5) |
| IRAS 00456−2904 | 12.7 | 12.0 | 0.7 | 0.7 |
| IRAS 04103−2838 | 12.3 | 11.0 | 1.3 (AGN) | 1.6 (AGN) |
| IRAS 08559+1053 | 11.6 | 10.5 | 1.1 (AGN) | 1.9 (AGN) |
| IRAS 09039+0503 | 13.5 | 12.8 | 0.7 | 1.8 (AGN) |
| IRAS 09116+0334 | 12.7 | 12.2 | 0.5 | 0.7 |
| IRAS 10035+2740 | 13.6 | 13.0 | 0.6 | <0.8 + <0.9 |
| IRAS 10190+1322 E | 12.3 | 11.6 | 0.6 | 0.8 |
| IRAS 10190+1322 W | 12.6 | 12.3 | 0.3 | 0.4 |
| IRAS 11506+1331 | 12.9 | 11.5 | 1.4 (AGN) | 1.3 (AGN) |
| IRAS 12072−0444 | 12.0 | 10.7 | 1.3 (AGN) | 2.1+1.4 (AGN) |
| IRAS 12112+0305 | 12.3 | 11.5 | 0.8 (AGN) | 1.1+1.1 (AGN?) |
| IRAS 13539+2920 | 12.9 | 12.1 | 0.8 | 1.6 (AGN) |
| IRAS 14202+2615 | 12.0 | 10.9 | 1.1 (AGN) | 2.0 (AGN) |
| IRAS 14394+5332 E | 12.4 | 11.0 | 1.4 (AGN) | 1.5 (AGN) |
| IRAS 15206+3342 | 12.5 | 11.3 | 1.2 (AGN) | 2.0 + <0.9 (AGN) |
| IRAS 20414−1651 | 13.0 | 12.2 | 0.8 | 0.6 |
| IRAS 21219−1757 | 9.9 | 8.9 | 1.0 (AGN) | 2.0 (AGN) |
| IRAS 22491−1808 | 12.7 | 12.2 | 0.5 | <1.3 + <1.0 |
Note. Columns: (1) Object name. (2) WISE W1 (3.4 μm) magnitude. (3) WISE W2 (4.6 μm) magnitude. (4) WISE W1 − W2 color in mag. When the W1 − W2 color exceeds the WISE AGN selection criterion of >0.8 mag (Stern et al. 2012), a note “(AGN)” is added. For reference, the WISE W1 − W2 color of IRAS 12112+0305 is slightly above 0.8 mag, but those of IRAS 13539+2920 and IRAS 20414−1651 are slightly below 0.8 mag. (5) K′ − L′ color in mag based on our 05 radius aperture photometry of the Subaru AO data. For some fraction of sources, our high-spatial-resolution AO data resolve the WISE-detected component into multiple galaxy nuclei. When the primary galaxy nucleus is more than 1 mag brighter than other, fainter galaxy nuclei, we assign the color of the primary galaxy nucleus, because it should dominate the observed WISE color. When the difference in the K′-band magnitude (0
5 radius aperture photometry) between the primary and secondary galaxy nuclei is less than 1 mag, we give the K′ − L′ colors of both nuclei for reference. When the K′ − L′ color exceeds our AGN selection criterion of >1.0 mag, a note “(AGN)” is added. Given the potential ≲0.2 mag uncertainty in the K′ − L′ color, a source with K′ − L′ = 1.1 mag is noted as “(AGN?).”
Download table as: ASCIITypeset image
Of three ULIRGs with multiple detected L′-band emission (IRAS 10190+1322, IRAS 12072−0444, and IRAS 12112+0305) (Section 4), only IRAS 12072−0444 has two galaxy nuclei with K′ − L′ color significantly redder than 1.0 mag (Table 3); thus, it is classified as a dual AGN by our definition. Since the two red K′ − L′ nuclei of IRAS 12072−0444 are found in two independent data using different AO guide stars with largely different properties (Table 2), the dual AGN classification should be solid. IRAS 12112+0305 also shows two galaxy nuclei with K′ − L′ = 1.1 mag (05 radius aperture) (Table 3); given the possible systematic uncertainty of ≲0.2 mag in the K′ − L′ color (Section 3), the dual AGN classification of IRAS 12112+0305 is only provisional. However, because the AO guide star of IRAS 12112+0305 is relatively bright among the observed ULIRGs (Table 2), it is expected that a large fraction of compact emission resides in the AO core component and that the uncertainty in the measured K′ − L′ color is small. We thus classify IRAS 12112+0305 as a possible dual AGN candidate. For IRAS 10190+1322, the K′ − L′ colors of both galaxy nuclei are <1.0 mag; thus, there is no clear indication of a luminous AGN in either galaxy nucleus.
In other ULIRGs in Table 3, although many primary galaxy nuclei show K′ − L′ > 1.0 mag, K′-band fainter secondary galaxy nuclei are mostly undetected in the L′ band, which precludes meaningful constraints on the K′ − L′ colors and identification of dual AGNs.
In summary, our infrared K′- and L′-band AO-assisted high-spatial-resolution imaging observations have revealed a strong dual AGN candidate in IRAS 12072−0444 and another possible candidate in IRAS 12112+0305. These ULIRGs have not previously been recognized as dual AGNs and so are infrared-identified dual AGNs by our observations. The infrared-detected dual AGN fraction in our new nearby ULIRG sample is only ∼12% (=2/17). Imanishi & Saito (2014) previously used the same infrared method and found a low dual AGN fraction in nearby merging ULIRGs (∼13% = 3/23) and less infrared-luminous galaxies (∼17% = 1/6). Our new and previous results together suggest that the infrared-detected dual AGN fraction in nearby merging ULIRGs is much less than unity (<20%).
In Imanishi & Saito (2014) and this paper, 19 out of 23 and 12 out of 17 ULIRGs show spatially resolved K′-band multiple nuclear components, respectively. We also estimate the infrared-detected dual AGN fraction relative to ULIRGs with K′-band resolved multiple nuclei, because there may exist luminous dual AGNs that are not spatially resolved simply due to limited spatial resolution of our imaging data. The fraction is <20% (=5/31), still much smaller than unity. Given the small dust extinction effects in the infrared >2 μm, we regard it as unlikely that the dominant fraction of putative luminous AGNs is missed because of dust obscuration. It may be that not all SMBHs in merging ULIRGs become sufficiently luminous AGNs to be detectable through our infrared search. In the next subsection, we investigate the activation of SMBHs in multiple galaxy nuclei separately.
5.2. Activation of SMBHs in the Nuclei of Individual ULIRGs
For ULIRGs in which K′-band emission is detected in multiple nuclei and L′-band emission is detected in at least one nucleus, we compare in Figure 3(a) the ratio of K′-band luminosity within the central 4 kpc in diameter (Kim et al. 2002) and that of nuclear L′-band luminosity between the primary and secondary galaxy nuclei, following Imanishi & Saito (2014). These ratios are shown in Table 5.
Figure 3. (a) Luminosity ratio between the K′-band brighter primary and fainter secondary galaxy nuclei. The luminosity at the primary nucleus is divided by that at the secondary nucleus. The abscissa is the ratio of K′-band emission (central 4 kpc diameter aperture photometry) (Kim et al. 2002), which is regarded as a stellar luminosity ratio or approximately a central SMBH mass ratio between the primary and secondary galaxy nuclei (see Section 5.2). The ordinate is the ratio of nuclear L′-band emission (05 radius aperture photometry), largely coming from a luminous AGN, and so is taken as the AGN luminosity ratio between the primary and secondary galaxy nuclei. The solid straight line indicates the same ratio between the abscissa and ordinate. If the primary galaxy nucleus has a more active SMBH with higher SMBH-mass-normalized AGN luminosity than the secondary, this source is located above the solid straight line. (b) Same as (a), but the ordinate is the AGN-origin L′-band luminosity ratio, after removing possible stellar contribution to the observed nuclear L′-band emission in each galaxy nucleus (Table 3, column 8). In both (a) and (b), larger circles indicate ULIRGs observed in the current study, and smaller circles are sources presented in Imanishi & Saito (2014).
Download figure:
Standard image High-resolution imageTable 5. Luminosity Ratio and Nuclear Separation in Spatially Resolved ULIRGs with Multiple Nuclei
| Object | K′(Stellar) Ratio | L′ Ratio | L′(AGN) Ratio | Separation | Separation |
|---|---|---|---|---|---|
| (arcsec) | (kpc) | ||||
| (1) | (2) | (3) | (4) | (5) | (6) |
| IRAS 00456−2904 SW, NE | 26 (14.0, 17.5) | >1.5 | >0.3 | 11 | 23 |
| IRAS 09116+0334 W, SE | 18 (13.9, 17.1) | >2.7 | >0.5 | 6.8 | 17 |
| IRAS 10190+1322 E, W | 1.4 (13.6, 14.0) | 2.4 |

|
4.1 | 5.7 |
| IRAS 12072−0444 N, S (2019 Apr) | 2.3 (14.4, 15.3)a | 4.3 | 5.7 | 0.96 | 2.2 |
| IRAS 12112+0305 SW, NE | 1.2 (14.3, 14.5) | 2.0 | 2.0 | 3.0 | 4.1 |
| IRAS 13539+2920 NW, SE | 14 (14.3, 17.1) | >1.6 | >1.3 | 3.8 | 7.6 |
| IRAS 14202+2615 SE, NW | 6.2 (14.5, 16.4) | >3.0 | >3.0 | 6.0 | 16 |
| IRAS 14394+5332 SW, NE | 2.2 (13.9, 14.8) | >10 |

|
1.3 | 2.5 |
| IRAS 15206+3342 NE, SW | 1.9 (14.7, 15.4)a | >5.3 | >12 | 0.71 | 1.6 |
Notes. Columns: (1) Object name. (2) K′-band (2.1 μm) flux ratio between two galaxy nuclei, measured with central 4 kpc diameter aperture photometry by Kim et al. (2002). The 4 kpc diameter aperture K′-band magnitudes of primary and secondary galaxy nuclei are shown in that order in parentheses. (3) Nuclear L′-band (3.8 μm) luminosity ratio based on our 05 radius aperture photometry (Table 3, column 3). (4) Nuclear AGN-origin L′-band (3.8 μm) luminosity ratio after the subtraction of a possible stellar emission component (Table 3, column 8), based on our 0
5 radius aperture photometry. See Section 5.1. In columns (2)–(4), the luminosity at the primary galaxy nucleus, listed first in column 1, is divided by that at the secondary, listed second. (5) Apparent nuclear separation (in arcsec) calculated from our Subaru AO K′-band images. (6) Apparent nuclear physical separation (in kiloparsecs) calculated with our cosmological parameters adopted in Section 1.
Download table as: ASCIITypeset image
The K′-band luminosity ratio is taken as the K′-band stellar emission luminosity ratio, which can be converted into the central SMBH mass ratio between the primary and secondary galaxy nuclei given the correlation between K′-band stellar emission luminosity and the central SMBH mass in galaxies (Marconi & Hunt 2003; Vika et al. 2012). Nearby ULIRGs usually consist of (1) energetically dominant, compact (<500 pc), highly obscured nuclear regions and (2) energetically insignificant spatially extended stellar emission in the host galaxies (Soifer et al. 2000; Diaz-Santos et al. 2010; Imanishi et al. 2011). While the compact nuclei of nearby ULIRGs can be extreme, the properties of the spatially extended stellar emission in the host galaxies are not so different from those of normal galaxies. Additionally, excluding two unobscured luminous AGNs—IRAS 21219−1757 in our new sample and Mrk 231 in Imanishi & Saito (2014)—the central 4 kpc diameter K′-band luminosity is expected to largely come from the stellar emission of the host galaxy, because AGN-origin K′-band emission from the highly obscured compact nuclei is flux-attenuated. In fact, the 4 kpc diameter K′-band luminosity (Kim et al. 2002) is much brighter than our nuclear 05 radius aperture K′-band luminosity in a large fraction of observed ULIRG nuclei (Table 3 and Imanishi & Saito 2014). We thus use the 4 kpc diameter K′-band luminosity to roughly estimate SMBH masses at ULIRG nuclei, because this is currently the only practical way to do so in a large number of sources. If AGN-origin K′-band emission were important for the 4 kpc diameter K′-band luminosity, particularly in ULIRG nuclei with luminous AGNs (= active massive SMBHs), SMBH masses would be overestimated and AGN luminosity normalized by SMBH masses would be underestimated in such nuclei. This will not alter our main discussion in the subsequent paragraphs of this subsection.
The nuclear L′-band luminosity ratio traces the AGN luminosity ratio between the primary and secondary galaxy nuclei, particularly for active SMBHs because their L′-band fluxes predominantly come from AGN-heated hot dust emission (Section 1). In both the K′- and L′-band luminosity ratios, luminosity at the primary galaxy nucleus is divided by that at the secondary. If SMBHs in multiple galaxy nuclei are simultaneously activated with comparable SMBH-mass-normalized AGN luminosity, such ULIRGs are expected to be located around the solid straight line in Figure 3(a). If an SMBH at the primary nucleus of a merging ULIRG is more active with higher SMBH-mass-normalized AGN luminosity than that at the secondary nucleus, such a ULIRG should show a larger L′-band luminosity ratio than the K′-band luminosity ratio between two galaxy nuclei and so should be plotted above the solid line. In Figure 3(a), although the L′-band luminosity ratios are only lower limits in some ULIRGs with multiple nuclei below the solid line, the overall trend is consistent with the scenario whereby more massive SMBHs at the primary nuclei are generally more active with higher SMBH-mass-normalized AGN luminosity than less massive SMBHs at the secondary nuclei in nearby merging ULIRGs. Namely, SMBH activation in nearby merging ULIRGs is asynchronous, as suggested from previous infrared observations by Imanishi & Saito (2014).
In Figure 3(b), we use the AGN-origin nuclear L′-band luminosity ratio, after excluding possible stellar contribution to the observed nuclear L′-band emission, in the ordinate. This correction can have significant effects, compared to the distribution in Figure 3(a), particularly for less active SMBHs, because their L′-band emission can be significantly contaminated by non-AGN components. The overall trend of higher activity for more massive SMBHs in the primary galaxy nuclei is still evident in a similar way as in Figure 3(a).
In Figure 4, we investigate the ratio of SMBH activation between the primary and secondary galaxy nuclei as a function of projected nuclear separation in kiloparsecs (Table 5), because numerical simulations (Hopkins et al. 2006; van Wassenhove et al. 2012; Capelo et al. 2017; Blecha et al. 2018) and observations (Koss et al. 2012, 2018) suggest that AGN activity can be particularly strong in late-stage, gas-rich galaxy mergers. As the ordinate is only the lower limit for a large fraction of the observed sources, it is not easy to assign a strong constraint. However, in merging ULIRGs with small projected nuclear separation (<14 kpc) (possibly biased to a late merging stage), our results are consistent with the scenario whereby SMBHs in primary galaxy nuclei tend to be more active with higher SMBH-mass-normalized AGN luminosity than SMBHs in secondary galaxy nuclei. It is not clear from our data whether this trend is true even for ULIRGs with large projected nuclear separation (>14 kpc), because all such sources show only lower limits in the ordinate.
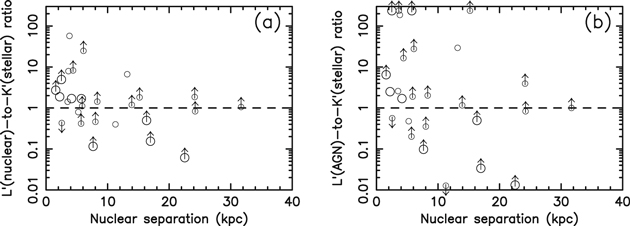
Figure 4. (a) Ratio of SMBH-mass-normalized AGN luminosity between primary and secondary galaxy nuclei (see Figure 3) as a function of nuclear separation. The abscissa is projected nuclear separation in kiloparsecs. The ordinate is the ratio of “the primary to secondary nuclear L′-band luminosity ratio” to “the primary to secondary nuclear 4 kpc diameter K′-band luminosity ratio.” The horizontal dashed line indicates the ratio of unity. Sources to the upper left (lower right) of the solid straight line in Figure 3(a) are now located at the upper (lower) side of the horizontal dashed straight line and indicate that the primary galaxy nucleus has a more active (less active) SMBH with higher (lower) SMBH-mass-normalized AGN luminosity than the secondary. (b) Same as (a), but AGN-origin nuclear L′-band luminosity, after removing possible stellar contributions to the nuclear L′-band emission (Table 3, column 8), is used in the ordinate. In both (a) and (b), larger and smaller circles indicate ULIRGs observed in this study and in Imanishi & Saito (2014), respectively.
Download figure:
Standard image High-resolution imageIn summary, our infrared K′- and L′-band high-spatial-resolution (<03) imaging observations suggest that activation of multiple SMBHs in merging ULIRGs is not synchronous, which supports the main features of numerical simulations of gas-rich major galaxy mergers (van Wassenhove et al. 2012; Capelo et al. 2017). We also find that SMBH activation (SMBH-mass-normalized AGN luminosity) is generally higher in primary galaxy nuclei (hosting more massive SMBHs) than in secondary ones (hosting less massive SMBHs). This trend will even be strengthened if possible overestimations of SMBH masses in the primary nuclei hosting active massive SMBHs (paragraph 2 of this subsection) are corrected. The low activation of a less massive SMBH makes L′-band detection of AGN emission in the secondary galaxy nuclei difficult and lowers the detection rate of dual AGNs. Numerical simulations of major galaxy mergers also predict that a sufficient amount of gas can be fed, by removal of angular momentum, toward more massive SMBHs of primary galaxy nuclei, which can preferentially trigger luminous AGN (and possibly starburst) activity there compared to less massive SMBHs of secondary galaxy nuclei (Capelo et al. 2015, 2017). Our observational results of SMBH activation in nearby merging ULIRGs are reproduced by these numerical simulations. We note that higher SMBH activation for less massive SMBHs was argued for optically selected dual AGNs, many of which are minor galaxy mergers (Comerford et al. 2015). This trend is different from ours for ULIRGs (i.e., gas-rich major galaxy mergers including many optically elusive, buried AGNs). Capelo et al. (2015) predicts that less massive SMBHs can be more active in minor galaxy mergers, because a companion galaxy is not massive enough to significantly affect the gas dynamics around a primary SMBH. These various observational trends of SMBH activation for dual AGNs can be explained using different properties of a galaxy merger.
5.3. Infrared-elusive Dual AGNs?
For IRAS 12112+0305, which is classified optically as a non-AGN (LINER) (Table 1), our infrared K′- and L′-band imaging observations detect double nuclear emission, with the SW nucleus being brighter than the NE nucleus in both infrared bands (Figure 2 and Table 3). Both the infrared brighter SW and fainter NE nuclei have K′ − L′ colors of ∼1.1 mag, which tentatively indicates the possible presence of a luminous buried AGN in both galaxy nuclei (see Section 5.1). The infrared estimated AGN luminosity is higher in the SW nucleus than in the NE nucleus (Table 3, column 9). However, ALMA (sub)millimeter observations reveal that the NE nucleus of IRAS 12112+0305 is brighter than the SW nucleus in the ∼0.9 mm and ∼1.2 mm continuum as well as dense molecular rotational J-transition lines (i.e., HCN and HCO+) (Imanishi et al. 2016b, 2018, 2019). The infrared fainter, but (sub)millimeter brighter, NE nucleus shows (1) (sub)millimeter dense molecular rotational J-transition line flux ratios (i.e., HCN and HCO+) often seen in luminous AGNs and (2) signatures of fairly strong vibrationally excited HCN J = 3–2 and J = 4–3 emission lines (HCN-VIB) at ∼1.2 mm and ∼0.9 mm, respectively (Imanishi et al. 2016b, 2018, 2019), which are naturally explained by mid-infrared (∼14 μm) radiative pumping by AGN-heated hot dust emission (Sakamoto et al. 2010; Aalto et al. 2015; Imanishi et al. 2016a, 2017). The stronger (sub)millimeter continuum and brighter molecular emission lines of plausible AGN origin suggest that a (sub)millimeter-detectable buried AGN with higher intrinsic luminosity may be present in the infrared fainter NE nucleus of IRAS 12112+0305.
Our infrared K′-band imaging observations of IRAS 22491−1808 (optical non-AGN; Table 1) reveal double nuclear emission along the east–west direction with the western (W) nucleus brighter than the eastern (E) one (Figure 2 and Table 3). As no significant L′-band emission is detected in either galaxy nucleus, we cannot meaningfully constrain the presence of a luminous AGN from a red K′ − L′ color. However, ALMA (sub)millimeter observations in the continuum and dense molecular rotational J-transition lines at ∼0.9 and ∼1.2 mm show that the E nucleus is brighter than the W nucleus (Imanishi et al. 2016b, 2018, 2019). This E nucleus of IRAS 22491−1808 displays similar dense molecular rotational J-transition and HCN-VIB line properties to IRAS 12112+0305 NE, which indicates that a (sub)millimeter-detectable, intrinsically luminous buried AGN may be present in IRAS 22491−1808 E (Imanishi et al. 2016b, 2018, 2019).
These two examples suggest that some fraction of dual AGNs could be missed or their intrinsic luminosities are underestimated, even in infrared K′- and L′-band observations, possibly because of extremely high dust obscuration of the very compact nuclei of nearby merging ULIRGs (Soifer et al. 2000; Diaz-Santos et al. 2010; Imanishi et al. 2011). No strong signatures of luminous buried AGNs have been detected in 2–10 keV hard X-ray observations of these two ULIRGs (Franceschini et al. 2003; Teng et al. 2005; Iwasawa et al. 2011). Such extremely deeply buried AGNs may be detectable only in the (sub)millimeter wavelength range because of even smaller dust extinction effects than in the infrared and X-ray regimes (Hildebrand 1983). In fact, numerical simulations by Roebuck et al. (2016) and Blecha et al. (2018) suggest that luminous buried AGNs are likely missed in some fraction of merging ULIRGs, if not the dominant fraction, through infrared-based AGN searches. The possible presence of such infrared-elusive extremely deeply buried AGNs may be an additional factor that lowers the detection rate of infrared-identified dual AGNs in the nearby merging ULIRG population.
6. Summary
We conducted infrared K′-band (2.1 μm) and L′-band (3.8 μm), AO-assisted, high-spatial-resolution (<03) imaging observations of 17 nearby merging ULIRGs at z < 0.17. We searched for compact nuclear red K′ − L′ emission as the signature of luminous AGNs by distinguishing from starbursts, because such emission is naturally explained by hot dust radiation heated by a luminous AGN. Given the small dust extinction effects at these infrared wavelengths, our method should be sensitive to buried AGNs without well-developed classic NLRs photoionized by AGN radiation. We found the following main results.
- 1.We detected K′-band emission in all observed nearby ULIRGs. Multiple K′-band emission was clearly identified in a large fraction (∼71% = 12/17) of sources, including those that had been classified as single-nucleus sources in previously obtained seeing-limited (≳1
0) K′-band images. It was confirmed that multiple merging nuclei are common in nearby ULIRGs.
- 2.L′-band emission was also detected in the bulk (∼88% = 15/17) of observed ULIRGs at the K′-band brightest primary nuclei. L′-band emission was clearly detected from K′-band fainter secondary nuclei in IRAS 10190+1322, IRAS 12072−0444, and IRAS 12112+0305, totaling three sources with detected multiple emission components in both the K′ and L′ bands.
- 3.Of the above-mentioned three ULIRGs, IRAS 12072−0444 showed two emission components whose K′ − L′ colors were significantly redder than those naturally explained by star formation processes, which makes this ULIRG a strong dual AGN candidate. Another ULIRG, IRAS 12112+0305, also showed two emission components, both of which had red K′ − L′ colors, possibly indicative of luminous AGNs.
- 4.When we combined our new results with those from a previous study using the same method (Imanishi & Saito 2014) (totaling 40 sources), we found that the fraction of infrared-detected dual AGNs in nearby merging ULIRGs is much less than unity (<20%).
- 5.For ULIRGs with clearly resolved multiple nuclei, we estimated the activation of SMBHs at individual galaxy nuclei using the SMBH-mass-normalized AGN luminosity. Our results showed that activation of multiple SMBHs in nearby merging ULIRGs is not synchronous, in that more massive SMBHs at primary galaxy nuclei are generally more active with higher SMBH-mass-normalized AGN luminosity than less massive SMBHs at secondary galaxy nuclei. This is predicted by numerical simulations of gas-rich major galaxy mergers in which more efficient gas fueling can happen toward the central SMBHs of the primary galaxy nuclei. The low activation of less massive SMBHs in secondary galaxy nuclei makes the intrinsic AGN-origin L′-band emission weak and makes its detection difficult, which may be partly responsible for the low detected dual AGN fraction in nearby merging ULIRGs in our ground-based infrared observations.
- 6.Two ULIRGs, IRAS 12112+0305 and IRAS 22491−1808, displayed multiple K′-band emission; however, the longer (sub)millimeter wavelength continuum and dense molecular line emission detected with ALMA were brighter in the infrared K′-band fainter galaxy nuclei in both sources. Dense molecular line observations using ALMA had suggested that the K′-band fainter nuclei of both ULIRGs may contain infrared-elusive, but (sub)millimeter-detectable, extremely deeply buried luminous AGNs, given even smaller dust extinction effects in the (sub)millimeter regime. The presence of infrared-elusive extremely deeply buried luminous AGNs in the very dusty nuclei of some nearby ULIRGs may also lower the dual AGN detection rate in the infrared.
Measuring the masses of SMBHs in the extremely highly obscured ULIRG nuclei is very difficult. We used the K′-band host galaxy stellar emission luminosity and the well-established relation between the luminosity and the central SMBH mass in normal galaxies. Although this is applicable to many nearby ULIRG nuclei, some ambiguities admittedly remain. Recently, ALMA very-high-spatial-resolution molecular line observations at the millimeter wavelength that is almost free from dust extinction have been applied to measure the SMBH mass in the very nearby infrared-luminous merging galaxy NGC 6240 (z = 0.024) through gas dynamics (Medling et al. 2019). Our discussion could be verified or improved if such more direct SMBH mass estimates are available in a large number of ULIRG nuclei in the near future.
We thank Drs. Ji Hoon Kim, Yuhei Takagi, and Etsuko Mieda for their observing support at the Subaru Telescope, and the referee, Dr. Emanuele Nardini, for his valuable comments, which helped improve the clarity of this manuscript. M.I. is supported by the Japan Society for the Promotion of Science (JSPS) KAKENHI grant No. 15K05030. T.K. and S.K. acknowledge support from JSPS KAKENHI grant No. 17J09016 and 18J11477, respectively. This publication makes use of data products from the Wide-field Infrared Survey Explorer, which is a joint project of the University of California, Los Angeles, and the Jet Propulsion Laboratory/California Institute of Technology, funded by the National Aeronautics and Space Administration, and NASA’s Astrophysics Data System and the NASA/IPAC Extragalactic Database (NED), which is operated by the Jet Propulsion Laboratory, California Institute of Technology, under contract with the National Aeronautics and Space Administration.
Facility: Subaru. -
Appendix A: Signal Growth Curve of Compact Objects within the Field of View of ULIRG Data
We investigated the signal growth curve of modestly bright compact objects (stars, possibly very compact galaxies, and point-source-like very compact ULIRGs), whenever available, inside the field of view of the data for several ULIRGs. This can be used to estimate what fraction of the point source signal is recovered with the 05 and 0
75 radius apertures under the AO correction at the time of ULIRG observations. This fraction can be applied to the compact nuclear emission components of ULIRGs. In practice, this estimate is possible only for selected ULIRGs that have appropriate compact objects inside the field of view, not for all ULIRGs. Also, the fraction can vary among ULIRGs depending on AO correction. However, we can roughly estimate what fraction of compact nuclear emission components of ULIRGs are recovered consistently with 0
5 and 0
75 radius aperture photometry in our data. Figures 5(a)–(c) display the signal growth curve for LGS-AO data in the K′ band, NGS-AO data in the K′ band, and NGS-AO data in the L′ band, respectively. We can confirm that ≳75% and ≳85% of compact emission is usually recovered with the 0
5 and 0
75 radius aperture photometry, respectively, for our AO data of the observed ULIRGs.
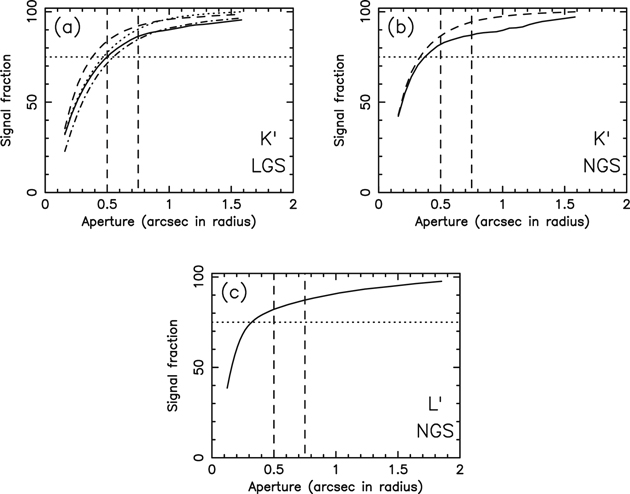
Figure 5. Signal growth curve of compact objects (whenever available) within the field of view of ULIRG images. (a) K′-band data observed with LGS-AO for four compact objects: one at ∼11″ north and ∼21″ west of IRAS 09039+0503 (2019 April) (solid line), one at ∼18″ south and ∼5″ west of IRAS 14394+5332 (2019 April) (dashed line), one at ∼11″ north and ∼2″ east of IRAS 15206+3342 (2016 April) (dashed–dotted line), and one at ∼19″ south and ∼04 west of IRAS 10190+0334 (2015 February) (dotted line). (b) K′-band data observed with NGS-AO for two compact objects: one at ∼14″ south and ∼11″ east of IRAS 20414−1651 (2015 September) (solid line) and one at ∼23″ north and ∼20″ west of IRAS 21219−1757 (2015 September) (dashed line). (c) L′-band data observed with NGS-AO for IRAS 21219−1757 itself (compact ULIRG) (2015 September). The vertical dashed lines indicate 0
5 and 0
75 radius apertures. The horizontal dotted line indicates 75% signal fraction relative to a 2
5 radius aperture measurement.
Download figure:
Standard image High-resolution imageAppendix B: Remaining Possible Photometric Uncertainty of K′ − L′ Color in Our AO Data Measurements of Compact Emission at ULIRG Nuclei
We have a few caveats about the derived K′ − L′ colors of the compact nuclear emission components of ULIRGs. First, as mentioned in Section 3, small aperture photometry can better probe the K′ − L′ color of compact nuclear emission affected by luminous AGNs, with reduced contamination from spatially extended star formation emission, but may lose a larger fraction of signals in the AO halo component of compact emission. When we increase the aperture size, the possible flux loss of the AO halo component will be smaller. However, the contamination from star formation will increase, in particular in the K′ band, which makes the observed K′ − L′ color bluer. Thus, the signature of a luminous AGN could be diluted. The probed physical scale and thereby possible contaminations from spatially extended star formation emission can be larger for more distant sources. We do not see a trend of systematically bluer observed K′ − L′ colors with increasing luminosity distance (Figure 6(a)), suggesting that luminous buried AGNs are properly detected in our method. At higher redshift, the fraction of ULIRGs with higher infrared luminosities becomes higher (Figure 6(b)). This may be partly responsible for the high detection rate of red K′ − L′ sources (>1.0 mag) at large distance, because it is known that the bolometric contributions of AGNs tend to increase with increasing infrared luminosity for nearby ULIRGs (Nardini et al. 2010).
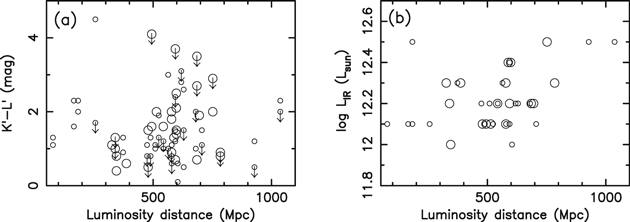
Figure 6. (a) Observed K′ − L′ color in mag of compact emission at ULIRG nuclei, measured with a 05 radius aperture (ordinate), as a function of luminosity distance in Mpc (abscissa). (b) Decimal logarithm of infrared luminosity in L⊙ (ordinate) as a function of luminosity distance in Mpc (abscissa). In both (a) and (b), larger and smaller open circles indicate ULIRGs observed in this study and in Imanishi & Saito (2014), respectively.
Download figure:
Standard image High-resolution imageSecond, although the same AO guide star was used for the K′- and L′-band observations of each ULIRG (Table 2), AO correction is likely to be better in the L′ band, because of the longer wavelength, than the K′ band. A larger fraction of compact emission should reside in the AO core component in the L′ band; thus, the possible flux loss of compact emission measured with employed apertures should be smaller in the L′ band. This could slightly redden the K′ − L′ color to a larger value; thus, the possible AGN contribution to the compact nuclear emission could be overestimated.
Finally, for ULIRGs with faint L′-band emission, we need to take into account additional possible uncertainty. K′-band emission of all ULIRGs and L′-band emission of some fraction of ULIRGs were clearly detected in individual frames at each dithering position, for which we could combine data after confirming the peak position of the ULIRGs’ signals. However, some fraction of ULIRGs were too faint in the L′ band to be clearly detected at individual dithering positions. For such L′-band faint ULIRGs, we blindly summed nine-point dithered images based on the input dithering amplitude and pixel scale of the IRCS instrument. When this nine-point dithering sequence was repeated multiple times, we simply summed these data in the same manner. We could barely see some signals only after these data combinations. Because the telescope pointing accuracy at each dithering position may not have been perfect, compact emission from these L′-band faint ULIRGs could have been blurred at a subarcsecond level, and the resulting final image size could have been larger than that determined by actual Earth atmospheric seeing. For bright objects, we confirmed that this blind summation worked well in one sequence (i.e., nine-point dithering), with a resulting image size comparable to that obtained with the summation after confirmation of peak position. However, for L′-band faint ULIRGs, this blind summation was applied to data of multiple sequences with longer observation durations; thus, some caution is required in that L′-band photometry with the apertures used may be fainter and K′ − L′ colors may be slightly bluer (smaller) than the actual values of compact nuclear emission. In summary, possible AGN contribution to the compact nuclear emission could be underestimated for L′-band faint ULIRGs because of this uncertainty.
Comparing the K′ − L′ colors measured with the 05 and 0
75 radius apertures (Table 3) can provide some indication that the derived K′ − L′ colors were not strongly affected by these uncertainties.
Footnotes
- 3
In this paper, we denote mergers of comparable galaxy mass (mass ratio < 4) as major galaxy mergers and mergers of very different galaxy mass (mass ratio ≳4) as minor galaxy mergers, following Capelo et al. (2015).
- 4
This excess L′-band emission should be strong not only for optically elusive luminous buried AGNs surrounded by dust with a large covering factor, but also for unobscured AGNs as long as some amount of nuclear dust is present in directions perpendicular to our line of sight.
- 5
IRAF is distributed by the National Optical Astronomy Observatories, which are operated by the Association of Universities for Research in Astronomy, Inc. (AURA), under cooperative agreement with the National Science Foundation.