Abstract
We present 50–100 pc-resolution JWST/MIRI and NIRCam measurements of mid-infrared (mid-IR) color variations in the diffuse interstellar medium (ISM) of 71 nearby star-forming galaxies from the PHANGS-JWST survey. Mid-IR emission traces the dust column density, intensity (U) and hardness of the interstellar radiation field, and the physical state (charge, size) and abundance of polycyclic aromatic hydrocarbons (PAHs). Mid-IR colors that trace PAH band ratios remain fairly constant in the diffuse ISM of star-forming disks. However, they show stark variations in extreme environments: highly star-forming central molecular zones (CMZs) and star formation deserts/quiescent bulges. In CMZs, PAH-to-continuum (3.3/21, 7.7/21, and 11.3/21 μm) and the 10/21 μm continuum colors are 0.2–0.4 dex lower than in normal disks. We attribute this to higher U based on the far-infrared dust colors and the high 21 μm/ΣMol, which we suggest to be a good tracer of U outside star-forming regions. Meanwhile, star formation deserts show low 7.7 μm PAH emission, resulting in low 7.7/21 μm and 7.7/11.3 μm, while all other mid-IR colors remain typical. This suggests the presence of more neutral PAHs in star formation deserts, where low 7.7 μm likely reflects ISM conditions similar to early-type and elliptical galaxies. All environments form part of a continuous trend in 7.7/11.3 μm versus specific star formation rate.
Original content from this work may be used under the terms of the Creative Commons Attribution 4.0 licence. Any further distribution of this work must maintain attribution to the author(s) and the title of the work, journal citation and DOI.
1. Introduction
The mid-infrared (mid-IR) captures emission from polycyclic aromatic hydrocarbons (PAHs)—small carbonaceous nanoparticles with prominent emission features across the near- and mid-IR (A. Leger & J. L. Puget 1984). PAHs are ubiquitous in the interstellar medium (ISM) of the Milky Way and nearby galaxies, and typically account for ∼10%–20% of the total IR luminosity from galaxies (J. D. T. Smith et al. 2007; A. G. G. M. Tielens 2008). PAHs play a crucial role in ISM physics, especially in regulating photoelectric heating. Low PAH abundance or the presence of highly charged PAHs results in less efficient photoelectric heating, which can impact the ISM phase structure (M. G. Wolfire et al. 1995, 2003). PAH emission encodes information on the abundance of PAHs, total dust column density, local radiation field (intensity and hardness), as well as the physical state (charge, size) of PAHs (L. J. Allamandola et al. 1989; E. Peeters et al. 2002; B. van Diedenhoven et al. 2004; A. G. G. M. Tielens 2008). PAH emission has thus also been used as a tracer of star formation (e.g., E. Peeters et al. 2004; A. G. G. M. Tielens 2005; B. Gregg et al. 2026), radiation field (E. L. O. Bakes & A. G. G. M. Tielens 1994; R. Genzel et al. 1998; D. Rigopoulou et al. 1999; D. Baron et al. 2025), and recently cold gas (A. K. Leroy et al. 2023; D. Pathak et al. 2024; R. Chown et al. 2025).
Several prominent PAH emission features are accessible to JWST, e.g., at 3.3, 6.2, 7.7, 8.6, 11.3, 12.7, and 17 μm, which trace stretching and bending modes from C − C to C − H in PAH molecules (e.g., L. J. Allamandola et al. 1999). Variations in the relative strengths of these PAH features can also reflect differences in PAH size distribution (smaller PAHs emit strongly in the shorter-wavelength features compared to larger PAHs emitting strongly at longer wavelengths), charge (e.g., 7.7 μm from ionized PAHs versus 3.3 and 11.3 μm from more neutral PAHs) and physical conditions of the ISM (e.g., radiation field intensity and hardness; E. L. O. Bakes & A. G. G. M. Tielens 1994; B. T. Draine & A. Li 2001; P. Panuzzo et al. 2011; A. Maragkoudakis et al. 2020; B. T. Draine et al. 2021; D. Baron et al. 2025; D. A. Dale et al. 2025; B. Gregg et al. 2026).
PAH emission is sensitive to changes in the interstellar radiation field (ISRF) shape and intensity, especially the availability of energetic far-ultraviolet (FUV) photons that efficiently heat PAHs. Observations show that PAH survival and properties vary in response to their environment, as evidenced by relative variations among their strong spectral features. PAH emission depends on galactic environment (J. D. T. Smith et al. 2007; S. Stierwalt et al. 2013; A. Li 2020), PAHs are destroyed in H ii regions (K. M. Sandstrom et al. 2010; J. Sutter et al. 2024; O. V. Egorov et al. 2025), and can be suppressed at lower metallicity (C. W. Engelbracht et al. 2005; B. O’Halloran et al. 2006; B. T. Draine et al. 2007; F. Galliano et al. 2008; L. K. Hunt et al. 2010; C. M. Whitcomb et al. 2024; R. Chown et al. 2025), while their formation pathway is currently being investigated (e.g., A. M. Burkhardt et al. 2021; C. Xue et al. 2025).
Mid-IR colors and PAH properties can vary on <10 pc scales in bright H ii regions and on ≲100 pc scales in galaxy centers, where U, the ISM radiation field intensity, can be orders of magnitude higher than the U ∼ 1 across most parts of galaxies (e.g., G. Helou et al. 2004; D. A. Dale et al. 2005; B. T. Draine et al. 2007; J. C. Muñoz-Mateos et al. 2009). Constraining variations in PAH properties in the diffuse ISM thus requires (1) high-resolution data that can separate diffuse emission from <10 pc-scale ionizing sources, and (2) wide-area coverage that spans a range of galactic environments. Characterizing mid-IR colors and PAH property variations in the diffuse ISM of large samples of nearby galaxies is now possible with JWST. JWST’s subarcsecond resolution allows us to separate near- and mid-IR emission from nebular regions with very high U from the surrounding diffuse medium across galaxies out to at least ∼20 Mpc (e.g., J. Chastenet et al. 2023; A. K. Leroy et al. 2023; K. M. Sandstrom et al. 2023; D. Pathak et al. 2024; J. Sutter et al. 2024; R. Chown et al. 2025; O. V. Egorov et al. 2025 studying subsets of our sample). The field of view of its MIRI and NIRCam imaging instruments allows it to cover large parts of a nearby galaxy in a single observation.
Building on previous work within the Physics at High Angular resolution in Nearby GalaxieS (PHANGS28 ) Collaboration (J. Chastenet et al. 2023; D. Baron et al. 2024, 2025; J. Sutter et al. 2024; R. Chown et al. 2025; D. A. Dale et al. 2025; O. V. Egorov et al. 2025; H. Kolziol et al. 2026,in preparation; ; see Section 4.1), we provide the first systematic JWST-MIRI measurements of diffuse ISM mid-IR colors as a function of large-scale environment (centers, bars, bulges, disks) in 71 star-forming galaxies mapped by JWST, and critically examine the role of environment in driving diffuse dust emission. We use mid-IR band ratios to investigate variations in PAH properties, abundance, and heating in the diffuse ISM. By studying a large set of galaxies, we aim to (1) measure the typical PAH-related mid-IR colors in the diffuse ISM of star-forming galaxies, (2) identify environments where the diffuse ISM deviates from these typical conditions, and (3) diagnose the drivers of these changes by comparison to other bands and properties of the local environment. Our results are representative of the diffuse ISM in “normal” star-forming galaxies that span the star-forming main sequence, where interpreting changes in mid-IR colors and PAH emission systematically takes into account the local environment.
The paper is organized as follows. In Section 2, we describe our sample, JWST and MUSE data, data processing, and environment classification. In Section 3, we present our inventory of mid-IR radial profiles and colors in normal disks and galaxy centers, including central molecular zones (CMZs) and bulges. In Section 4, we interpret the observed mid-IR color variations due to galactic environment. Finally, we summarize our key conclusions in Section 5.
2. Data and Methods
Our sample consists of 71 nearby star-forming galaxies from the PHANGS (Physics at High Angular resolution in Nearby GalaxieS) surveys (A. K. Leroy et al. 2021; J. C. Lee et al. 2023; R. Chown et al. 2025) that have high-resolution (10–50 pc-scale) multi-wavelength data. The full list of galaxies and associated measurements have been included as a machine-readable table, as described in Table 3. This includes JWST NIRCam and MIRI imaging for all 71 galaxies, and MUSE optical IFU coverage for 42 galaxies (E. Emsellem et al. 2022; O. V. Egorov et al. 2025). The 71 galaxies span the star-forming main sequence with stellar masses between 109.16 and 1011.14 M⊙ and global star formation rate (SFR) between 0.15 and 16.90 M⊙ yr−1. The sample captures a wide range of local environments representative of normal star-forming galaxies. Global properties of the full sample are summarized in A. K. Leroy et al. (2021).
2.1. PHANGS-JWST
We use near- and mid-IR images from the PHANGS-JWST Cycle 1 (GO 2107, PI: Lee; J. C. Lee et al. 2023) and Cycle 2 Treasury (GO 3707, PI: Leroy; R. Chown et al. 2025, A. Leroy et al. 2026, in preparation). We focus on the diffuse ISM using five filters: NIRCam F300M (3 μm) primarily traces starlight; MIRI F770W (7.7 μm) traces C–C stretching modes of more ionized PAHs; F1000W (10 μm) traces a combination of continuum from stochastically heated small grains, silicate absorption, and PAH emission; F1130W (11.3 μm) traces C–H out-of-plane bending modes of more neutral PAHs; and F2100W (21 μm) traces the hot dust (small grains) continuum (A. K. Leroy et al. 2023; C. M. Whitcomb et al. 2023; G. P. Donnelly et al. 2024; R. Chown et al. 2025c). In Section 4.4 we also compare to maps of 3.3 μm PAH emission captured in the F335M filter for the 19 Cycle 1 galaxies. This feature traces smaller, more neutral PAHs. H. Koziol et al. (submitted) describe the production of these F335MPAH feature maps.
The Cycle 1 PHANGS Treasury includes 19 galaxies with full coverage of all filters. We include 52 galaxies from the Cycle 2 Treasury with F300M, F770W (the shorter-wavelength PAH band), and F2100W.29 NGC 4826 (Cycle 2) has additional F1000W and F1130W coverage from GO 3177 (PI Sun), which brings our full sample to 20 galaxies with full MIRI coverage, and 51 galaxies without F1000W and F1130W.
The data are reduced using pjpipe (T. G. Williams et al. 2024). Modifications to pjpipe used in the latest combined Cycle 1 and 2 data are described in R. Chown et al. (2025).30 In brief, pjpipe adds modifications to the STScI JWST pipeline (H. Bushouse et al. 2025) to improve the handling of extended sources. The JWST observations are astrometrically registered against Hubble Space Telescope broadband imaging using bright point sources, which in turn have been aligned to Gaia DR3 sources.
We analyze the NIRCam and MIRI images after convolving them to a common  Gaussian PSF, which is effectively beam-matched to the MUSE data resolution. For F2100W, our longest wavelength filter, this resolution also represents a compromise between improving signal-to-noise (S/N) and decreasing angular resolution (see T. G. Williams et al. 2024; R. Chown et al. 2025 for details).
2.1.1. Background Determination
We study the systematic variations in ratios between mid-IR filter intensities in the diffuse ISM. This makes determining the background level important, but most of our JWST images include little or no empty sky. Following A. K. Leroy et al. (2023), the backgrounds at F300M and F770W are “anchored” to match wide-field mapping at similar wavelengths (NIRCam F300M to WISE1, MIRI F770W to WISE3) and then the backgrounds in JWST images at other bands are anchored to match those images. Since all MIRI filters (F1000W, F1130W, F2100W) are anchored to F770W, which sets the intercept between F770W and each MIRI filter to zero, zero-level offsets are not a concern for our measurements. The resulting MIRI backgrounds are uncertain by ±0.03–0.1 MJy sr−1 (∼0.03 MJy sr−1 in F770W, ∼0.09 MJy sr−1 in F2100W; see T. G. Williams et al. 2024). Since the NIRCam F335M maps suffer from known striping issues,31 we restrict all comparisons with F335MPAH (only in Section 4.4) to high-confidence regions where F335MPAH is greater than the stripe intensity (∼0.04 MJy sr−1; see H. Koziol et al. submitted).
2.1.2. Starlight Subtraction
The MIRI filters usually contain some stellar continuum emission in addition to PAH and/or small dust continuum emission (see, e.g., G. Helou et al. 2004; D. A. Dale et al. 2009; C. M. Whitcomb et al. 2023; J. Sutter et al. 2024). We estimate and remove contamination from the stellar continuum for each MIRI filter using the NIRCam F300M emission as a template for the stellar emission. We use the prescription from J. Sutter et al. (2024) for F300M to scale and subtract stellar emission from F770W. For the longer-wavelength MIRI filters, we follow J. Sutter et al. (2024) and use spectral energy distribution models produced by the Code for Investigating Galaxy Emission (CIGALE; M. Boquien et al. 2019) to determine the factor to scale F300M to predict starlight emission in the filter. The formulae that we use are
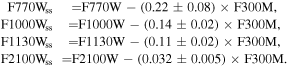
We use the intensity in each filter in MJy sr−1, the “ss” subscript indicates the starlight-subtracted intensity. We include the ±1σ uncertainty in starlight subtraction from the standard deviation from the CIGALE models computed over a variety of plausible CIGALE models (see J. Sutter et al. 2024) in each MIRI filter. Starlight subtraction makes the largest difference in regions with low MIRI intensities and high F300M, such as near-IR bright bulges and star formation deserts (see Section 2.3). Our sample includes 13 galaxies with such old stellar bulges and bars with very high surface densities of old stellar populations. In these regions, we find that stellar continuum accounts for ≲30% of the flux in F770W and as much as ∼5% of the flux in F2100W. In such regions, the starlight subtraction can represent the dominant source of uncertainty.
2.1.3. Estimating 

With starlight-subtracted mid-IR maps, we measure the mid-IR color of F770Wss to F2100Wss across the full sample. F770Wss/F2100Wss is often employed to trace the PAH fraction in normal star-forming galaxies (e.g., J. Sutter et al. 2024; O. V. Egorov et al. 2025), following similar use of the 8/24 μm ratio with Spitzer (e.g., C. W. Engelbracht et al. 2005; F. Galliano et al. 2018; A. Li 2020). We estimate the mid-IR PAH-to-continuum emission ratio  using the empirical calibration32
from J. Sutter et al. (2024) as
using the empirical calibration32
from J. Sutter et al. (2024) as

Note that while J. Sutter et al. (2024) and O. V. Egorov et al. (2025) did not subtract starlight from F2100W, we use F2100Wss in  . As noted above, this results in a discernible ≲5% effect only in extremely near-IR bright old bulges and star formation deserts.
Note that while we remove the stellar continuum, we do not subtract dust continuum emission from PAH-dominated filters F770Wss and F1130Wss since adjacent mid-IR filters are not available to reliably estimate the dust continuum in PAH filters. In previous work, the hot dust continuum is estimated to be ∼5× lower than the 7.7 μm PAH feature contribution to F770Wss (C. M. Whitcomb et al. 2023; D. Baron et al. 2024). Hence, we calculate other band ratios including F770Wss/F1130Wss (tracing PAH charge) without dust continuum subtraction. For consistency, we also compare our results to dust models in which we include the continuum emission. Future work will present improved dust continuum constraints for MIRI filters for PHANGS galaxies (L. Hands et al. 2026, in preparation).
In Figure 1, we show the diversity in resulting maps of F300M, F770Wss, F2100Wss, and  for a few representative galaxies. All intensity maps share the same colorbar, and similarly all
  panels share the same colorbar for visual comparison between filters and across galaxies.
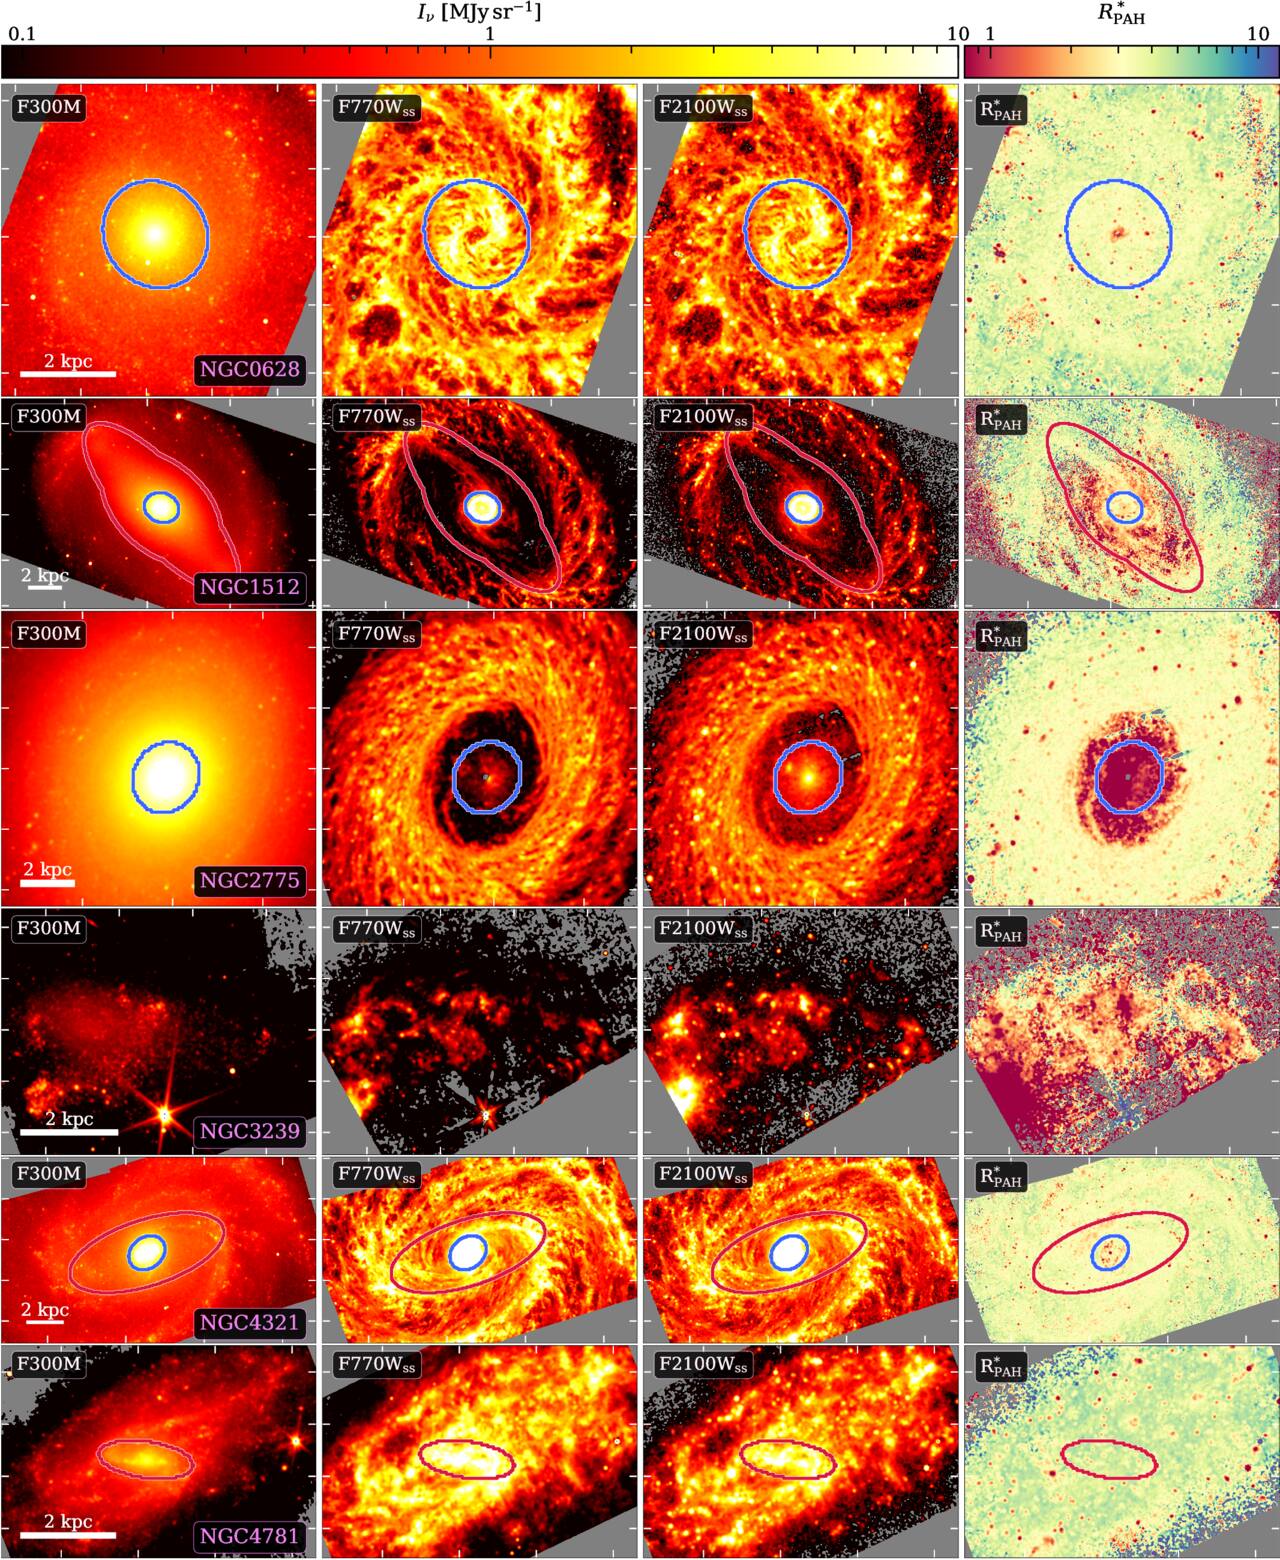
Figure 1. Zoom-ins showing a few example galaxies from our sample in F300M, F770Wss, F2100Wss, and  , with M. Querejeta et al. (2021) morphological environment masks for centers (blue) and bars (red) overlaid for reference.
Download figure:
Standard image High-resolution image2.2. PHANGS-MUSE and Archival MUSE Data
Previous works have found mid-IR colors to vary with radiation field intensity and hardness (e.g., J. Sutter et al. 2024; D. Baron et al. 2025; O. V. Egorov et al. 2025). We use maps of SFR and specific star formation rate (sSFR≡SFR/M*) as tracers of these factors. SFR and sSFR reflect the presence and relative abundance of young massive stars, which produce the majority of FUV photons in most star-forming galaxies and so drive changes in radiation field intensity and spectrum. We measure the sSFR using optical integral field unit (IFU) spectroscopy from the Multi Unit Spectroscopic Explorer (MUSE) on the Very Large Telescope (VLT) available for 42/71 of our galaxies. This includes the 19 Cycle 1 galaxies with MUSE data from the PHANGS-MUSE Large Program (1100.B-0651, PI: Schinnerer; E. Emsellem et al. 2022). The PHANGS-MUSE data coverage for the 19 galaxies extends out to ∼2 × Reff or twice the effective radii, which is generally larger than the PHANGS-JWST footprint. MUSE data on an additional 23 galaxies are available from a combination of several small programs and archival data at ESO (see Table 1 in O. V. Egorov et al. 2025, for details of specific archival observations). This constitutes the “MUSE Extended” sample, and brings our total sample with existing MUSE data up to 42. Within the MUSE Extended sample, roughly half of the galaxies have coverage comparable to PHANGS-MUSE (full optical disk), while coverage for the other half is restricted to single central pointings (usually ∼1Reff).
We use the “convolved and optimized” (copt) resolution MUSE data, which achieve a uniform Gaussian point-spread function (PSF) for each galaxy (as in E. Emsellem et al. 2022). The angular resolution of the MUSE cube varies by galaxy and is  for our sample. We treat these data as effectively beam-matched to the
  JWST working resolution, since we only use them for SFR and sSFR measurements across azimuthal bins or morphological environments, i.e., regions much larger than a resolution element.
As in E. Emsellem et al. (2022), both the PHANGS-MUSE and MUSE Extended sample are reduced using the PHANGS-MUSE pipeline pymusepipe33 to produce data cubes, and the PHANGS data analysis pipeline DAP34 to produce maps of SFR and stellar mass (see E. Emsellem et al. 2022, for details). DAP uses the MUSE Balmer decrement extinction-corrected Hα maps to trace the star formation surface density, ΣSFR (E. Emsellem et al. 2022; F. Belfiore et al. 2023a), and models the stellar continuum (e.g., I. Pessa et al. 2022, 2023) to trace the stellar mass surface density, Σ*, which are reliable on ≳80 pc scales, and certainly on environment-integrated scales, but can break down on smaller scales in ≲50 pc-scale H ii regions or high-attenuation centers (E. Emsellem et al. 2022). The ratio of the two is sSFR = ΣSFR/Σ*. When measuring sSFR in large regions, we sum total SFR and stellar mass in the region before dividing.
For the 32 galaxies in our sample without MUSE coverage, we use F2100W and F2100W/F300M as proxies for ΣSFR and sSFR. We expect this approach to be less accurate than the MUSE products, but it has the advantage of being available for all targets. We discuss this more in Section 2.4.
2.3. Environmental Classification
We measure the variation in mid-IR colors as a function of morphological environment. We use the M. Querejeta et al. (2021) environmental masks that define galaxy centers, bars, and disk regions based on Spitzer IRAC near-IR imaging (see also H. Salo et al. 2015). Within each environment (center/bar/disk), we calculate the integrated ΣSFR and sSFR as described above. Based on this, we identify four different types of environments35 :
- 1.Old stellar population-dominated star formation deserts or bulges. Galaxy centers or bar environments (inter-bar regions) with low sSFR (, or sSFR ≲ 7 × 10⁻¹² yr−1), hereby referred to as “bulges.”
- 2.Young star-forming centers. Galaxy centers and CMZs36 with high ΣSFR (median F2100W intensity>10 MJy sr−1, or ΣSFR ≳ 0.03 M⊙ yr−1 kpc−2).
- 3.Normal centers. Galaxy centers with ΣSFR and sSFR typical of the rest of the galaxy.
- 4.Disks. All environments not classified as a galaxy center or “bulge,” with ΣSFR and sSFR typical of the rest of the galaxy. This includes, e.g., weak bars, spiral arms, and inter-arm regions.

While we use the M. Querejeta et al. (2021) morphological masks to distinguish between galaxy centers, bulges, and disks as our fiducial environment selection, we note three special cases. In NGC 4826, our MIRI and NIRCam observations cover the central ≈2ℓ*, where ℓ* is the exponential scale length of the stellar disk (H. Salo et al. 2015; A. K. Leroy et al. 2021).37 NGC 4826 is close to an early-type galaxy (ETG; SAab Hubble type), where the inner ℓ* is star-forming with high gas column density within an early-type disk galaxy where a “recent” merger likely caused the counter-rotating H I disk dominated by older stellar populations at Rgal ≳ ℓ*. Hence, in NGC 4826, in addition to the M. Querejeta et al. (2021) environment masks, we classify the outer >ℓ* of the galaxy as a star formation desert. Finally, NGC 3368 and NGC 3344 were not included in M. Querejeta et al. (2021). Lacking environment masks, we visually classify the central ℓ* as the “galaxy center” (ℓ* measurement from A. K. Leroy et al. 2021), and r > ℓ* as the “disk” environment for each galaxy.
2.4. Using JWST Filters as ΣSFR and sSFR Indicators
For the 32 galaxies without MUSE coverage, we use the median F2100W intensity in each environment as a ΣSFR indicator. We also use the ratio of median F2100W-to-median F300M as a proxy for sSFR. MIRI F2100W is analogous to widely used IR SFR tracers including WISE4 and Spitzer MIPS 24 μm (e.g., R. C. Kennicutt & N. J. Evans 2012; T. H. Jarrett et al. 2013; A. K. Leroy et al. 2019) and has been explored as an SFR tracer using JWST including by F. Belfiore et al. (2023b); D. Calzetti et al. (2025). NIRCam F300M is analogous to the commonly used M* tracers WISE1 or IRAC1 (e.g., S. E. Meidt et al. 2014; M. Querejeta et al. 2015; A. K. Leroy et al. 2019) or the widely used K band (e.g., T. H. Jarrett et al. 2003; M. F. Skrutskie et al. 2006).
In Figure 2, we show how F2100W and F2100W/F300M correlate strongly with ΣSFR and sSFR for the 42 galaxies with MUSE coverage. The plot indicates strong correlations of ΣSFR with F2100W (Spearman rank correlation coefficient ρ = 0.89) and sSFR with F2100W/F300M (ρ = 0.82) for the 42 galaxies with MUSE and JWST measurements, with < 0.5 dex scatter.38 This supports our use of these IR intensities and colors as proxies for star formation activity where MUSE data are not available.
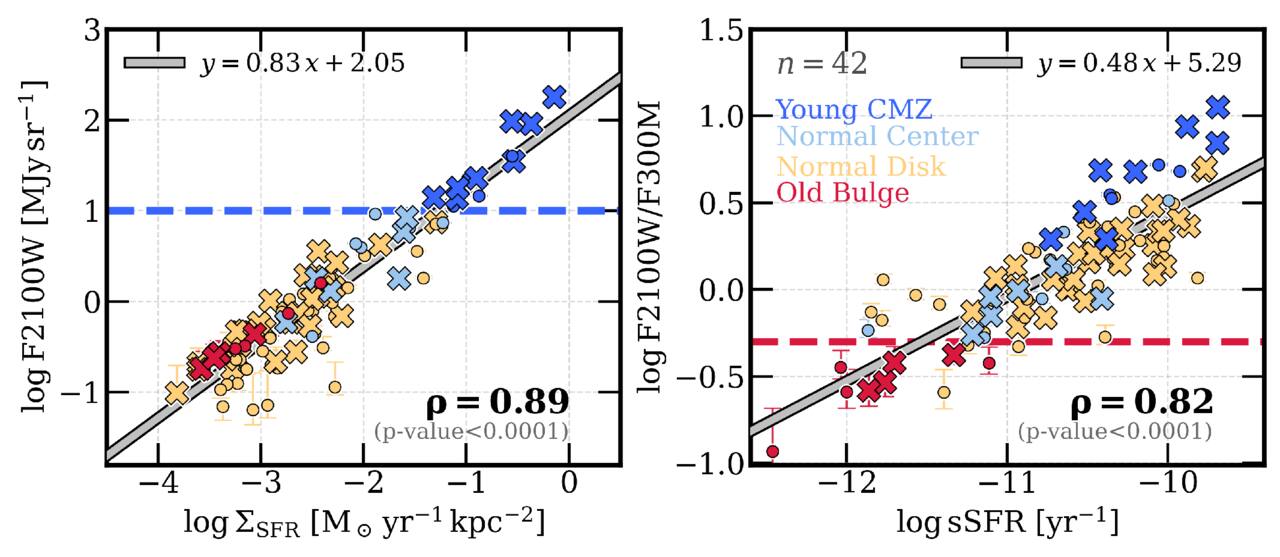
Figure 2. Correlating environment-integrated median ΣSFR (M⊙ yr−1 kpc−1; left panel) and sSFR (yr−1; right panel) measurements from MUSE with JWST F2100W intensities and F2100W/F300M, respectively, for the 42 galaxies with joint MUSE and JWST coverage. Environments (Section 2.3) are indicated with colors—old bulges (red), young star-forming centers (blue), normal centers (light blue), and normal disks (light yellow) for targets with full MIRI filter coverage (20/71; X’s) and partial filter coverage (51/71; circles). We include  fits to all environments (light gray); the corresponding correlation coefficient ρ and p-value; and the threshold in F2100W (left) and F2100W/F300M (right) used to classify young centers (dark blue) and old bulges (red) as in Section 2.3 are indicated as horizontal dashed lines.
Download figure:
Standard image High-resolution imageUsing these tracers, we select young star-forming centers as galaxy center regions within the M. Querejeta et al. (2021) mask where the median F2100W intensity is >10 MJy sr−1. This translates to roughly ΣSFR > 0.03 M⊙ yr−1 kpc−2. We select old starlight-dominated bulges and star formation deserts as galaxy center and bar regions with  , which translates roughly to sSFR≲7 × 10⁻¹² yr−1. Both cuts are indicated in Figure 2 as dashed horizontal lines.
2.5. Core Measurements
2.5.1. Constructing Radial Profiles
We measure the radial variation in dust emission, mid-IR colors, and  in the diffuse ISM in each galaxy. To consistently compare galaxies of different sizes and morphologies, we construct radial profiles in azimuthal bins of width 0.1ℓ*, the exponential disk scale length. For reference, in a simple exponential disk, we expect that the effective radius relates to the scale length as Reff = 1.68ℓ*. However, the radial profiles of many of our galaxies cannot be fit by a single exponential due to the presence of CMZs or bars. We thus prefer ℓ* instead of the Reff or a half-light radius measured in the near-IR, since many of our galaxies show strong nuclear emission from active galactic nucleus (AGN) disks or nuclear stellar disks. In these cases, Reff is affected by this bright compact emission, which results in smaller Reff values, and is not a good predictor of the large-scale disk structure.
To construct radial profiles, we calculate the median intensities in each azimuthal 0.1ℓ* wide bin (Section 2.3). We use the median39 to suppress the contribution of H ii regions and properly access the diffuse ISM values. H ii regions are bright, but occupy only a small fraction of the total area in any radial bin or environment mask (see Section 2.5.3 for exceptions), and typically represent only the tail end of the distribution of pixel intensities (D. Pathak et al. 2024). We demonstrate in Figure 3 that the ratio of medians is relatively insensitive to whether nebular regions are masked. We include the radial profiles of NGC 1300 since it is particularly illustrative—NGC 1300 includes all three major environments (young center/star formation desert/disk; Section 2.3), which are also discernible from the radial profile.
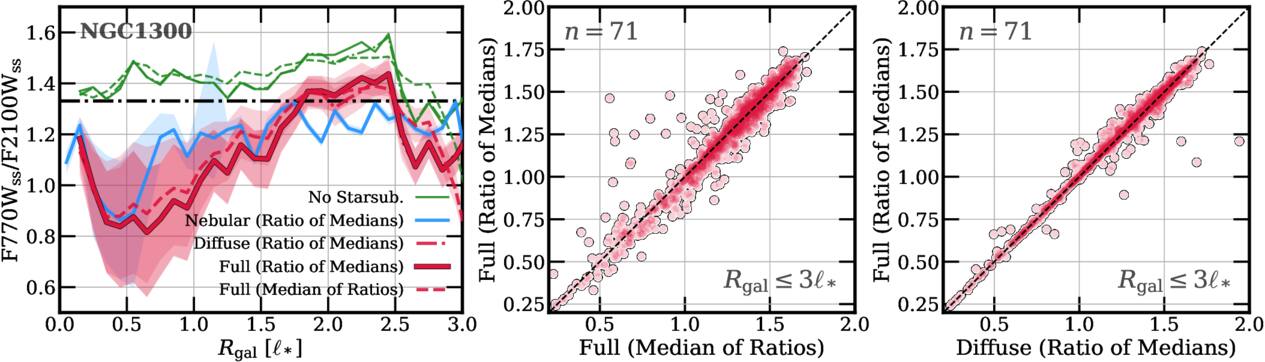
Figure 3. Left: constructing radial profiles of F770Wss/F2100Wss for NGC 1300 as an example. The solid red line shows our fiducial measurement constructed from the ratio of medians taken across the full dataset. The other lines show the impact of varying the methodology. Green shows the profile without starlight subtraction for all pixels (solid green), for only diffuse emission (dotted–dashed green; see Section 2.5.2), and constructed taking the median of pixel-wise ratios instead of the ratio of medians (dashed green). Other red lines show varying methodologies with star-subtraction applied: considering diffuse emission only (dotted–dashed red), all pixels (solid red), or the median of pixel ratios (dashed red). Blue shows the ratio of median values for only nebular regions. The black dotted–dashed line shows the typical value for the diffuse emission from J. Sutter et al. (2024). Middle: testing agreement between the ratio of medians vs. the median of ratios for all radial bins, including both diffuse and nebular pixels, across 71 galaxies with Rgal ≤ 3ℓ*. Right: testing agreement between the ratio of medians when including all pixels vs. including diffuse pixels only (masking nebular pixels before binning) for all radial bins at Rgal ≤ 3ℓ*.
Download figure:
Standard image High-resolution imageWe measure the statistical uncertainty around the median using the error extension for JWST images (T. G. Williams et al. 2024) appropriately adjusted for the number of independent  resolution elements in the bin. This statistical uncertainty is typically <5%. The backgrounds are uncertain to ∼0.03–0.09 MJy sr−1, depending on filter (see Section 2.5.4), and this uncertainty is covariant across the entire profile.
We clip the profiles where the median intensity falls below 5× the propagated 1σ error in the median in that bin, or falls to within 10% of the background intensity in a filter (e.g., where F2100W falls below 1.1 × 0.09 ≈ 0.1 MJy sr−1). This typically rejects radial bins in the outskirts where the emission is faint and the background is uncertain, such as corners of the mosaic. We also clip any bin at large Rgal that contains <50 independent  resolution elements, which again rejects corners of images where not enough azimuthal extent is covered in a bin. Finally, for galaxies with inclination >45° we do not include emission within ±30∘ of the minor axis when binning by radius, which is sufficiently conservative since the binned medians and percentiles are robust to <10% for ±10∘ variation in the azimuthal cut along the minor axis. This avoids line-of-sight confusion between the vertical and radial distributions of dust.
2.5.2. Measuring Mid-IR Colors of Diffuse Emission
Within azimuthal bins and kiloparsec-scale environments, we measure mid-IR colors. The ratio of medians is more resistant to outliers than the median of pixel-wise ratios, particularly in the faint, diffuse parts of disks. Therefore, we report all colors (intensity ratios) as

In Figure 3 (middle), we show that the radial profiles of the ratios of medians are generally in agreement with the medians of pixel-wise ratios. We confirm this holds true for most radial bins at Rgal ≤ 3ℓ*.
We also check whether our median-based ratios effectively pick out diffuse emission. Our primary concern is that our measurements might be affected by emission from small but bright H ii regions where PAHs can be destroyed. To test this, we compare radially averaged bins of environment-integrated colors with and without masking nebular regions. We use the MUSE nebular region masks where available (B. Groves et al. 2023; O. V. Egorov et al. 2025), and otherwise denote all pixels with F2100W intensities >3 MJy sr−1 as nebular, since the locations of H ii regions typically show high F2100W intensities (D. Pathak et al. 2024).
In Figure 3 (right), we show that there is indeed good consistency between mid-IR colors with or without masking nebular regions. Since the nebular regions are only available for a subset of galaxies with MUSE data, and the MUSE-identified nebular masks are often larger than the actual physical size of the nebulae and include significant diffuse emission in addition to the central ∼10 pc-scale H ii regions (see, e.g., A. T. Barnes et al. 2026), we prefer to treat the median as our fiducial measurement. This allows us to provide measurements that include all pixels in an environment while still reflecting diffuse emission in the ISM.
2.5.3. F2100W in Galaxy Centers
Young star-forming centers often host CMZs or AGN, which can saturate or contaminate the emission with strong diffraction spikes in F2100W. We visually inspect each galaxy center and remove from analysis the saturation- or diffraction artifact-dominated centers in NGC 1566, NGC 1637, NGC 3507, NGC 3627, NGC 4457, NGC 4597, NGC 4569, NGC 4941, NGC 5643, NGC 6300, and NGC 7496. We include an example of a center removed from the analysis in Figure 4.
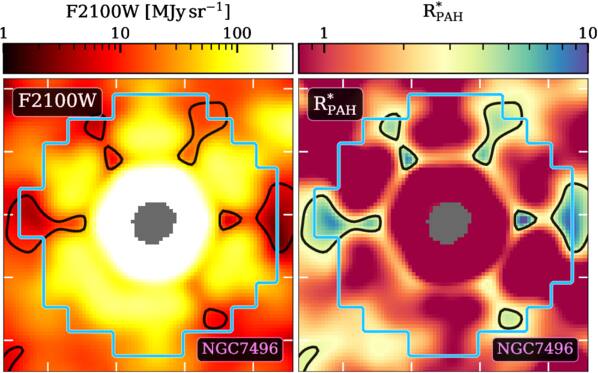
Figure 4. The center of NGC 7496, an example of galaxy centers removed from analysis due to contamination by prominent diffraction spikes in F2100W. We show maps of contaminated F2100W and resulting  , blue contours for the center mask from M. Querejeta et al. (2021), and black contours for median
  in the center.
Download figure:
Standard image High-resolution imageStar-forming centers also host CMZs and nuclear starbursts, where, due to the high spatial density of nebular regions, the median no longer reliably excludes nebular regions. Even for galaxies with MUSE nebular catalogs, the MUSE data lack the resolution to distinguish H ii regions from the surrounding medium. Instead, in the star-forming centers we separate nebular and diffuse emission using the JWST data. Correlating pixel-wise F2100Wss with F770Wss and  within each center, we fit a broken power law to binned medians (similarly to R. Chown et al. 2025). Each broken power-law fit yields xb, the value of x, which corresponds to the break in the power law. Whenever F2100Wss > xb, we consider the pixel nebular, where low F770Wss and
  reflect PAH destruction in ionized gas, and we consider all pixels <xb as diffuse. In Figure 5, we include an example galaxy center with the resulting selection for diffuse versus nebular pixels in NGC 1512.
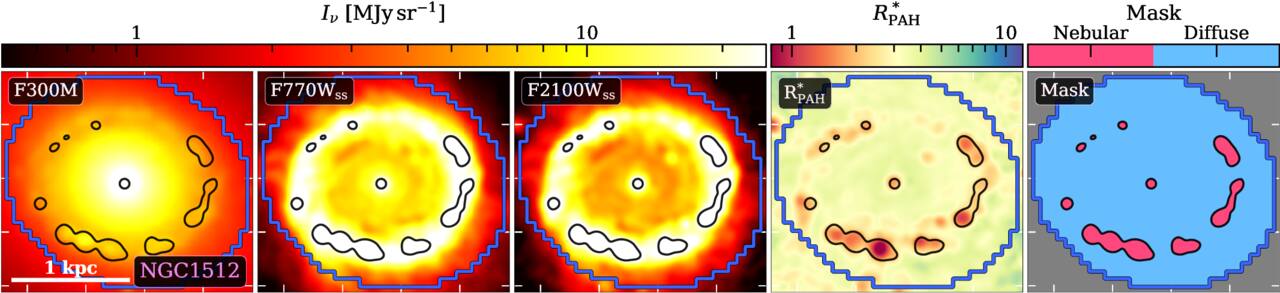
Figure 5. From left to right, F300M, F770Wss, F2100Wss,  , and resulting masks for diffuse (blue) vs. nebular emission (pink) in the center of NGC 1512, with dark blue contours for the morphological environment mask for the center of NGC 1512 from M. Querejeta et al. (2021).
Download figure:
Standard image High-resolution imageIn our analysis, we show two measurements for CMZs wherever possible—filled symbols for all pixels in centers (diffuse + nebular), and empty triangles for diffuse-only emission identified using this broken power-law approach. We take the diffuse measurement as our fiducial value for comparisons with other environments.
2.5.4. Uncertainties
Most emission in the inner parts of galaxies is detected at high S/N (>5σ), and each azimuthal ring or kiloparsec-scale environment contains a large number (≫50) of  independent resolution elements, which means the statistical error on the median is small (≲1%). The innermost annuli, where the number of resolution elements is smaller, tend to be the brightest regions and the emission here is also detected at the highest S/N (typically ≫10σ).
In this case, where statistical errors are insignificant, the uncertainty in our measurements is driven by systematics. Calibration uncertainties for JWST photometry are ∼5% (J. Rigby et al. 2023). Adding the uncertainty for two filters in quadrature, this translates to a ∼7% instrumental uncertainty on colors measured from JWST.
The uncertainty in determining MIRI backgrounds also affects our measurements in faint parts of galaxies and at large Galactocentric radii, where the median intensity can be of order the background. Some of our galaxies include empty sky regions, where we estimate the statistical noise at our common resolution for each MIRI filter. At  resolution, typical 1σ uncertainties in the backgrounds are roughly 0.03, 0.04, 0.05, and 0.09 MJy sr−1 at F770W, F1000W, F1130W, and F2100W, respectively. Thus, anchoring for MIRI images is uncertain to ≲0.04 MJy sr−1 in F770W, F1000W, and F1130W, and ≲0.1 MJy sr−1 in our longest wavelength filter F2100W.
For regions of galaxies at intermediate brightness (Iν ≈ 1MJy sr−1), the uncertainty associated with stellar continuum subtraction is often the dominant source of uncertainty. From Section 2.1.2, the 1σ uncertainty is ∼15%–35% on the factor to scale the F300M and predict the starlight intensity in the MIRI filters. This uncertainty is largest in regions dominated by older stellar populations, i.e., bulges and star formation deserts, and at shorter wavelengths, i.e., F770W and F1000W. Our final uncertainties in all figures in Section 3 and beyond thus add in quadrature this dominant uncertainty due to starlight subtraction to the filter-dependent background uncertainty and the 5% calibration uncertainty for filter intensities, or 7% calibration uncertainty in mid-IR colors.
Finally, we provide the Spearman rank correlation coefficient ρ between measurements where relevant, and print the corresponding p-value only if >0.0001. We print ρ in bold if the p-value < 0.0001, or the correlation is highly significant. For all correlations, we perform 2 × 10⁴ permutations (or randomization tests) to estimate robust nonparametric p-values for small samples (n ≈ 40–150) which do not require assumptions of normality.
3. Mid-IR Colors in Galaxies
We use maps of 3 μm starlight, starlight-subtracted 7.7 μm, and 21 μm dust continuum emission for all 71 galaxies, and include 10 μm and 11.3 μm where available (20/71). We discuss three key results below: (1) Radial profiles of galaxies in the mid-IR show systematic variations with galaxy  ; (2) Mid-IR colors and
  (scaled F770Wss/F2100Wss; Section 2.1.3) remain relatively constant in “normal” star-forming parts of galaxies; and (3) Mid-IR colors show stark environmental differences between normal star-forming disks, star-forming CMZs, and the quiescent bulges of massive galaxies.
3.1. Radial Profiles of 71 Galaxies
In Figure 6, we compile the radial profiles of median F300M, F770Wss, and F2100Wss for all 71 galaxies, and F1000Wss and F1130Wss for 20 galaxies following Section 2.5.1. We first show the profiles of each galaxy colored by M⋆ and also show median profiles after binning the galaxies by global M*. More massive galaxies (M* > 1010 M⊙) show the imprint of central bulges and bars in their steeper or flattened central radial profiles (departures from an exponential disk) in addition to higher overall intensities, compared to lower-mass galaxies which show flatter profiles (E. Emsellem et al. 2026).
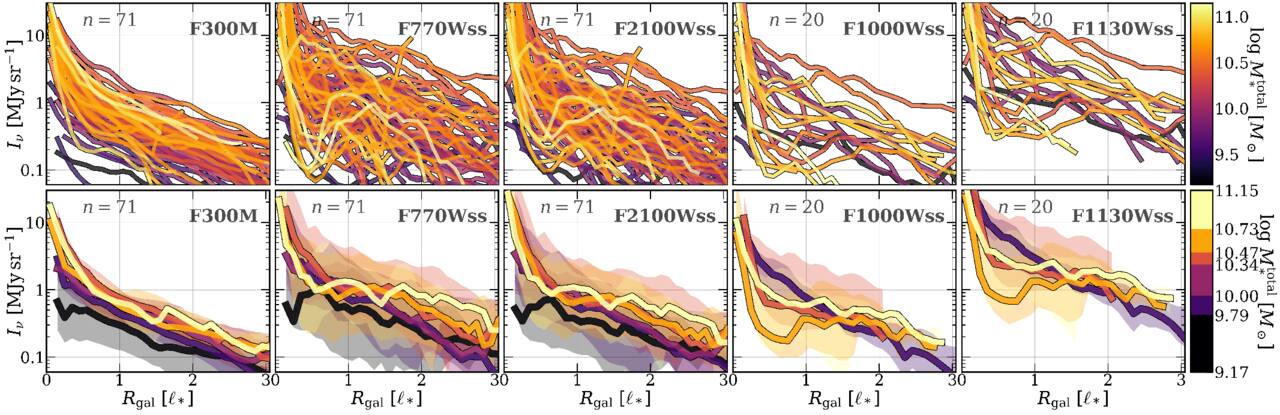
Figure 6. Top: radial profiles of F300M, F770Wss, and F2100Wss intensity for all 71 galaxies; F1000Wss and F1130Wss for 20 galaxies, colored by galaxy stellar mass M*. Bottom: median (solid lines) and 16th–84th percentile range (shaded region) of radial profiles of F300M, F770Wss, F2100Wss, F1000Wss, and F1130Wss in six percentile bins of M*. All radial profiles are shown as a function of (projected) Galactocentric radius in units of the galaxy exponential scale length ℓ*.
Download figure:
Standard image High-resolution imageIn Figure 7, the profiles of  show systematic variation with galaxy M*. The amount and scale of
  suppression in centers varies by galaxy
  , where the most massive galaxies (M* > 1010 M⊙) on median show the lowest
  in centers. The central
  in these massive galaxies is on median 0.1–0.2 dex lower than the nearly flat median beyond ℓ* (discussed further in Section 3.3).
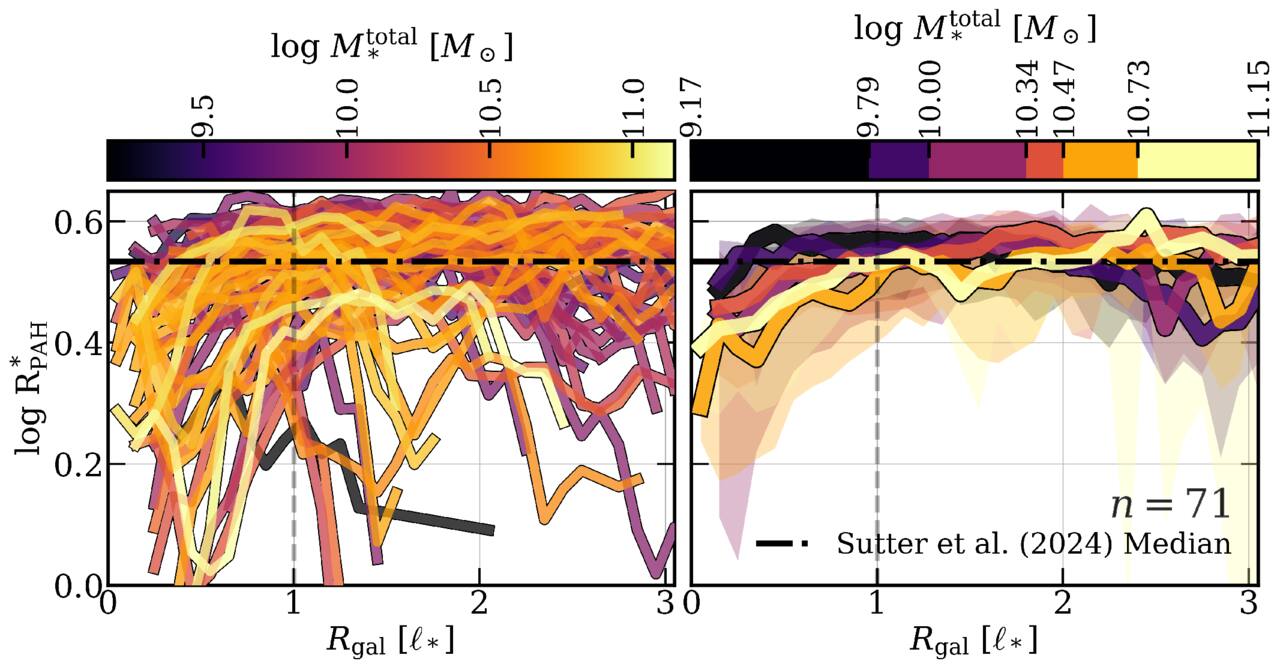
Figure 7. Radial profiles of  for individual galaxies colored by total M* (left), and then median profiles for groups of galaxies sorted into percentile bins of M* (right). All Galactocentric distances for the radial profiles are shown in units of the exponential scale length ℓ*. For each binned profile, the median profile within a bin (solid line) and 16th–84th percentile range (shaded area) are included. Diffuse ISM median for 19/71 of our targets from J. Sutter et al. (2024) shown as horizontal black dotted–dashed lines.
Download figure:
Standard image High-resolution image
 remains nearly constant across most radial bins in the star-forming disks of “normal” galaxies beyond ∼1ℓ*. This is reflected in both the individual and stacked radial profiles of
  , which remain approximately flat on average at ℓ* < Rgal < 3ℓ* for most galaxy disks (discussed further in Section 3.2).
Our NIRCam footprints typically extend out to only ∼2.5–3ℓ*, and rarely cover significant area beyond 4ℓ*. Figure 7 shows that the profiles of  and
and  remain flat over this range, but our observations do not cover the outskirts of star-forming disks, where
  is expected to vary due to changes in metallicity, sSFR, and lower column density (see, e.g., G. Aniano et al. 2020; C. M. Whitcomb et al. 2024; R. Chown et al. 2025). We thus do not cover enough radial extent and range in galaxy M* and metallicity to recover any systematic trend in
  due to changing metallicity in the diffuse ISM.
3.2. Roughly Constant in Normal Star-forming Disks

Table 1 summarizes our measurements of  , which is defined in Equation (1). The radial profiles of
  for most galaxies show a stable plateau between roughly 1 and 3ℓ*. In Figure 8, we show this plateau value as the median over all 0.1ℓ* wide radial bins with ℓ* ≤ Rgal ≤ 3ℓ*, as well as the 1σ scatter across azimuthal bins. We check against global (galaxy-integrated) properties (from A. K. Leroy et al. 2021) for correlations between the plateau value of
  . We find that the plateau value correlates best with global
  , with a moderate Spearman rank correlation coefficient of ρ = 0.42 (p-value< 0.0001). While galaxy sSFR presents the strongest correlation, we also note that the lowest
  galaxies show the lowest
  (no overall correlation with
  : ρ = −0.11, and p-value =0.372).
Table 1. Summary of  in Diffuse ISM Sight Lines
| Environment | n | Median | Q1/Q3 | ±1σ |
|---|---|---|---|---|
| ℓ* ≤ Rgal ≤ 3ℓ* | 71 | 0.55 | 0.49/0.58 | 0.13 |
| 20 | 0.56 | 0.52/0.59 | 0.11 | |
| Rgal < ℓ* | 71 | 0.49 | 0.38/0.55 | 0.17 |
| 20 | 0.47 | 0.35/0.54 | 0.15 | |
| Normal Disk | 71 | 0.52 | 0.44/0.56 | 0.11 |
| 20 | 0.52 | 0.46/0.57 | 0.09 | |
| Normal Center | 37/71 | 0.51 | 0.43/0.53 | 0.07 |
| 8/20 | 0.51 | 0.46/0.52 | 0.05 | |
| Young CMZ | 18/71 | 0.39 | 0.31/0.45 | 0.09 |
| 9/20 | 0.38 | 0.34/0.44 | 0.07 | |
| Old Bulge | 13/71 | 0.28 | 0.24/0.33 | 0.13 |
| 4/20 | 0.31 | 0.28/0.34 | 0.04 | |
Note. Median, first/third quartiles (Q1/Q3), and standard deviation of the diffuse  measured over all annuli within ℓ* ≤ Rgal ≤ 3ℓ* and Rgal < ℓ*, and split by galaxy environment, with statistics shown for the full sample n = 71 and the subset of n = 20 with full MIRI filter coverage.
Download table as: ASCIITypeset image
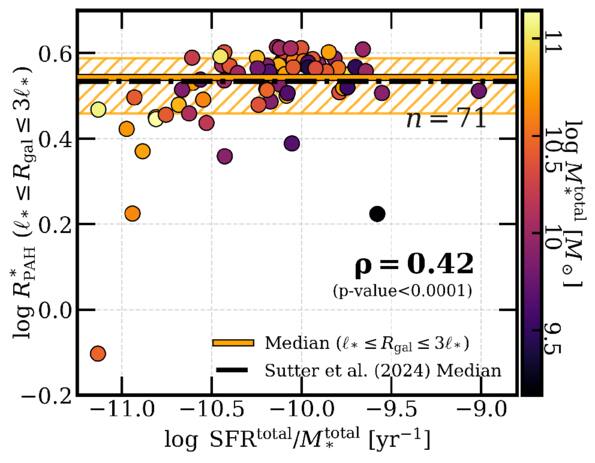
Figure 8. Plateau value in radial profiles of  for each galaxy, measured as the median of all 0.1ℓ* annular bins with ℓ* ≤ Rgal ≤ 3ℓ*, points colored by galaxy stellar mass, as a function of global sSFR. Median of 71 galaxies (orange solid line), 1σ scatter (orange hatched area), diffuse ISM median from J. Sutter et al. (2024, horizontal black dotted–dashed line), and Spearman rank correlation coefficient (printed) shown. See Table 1.
Download figure:
Standard image High-resolution imageThe diffuse median at ℓ* ≲ Rgal ≲ 3ℓ* is in agreement with the previously measured diffuse ISM median  (
( ) (using F2100W instead of F2100Wss) for 19/71 of our galaxies by J. Sutter et al. (2024), shown as the black dotted–dashed line in Figures 7 and 8. Although on median the profile of the lowest mass bin (
 ) is in line with the rest of the sample (see Figure 7), in the lowest-
 galaxies in our sample with
  ,
,  remains universally low in the entire disk relative to more massive galaxies (Figure 8). In particular, our lowest mass galaxy is NGC 3239 (included in Figure 1) with M* ≈ 109.17 M⊙, and one of the lowest
  . Table 1 summarizes the median and scatter in
  across all radial bins for 71 galaxies. Future work integrating our results with JWST observations of lower-mass dwarf galaxies will be useful to test how this trend transitions into the well-known suppression of PAH abundance in low-mass dwarf galaxies (e.g., F. Galliano et al. 2018; A. Li 2020).
In addition to radial profiles, we split each galaxy into distinct morphological and star formation environments (Section 2.3). Table 2 reports the median and spread in mid-IR colors for each environment,40
and in Figure 9, we plot  and two other key ratios for each environment in each galaxy. We compare these mid-IR colors to the average ΣSFR, sSFR, and F2100W/F300M color integrated over each environment. We indicate “normal” disk environments with yellow markers and “normal” centers in pale blue (X’s if all four MIRI filters are available, circles otherwise).
Table 2. Summary of Diffuse Mid-IR Colors
| Environment | Median | Q1/Q3 | ±1σ |
|---|---|---|---|

| |||
| Normal Disk (20) | −0.24 | −0.28/ − 0.21 | 0.08 |
| Normal Center (8) | −0.26 | −0.28/ − 0.25 | 0.05 |
| Young CMZ (9) | −0.18 | −0.21/ − 0.13 | 0.05 |
| Old Bulge (4) | −0.43 | −0.47/ − 0.40 | 0.04 |

| |||
| Normal Disk (20) | −0.24 | −0.26/ − 0.20 | 0.06 |
| Normal Center (8) | −0.19 | −0.21/ − 0.17 | 0.06 |
| Young CMZ (9) | −0.40 | −0.50/ − 0.35 | 0.10 |
| Old Bulge (4) | −0.17 | −0.21/ − 0.14 | 0.04 |

| |||
| Normal Disk (20) | 0.11 | 0.05/0.16 | 0.09 |
| Normal Center (8) | 0.10 | 0.05/0.11 | 0.05 |
| Young CMZ (9) | −0.03 | −0.07/0.03 | 0.07 |
| Old Bulge (4) | −0.10 | −0.13/ − 0.07 | 0.04 |

| |||
| Normal Disk (20) | 0.35 | 0.32/0.38 | 0.05 |
| Normal Center (8) | 0.36 | 0.27/0.38 | 0.08 |
| Young CMZ (9) | 0.08 | 0.01/0.20 | 0.11 |
| Old Bulge (4) | 0.34 | 0.31/0.37 | 0.05 |
Note. Median, first/third quartiles, and standard deviation of mid-IR colors in the diffuse ISM of the n = 20 galaxies with full MIRI filter coverage (Section 2.1), split by galaxy environment (Section 2.3).
Download table as: ASCIITypeset image
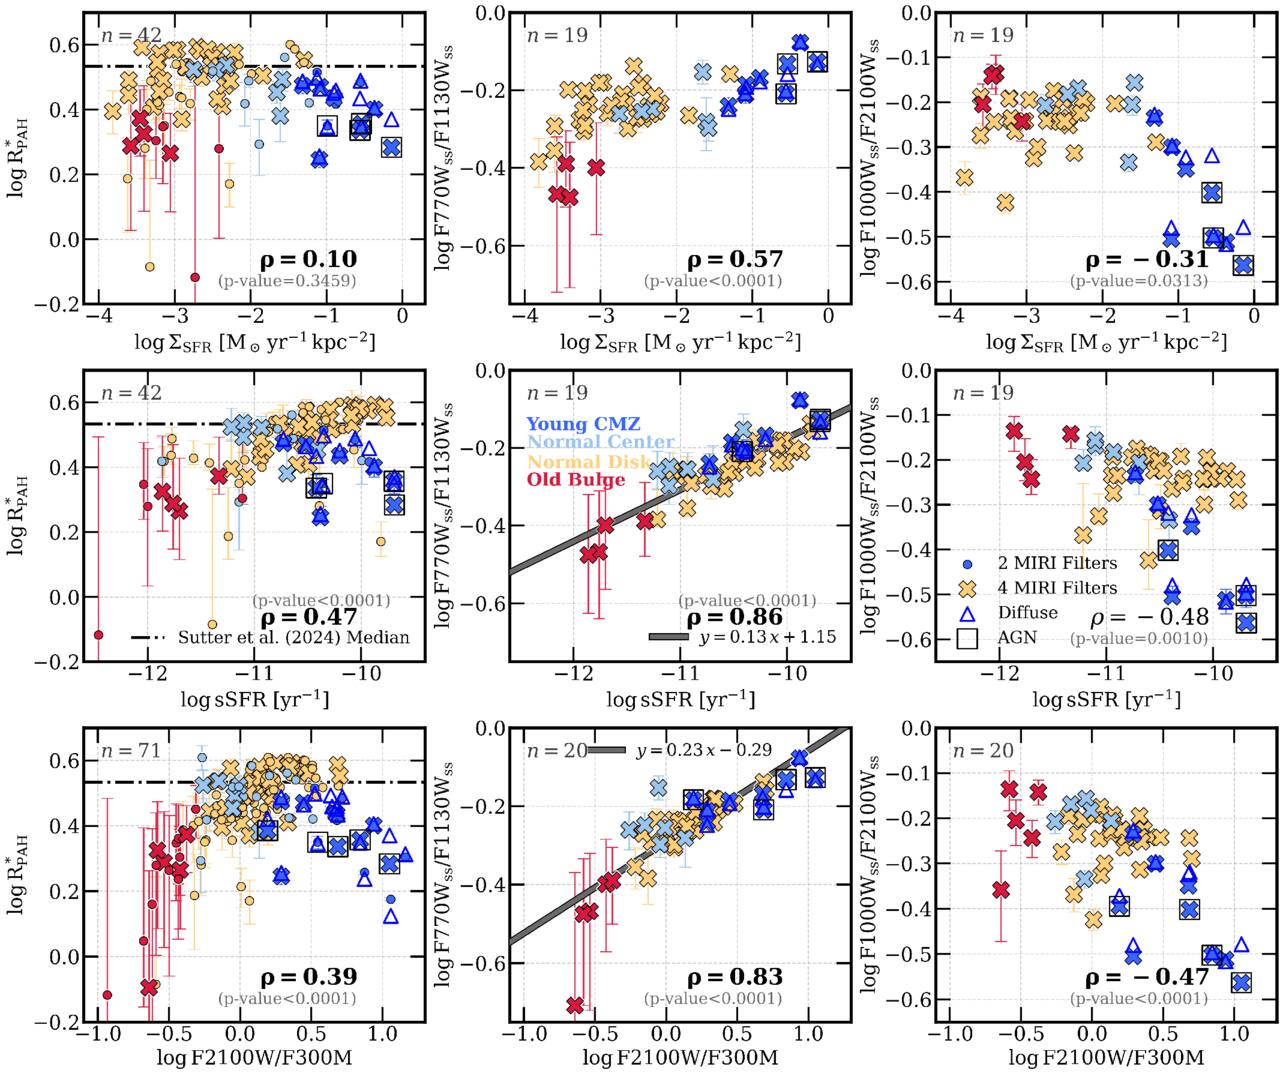
Figure 9.
 ,
,  , and
, and  as a function of
  and
and  from MUSE, and
  (bottom row), split by local environment—old stellar bulges (red), young CMZs (bright blue), normal centers (pale blue), and disks (yellow). The markers indicate medians within each environment, with corresponding Spearman rank correlation coefficients (ρ) printed. We indicate the 20 galaxies with coverage in all four MIRI filters as X’s, and the rest with only two MIRI filters as circles. For galaxy centers, we include medians within the full environment (X’s or circles) and select for only diffuse emission (blue triangles), and mark centers with known AGN (open squares; M.-P. Véron-Cetty & P. Véron 2010). The median diffuse
  from J. Sutter et al. (2024) is included for comparison (black dotted–dashed line).
Download figure:
Standard image High-resolution imageAcross our full sample, most disks show a narrow range of values in  (similar to Figure 8), with <0.1 dex scatter (Table 1). Figure 9 also shows a subset of galaxy centers that have similar environment-integrated ΣSFR and sSFR to normal disks and also show similar mid-IR colors. “Normal” disks and “normal” centers also show a narrow range of values around
  and
and  , with environment-integrated medians and scatter summarized in Table 2.
As with the radial profiles (Figure 8), Figure 9 shows a moderate correlation between environment-integrated sSFR and  in “normal” disks (ρ = 0.47). We also find a strong correlation between F770Wss/F1130Wss and sSFR (ρ = 0.86), or F2100W/F300M (ρ = 0.84), which we use as a proxy for sSFR (Section 2.4), with best-fit relations reported in Figure 9.
3.3. Low in the Centers of Massive Galaxy

Figure 7 shows that  declines in the centers of massive galaxies. The most massive galaxies (M* ≳ 1010 M⊙) show kiloparsec-scale low
  . Particularly within the central ∼1ℓ* (typically ∼3 kpc), the depression in
  is significant, 0.1–0.4 dex lower
  relative to the rest of the disk (Figure 7). Examples include the central regions of NGC 1300 (Figure 3), NGC 1512, and NGC 2775 (Figure 1).
As discussed in Section 2.5.4, we expect uncertainties associated with starlight subtraction to dominate in galaxy centers with faint PAH emission. Figure 9 shows our best-estimate error bars accounting for these uncertainties. The figure shows that the  contrasts between (i) bulges and disks and (ii) young centers and disks are both larger than the uncertainty associated with starlight subtraction.
Local conditions in inner galaxies can diverge from those in normal star-forming disks in different ways. CMZs are expected to have increased radiation field intensity because of the high density of young, massive stars. This results in a higher than normal density of H ii regions where ionizing photons may destroy fragile PAHs (e.g., J. Sutter et al. 2024; O. V. Egorov et al. 2025, for  in H ii regions). It also enhances the 21 μm continuum (e.g., G. J. Bendo et al. 2008). CMZs can also exhibit higher average dust attenuation (1 ≲ AV ≲ 3 mag; J. D. T. Smith et al. 2007, see Section 4.5), total gas column (M. Querejeta et al. 2021), and stellar mass density than disks.
The centers of massive galaxies can also host quiescent old stellar population-dominated bulges and bars, where the radiation field is softer, i.e., FUV-poor, due to the low density of young stars and high density of older stars (e.g., the FUV-poor bulge of M31; B. Groves et al. 2012; B. T. Draine et al. 2021). These conditions may be more similar to ETGs and ellipticals (e.g., H. Kaneda et al. 2005; R. Rampazzo et al. 2013). Bulges can also be relatively ISM-free regions where the total gas column density and dust content can be lower than in normal star-forming disks.
Finally, though we have masked the brightest cases (Section 2.5.3), 5 of our galaxies also host active galactic nuclei (AGN; M.-P. Véron-Cetty & P. Véron 2010) which can change PAH and mid-IR continuum emission properties (J. D. T. Smith et al. 2007; J. J. Jensen et al. 2017) over the central ∼500 pc, the exact extent of the zone of influence around AGN remains poorly constrained.
These changes in radiation field intensity and shape can change  by changing the intensity of the dust continuum, the ionization state or size distribution of PAHs, and/or the importance of stochastic emission versus equilibrium emission from small grains (D. Baron et al. 2025). These, in turn, manifest in the observed mid-IR colors. In Figure 9 and hereafter, we measure these colors for each environment in each target galaxy. We show variations as a function of environment-integrated ΣSFR and sSFR. ΣSFR correlates with increasing radiation field intensity (e.g., J. Chastenet et al. 2025). It is highest in starburst galaxy centers and lower in normal star-forming disks and bulges. On the other hand, sSFR normalizes the overall star formation surface density by the existing M*, which should correlate with the shape of the radiation field. sSFR is low in FUV-poor bulges and star formation deserts, but higher in normal star-forming disks and galaxy centers.
Figure 9 shows that there is significant variation in diffuse mid-IR colors among environments, and that these mid-IR color variations correlate with ΣSFR and sSFR. While  remains roughly constant in the diffuse ISM of most normal disks (intermediate ΣSFR and sSFR), it decreases in extreme environments—(1) in young CMZs with very high ΣSFR, and (2) bulges with very low sSFR. Such large variations in local star formation result in changes in both the intensity and shape of the radiation field.
3.3.1. Young Star-forming Centers
The most star-forming centers host CMZs or nuclear stellar disks, where a high density of H ii regions leads to widespread PAH destruction, and the overall radiation intensity and dust and gas column densities are higher. These high sSFR centers or CMZs, indicated by dark blue points in Figure 9, show lower  than normal disks and normal centers. CMZs on average show 0.15 dex lower
  than normal star-forming disks, as summarized in Table 1 and Figure 9.
As in Figure 5, in CMZs we show measurements for both the full environment (filled symbols), as well as selecting specifically for only diffuse emission (empty triangles; see Section 2.5.3 for details) for a direct comparison with diffuse emission in disks. This removes from analysis nebular regions in CMZs, where  is likely low due to local PAH destruction (J. Sutter et al. 2024; O. V. Egorov et al. 2025), and instead focuses on regions where
  presumably varies due to physical conditions such as the radiation field, PAH abundance, or PAH properties.
We summarize the measured median and scatter in diffuse  for CMZs in Table 1,
  with a ∼0.1 dex scatter. In the most highly star-forming CMZs (ΣSFR ≳0.1 M⊙ yr−1 kpc−2), diffuse
  in centers is still ∼0.2 dex lower than in “normal” parts of galaxies (Figure 9).
These highly star-forming centers form part of a continuous trend in F770Wss/F1130Wss color versus sSFR (or F2100W/F300M) that includes all environments. At fixed sSFR, diffuse regions in CMZs also show slightly (0.05–0.1 dex) higher F770Wss/F1130Wss than “normal” disks, which could be attributed to harder radiation fields and/or more ionized PAHs in galaxy centers (Section 4.4).
In addition to low  and higher F770Wss/F1130Wss, CMZs show the lowest F1000Wss/F2100Wss colors compared to all other environments. CMZs show on average ∼0.2–0.4 dex lower F1000Wss/F2100Wss compared to all lower ΣSFR environments, where F1000Wss/F2100Wss shows a sharp drop at ΣSFR ≳ 0.1 M⊙ yr−1 kpc−2. As we discuss in Section 4.3, the lower
  and the sharp decline in F1000Wss/F2100Wss in CMZs relative to other environments is consistent with significantly higher radiation field intensities in diffuse parts of the ISM in these galaxy centers.
3.3.2. Old Bulges and Star Formation Deserts
Finally, at the very low end of the sSFR range,  also declines. Figure 9 shows that
  is ∼0.2–0.6 dex lower relative to “normal” disks in the diffuse ISM of quiescent parts of otherwise star-forming massive galaxies—in bars, bulges, or star formation deserts (which we collectively refer to as “bulges” hereafter). The suppression in
  in bulges is even lower than that observed in the diffuse ISM of the most highly star-forming CMZs (Table 1). Quiescent bulges show
  , with large (≳0.1 dex) scatter to lower values at the lowest sSFR (or F2100W/F300M).
Since the bulges are relatively fainter in F770Wss and dominated by strong old stellar emission (bright in F300M), these are the environments where uncertainties in starlight subtraction dominate the error (especially for shorter-wavelength filters such as F770W and F1000W). Even after accounting for these significant uncertainties (added in quadrature to other instrumental and background uncertainties, see Section 2.5.4), included in Figure 9, quiescent bulges show significantly lower  .
.
In addition to low  , bulges also show low
  , on average 0.2 dex lower than “normal” disks and centers, and 0.3 dex lower than highly star-forming CMZs. In fact, the 4/13 bulges with F1130W coverage are also in agreement with the tight correlation between F770Wss/F1130Wss and sSFR observed across all environments in 20 galaxies. Finally, the 4 bulges with F1000W coverage show F1000Wss/F2100Wss colors consistent with in “normal” star-forming parts of galaxies.
The low  in regions of low sSFR likely reflects a suppression of 7.7 μm PAH emission instead of enhanced F2100Wss, since F770Wss/F1130Wss is low, but F1000Wss/F2100Wss is not, which we discuss in detail in Section 4.4. We speculate that the behavior in bulges may reflect the same effect seen in Spitzer spectra of ETGs, which show detected 11.3 μm emission but very little 7.7 μm emission (e.g., P. Panuzzo et al. 2011; R. Rampazzo et al. 2013, 2014; D. Baron et al. 2025). Changing radiation field properties are likely not a viable explanation for large variations in F770Wss/F1130Wss, since the wavelengths are sufficiently close that radiation field considerations are quite small. While the lack of energetic FUV photons (low sSFR regions are also expected to be relatively FUV-poor) can suppress shorter-wavelength PAH emission (e.g., suppress 7.7 μm emission relative to 11.3 μm; B. T. Draine et al. 2021), changes in PAH ionization and grain size cause the most significant changes in
  and F770Wss/F1130Wss, which we disentangle in Section 4.4. Finally, PAH hydrogenation and composition itself could conceivably be varying in these environments, testing which would require spectroscopic follow-up in bulges.
3.4. Mid-IR Color–Color Variation
For the 20 galaxies where all four mid-IR filters are available, we show mid-IR colors as a function of one another to connect the trends seen in Figure 9. In Figure 10, we show F770Wss/F2100Wss (or  ) and F770Wss/F1130Wss PAH-correlated ratios against the mid-IR continuum ratio F1000Wss/F2100Wss. Comparing F770Wss/F2100Wss and F1000Wss/F2100Wss, it is clear that in most CMZs and disks, 7.7/21 μm and 10/21 μm vary together. If F1000Wss is taken to reflect the continuum near F770Wss, this indicates that to first order, mid-IR color variations contrasting “normal” disks versus CMZs are likely primarily driven by variations in the radiation field intensity, not changes in PAH properties. We show in Section 4.3 that environments with low 7.7/21 μm and 10/21 μm also show higher far-infrared (far-IR) dust temperature (and hence, radiation intensity), supporting this interpretation.
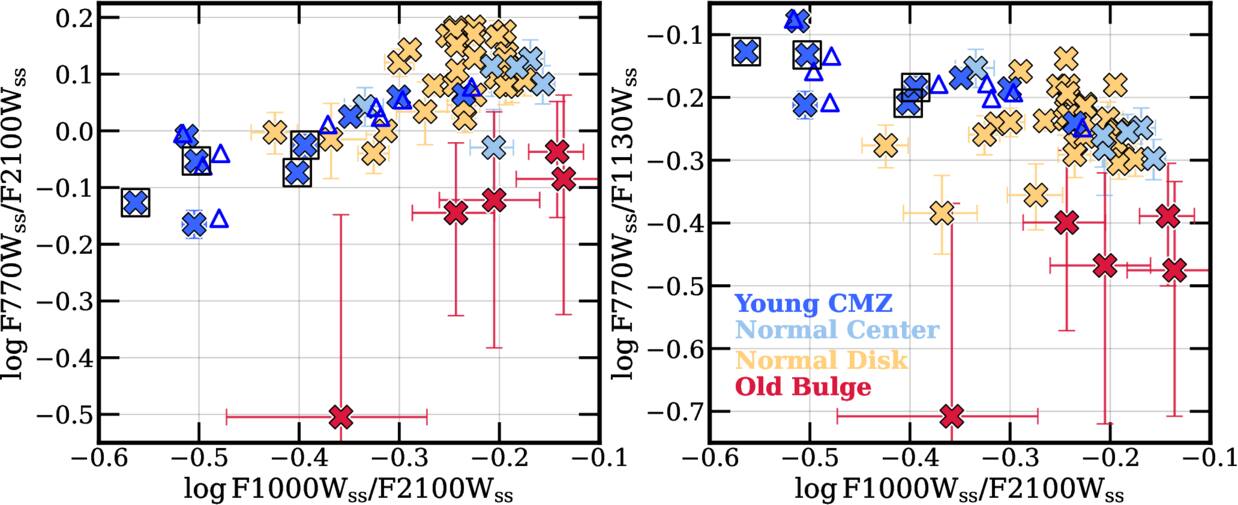
Figure 10. Mid-IR color–color variation by environment for 20/71 galaxies with full MIRI filter coverage. F770Wss/F2100Wss (or  ) and F770Wss/F1130Wss ratios vs. F1000Wss/F2100Wss for bulges (red), CMZs (dark blue), “normal” centers (pale blue), and disks (yellow) shown.
Download figure:
Standard image High-resolution imageFigure 10 also highlights the bulges as distinct environments that show abnormally low 7.7/21 μm despite normal-to-high 10/21 μm. This departure from the otherwise consistent trend between centers and disks indicates that the low F770Wss in bulges is likely not due to changes in only radiation field intensity. The right panel of Figure 10 compares F770Wss/F1130Wss and F1000Wss/F2100Wss. This once again highlights the contrast between highly star-forming CMZs with high F770Wss/F1130Wss, and quiescent bulges with extremely low F770Wss/F1130Wss, lower than normal disks. In Section 4.4, we confirm that changes in PAH charge and radiation hardness likely suppress 7.7 μm emission and result in low  in quiescent bulges.
4. Interpreting Photometric Band Ratios
4.1. Stark Environmental Variation within “Normal” Galaxies
The mid-IR colors of the diffuse ISM in star-forming galaxies vary between “normal” galaxy disks, highly star-forming galaxy centers, and quiescent bulges or star formation deserts. Mid-IR colors in the diffuse ISM on average remain relatively constant across large parts of the optical disks of galaxies, with <0.1 dex variation in colors across large samples of galaxies (Table 2).
Highly star-forming CMZs and quiescent bulges both harbor conditions very different from normal star-forming disks. In CMZs, the average gas and dust column density, and hence AV, can be high. In addition, the high density of young, massive stars leads to a high radiation field intensity and can also result in more ionizing photons that can destroy PAHs and result in harder (FUV-rich) radiation fields (e.g., L. E. Tacconi-Garman et al. 2005; O. V. Egorov et al. 2025), which can enhance dust continuum emission, suppress PAH emission where PAHs are destroyed, or may enhance emission from more ionized, and/or smaller, and/or shorter-wavelength PAH emission. In Section 4.3, we confirm that the variation in mid-IR colors in CMZs is likely driven by changes in the overall radiation field intensity in the diffuse ISM.
On the other hand, quiescent bulges, bars, and star formation deserts are characterized by high stellar surface densities, but can be relatively ISM-free. Although the radiation field intensity can be moderately high in bulges, the radiation spectrum is expected to be FUV-poor (i.e., softer) due to older starlight (e.g., the high radiation intensity but soft, FUV-poor bulge of M31; B. Groves et al. 2012). Softer radiation can suppress short-wavelength PAH emission relative to longer-wavelength features (e.g., B. T. Draine et al. 2021), and may suppress emission from more ionized PAHs. In Section 4.4, we discuss how mid-IR color variations in relatively quiescent bulges may be due to the presence of more neutral PAHs and/or a softer radiation spectrum.
4.2. Comparison with Dust Models
In addition to the actual abundance of PAHs, qPAH, the physical properties of PAHs or the properties of the illuminating radiation field (or a combination of the two) may drive changes in mid-IR colors. In the rest of the paper, we try to constrain how much of the variation in mid-IR colors between environments can be explained by local conditions such as changes in the radiation field (intensity and spectrum) and/or PAH properties (charge and size), rather than qPAH. B. T. Draine et al. (2021, hereafter D21) model the effect of each of these factors, and we compare D21 dust model predictions and our mid-IR photometric filter ratios. We use a fixed Milky Way qPAH throughout, reflecting the relatively high metallicity of our targets, to highlight the range of variation possible due to radiation field and PAH properties only. We compare against three radiation field hardness models from D21 which roughly correspond to the three environments we classify (Section 2.3)—a 3 Myr old (young) starburst (blue; labeled as SB3), a modified Mathis, Mezger, and Panagia (mMMP) radiation field (J. S. Mathis et al. 1983) that roughly corresponds to a Milky Way disk average (yellow; mMMP), and the quiescent Andromeda bulge (red; M31 bulge). These radiation models have decreasing radiation hardness, from most FUV photon-rich (SB3) to most FUV photon-poor (M31 bulge). We note that we use the D21 models directly and produce grids (variation due to changing PAH charge and size) for a given U, instead of a range of U. While a range of U is likely a more realistic assumption for dust on larger scales, lacking finer constraints, we compare our observations against a range of different (single) U values. We show D21 predictions for the fiducial diffuse ISM  models for comparison, and include for reference the predictions for Astrodust+100% neutral PAHs where relevant.
We perform synthetic photometry (see, e.g., J. Koornneef et al. 1986; K. D. Gordon et al. 2022) using the transmission curves for the respective JWST filters on the D21 model spectral energy distributions (SEDs) for varying radiation field intensity U, three radiation hardness models (SB3, mMMP, and M31 bulge), and varying PAH ionization state and grain size distributions. We use the model SEDs that include both PAH emission and dust continuum. This enables consistent comparison with our measurements, where we remove starlight but not dust continuum emission from MIRI filters.
In Figure 11, we include D21 model grids that show the range of color combinations predicted by varying PAH ionization and size for the three radiation hardness models at fixed  , and include the SB3 grid at
  to highlight the direction of change with
  . As noted in Section 3.4, the lower F770Wss/F2100Wss and lower F1000Wss/F2100Wss in CMZs compared to disks is in good agreement with variation predicted due to increasing
  in D21.
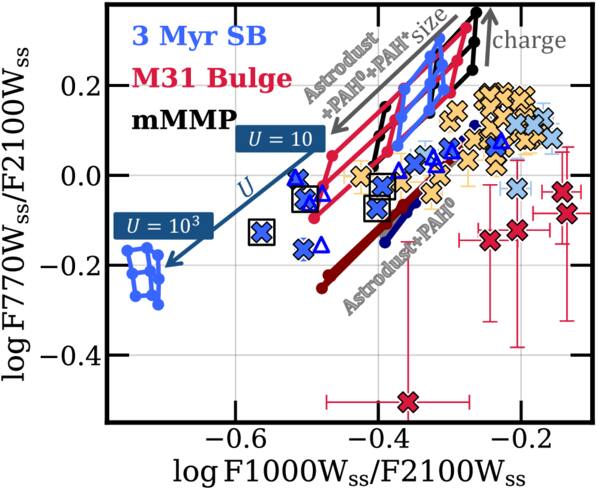
Figure 11. The D21 dust model predictions for varying PAH charge and sizes (“grids”) assuming three different radiation field hardness models at  —mMMP (black), M31 bulge (red), and a 3 Myr old starburst (blue); and a 3 Myr old starburst at
  . Arrows show the direction in which grids shift due to increasing PAH ionization, size, and
  . Modulo a 0.1 dex offset in F1000W between model grids and observations, changes in mid-IR colors for CMZs relative to disks are consistent with increasing U, while star formation deserts or bulges lie off the standard grids. In darker colors (overlapping gray, maroon, and navy) we show the model predictions at the limiting case where PAHs are 100% neutral (PAH0) for
  .
.
Download figure:
Standard image High-resolution imageFigure 11 shows the observations to be offset from the model grid. This is because the F1000Wss intensities that we measure are systematically higher than those predicted by the D21 models by 0.1 dex. We identify the F1000Wss filter as the cause of the 0.1 dex discrepancy, because our observed F770Wss/F2100Wss colors overlap the range predicted by the models, as do the F770Wss/F1130Wss and F1130Wss/F2100Wss colors (shown below, see, e.g., Section 4.4). The bulges also show significantly lower F770Wss/F2100Wss relative to all other environments, which are not reproduced by the standard range of PAH charge variation in the D21 models, but are still bracketed by the limiting case of Astrodust+100% neutral PAHs (darker lines labeled PAH0 in Figure 11), as discussed in Section 4.4.
The offset between D21 and our measurements of F1000W persists across all environments in our sample. We speculate that the discrepancy in F1000W may be due to a combination of (a) the adjacent PAH emission features in the models being too narrow, and so not contributing sufficiently to the F1000W filter; or (b) the shape of the continuum emission around 10 μm being different in the models. The D21 SEDs do not include differential attenuation of the IR emission, e.g., by the 10 μm silicate absorption feature, so the low F1000W in the models cannot be due to missing silicate absorption. In fact, if we were to account for the silicate absorption in the models, this would further decrease the F1000W flux from the models and hence would make the discrepancy between the models and the observations even larger (detailed SED comparison forthcoming in M. Boquien et al. 2026, in preparation).
4.3. High Radiation Intensity in CMZs
At high radiation intensity ( ), a component from dust in thermal equilibrium starts to contribute at the longer MIRI wavelengths, leading to a relative increase in 21 μm emission. Because
  includes F2100Wss, such intense radiation fields can cause variations in mid-IR color that resemble those due to varying PAH abundance. To check whether the low
  in highly star-forming CMZs is due to high U or changes in qPAH, we require an independent estimate of U. We use far-IR colors, which capture variations in the dust temperature, Tdust. In turn, Tdust reflects thermal equilibrium between the dust and the ISRF, and so U.
For 31 galaxies, we use archival Herschel PACS 70, 100, and 160 μm data compiled by J. Chastenet et al. (2025) to measure 70/100 μm, 100/160 μm, and 70/160 μm colors. Though available at much lower resolution ( ) compared to the JWST observations, these far-IR colors are robust tracers of thermal dust temperature (Tdust), which is not accessible with JWST alone. For a single radiation field of intensity U and a modified blackbody dust SED with emissivity index β = 2, Tdust ∝ U1/6. However, similar to the mid-IR (see Section 4.2), far-IR colors can depend on the distribution of radiation field intensities, so the interpretation in terms of a single Tdust or U is not straightforward, and we simply present the far-IR colors as a tracer of changes in the average radiation field.
In Figure 12, we show that high sSFR centers indeed show high 70/100 μm, 100/160 μm, and 70/160 μm colors, indicating high average Tdust, and hence significantly higher U relative to “normal” disks. In addition, some bulges also exhibit moderately high far-IR colors, and hence Tdust, despite their extremely low sSFR. This is likely due to their high concentration of old stars (high F300M intensities), similar to the bulge of M31 with high Tdust due to intense but old starlight (B. Groves et al. 2012).
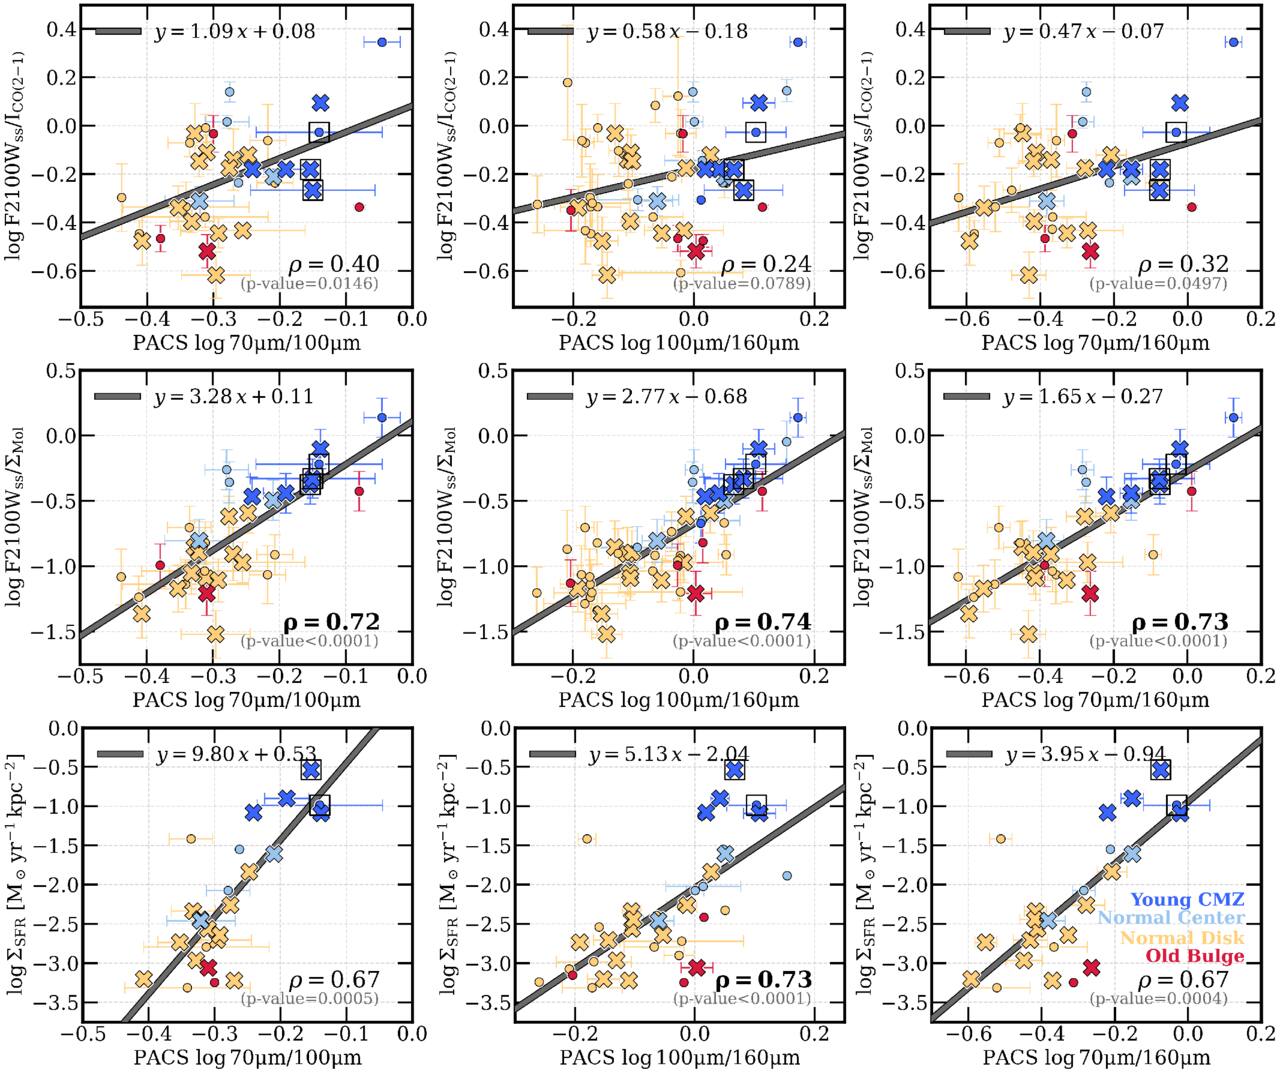
Figure 12. Correlating far-IR dust temperature tracers with expected tracers of radiation field intensity: Herschel PACS far-IR ratios of specific intensities (Iν) for ∼31 galaxies where PACS 70, 100, or 160 μm data are available, with F2100Wss/ICO(2−1) (top row), F2100Wss/ΣMol (middle row), and ΣSFR (bottom row), data points colored as in previous figures.  fits and corresponding Spearman rank correlation coefficients are included for comparison.
Download figure:
Standard image High-resolution imageWe complement this analysis using less direct but higher resolution mid-IR-based tracers of U. We expect that ΣSFR and IMIR/Σgas, particularly F2100Wss/Σgas, should correlate with U. This follows since, to first order, in the diffuse ISM with sufficiently low U (U ≲ 10),

The smallest molecules, including PAHs, are stochastically heated and in this single-photon limit their emission is linearly proportional to U. At very low U ∼ 1, F2100W similarly traces stochastically heated grains, and is expected to scale linearly with U. At intermediate U grains are still stochastically heated, but multi-photon effects can cause the F2100W emission to become nonlinear as a function of U, and finally at larger U ≳ 10, grains have steady-state temperatures that scale roughly as U1/6. Even where F2100W emission and the radiation field intensity are not expected to scale linearly, the relation between F2100W and U is monotonic for realistic ISM conditions (B. T. Draine & A. Li 2001, 2007). So for a fixed dust-to-gas ratio D/G, dust continuum-to-gas column, or F2100Wss/Σgas ≈ F2100Wss/ΣMol should scale with the radiation field intensity U. While there are caveats, like the need for an αCO prescription to measure ΣMol, the possibility of D/G changes, and nonlinearity at high enough U ≳ 10 (where F2100W increases nonlinearly but still monotonically with U), we expect F2100Wss/ΣMol to be a good tracer of relative changes in U.
In Figure 12, we test how F2100Wss/ΣMol compares to far-IR colors by combining our F2100Wss JWST measurements with molecular gas maps from PHANGS- Atacama Large Millimeter/submillimeter Array (ALMA; A. K. Leroy et al. 2021). We use the native ∼1″ resolution broad masked CO(2–1) maps, which allow for more complete flux retrieval in diffuse regions. We convolve F2100Wss to match ALMA resolution, downsample both maps to the resolution of the ALMA beam, and then measure the median F2100Wss/ICO(2−1) ratio in each environment. We note that we fail to reliably detect some gas-poor bulges and faint disks in ICO(2−1), and hence in ΣMol, despite having full-galaxy ALMA coverage, and exclude these low-confidence ΣMol regions from Figures 12 and 13. In addition, while the low resolution of Herschel means we cannot distinguish diffuse emission from overall emission for measuring colors, using the higher  resolution F2100Wss/ICO(2−1) allows us to separate diffuse emission (as in Section 2.5.3).
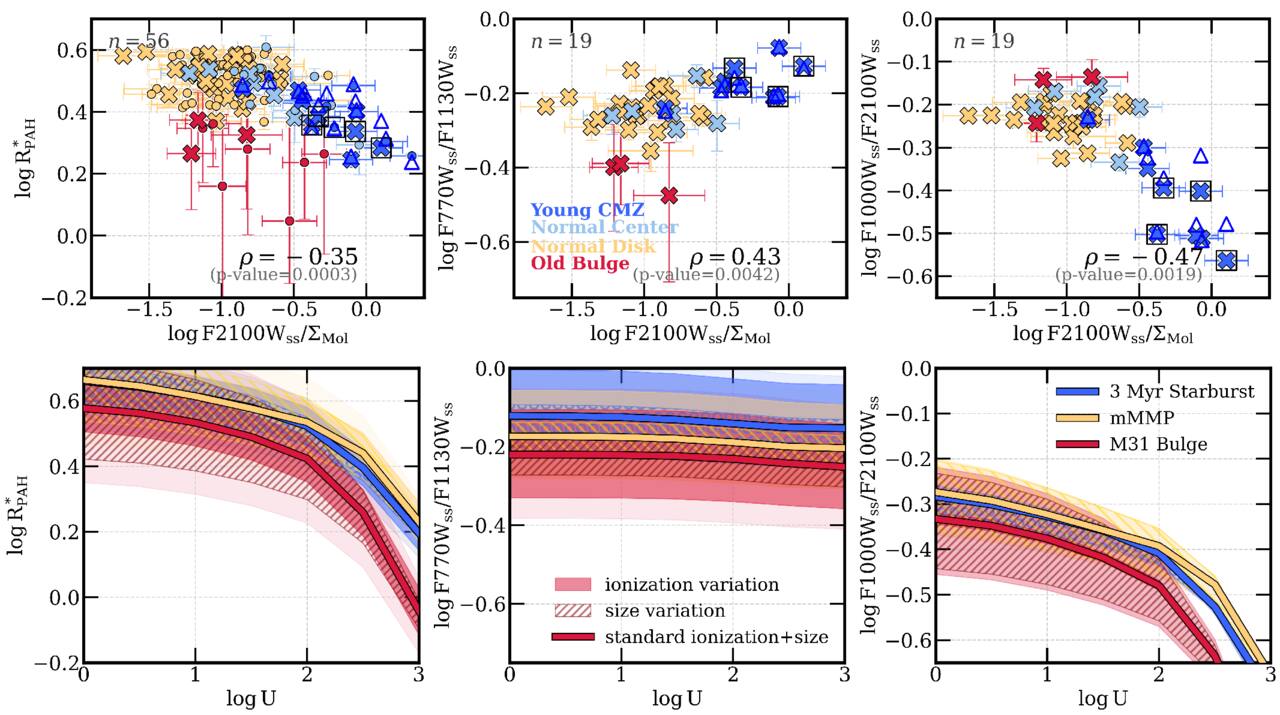
Figure 13. Top:  , F770Wss/F1130Wss, and F1000Wss/F2100Wss as a function of F2100Wss/ΣMol, which correlates with Tdust (and U). Points colored as in previous figures. Bottom: predicted variation in
  , F770Wss/F1130Wss, and F1000Wss/F2100Wss with radiation intensity
  for three different radiation hardness models from D21—a 3 Myr old starburst (blue), mMMP or Milky Way average (yellow), and the stellar bulge of M31 (red). At each
  , we show the standard value (standard ionization and size; solid lines), maximum variation possible due to PAH ionization at standard grain size (hatches), maximum variation possible due to grain sizes at standard ionization (darker shading), and finally the maximum range of values possible at fixed U from changing both size and ionization in the models (light shading).
Download figure:
Standard image High-resolution imageThe correlation between F2100Wss/ICO(2−1) and far-IR colors is weak (ρ ≈ 0.25–0.4). However, much of the scatter appears to be driven by variations in the CO-to-H2 conversion factor, αCO, especially the contrast between dense, star-forming centers and more diffuse disks. In the second row of Figure 12, we use  maps from J. Sun et al. (2025) to translate ICO(2−1) into molecular gas surface density, Σmol. These maps are available for 57 of our galaxies, and use the E. Schinnerer & A. K. Leroy (2024) prescription for estimating
  , accounting for variations in excitation, emissivity, and metallicity.
The correlation between all three far-IR colors and F2100Wss/ΣMol appears much stronger than with F2100Wss/ICO(2−1) (ρ ≈ 73). The strong correlation supports the use of F2100Wss/ΣMol as a U indicator. The improvement with better αCO treatment is also an indirect validation of the αCO maps we use. Finally, we check that the use of F2100Wss/ΣMol as an indicator of U marks an improvement over simply using MUSE ΣSFR (which correlates strongly with F2100W, as shown in Figure 2).
We thus interpret the relative changes in F2100Wss/ΣMol as relative changes in U. Then, from Figure 13, in the diffuse ISM of CMZs, U appears higher than that in most disks. Despite low sSFR, many old stellar bulges also have high U. This likely reflects the high intensity of old starlight, e.g., as seen in the bulge of M31 (B. Groves et al. 2012). Finally, most normal star-forming disks show low U.
At fixed PAH abundance and high U, the apparent  depends on U because U affects the dust continuum emission at 7.7 and 21 μm differently. In Figure 13, we show how our measured
  , F770Wss/F1130Wss, and F1000Wss/F2100Wss vary with F2100Wss/ΣMol, our rough indicator of U, as well as the expected variation in the same colors with varying U for three D21 radiation spectrum models. Comparing the observed trends with F2100Wss/ΣMol and the model-predicted trends with U, we confirm that the low
  measured in CMZs is consistent with high local U, where F2100Wss rises as a function of U, rather than an actual change in PAH mass fraction. The bulges show abnormally low
  for moderate to low (similar to disks) F2100Wss/ΣMol, suggesting that the low
  in bulges is not due to high U. This interpretation is further supported by the similarity between the trend in F1000Wss/F2100Wss we measure across environments and the model curves for varying U. F1000Wss/F2100Wss shows a similar trend to
  , with a clear contrast between disks/bulges and CMZs—CMZs show 0.2–0.4 dex lower F1000Wss/F2100Wss than all other environments. Hence, the variation in F1000Wss/F2100Wss is likely also due to increasing U in CMZs.
Although changes in  and F1000Wss/F2100Wss in CMZs are thus likely, the correlation between F770Wss/F1130Wss and F2100Wss/ΣMol is likely not due to changes in U. As shown in Figure 13, the D21 models predict that F770Wss/F1130Wss is expected to remain relatively unchanged with U, and primarily encodes variation in PAH ionization, size, and radiation hardness. Indeed, most of the variation in F770Wss/F1130Wss at fixed U in the models reflects changes in ionization. This indicates that diffuse regions in the CMZs may host more ionized, and/or smaller PAHs, and/or harder radiation fields (high F770Wss/F1130Wss), and bulges likely host larger, and/or less ionized PAHs, and/or softer radiation fields (low F770Wss/F1130Wss). However, changing radiation field hardness and/or PAH size alone cannot explain the extent of the F770Wss/F1130Wss change we measure across environments (spanning roughly 0.5 dex). We further investigate the degeneracies between PAH properties (ionization, size) and radiation hardness in Section 4.4.
4.4. PAH Property Variation or Changing Radiation Hardness in Bulges?
In quiescent bulges and star formation deserts, changes in U are not enough to explain observed colors. The bulges show unexpectedly low F770Wss despite low-to-moderate U, and normal F1000Wss/F2100Wss. The low F770Wss despite typical F1000Wss and F2100Wss in bulges can be due to three physical reasons:
- 1.Shape of the radiation field spectrum. PAHs may be illuminated by softer radiation fields in bulges due to the high density of old stars but little to no ongoing star formation. Soft (FUV photon-poor) radiation fields are expected to suppress short-λ PAH emission (e.g., D21).
- 2.PAH charge. F770Wss primarily traces emission from the 7.7 μm PAH feature from more ionized PAHs. The presence of more neutral PAHs thus might explain reduced F770Wss/F1130Wss ratios in bulges.
- 3.PAH size. The presence of larger grains41 can suppress the 7.7 μm PAH feature relative to 11.3 μm.
To break this degeneracy between softer radiation, lower PAH ionization, and larger PAH size, we include NIRCam F335M emission available for the 19 Cycle 1 galaxies. We use maps of F335MPAH from Koziol et al. (submitted), which isolate PAH emission from the F335M filter (including aliphatic emission) using a linear combination of the flanking F300M and F360M NIRCam filters to characterize and subtract the relevant stellar continuum, after correcting for any PAH contamination in F360M. Both IR spectroscopy and imaging of metal-rich ISM regions (comparable to our sample) typically exhibit weaker 3.3 μm PAH emission compared to the longer-wavelength PAH features at 7.7 and 11.3 μm (e.g., D. A. Dale et al. 2023; A. Maragkoudakis et al. 2026) We thus restrict any comparison that includes F335MPAH (Figure 14, 15) to the subset of pixels within each environment where the fainter F335MPAH is detected at matched  angular resolution. In lower intensity environments, particularly in bulges and disks, we check that F335MPAH is detected in at least 25% of the pixels in each environment. Hence, Figures 14 and 15 only include the amount of flux in matched pixels where we reliably detect F335MPAH in addition to the previous MIRI filters. We note that realistic variations in AV across environments can attenuate at most ∼10% and on median <4% of F335M emission, and do not impact our analysis (see Section 4.5).
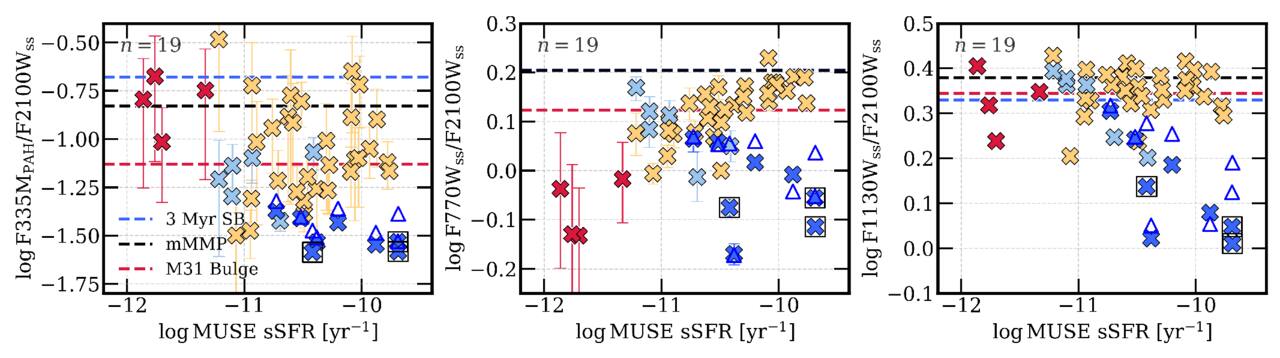
Figure 14. PAH-to-continuum ratios for three PAH-dominated filters for the 19 galaxies from Cycle 1, points colored by environment as in previous figures: F335MPAH (from H. Koziol et al. submitted), F770Wss, and F1130Wss relative to F2100Wss. Dashed lines indicate the predicted variation in respective PAH-to-continuum ratios due to radiation hardness at fixed  and standard grain size and ionization from D21.
Download figure:
Standard image High-resolution image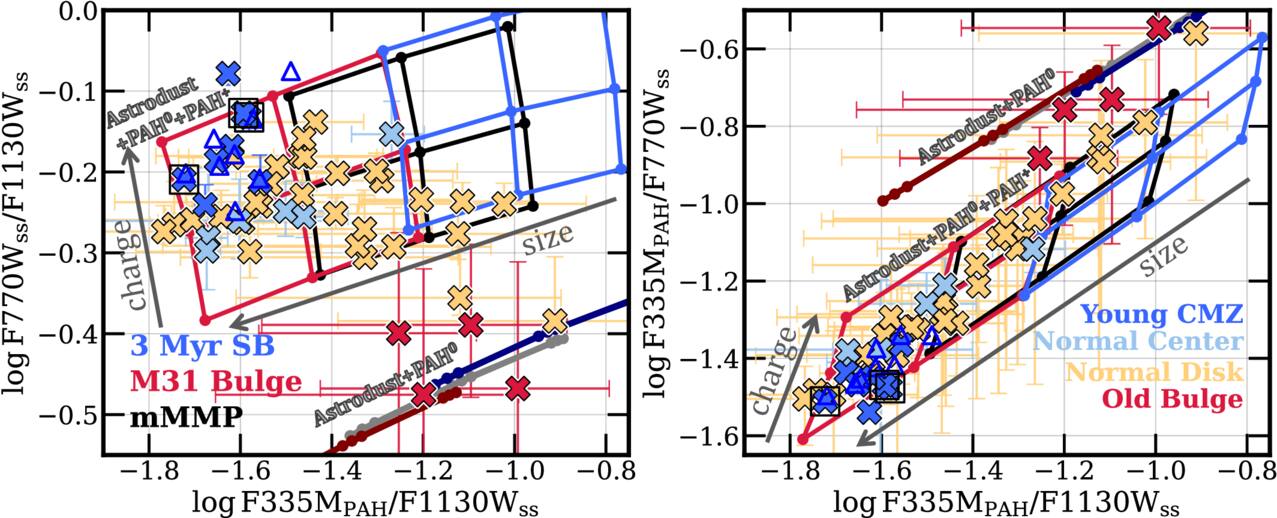
Figure 15. Mid-IR and near-IR PAH color–color variation by environment. F770Wss/F1130Wss and F335MPAH/F770Wss (small, neutral PAH-to-small, ionized PAH) ratios vs. F335MPAH/F1130Wss (small, neutral PAH-to-larger, neutral PAH) ratios. D21 dust model grids at  included for comparison, with direction of variation due to changing PAH charge and size indicated. No significant variation in dust grids is seen due to varying
  . The darker lines show the limiting case of 100% neutral PAHs (PAH0) at
  for the three radiation hardness models.
Download figure:
Standard image High-resolution imageWith the inclusion of F335MPAH we now have access to three PAH-tracing filters—F335MPAH (from small, neutral PAHs), F770Wss (from smaller, ionized PAHs), and F1130Wss (from larger, neutral PAHs). In Figure 14, we present the PAH-to-continuum ratios split by environment for the 19 Cycle 1 galaxies for all three PAH filters, with the predicted filter ratios from D21 for three radiation hardness models at  included for comparison (dashed horizontal lines). Once again, all three PAH-to-continuum ratios are low in the CMZs, consistent with higher U and enhanced F2100Wss. However, in the bulges, only F770Wss/F2100Wss is low, while both F335MPAH/F2100Wss and F1130Wss/F2100Wss remain high, matching the typical values for normal disks. This rules out softer radiation fields and larger sizes, both of which should also suppress F335MPAH/F2100Wss. This indicates that the low F770Wss in bulges and star formation deserts is primarily due to PAHs being less ionized. Figure 14 also shows how F770Wss/F2100Wss is the PAH-to-continuum ratio that correlates most strongly with local sSFR outside of CMZs, and F1130Wss/F2100Wss remains roughly constant across bulges and disks.
Finally, in Figure 15 we compare all environments for the 19 galaxies in PAH color–color space, with the corresponding D21 dust grids (see Section 4.2) at  for comparison. Contrasting F770Wss/F1130Wss, F335MPAH/F1130Wss, and F335MPAH/F770Wss shows that most “normal” galaxy disks and centers scatter within the M31 bulge part of the D21 grids, while CMZs generally show higher F770Wss/F1130Wss, but still remain within the M31 bulge corner of the grids. Since the D21 models do not include differential attenuation, we speculate that if there is silicate extinction in CMZs, it may move CMZs relative to disks in this direction by primarily attenuating 11.3 μm. CMZs also have lower F335MPAH/F770Wss and F335MPAH/F1130Wss than most “normal” star-forming disks, which may indicate the presence of more ionized, larger PAHs in galaxy centers.
Figure 15 once again highlights how quiescent bulges and star formation deserts are unique environments that show anomalously low F770Wss, and lie completely outside of the standard parameter space for PAH charge and size variation in the D21 models. Combined with F335MPAH/F1130Wss values (primarily tracing size variation, both from neutral PAHs) in bulges being comparable to many normal disks, this again reinforces the interpretation that the PAH population in bulges is likely more neutral. We note that the colors we measure in bulges are bracketed by the limiting case of the D21 models with 100% neutral PAHs (Astrodust + PAH0; maroon/gray/navy lines in Figure 15). Although a 100% neutral PAH population in star formation deserts is physically unlikely, the better agreement between observed colors in bulges and D21 predictions for neutral PAHs is again consistent with the interpretation that PAHs are likely more neutral in bulges.
Quiescent bulges in our otherwise “normal” star-forming galaxies may present similar ISM conditions as quiescent ETGs and elliptical galaxies, where lower (>500 pc) resolution spectroscopy surveys suggest changes in PAH properties in such extremely FUV-poor environments (e.g., R. Rampazzo et al. 2013). Although softer radiation fields can suppress short-λ PAH features including 7.7 μm, in the M31 bulge, the photometric 7.7 μm PAH emission is weaker but still detected (B. Groves et al. 2012; B. T. Draine et al. 2014, D21). However, the current range of PAH charge and side distributions included in the D21 model for any radiation spectrum or intensity fails to reproduce the extremely low F770Wss we observe in quiescent bulges in PHANGS galaxies, where much larger variations in PAH ionization may explain the suppressed F770Wss but normal F1130Wss. We note that in many ETGs, while the 7.7 μm PAH feature is virtually undetected, the 11.3 μm PAH feature is detected (e.g., H. Kaneda et al. 2005; P. Panuzzo et al. 2011; R. Rampazzo et al. 2013, 2014). We speculate that similarly, in extremely low sSFR bulges, the 7.7 μm PAH feature may be severely suppressed, arguably due to significantly lower PAH charges than what the D21 grids currently allow for, in order to produce the extremely low F770Wss we observe in low sSFR regions.
4.5. Other Nondominant Terms
Moderately high AV in CMZs. In addition to high U, CMZs and starburst centers are high-density environments where the total gas and dust column density is expected to be higher than in normal disks. In Figure 16, we show that the highest sSFR galaxy centers also host high optical attenuation AV. We measure the  -scale AV using the Hα/Hβ Balmer decrement and the J. A. Cardelli et al. (1989) extinction curve to estimate E(B − V), and then assume a Milky Way average reddening RV = 3.1. In Figure 16, we present median AV in environments. Since the medians are measured only at regions where Hβ is reliably detected, allowing for the Balmer decrement measurement, the AV values in Figure 16 mostly trace the extinction toward the locations of H ii regions and their surrounding diffuse ionized gas.
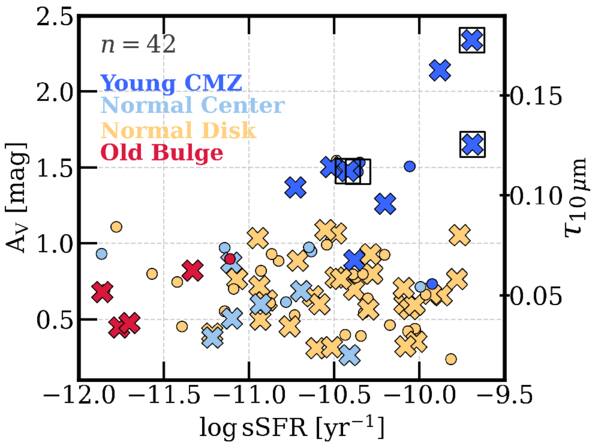
Figure 16. MUSE sSFR vs. median (markers) and 16th–84th percentile scatter (error bars) in Balmer decrement attenuation AV for bulges, centers, and disks in 42 galaxies. Medians and percentiles only measured where both Hα and Hβ are detected within each environment. While most low-to-moderate sSFR environments show low AV ≈ 0.5, CMZs show higher AV. The alternate y-axis shows the translation to τ10 μm, the optical depth at 10 μm due to silicate absorption (using K. D. Gordon et al. 2023), which in PHANGS CMZs results in <1% attenuation.
Download figure:
Standard image High-resolution imageMost highly star-forming galaxy centers show higher attenuation (AV ≈ 1.5–2.5 mag) compared to disks and quiescent bulges (AV ≈ 0.5–1 mag). In high AV environments, higher silicate absorption at 10 μm may suppress F1000Wss intensities. In addition, due to the higher U (Section 4.3), CMZs also show elevated F2100Wss. So, both high U and higher AV can contribute to low F1000Wss/F2100Wss in centers (see, e.g., Figure 9). Note that the optical depth τλ = Aλ/1.086, and the observed intensity  . As a result, at AV = 1, roughly 7% and 3.5% of the F1000W and F2100W emission, respectively, is attenuated, and at AV = 2, roughly 14% and 7% of the emission is attenuated (using extinction curves from K. D. Gordon et al. 2023).42
Even at the shortest wavelength relevant to our analysis (3.36 μm), roughly 4.5% and 9% of the F335M filter emission is attenuated at AV = 1 and 2, respectively.
. As a result, at AV = 1, roughly 7% and 3.5% of the F1000W and F2100W emission, respectively, is attenuated, and at AV = 2, roughly 14% and 7% of the emission is attenuated (using extinction curves from K. D. Gordon et al. 2023).42
Even at the shortest wavelength relevant to our analysis (3.36 μm), roughly 4.5% and 9% of the F335M filter emission is attenuated at AV = 1 and 2, respectively.
The expected decrease due to attenuation is small (≲10%) compared to the 0.4 dex decrease in F1000Wss/F2100Wss we observe in CMZs (e.g., Figure 13). Hence, although AV is higher in highly star-forming centers, AV is not high enough in PHANGS galaxy centers for silicate absorption to significantly attenuate F1000Wss. This is analogous to results from Spitzer spectroscopy for SINGS galaxies, where AV is rarely high enough (AV ≳ 5 mag) for 9.7 μm silicate absorption to matter (J. D. T. Smith et al. 2007). The consistently low F1000Wss/F2100Wss values in highly star-forming centers of otherwise normal PHANGS galaxies are thus likely due to increasing F2100Wss intensities due to higher average U (Section 4.3). The alternate y-axis translates V-band attenuation to the corresponding optical depth at 10 μm due to silicate absorption, assuming the empirical K. D. Gordon et al. (2023) extinction curve at a Milky Way RV = 3.1. For all measured AV even in CMZs (AV ≈ 1.5–2.5 mag), the relevant optical depth at 10 μm is ∼0.1. So in the CMZs with the highest AV, at most ∼15% of the F1000W emission is likely attenuated, which is a negligible effect for our sample.
AGN. The presence of strong AGN can also change mid-IR colors due to the changing radiation field and high attenuation (e.g., J. D. T. Smith et al. 2007; L. Zhang & L. C. Ho 2023; G. P. Donnelly et al. 2024). This can include strong continuum emission due to stronger radiation fields, weak PAH emission due to the photodestruction of PAHs, or strong 11.2 and 17 μm indicating larger PAH sizes closer to the locations of AGN. While several galaxy centers with AGN are removed from our sample due to saturation and strong PSF artifacts in F2100W (see Section 2.5.3), five galaxy centers with AGN are included in our analysis—NGC 1097, NGC 1365, NGC 1672, NGC 4303, and NGC 4826 (M.-P. Véron-Cetty & P. Véron 2010). These AGN show little to no visible signs of mid-IR color variations due to weak AGN, while most strong AGN show strong diffraction artifacts in F2100W, are saturated in galaxy centers, and hence removed from our analysis (see Section 2.5.3). The remaining five AGN galaxy centers show ≲0.1 dex lower F770Wss/F2100Wss (Figure 10), somewhat higher F770Wss/F1130Wss (Figure 15), and comparable F335MPAH/F1130Wss. So in the handful of AGN in our final sample of galaxy centers, we do not recover a statistically significantly change in mid-IR colors due to the presence of AGN.
5. Summary
Combining high-resolution JWST-MIRI and NIRCam imaging data for 71 nearby star-forming galaxies, we measure the variation in mid-IR colors and observed PAH fraction  (Equation (1)) in the diffuse ISM as a function of Galactocentric radius and morphological environment (disks, centers, bars; Section 2.3). We compare these with complementary ionized gas and SFR information from VLT/MUSE, molecular gas information from ALMA, and Herschel far-IR dust colors to investigate how mid-IR colors and PAH band ratios vary as a function of radiation field intensity, radiation field hardness, PAH charge, and PAH size, and optical attenuation across galaxies. We find stark differences in measured mid-IR colors in the diffuse ISM (i.e., regions not dominated by nebular emission) when contrasting “normal” star-forming disks and centers with highly star-forming CMZs, and quiescent old stellar bulges.
- 1.Mid-IR colors and the observed PAH fraction remain fairly constant across diffuse parts of “normal” star-forming disks, with some variation due to global sSFR (Section 3.2, Figure 8, Tables 1, 2). The typical diffuse across the disks of 71 nearby galaxies is 0.52, with 0.11 dex standard deviation from galaxy to galaxy.
- 2.The centers (Rgal < ℓ*, the exponential scale length of the stellar disk) of massive (M* ≳ 1010.5 M⊙) star-forming galaxies show ∼0.2–0.4 dex lower relative to disks (Figure 7, Table 1). We identify two distinct environments in galaxy centers where is suppressed—highly star-forming CMZs, and quiescent bulges or star formation deserts (Section 3.3).
- 3.
- 4.We show the efficacy of using F2100Wss/ΣMol as a tracer of average radiation field intensity U in environments, and validate this approach against Herschel far-IR dust colors and MUSE ΣSFR (Figure 12).
- 5.Diffuse ISM sight lines of quiescent bulges and star formation deserts show low relative to “normal” disks (Section 3.3.2), with median with ∼0.15 dex scatter (Table 1). For 4/13 bulges, we confirm that F770Wss is the only PAH-correlated filter that is anomalously low in bulges, while other PAH filters (F335MPAH and F1130Wss; Figure 14), and the continuum (F1000Wss/F2100Wss) appear similar to “normal” disks (Table 2, Figure 15). We speculate that bulges likely host diffuse ISM conditions similar to ETGs and elliptical galaxies, and that the extremely low F770Wss in bulges (0.1–0.25 dex lower than disks) is likely due to an underlying PAH population that is predominantly neutral (Section 4.4). The extremely low F770Wss/F1130Wss and high F335MPAH/F770Wss colors measured in bulges are beyond what current dust models can reproduce (Figure 15; D21).
- 6.






Acknowledgments
We thank the anonymous referee for their constructive comments.
This work has been carried out as part of the PHANGS Collaboration. This work is based on observations made with the NASA/ESA/CSA JWST. The data were obtained from the Mikulski Archive for Space Telescopes at the Space Telescope Science Institute, which is operated by the Association of Universities for Research in Astronomy, Inc., under NASA contract NAS 5-03127 for JWST. These observations are associated with GO programs #2107, #3177, and #3707. Support for programs #2107, #3177, and #3707 was provided by NASA through a grant from the Space Telescope Science Institute, which is operated by the Association of Universities for Research in Astronomy, Inc., under NASA contract NAS 5-03127. The specific JWST observations analyzed can be accessed via DOI: 10.17909/ew88-jt15 and 10.17909/yz9g-pd22. The PHANGS-MUSE LP data can be accessed at ESO DOI: 10.18727/archive/47.
This work is also based on observations collected at the European Southern Observatory under ESO programs 094.C-0623 (PI: Kreckel), 095.C-0473, 098.C-0484 (PI: Blanc), 1100.B-0651 (PHANGS-MUSE; PI: Schinnerer), as well as 094.B-0321 (MAGNUM; PI: Marconi), 099.B-0242, 0100.B-0116, 098.B-0551 (MAD; PI: Carollo) and 097.B-0640 (TIMER; PI: Gadotti).
This paper uses the following ALMA data, which have been processed as part of the PHANGS–ALMA survey: ADS/JAO.ALMA#2012.1.00650.S, ADS/JAO.ALMA#2013.1.00803.S, ADS/JAO.ALMA#2013.1.01161.S, ADS/JAO.ALMA#2015.1.00121.S, ADS/JAO.ALMA#2015.1.00782.S, ADS/JAO.ALMA#2015.1.00925.S, ADS/JAO.ALMA#2015.1.00956.S, ADS/JAO.ALMA#2016.1.00386.S, ADS/JAO.ALMA#2017.1.00392.S, ADS/JAO.ALMA#2017.1.00766.S, ADS/JAO.ALMA#2017.1.00886.L, ADS/JAO.ALMA#2018.1.01321.S, ADS/JAO.ALMA#2018.1.01651.S, ADS/JAO.ALMA#2018.A.00062.S, ADS/JAO.ALMA#2019.1.01235.S, ADS/JAO.ALMA#2019.2.00129.S. ALMA is a partnership of ESO (representing its member states), NSF (USA) and NINS (Japan), together with NRC (Canada), NSC and ASIAA (Taiwan), and KASI (Republic of Korea), in cooperation with the Republic of Chile. The Joint ALMA Observatory is operated by ESO, AUI/NRAO, and NAOJ. The National Radio Astronomy Observatory is a facility of the National Science Foundation operated under cooperative agreement by Associated Universities, Inc.
D.P. is supported by the NSF GRFP.
A.K.L. and D.P. gratefully acknowledge support from NSF AST AWD 2205628, JWST-GO-02107.009-A, and JWST-GO-03707.001-A. A.K.L. also gratefully acknowledges support by a Humboldt Research Award.
K.S., H.K, and M.P. acknowledge funding support from JWST-GO-2107.006-A and JWST-GO-3707.005-A.
T.G.W. gratefully acknowledges support from the UK ALMA Regional Centre (ARC) Node, which is supported by the Science and Technology Facilities Council grant number ST/Y004108/1.
R.S.K. acknowledges financial support from the ERC via Synergy Grant “ECOGAL” (project ID 855130) and from the German Excellence Strategy via the Heidelberg Cluster “STRUCTURES” (EXC 2181-390900948). In addition, R.S.K. is grateful for funding from the German Ministry for Economic Affairs and Climate Action in project “MAINN” (funding ID 50OO2206), and from DFG and ANR for project “STARCLUSTERS” (funding ID KL 1358/22-1).
J.G.L. acknowledges funding from the DLR (German Aerospace Agency) via grant 50 OR2401.
M.B. acknowledges support by the ANID BASAL project FB210003. This work was supported by the French government through the France 2030 investment plan managed by the National Research Agency (ANR), as part of the Initiative of Excellence of Université Côte d’Azur under reference No. ANR-15-IDEX-01. This research was funded, in whole or in part, by the French National Research Agency (ANR), grant ANR-24-CE92-0044 (project STARCLUSTERS).
Facilities: JWST - James Webb Space Telescope, VLT:Yepun - Very Large Telescope (Yepun), ALMA - Atacama Large Millimeter Array, Herschel - European Space Agency's Herschel space observatory, WISE - Wide-field Infrared Survey Explorer.
Software: astropy (Astropy Collaboration et al. 2013, 2018).
Appendix
This appendix presents a machine-readable table that contains our measurements. Table 3 gives the names, units, and a short description of each column in the table.
Table 3. Columns in the Value-added Table
| Column | Unit | Description |
|---|---|---|
| galaxy | ⋯ | Galaxy name |
| morphological_environment | ⋯ | Morphological environment following M. Querejeta et al. (2021, Section 2.3) |
| morph_SF_environment | ⋯ | Morphological+SF environment classification (Section 2.3) |
| logF300M |

| Median F300M intensity (Section 2.1.2) |
| logF2100W |

| Median F2100W intensity (Section 2.1.2) |
| logF2100Wss |

| Median F2100Wss intensity (Section 2.1.2) |
| logF770Wss |

| Median F770Wss intensity (Section 2.1.2) |
| logF1000Wss |

| Median F1000Wss intensity (Section 2.1.2) |
| logF1130Wss |

| Median F1130Wss intensity (Section 2.1.2) |
| MUSE_logsSFR |

| Environment-integrated sSFR (Section 2.2) |
| MUSE_logSigmaSFR |

| Environment-integrated ΣSFR (Section 2.2) |
| MUSE_Av | mag | Balmer decrement V-band attenuation (Section 2.2) |
| logRPAH*ss | ⋯ | Median  (Section 2.1.3) (Section 2.1.3) |
| logF2100W/F300M | ⋯ | Median F2100W/F300M (Section 2.4) |
| logF770Wss/F2100Wss | ⋯ | Median F770Wss/F2100Wss (Section 2.5.2) |
| logF770Wss/F1130Wss | ⋯ | Median F770Wss/F1130Wss (Section 2.5.2) |
| logF1000Wss/F2100Wss | ⋯ | Median F1000Wss/F2100Wss (Section 2.5.2) |
| logPACS100/160_conv160 | ⋯ | Median 100 μm/160 μm (Section 4.3) |
| logPACS70/100_conv100 | ⋯ | Median 70 μm/100 μm (Section 4.3) |
| logPACS70/160_conv160 | ⋯ | Median 70 μm/160 μm (Section 4.3) |
| logF2100Wss/ICO21 |

| Median F2100Wss/ICO(2−1) (Section 4.3) |
| logF2100Wss/SigmaMol |

| Median F2100Wss/ΣMol (Section 4.3) |
| logF335MPAH/F770Wss | ⋯ | Median F335MPAH/F770Wss (Section 4.4) |
| logF335MPAH/F1130Wss | ⋯ | Median F335MPAH/F1130Wss (Section 4.4) |
Note. This table introduces the environment-integrated measurements made available in machine-readable form, with the basic environment properties needed to reproduce most figures.
Only a portion of this table is shown here to demonstrate its form and content. A machine-readable version of the full table is available.
Download table as: Machine-readable (MRT)Typeset image
Footnotes
- 28
- 29
Three galaxies from the Cycle 2 Treasury are excluded due to issues with establishing a robust background level for the images.
- 30
For more details on updates to pjpipe, please refer to https://pjpipe.readthedocs.io/en/latest/.
- 31
- 32
The diffuse
measured using Equation (1) is consistent with the slope of the best-fit line to the F770Wss − F2100Wss relation. - 33
- 34
- 35
We check for mid-IR color variations between arms and inter-arms and do not see a noticeable difference, and hence include both within a common “disk” environment.
- 36
In our sample, high SFR galaxy centers are rich in molecular gas (see D. R. Gleis et al. 2026).
- 37
- 38
Using either F2100W or F2100Wss yields similar correlations.
- 39
We note that the mode is consistent with the median (within 5%) due to the high angular resolution of MIRI and the large number of independent resolution elements thus included in each azimuthal bin.
- 40
- 41
In addition to PAH size, it is important to note that the 7.7/11.3 μm ratio is also hydrogenation dependent (see B. T. Draine & A. Li 2007, and references therein). For example, in regions where the PAHs have been dehydrogenated, 3.29 and 7.7 μm emission can be suppressed. However, to first order, we expect the number of H atoms per C atom to depend on the size of the PAH, with higher H/C in smaller PAHs.
- 42
